32

10
11
11111125 1111114 1111116
MICROCOPY RESOLUTION TEST CHART N~110NAl BUREAU Of STANDARDS-1963-A
10
11
11111125 11111 I~~ 1111116
MICROCOPY RESOLUTlOI~ TEST CHART NATIONAL BUREAU Of SlIIMDARDS-1963-A
~~~ n
k ~I
OUTPUT PER MAN-HOUR
IN DISTRIBUTING FOODS OF FARM ORIGIN
lNITED STATES DEPARTMENT Of AGRICULTURE MARKETING ECONOMICS DIVISION ECONOMIC RESEARCH SERVICE TECHNICAL BULLETIN NO 13)5
Preface
ValjOllS legislative itnd economic gtoups concernecl with agricultural policy hwe long been interested in the relation between dmrges for mtrketing faml f()(is and payrnents to the falffiCr-plOducer for his produets A marked decline in these payments to farmers relative to consumer expenditllles fo farm-originated foods sinee Volld Val II has focused att(gtl1tion on the Iced fQr additional infonnation on past and future trends in the fa(tOl~ nderlying ehanges in madmting costs
The productivity estimates in this report wcee clev(loped as part of a larger ine4itigtt ion by the E(OllOllli( Hesearch ServiCe of the US Department of Agriculture of 11(tors alleeting the demand the supply and the productiily of fnnn food muketing setTlces A llHtjO obiedi(~ of the inYlBtigation is to dlwllop long-mnge projecshytions of the farm rOO(] nmlilting bill (total (hug(s for tmnsportinr proceising wholelILling and n~tailing fLlm foods) which will suppleshyment long-range plojeNions of the demttnd for and output of flmn food produets Insirht into prociuetivity in food distribution comshypared with the dcmand fOt distlibution SC1Ticcs and with ploduetirity in farm ploduetioll will help explain the continuing deeline of the flrm share of consumer Cxlendit uns for foods
Distribution (Oss for t 1C falm-orig-inated food products included in the study reported hen wtre roughly onc-thinl of the ciilian exshypenditllr(s for farm foods This [wI(enage has remained fairly eonshystant dUIin cT the three decades cocrpd in thIS report
Helated f)epart ment of Agri(ulturp reports on output and uti1izashyion of reSOlllCes in marketing of farm food products are 01ltput of F(lCt01if8 Proc(8sinl F(Jrm Food Products in the UnitetilCtates 1909shy68 Teehnietl Bulletin 1~23 OlltPllt P(J Jan-Hour in Fact01ie8 Pro((8sing fann Food PlOdllct8 Teehniea1 Bulletin 1243 and Deshymand 01 Mrlnllactuled Foods 11nnuacfu)(rs 3e1Iice8 and Farrn Plodllcts in Food iIf(lllnjartllling Teehni(al Bulletin 1317 A fourth report on thehrm f(xxl marketing bill and itB (omponents is in preparation
Aebllowled cTment is made to 1etome A Mltrk Bureau of Labor sttttisties US Department of Labor for review of ted1l1iCltl aspectfl of this report
III
Contents Page
Summary and conclllsiors__ _ _ _ _ _____ ___ ____ ___ ___________ v
Persolls engaged in food distribution ______________________ - 5 Ontput per mall-hour _____ _ _ _ _____ _____________ - - _- 7
Lillruture cited __ _____________________________ ------ 15
Introduction ______________ - __ ___________________________ 1 Coverage___________________________________________ 2
Output ill food di3triblltion_______________________________ 3
Factors affecting output per man-hour ___ _____ ___ _______ 11 Comparison with other sectors ____ -_______________________ 13
Appendix_______________ ________________________ _______ 16 1Icllsuring net Olltptlt ill food distributioll______________ 16N1all-hours _________________ --______________________ 19 EmploymellL_______ _____ ___ _____ ___________ ---- 20
April 1965 Average hours ____ _____ _ ____ ______ ____ __ ___ __ 22
iv
Summary and Conclusions
Output per man-hour employed in distributing foods of domestic farm origin increased at an a veruge rate of 25 percent per year from 1029 to 1958 For the wholesaling and retailing component the inshy(rease was significantly greater an average of 28 percent per year The difference was due to fL lower increase in output per man-hour in the other component or food distribution away-from-home eating (oupled with a larger total increase in output particularly during World -War II The rates of growth in outPllt per man-hour for food distribution lLS a whole and for the wholesale-retail eomponent were about the same in the postwar c1erade or the study 1048-58 as in the Enthe study period 1929-58 (Food clistribution as defined in this report includes wholesaling retailing ltnd away-from-home eating it exdudEs for-hire tmnsportation and assembling of farm-food Pt(xlucts )
Gains in output per person engaged in food distribution -ere mueh smaJIEr th1ll gains in output per man-hour This resulted from sharp and continued declines in average weekly hours per person which were down about one-fourth over the three deeades Output per pershyson in food distribution grew at an average rate or 15 percent per year from 1929 to 1958 The average rate in the wholesale-retail comshyponent was 18 percent Again the postwar rates in food distribution as a whole and in the wholesale-retail component were about the same (lS the rates ror the three deeades as a whole
Output as llsed in this report is measured net of foods entering the distribution sector it inc-Iudes only goods and services added in disshytr-ibution Total net ouput in food distribution grew at a substantially greater ann ual rate (29 percent) tlHtn output pel man-hour from 192l to 1058 (25 percent) As a result labor requirements rose over the three decades This increased requirement occurred in away-fromshyhome entin places The average yearly rate of growth of net output in food yholesfLling and retailing (25 percent) was significantly smaHer than the rate of Orowth (28 percent) in output per manshyhour in this component During the postwar decade 1948-58 total net output in food distribution (including eating places) rose less than output per man-hour and man-hour requiremeuts consequently declined
The most important factor in the rise in labor productivity was the shift from clerk to selfmiddotservice stores Thus to some extent the rise in labor productivity reflects a substitution of shoppers Jabor for that of hired workers the man-hour inputs that can be counted The shift to self-service stores was aceompanied by It phenomenal increase in the average size of food stores Thus economjes of scale apparently tlso contributed to the rise in Jabor productivity Substitution of
v
capital for labor may have also been a factor however data on capital in food distribution are so sparse that we cannot even surmise whether the quantity of fixed and working capital per man-hour increased decreased 01 remained the same durmg the period studied
In the period 1929 to 1958 the estImated yearly rate of growth in output per man-hour for food distribution was 25 percent compared with 21 percent for the total private nonfarm sector of the economy The difference however is overstated Because of limitntions in the data the estimated rate for food distribution tends to be on the high side vhereas the estimated rate flr the priVltte nonfarm sector tends to be on the low side In the wholesale-retail component of food clisshytribution where output per man-hour increased more rapidly than in food distribution as a whole the rate was significantly larger than in the total privllte sector However both in food distribution inchldin~ eating places and in the wholesale-retail component alone output per man-hour increased at a substantially lower rate than the 36 percent rate of increase in fltrming
The rate of increase in output petmiddot man-hour during the postwar decade studied 1948-58 was about the same in food distribution inshycluding eating phces as in the total private nonfarm sector although the rate of increase in food wholesaling and retailing was significantly larger Nevertheless output per man-hour in farming increased twice as fast during this period as output per man-hour in foud wholesaling and retailing The much greater rate in fRrm production was clue to a large substitution of capital for labor in that lector Even if we (ould btke account of changes of cllpital stock in food distribution llnd in the wholesale-retail component it is doubtful that the postwar growth rates in totRl factor productivity (net output per combined unit of labor and capital) would be as large as the rate in farming
vi
OUTPUT PER MAN-HOUR IN DISTRIBUTING FOODS OF FARM ORIGIN
by WIrLrA~ H VALDOIIF and HAZEN F GAlli Agriculturel Economists
1l(1JrlceUng Economiev Diri~middotion Economic ReselLreh Service
Introduction
Civilian consumers in the United States spent $664 billion for domestic fann food products in 11)G3 $45 billion wnt to marketing agencies for manufacturing and distributing the Iood and $214 billion went to farmer producers for their products (93)1 Since at least 11)29 the earliest year for which eomparable data ara available the bill for manufacturing and distributing farm foods has been inshycreasing in relation to the payments received by farmers
This report is concerned with the distribution of foods oJ farm origin The bill for distributing these foods has accounted for a fairly constant proportion-roughly 40 rmrcent-or totnl civilian spending for farm foods since 1929 In 1929 the farm value accounted for a somewhat larger percentage than the distribution biJl but in 1963 the distribution bill a(counteo for the larger percentage
The most important factor underlyin~ the above trends is the change in the efficiency of resources used 111 the farm and mtrketing sectors Because of data problems the study was limited to construcshytion of an index of output per man-hour which at best is only a partial measure of changes in effieiency This index is affected by substitutions among htbor capital and other factor inputs changes in the quality of factor inputs and changes in efficiency resulting from economies of scale Changes in the intensity of labor effort are also reflected
Despite these limitations an index of output per man-honr is t ueful tool along with others for analyzing developments in labor inputs and labor eosts 1-Vhen consistently defined unit labor costs are equal to average hourly earnings divided by output per man-hour If labor accounts for t large share of combined labor and capital inputs Itnd there has been little or no substitution between capital and labor long-tenn trends in output per man-hour may be reasonnbIe approxishymalions of long-term trends in Jabor-capital productivity During the postWLr period labor costs accounted for about 45 percent of the bill for distributing flLnn food products the remainder included (lLpital costs and costs of packaging advertising tlld other intershymediate goods and 8elrire pUlchaXld by distribution tgencies
l [talk mlllh(l in flllr(ntheses refer to litNllturc cited p 15
1
As far lJS the authors know there have been no previous attempts to mellsuro output per man-hour in food distribution The only comshyprehensive study we know for the United States is the painstaking work by Barger (1) for total distribution2 Considering both the conceltual and statistical problems in measuring output and employshyment m distribution it is not surprising thnt there has been a dearth of such productivity studies
The indexes of output presented in this report measure net output in food distribution They are net of the quantity (and quality) of the farm products used as raw materials in foods i and they are also net of the assembly transportation and processing services added between the farmers sale of the mw materials and the purchase of the foods by wholesalers The output index is intended to measure onZy goods and services added by the food tlistribution sector as deshyfined in this study3 The output indexes are double-deflated series based on estimates of the farm food distribution bill constructed by Gale in his study of the farm food marketing bm and its composhynents4 GuJes series is based largely on data available from the Oensus 0 B1laines8 which was begun in 192gt For that reason our findings are based on data for only 5 census years those from 11)29 to 1958 the latest census year for which data were available at the time the indexes were computed The indexes are based on weights for the given years and reflect changes in the composition of output
The major objectives of the report are to (1) ~ag(l trends from 1929 to 1958 in output per mUl-hour employed in aistributing farmshyoriginated foods for domestic civilian consumption (2) analyze facshytors underlying these trends and (3) compare developments in outshyput per man-hour in food distribution with those in farming and in other sectors of the economy
Coverage
The statistics used in this study conform to the Economic Research Service (ERS) farm food marketing bill concept5 They apply to the distribution of foods originating on US farms and destined for US civilian consumption The time series used to analyze developshyments in food distributions are by agency not by function Thus they
bull There have of course been other attempts to measure productivity in disshytribution Barger gives an excellent review of the literature in this area
bull For a detalled discussion of the sources and methods used in constructing the indexes see the Appendix For a review of measures of output in food distribution see Waldorf William H LABOR PRODUarIVITY IN FOOD wHOLESAUNO AND RElAILING (Unpublished paper prepared September 1004)
bull Report in preparation 6 As defined by the Economic Research Service US Department of Agriculshy
ture the marketing bm is the difference between the total expenditures as civilian consumers for domestic fann food products and the farm value or payshyment that fanners received for the equivalent farm products It is an estimate of the total charges for transporting processing wholesaling and retailing farm foods Food sold 1n the fonn of meals in restaurants and other eating places Ilmi that sol(l at less than retail prices is valued at the point of sale These estimates do not include the value of food products not produced on fanns in thp United States foods consumed on fanns where produced or foods not sold to cl vlllan consumers In this country (2)
2
exclude distribution services provided directly by farmers or by food manufacturers but include processing services performed by food distributors However this does not affect the productivity estimates because the scope of the employment and man-hours data is the same as that of the output data As used in this report food distribution refers to the activities of wholesalers retailers and away-from-home eating places in handling foods of farm origin i it excludes assembling and for-hire tmnsportation of farm food products
Transportation by for-hire carriers is omitted because data on outshyput and employment for the carriers are generally not available for foods separately For example in the case of railroads it generally is not possible to distin)TUish between labor employed in transporting foods and labor employed in transporting nonfolmiddotU commodities Asshysembling of farm products was also excluded because of inadequatedflta
Output in Food Distribution
Net output in food distribution increased about 120 percent from 1929 to 1958 a rate of growth of 29 percent per year (tables 1 and 2 fig 1) The annual rate was highest between 1939 and 1948 and largely though not entirely reflects a phenomenal growth in eating places during the wartime period The growth in the postwar decade 1945-58 was about the same as in the prewar decade 1929-39 Our analysis of the data indicates that the net output series for distribution
~IGURE 1
Food Distribution
GROWTH IN NET OUTPUT OF 1929 -~~------------------r--------
250 ~ Distribution A
225 t Wholesaling200 and retailing
175 1
125 I 100~------~--------~----~--~~
1929 39 48 54 58 RATIO CHART
AYE~ACE AH~UJt RTE OF CRoWrH FITTEo pound(POlEHrILLY BY LEAH SQUREJ~ 6IN(LUOES FOOO 111 OLE $ LING AHD RETAILINe ANt J WAY -FROJltl-HOIltlE E TING pu CES
L-______~l~_middot_)___O__U___gtI P________ Nmiddot G EH 1304-61 f III eto~iOMIC RESfARtH HflvlCE
150
3
probably has tlll upward secular bias Thus the estimated rates of growth may be somewhat overstLtoo6
TABu~ 1-01ttput in dilt~triblttion of farm-originated foods United States selected ye(l7~ Jfm9-58
(1929= 100)
Item 1929 1939 1948 1954 1958
Foods entering distributionsector 1_____________________ tOOO 1157 148 8 1795 1975 Food distribution 2 ____________ 1000 1248 1808 199 0 2220 Food wholesaling and retailingcomponenL ______ bull _________ 1000 123 8 1705 1804 201 9
1 Value (in U)47--49 dollars) of finished processed and unprocessed foods of farm origin entering the food distribution sector and destined for domestic civilian consumption
2 Includes net output by wholesalers retailers and away-from-home eating places in handling farm-originated foods Excludes for-hire transportation and assembling of farm products
TABLB 2-Avemge annual percentage inCleuse in net mltlntt in disshytlibtttion of tartn-originated tood United States 192Q-58 an(l 1948-58
Series 1929--58 1 1948--58 2
Percent PercentNet output food distribution 3 ______________________ _ 29 2 1 Net output wholesaling and retailing component _____ _ 2 5 17
1 Based on a simple semilogarithmic trend equation using least squares and data for 1929 J139 1918 1954 and 1958
2 Based on geometric rate using data for 1948 and 1958 only 3 For food wholesaling retailing Ilnd away-from-home eating places
From 1D2D to ID58 net output of distribution services increased Iclat ive to the quantity of foods cnteTmiddoting the d istribuLion sector However most of t he relative increase occtllTed during the wartime pelmiddotjoel and ltumiddotgely reflects the sharp rise in tLway-floni-home eating
bull Although consumer expenditures for foods indlldtd away-frolll-homt eating we bad to use priees for foods sold in retllil stolmiddotes to deflate the vallll series Also errors in priee deflation for eosts of food entiring the (listrihution (tmiddottor ttIHI to bias the net output index upward TIll Bunllu of Lahor Stalifti(s (BLS) began reporting priees for foods pnnhased away from hOllle in Jannar)middot 1()53 Aeeortling to the BLS tUllsumer price series from 11)-14 to 1118 th indlx for all foods ineluding food purehllsed away from iwme in(reasetl relative 10 the price index for food sold in retail stores There is It strong pnslllllption that B LS prices for both foods at borne a 11(1 foods awa~ from lulllle lmiddotctll(t quality and s(rvice in(reases IKr unit of llr()(uct OVIImiddot tim Ihllmiddotlfort itmiddot is simpler to rt(ob1lize the bias in tht net output serilS and (lllllify 011middot oTllushyions Ilecordingly than to atttmpt to correct the series If we did nttempt to orrL(t the series ve would still have a biased indlx hut t would not kilO tlJe direction of bias (Ste appendix)
During the postwal decade 19-U3-58 distribution services per unit of food entering the distribution sectol declined This reflects a decline ill services pet unit both in eating rlaces and 1n wholesaling and reshytailing The qualifient iOlls in the lIldexes becnuse of data problems tend to stren~thelt this linding Our estimtltes indicate that the quanshytity of distribution servicts per unit increased dming the prewar decshyade1929-3)
Net output in wholesaling and retailing of fnrm-originated foods doubled from 19~) toUJ5H The average annual rate of growth was ~5 percent The estimated rate in the postWlr period 17 percent was significantly smttller Lhan in the prewar decade HI39-48 when the fastest growth mle oce-uITed The inadequacies in the price deshyfllLlors tend to be ollSlttting to some unknown extent that is we canshynot say for thp wholesaling and retailing component as we can for food distributioll in(luding ILway-frolll-home eating whether or not the output indlx is signilieuntiy biased upward 01 downward 01 at all
(ompttrison of lIlt inlti(xes of Iwl output in food distribution and in the wholesnl i ng 11IHI I([ai Iing com pOllent i nel icatts that output of ILway-flOlll-holl1(1 pal in~ pla((s increased si~nificantly fastel than outshyput ill wholesaling alld Ipfailing durillg tile three decades 11)29-58 The fmtlI rate of grOWl h hOHver was (ollcentnLled II1ILinly in the wlLrtim( lHriod Tho two indexes shOWN] the Same perccntage chang( c1l1ring IIHI I)(ewar (badl and the largll ptrclnhlge rise ill dislribushyI ion ill t he postwar dl(atil was only sl ightly if siglli fiellntly largm
Persons Engaged in Food Distribution
The scrips on prnploYlIlent and rntLn-hours in food distributioll inshydude paid full-time and pad-timp employees unpttid family workers ILI1(1 proprietors of ullillcorporatpd bllsillessps (table 3) Thnt is we ineluded all perSOIlS cllgagpd in food dishibution as clelined in this reshyport Tho seope of the selies is cOllsistent with that of the output Index for food distTiblltion Thl prnplOylllPnt index exeludes persons who 1IIndlcllonfood i~lll1s 01 foods nol (]pstined for dorlll~ctic eivilil1n (ol1sumption Data on IlVlWIge hours of paid employees are estishyIIllLted fom HLS pllbl iMhed dLI t Ve assump that LVemge hours for ullpaid family worke-S aIX the sallle as those ro paid employees and thitt propliptOlli of unintorpomtpd bIlSiHf(S work no honrs 1 weeks
bull ((onl i ng to Ott r eHt i matIS thl~ n11 III bm of pprsons engaged in d isshytriblltion of ftLm PO(ltlcts Ose 43 ptwlent fmm ID2D to ID58 There was It slllall hut silrni lieant inGlensc dUIing the preWILl decade 192-8D
7 TIl(gt qllantity of food lnhring thl clistribntlon slc-tor Is lIlellHnrlcl ill 1047-4ll ltioltllr101 ullcI ill(III(I(101 lLsH(llIhling trallsportillg nlld proeeHsing 101lrvielS acldcl beshy1((11 farlll HailS IIl1cl whoitHallrH pnrCllaS(H of foo(ls as wllI as the upgrading il) qllnlity of food (OIlHUllllcl PhUH the t1nding101 do not refer to the dlstrilmshyt ion Iri(p p(r physical unit Huh ns pound or quart A((orcling to I~RS eftishymatt (8) totnl CC)JHullllltion of fooels ill pounds inerllIs((l ahout ngt I)prlent from IHH to lJiR olllllnr((l with 0111 cHtilllnttd incrcnst of lIhout 120 pcr(lnt in fond distrlblltion servic-ts Obviollflly clistriblltion sprvices PCI pound Inshy(rllI1l( (onHidprllhly inlach of the thrpe dCltllllcs
HIIl( HOllnps uncI problllIlH rplatlng to tIll PlllllloYlllcnt and 1Il1in-honrs dnn IIrp dl(us(1 In grlatCr dltnil in the IIPPlll(lix It might however Ill noitcl hen that nltlrulltlv nlIlIlption on Ilvpl nllel trends f lIverlige weekly hourI of u(tive propriltors did not silnill(lIntly ntltmiddott the final resnltl
5
____ ___ ___ __
n very 1arge rise during the c1e(ade marked by the war 1939-18 and a HigniIicHn t i1WlH4P Illl ring t11( postwa dNnde ID~R-fi8
TIB 3-Perwon8 mul 71wn-howw engagfd in di87ibuion of fmlIk oliginatNl jOO(l8 [niter Rtates 8ele(ed Ylll18 19f3lJ-58
(U)29=100) - --_------_ -- - -_ bull_----
Item 1929 1939 1948 1954 H)58 ~_~__-_~----~_ ~______~ __ ---_~___ _1__~~ ~_ ___ _~ _
Food distribution Plrsons I _bull _ - _ 1000 1080 1349 1375 Jl3 I Man-hours 2 3 _ _ _ 1000 96 1 1111 1086 107 ()
Pood whol(salillg aud retlliling COmpOllPnt
Persons _ _ _-_ - - 1000 1031 1185 11GO 1180 ~rlJl-holirs ___ _ 1000 022 9S 5 020 892
~-- ~ - _---- ---=shy
1 Includes fill persons (paid lmployees unpaid family workers and proprietors of unincorporntpd businpss(s) (Ilgllged in handling farm-originllted foods in wholeBaling retailing and away-from-home eating establishments Excludes pprsons in food (lisLribution flg(IlCits who are engaged in handling nOlfood items and foods whidl are not cistind for US civilian consumption Excludes forshyhir( transportlltion lind assembling of farm products
l Bllscd on Ilumh(r of persolls (as dcseribed in footnote 1) and estimlltes of avpragc lIumhPr of hours paid for including paid vaclltions lind sick Icave Esti shymlltes for pail cmployCls ure based un published BLS cillta on average number of hourI in food lind liquor stores in totul retail trade tllld in total wholesale trllde the salllP lv(ruges 11(re IIssullled to apply to unpaid fllmily workers und for proprietors of lInincorporated bllsiness(s u constant GO-hour week was assumed
3 Eslimatps of aVlrtlge w(ekly hours of persons engaged in distributing fflrmshyorigilllled foods
1929 1939 1948 19M 1958 -- ----- -middot~----middot-middot----middotI--------~----
Foocl distribution ___________ ___ 550 4()O 453 435 11 4 Food wholesaling and rltailing comshy
pOJlent ___ ___ ____ bull 541 483 150 430 41 0
--- ---------------------------~--
101 al nl1mb of mnl1-hOlllS workeel in food distribut ion inereased (onidlrably IPH4 thall number of pplsons l)(cftuse of a shalp dec1ine in lTPrngl hou r4 1)(1 p(Ison Accolcli ng 10 Oil pstillmtls aVlntge ((Idy hOlllS d((rttsld nbol1t 01lP-tourfh from 1)2D to Wfi8 and ronscshyqupntly t-olal mlmmiddothollH rose only about H )(I(nL Thl man-holll sllils shows It dpelinl flOlYl H)2D to ID3D a substantial rise from 193f) to UHH andt (mtilllleltl I(c1illl 1gt(t((1 llU~ and llfiH
[ll thC food whollHaling and lLtailing (ollll)()Il(lli thl nlttivl inshy(((aHe in lllllllbpJ of persons engagl(L was IlltHh smallll-18 pel(PllI ()V(f tIl( IhnC cl(caillH All of this ill(CilSl look pluP btiwlln 1)~D 1Il(1 IHH tlH nUll1bl of prsOHS 1((1111inlt fairly eOllslall - in 1)( (lostwa l d(CHll Illlt lltlllli1lJ of man-hours on t-he otlH1 hand was about tIl(gt SUl1P in 1()JR as in ID2D bul deelinlltl sharply flolll 1f)18 10 lHiR
TIl( nbovl (olll)Htlisons imlieH[l that most of (1)( inellts( in (Ill
ploynlll1t o((UlTl(1 in lating pillels IVC rnadp a hloie aHtll1pt 10
(j
adjust the total employment data including unpaid family workers find proprietors of unincorporated businesses to a full-time equivashylent basis in order to compare the shifts in employment in retail trade wholesale trade and awny-from-home eating places (table 4) For instance if two part-time employees worked only half as mnny hours as a full-time employee they were counted as equivalent to one ful1shytime employee Although the number of equivalent full-time middotworkers has increased in each of the three sectors there has been a startling ehange in the relative importance of eating places In 1929 there were about twice as many equivalent full-time workers in retail food trade as ill eating places but by 1958 they both accounted for about the same peleentage of all workers in food distributi)n The number rmployed in wholesale trade remained a fairly constant peleentage of the total About two-thirds of the estimated inerease in the total number of full-time eqnivalentvorkels from 1929 to 1958 was acshy(ounted for by the rise in nnmber of eating places The relative inlportance of rmployment in eating places showed a continued upwardtlend during the three decades
THr~ +-[)i~7ibution oj person8 (fuU-timbe erJMivalent baRis) enshygaged in handling jmTIl-originded food~ in lohoZesaling 1Cfailing lind ((Ufly-jlom-llOme eating places Fnited States se7ected yean 1920-68 1
---------- It(~middot---~-~-~-1929 -939 I 1948 1954 1958
- ------1----1----1middot---
I Percent Percent Percent Percent PercmtFood wholcsaling______________ 123 11 2 120 126 11 3 Food retailing ________________1 5R8 571 508 48 5 459 Rating Places----------------- 289 31 7 372 389 428
To taL ___________ bull __ _ _ 100 0 1000 1000 1000 1000 r
1 See table 3 footnote I for definition of persons
Output Per Man-Hour
Output pll 1gt1180n in clistlihutin~ farm-originated foods rose 55 pelCfnt or about IE) per(ent p(r )rnr frolll 1D20 to 1D58 (tables 5 and G) The rate for the postwar decade 1948-58 was also 15 percent per yenr During all three decades output per person increased conshysiderably less than toUd output thus lequirmg a suhstantia increase in wOtkers in order to produce the rise in pervices Th is was especially true during the period lfll3D-8 marked by the mr and the early postshywar reeovery Output in food distribution grew at about the same mte in the prewar and postwar c1eracles but because of greater gains in output per worker after the war employment rose less in that decade
Output per man-hom in food distribution rose substantially faster than output per p(rsOIl becttUse of the sharp and continued declines in aetago weekly houls pel pelSon From 1020 to 1958 output per man-hour more than doubled The average annual rate of growth
7
was 25 per(ent per year about two-thirds more than the rate of growth in output per person The rate was about the same in each decade indicating that labor productivity in food distribution ttpshyparently did not accelerate over the three decades
TABLE 5-0utput peT peTson and per man-hour in di8tTibut-ion of faTTfb-oTiginated food United States 8elected year8 19~9-58
(1929=100)
1939 1954Item 1929 1948 1958
Food distribution 1 Output per perSon _________ 100 0 1156 134 0 1447 155 1 Output per man-hour 2_____ 1000 129 l 1627 1832 2063
Food wholesaling and retailing component
Output per perSon_________ 1000 120 1 1439 155 5 171 1 Output per man-hour 2_____ 1000 1343 1731 1961 2263
1 For food wholesaling retailing and away-from-home eating places Excludes for-hire transportation and assembling of farm products
2 Sec table 3 footnotes for definitions of perSons and man-hours
TABIE 6-Avemge (tn7IJual percentage change -in mttlntt peT per80n wnd 7)81 man-hmtr in dist1iblttpoundon of f(~rm-origiiUlted foods United Stntes 19~9-58 and 1948-58
Series 1929-58 1 1948-58 2
Food distribution 3 Percent Percent Output per person ____________________________ _ l5 15 Output per man-hour _________________________ _ 2 5 2 4
Food wholesaling 11nd retailing component 18 18Output per person ____ -- _-- --- - - - - - - - - - - - - - -- ---Output per man-hour _________________________ _ 2 8 2 7
1 Based on It simple semilogarithmie trend equation using least squares and data for 1929 19a9 1)48 1954 and 1958
2 Based on geometric rate using data for 1948 and 1958 only 3 For food wholesaling retailing and away-from-home eating pllLCcs bull See table 3 footnotes for definitil)ns of persons and man-hours
Gains in labor productivity ill the holest~le-retail component were significantly grMOOr than in distribution including el~ting places in each of the three decades Output per person in food wholesuling and retailing increased lbout 70 percent from 1929 to 1958 an average annual moo of 18 percent (fig 2) The rnte WItS the same in the postwar decade The increase reflects in part the shift from clerk to self-service supollnarkets The growth in output WitS relatively larger than the growth in output pel person flom 1929 to 1948 hence the rise in employment However from 1948 to 1958 the rise in outmiddot put per person kept pace with the inCrellse in output so that the numshy
8
FIGURE 2
Food Distribution
GROWTH IN OUTPUT PER PERSON OF1929
~~~ t 200 ~ Wholesaling175 and retailing
DistributionA 150
125
100~~----~--------L---~--~------~
1929 39 48 54 58 RATIO CHART
AVERAGE AHtWAI RATE OF GRowTH FITTED EXPONENTIALLY BY LEAST SQUARES
A I~CLUDES FOOD WHOLESAlIHG A NO RET AILING AND AriA Y - FROM - HOlliE EATING PLA eES
U S DEPARTMENT OF ACRICUL TURe NEe ERS ]JQ)-6J (11) ECONOMIC RESEARCH SERVICE
ber of workers in food wholesaling and retailing remained about the same
Taking into account the decline in average hours per person output per man-hour in the food retailing and wholesaling component rose about 125 percent over the three decades or about 28 percent per year (fig 3) The rate during the postwar period 1948-58 was 27 pershycent From 1929 to 1948 output per man-hour grew at about the same rate as total output During the postwar perioo 1948-58 output per man-hour rose relatively more than total output resUlting in a declIne in man-hours sgtent in food wholesaling and retailing
Smaller productivity gains were made in distrIbution as a whole than in the wholesale-retail component during each of the three decades mving to the larger increase in net output and the smaller gains in productivity in eating places compared with wholesaling nnd retailing establishments This was partiCUlarly true for the period 1939-48 marked by the war and the large increase in eating out
The increase in output per person and output per man-hour in total food distribution may be overstated because as we have pointed out our measure of net output in food distribution probably has a secular upward bias The productivity measures for the food retailing and wholesaling component are on the whole on much firmer ground There are more and better data for constructing the wholesale and retail food bill than for eating places Also the price deflators are at least conceptually the correct ones The deflators probably reflect secular improvements in quality and additional services per unit so
9
---------
FIGURE 3
Food Distribution
GROWTH IN OUTPUT PER MAN-HOUR OF 1929
250 Wholesaling 225 and retailing
Distribution 6200 175
150
125
100 1929 39 48 54 58 RATIO CHART
4VERACE ANNUAL RA TE Of CPOwTH FITTED EXPONENTALL BY LEAn SQUARES
A INCLUDES FOOD wHOLES LITIC AHO RETAIUtUAHD A Y -FROJr4 -HOME fA TINe PLACES
us DEPARTMENT OF CRICUL TURE NEG ERS ]]02-(4 In ECONOMIC RESEARCH SERVfCE
that to some extent the effects of these secular biases are offsetting Also data for average hours are available for the trade sector for eating places we had to assume that average weekly hours paralleled those in food retailing
The significant finding that productivity gains were substantially larger in food wholesaling and retailing than in eating places would not be vitiated if better data Were available Indeed the conclusions would probably be strengthened because the inadequacy of the price deflators for measuring net output in food distribution tend to bias the results against this conclusion9
bull Our statistical efforts did yield separate measures of net output and producshytivity in away-from-home eating places which we considered too tenuous to include in the text However for other researehers in this area we include the follOwing tabulation of the estimates of output and labor productivity ill awayshyfrom-home eating places (1929=100)
1939 1948 1954 1958
Output__________________________________ 125 200 233 257Output per worker _________________________ 103 112 120 123Output per man-hour_____________________ 118 141 156 169
10
TABLE 7-Sales per person in all gtocery and combination stores and 8ales by self-senice 8lotes amiddots a pe7centage of sales by all grocery aruZ combhuttion 8tores by 8ale8-size cla88 United State8 1948
Stores with sales of- Sales per Sales by selfshyservice stores
person 1 as percentage of total
DoUan Percent$500000 or over______ bull _ __________ bullbull __ bull ___ _ 33678 937$300000 to $499999 __ __________________ _ 32364 879$100000 to $299999 ______________________ _ 25 565 666Under $100000 __________________ bull ________ _ 1l982 338
1 Includes paid employers llnpaid family workers and proprietors of uninshycorporated businesses
Factors Affecting Output Per Man-Hour
Gndoubtedly the most important fador causing the rise in labor ptOductivity in food distribution was the growth in number of selfshyservice stores Thi technological change in food retailing was coushypled with an increase in economies of seale as reflected by the growth in the an~rage size of stores Although we cannot measure the numershyical importance of these factors data from the 1948 Oensus of Retail Tlflde (10) for combination and roeery stores do dramatize the relashytionship between size degree of self-service and productivity (sales 1)er person) Not Slllprisingly large stores tend to have more selfshyHelvice aml at lpound(lst tip to a cPImiddottain point sales per person increase with size of store (table 7) The number of persons used to compute sales per ppoundlsonin table 7 was based on a simple count of paid partshyt iTIe and fu11-t illl( poundIll plo)elt propriplorB of lin in(orporated businesses and unpaid family middotorkpIB Part-time and Tull-time Employecs were given equal weight
lhe sa1e3-size (lasses in table 7 hae too wide a range to reveal much of interest about the relationship of size and productivity Also larger stores tend to hire Iehttively more part-time workers than do smaller storps so thnt ehnnges in productivity of stoles in the various salel-Bize dasses would in part refleet the inereasecl importance of part-time workers
Data in the 1954 ernYU8 of Retail Trade (10) show gr()(elmiddoty-store size by number of paid employees Data on paid employees and tgtayshyrolls are available for estimating the number of full-time equivalent paid employees in stores grouped by size class according to number of paid employees The following tabulation obtained by adjusting these paid employees to a full-time equivalent basis and sim1)ly adding the number of proprietors indicates that labor productivity tends 10 decline above a cert ain size
11
StoreR with spedfednumber 01 Sale_ pr 11l1lmiddottlme
IHlitl emlJlOyetH efJulvale1ampt lCorkemiddot1__- _____________________________ _________________ $28020~
2__________________________________________________ 28736 3 __________________________________________________ 29615 4-5________________________________________________ 31810 6-7_________ bull______________________________________ 35 251 8-9_________________________________________________ 396]310-14 ______________________________________________ 43867 lrr-19 ______________________________________________ 47388 20-49 ______________________________________________ 50321 50-99______________________________________________ 46503 ]00 or more _______________________________________ 34347
Technological improvements in checkout counters automutie wrapshyping conveyorized handling of materials and other innovations have probably tended to inclease the optimal size of store sinee 1954
The same general pattern of growth in size of store and amount of self-service over time is obvious to even the most casual ohseITetmiddot Indeed the growth in a verage size of retail food stores has been no less thap phenomenal In 1958 the average size measured by sa les in 19-17-49 dollars was mOle than 3Va times the average in 1929 During the postwar decade sales per store nearly doubled The (en81l8 of Retail 11llae (10) reported sales by selfmiddotservice grocelies and combination stores for 1939 and 1948 Using this information and data from trade journals for extrapolation we eshmated that the proportion of total foods sold in combination and grocery stores that was sold ill self-service markets increased ftOm 15 pelcent in 1929 to 70 penent in 1958 Srties in combination and grocery stores acshyconnted for about 50 penent of total retail sales in ID29 and about 75 pereent in 1958 In ID48 about half the total sllles in combination and grocery stores were made in self-service stOles
The dramatic shift from clerk to self-selvice stores bears Hidence that consumers preferred self-service stores N eveltheless the rate of growth of labor produeti ity was due in pnrt to shoppers performshying more of their own clerk and delively senices although their actual shopping time may luwe clecreased Ye cannot of course measure tho hours of Itbor effort of shoppers Thus in the broader sense our estimates of the gains in labor productivity in food distribution do not aecount for 0hfLnges in Llllabor inputs
Changes in capital inputs in food retailing may have also contribshyuted to the rise in labor p[oductivity but the data are too intractable to support even this broad statement Data available for measuring the stock of capital are for owned capital only According to estishymates made by Allen B Paul of gRS mOle tlmn haH of net durable cttpihtl (hnd and depreciable assets) used by (o[porate food reshytailers in 1058 was leased tO Thus even if we defined (~apitlLl st()(k
1 Paul used two methods to estimnte the net mlue of dumble upital 1(1lplt1 hy corporate food retnilers in 108 (1) a cumulated expenditures method and (2) a (apitaliz(gt( r([lt method The approalt-hls and data w(re psllntially il(Ilshy(l(nlti(llt poundsing method (1) he estimllted I(ase Cllpital at $20 hillillu usiu~ llHthod (2) hl (gtstimnt(d it fit $23 billiou Owned dumlJl( (a pi tal Ilmollut-pd to $1- billion Paul allo poiuts Ollt that AlI()win~ for extrlme ahH~ of til(gt Ilrnorti7ation period and the interest rate in the se(ond est-irnnte the share of
1~
narrowly to include land depreciable assets and inventories but igshynored the leased capital we would be omitting about 40 percent of total capital stock used in corporate food retailIng in 1958
Inventories account for a substantial fraction of the capital in food retailing and the evidence indicates that this portion of the capitalshyoutput ratio declined during most of the 1929-58 period Data from the 1948 OensW1 of Retail Trade (10) show that the ratio of yeltr-end inventories to annual sales definitely declines with increasing size of establishment (table 8) On the basis of data from Oens-us of Busishyneif8 the ratio for all retail food stOles was 62 percent in 1939 deshy(lined to 44 percent in 1948 and remained at 44 percent in 1958
Important technological improvements in food warehousing ocshy(middotU1Tecl during the three decade3 included in the study The handlift truck was largely displaced by the forklift truck which in tum is being displaced by automatic conveyors The pallet a load-carrying phLtshyform was introduced Lnd widely adopted during the period There was also a tendency to build more efficient single-story warehouses (9) which eomplemented the new mechanical devices for loading and sorting goods Towlml the end of the period improved control sysshytems (ontributed to increased labor productivity
TBLE H-Yenr-(md inlentolies as (l percentage of annual sale8 by N(Ze of r(f((il P8tllbli8hment (lnitecll-~tt(te8 1948
-------------------~-------------------------------------
Year-end inventories asEstablishments with sales ofshy percentage of annual sales
Percent$1000000 or more______ bull __ bull ____ ______________________ _ 276$500000 to $999999 ____ ____ bull ___________________________ _ 322$300000 to $499999 ____ _ ____________________________ _ 407$100000 to $299999 _____________________________________ _ 555Under $100000__________________________________________ _ 823
Comparison With Other Sectors
According to estimates made by the Bureau of Labor Statistics (1J) the average annual rate of growth of output per mlm-hour from 1929 to 1958 for the total private sector of the economy was 26 percent (table 9) This is about the same as the estimated average rate for food distribution as a whole but somewhat smaller than for the food wholesaling and retailing component The rate in food distribution mRy be somewhat smaller than in the total private nonfarm sector
durable (apital that was leased does not falI below igt7 percent Despitt Pauls Iw(1 to uS( indir((t llI(thods there is little doubt from his cOl1(usions that l(a8((1 (npital 11((lHlllts for a substantial frnlttioll of the capital stock in fond rptlliling Ilnd food distribution (Gnpllblished paper ~rEASUI~E~rENT OF LEASEll (PITAL)
13
if we take into account the limitations of the dataY During the postwar decade 1948--58 output per man-hour grew at a significantly faster yearly rate in the total private sector (30 percent) than in either the food distribution sector or its wholesale-retail component
Output per man-hour in the private nonfarm sector of the economy increased [lt an average rate of 21 percent per year from 1929 to 1958 This was significantly less than the rate in food wholesaling andreshytailing Our estimates indicate that it was also smaller than in food distribution as a whole but given the limitations in the data it seems safer to conclude that the yearly rate in food distribution was probshyably no smaller than in the private nonfarm sector of the economy The same general comparisons also apply to the postwar period 1948--58
TABLE 9-Lllemge (tnmUll percentage clulnge in output per man-how in food rlisbiblttion anil in other secm8 of the econ01ny United States 1929-58 and 1948-58
Series 1929-58 1 1948-58 2
Percent Ptrunt Distribution of farm-originated foods 3 _______________ _ 25 24 Food wholesaling and retailing componenL ___________ _ 28 2 7Farm sector ______________________________________ _ 36 6 1Private nonfarm sector ____________________________ _ 2 1 23 Total private economy _____________________ bull ____ _ 2 6 3 0
1 Bas~d on a simple semilogarithmic trend equation using least squares and data for 1929193919481954 and 1958
2 Based on geometric rate using data for 1948 and 1958 only 3 For food wholesaling retailing and away-from-home eating places Based on BLS estimates of net output per man-hour computed on an establishshy
ment basis (1S) which are based on approximate hours paid (including paid vacations sick ave and so on) rather than hours worked
COI1(poundptually the BLS method of eomputing net output in agrlshycultnre (73) is npproximately the same as that nsed here for food distribution According to the BLt estimates the avernge rate of growth of output per man-hour in farming -was 36 pelcent pel year from 1929 to Inn8 substantially greater t-han in food distJibution or in its food wholesaling and retailing component The 1110st rapid exshypansinn in farming occurred in tlle post-World Val II period Acshyeording to our estlmates output per man-hour rOSe relntively molpound both in food distribution and in its retailing and wholesaling eomshyponent than in farming between 1929 and 1D39 but fell behind between 103D and 1948 and lagged far behind the dramatic climb in agJishyeultural productivity between 1948 and 1958 From 1948 to 1958 output per man-hour in farming rose (tbout H1 ppoundrcent per year
U Because of statistical problems in capturing quality imprOHlI1lllts ill measuring net natiollal procluet in constant pricCs there is a (OllllllOIl l)PSUlll)lshytion thllt the rate of growth in output per mun-hour for the total privatI ((oll()m~ may be nnderstat(ll On the other hand us we hun indica ted the rate of growth in output per mllll-hour in food distribution is probably oerstatec1 shy
more than twice the mte in either food distribution as a whole or in t he food wlohal inJ and retailing eomponent
J(u(h of the rise in output per man-hour in farming resulted from a larJe ~lIbstitution of capital for lahor AceordinJ to EllS estishymate the stock of capital 1gtPr man-hour used in farm production rose about ItiO Iwr(~llt from 1Jl(J to HJil-i during the period 1948-58 it IOS( about 71 petTPnt Thi- reflClts all absolute increase in the stock of capilnl (oupleJ with it de(line in lahor inputs rnfortunately we lutyp no comparablt data for food distribution but the evidence that is nailablp harltlly points to a imiln1 mte of Jrowth in capital per vOImiddotker
Ken([ri(k has Estimatpd total faeto[ productivity (output per comshybined I1nit of Jabor and eapita) in llJrinlltnre based on a measure of net output (4) AecordinJ to his estimates total productivity in fanning- ilHreased at an ilverage yeady [ttte of about 25 percent beshytwelll W2fl and Hi7 This is the -anl( as ollr etilllated ralefor output pel tltan-ho1lr in food distrihution but is less than our estimated rate for tlIP wholesale-retail (omponent of food distribution Giwn the plOhlpJIls of nwasuring (apital inplli parti(lllally chanes in the quality of IlIP (apital -tock these comparisons do not indicate that total p()(lu(tivity ains in fannin w(re gteater than those in the food tnu1l r(tOl during tilr IH2H-f)S IlPliod as a whole However Tor tIl( postwar cll(ade 1fl4H-middotJS Klncl rieks estimatls (10 point to sign ifishy(antly larJ(r gains of total productivity in farming than werl likely to han OC(lHTld in food wholesaling and rltailinJ According to Klnclri(ks lstimateuros total produetivity in farming increased 37 PPI((nf 1)([ Yla1 from IHJ-R to IHfi7 Juding from our estimate of a -parIy mtC of Jrowth in output pel man-hour in food wholesaling and Irtailing of 27 ptrcent for IflJ-R-fiH (apital per man-honr would lllt( hlUI to clCclino substantially in on1(1 to yield a total prodl(tivity rat pqnal to that in farmingY
Literature Cited 11 J BlWER HAROIO
l)(t IHSrnID[TIOXS PI_Hf 1- TIn AERleAS ECOXO~[Y sr-CF1R6) Nat Hur 8(011 R(S lriJlfeton (nh PrlSS PrinClton NJ
(n PI-OI~Y T X NETTE Innmiddot THE nflI FOi ~fRKETIXG rAJDI PROIWCTS GS Dept Agr ampon
Res Sprv I[ktg Tranltportation Situation MTS-1frl Aug (3) nfRY R C
lfH4 THE CO-(EPT OF IHE XFr middotOUmiddot rE OF OClPtT WITIT SPECIAL REFERENCE
TO tRISH OA1 Roy StaUs S()(~bullbullTour Xpw Series Yo 107 2i1-2(j1
fmiddotl) KE-ORl(KbullbullTouN Y 1001 PIWotmiddot(TInTY TJE-OS IX TilE middotXITEIl STAT3 Xat Bur E(on Res
Prin((ton (niv Prcs PrinCltoll XI
U xsnming rhnt till wpights IIsld for labor and capital in I1easuring totnl prodlWtivity in fnod whollsnling nnd middotltniling lUI nbout till imllle ns those used fM thE total prin1t( (~1Il0IllY-middotfl to 2 r(ll)(gtdiYlly LIl-it would hal rpquirltgtltl It -l(r(nt lXr ~middotpar trltr(-asp in enpital [Jpr man-hour in thl fnod wholpsaling and [ptailing (olllponlnt to yilld a Ylllrly rai( of 37 IlPrCPllt in total factor proltlurtiity
15
(5) KING WILFORD I 1923 EMPLOY~ENT HOURS AND EARNINGS IN PROSPERITY AND DEPRESSION
Nat Bur Econ Res New York (6) MILLS FREDERICK C
1952 PRODUCTIVITY AND ECONOMIO PROGRESS NatL Bur Econ Res Occas Paper 38 New York
(7) NATIONAL BURE-IoU m ECONOMIC RESEARcH 1961 THE PRICE STATISTIOS OF THE FEDERAL GOERNMENT Prepared by
Price Statis Rev Com for Office Statis Standards Bur of the Budget Hearings Joint Econ Com of Congo of US 1st sesS 87th Cong Jan 24
(8) US DEPARTMENT OF AGRICULTURE 1963 AGRICULTURAL STATISTICS 1962 741 pp Vashington DC
(9) 1952 IlECHNOLOGY IN FOOD~[ARKETING A SURVEY OF DEVELOPMENTS AND
TRENDS IN THE PROCESSING AND DISTRIBUTION OF FARM-PRODUCED FOODS Agr Monog 14
(10) US DEPARTMENT OF COM~IERlJE 1929-58 us CENSUS OF IWSINESS RETAIL TRADE-SUMlIIARY STATISTICS
Bur of Census Washington DC (11)
1029-58 us CENSUS OF BUSINESS WIIOLESALE TRADE--SUMlIIARY STAshyTISTICS Bur of Census Washington DC
(12) US DEPARTIENT ci LAROR 11)3 EMPLOYllENT AND EARNINGB STATISTICS FOR THE UNITED STATES
100)-62 Bur Labor Statis Bu 1312 Washington DC (13)
195U-64 TRENDS IN OUTPUT PER MAN-HOUR IN TilE PRIVATE ECONOMY 1())-)8 (AND ANNUAl SUPPLElIIENTS) Bur Labor Statis Bu 1249 Wahington DC
(14) 1964 RESIAURANTS AND OTHER FOOD SERVICE ENTERPRISES Bur Labor
Smiddottatis Washington DC Jan
Appendix
Measuring Net Output in FofgtCI Distribution
Conceptually the measure of output should include services in eatshying places clerk and delivery services provided by retail food stores packaging and storage of foods by food wholesalers and retailers parking services provided by food markets and the host of other goods nnd setvices provided by food distributors Such a measure of net output might be obtained by dividing value added in distributshying farm food ~roducts by an index measuring changes in prices of goods and serVlces provided bY the food distribution sector This index would include implicit prlces of waitress services clerk services delivery services packaging services and a representative sample of other goods and services provided by food distributors these prices would be weighted by quantities of the respective services in some base period Since there is obviously no reasonable possibility of cC~lstructing such a price index at this time we have had to resort to another more workable method
The index of net output in food distribution used in this report is designed to measure changes in the quantity of goods and services added in distributing farm-originated food products for domestic civilian consumption The index is net of purchased foods only it includes packaging materials and other purchased supplies used by
16
food distributors The series Is constructed by commodity and by agency It includes only distribution services associated with farm foods and performed by distribution agencies it does not include the distribution services associated with nonfood items nor with foods not originating on US farms (fol example coffee and fish) It also excludes wholesaling of farm-originated foods destined for export and for military and other noncivilian uses
The index of net output does not include the distribution services performed by food manufacturers This omission does not affect the index of output per man-hour because the employment data and output data are for the same universe In terms of measuring output of disshytribution services wherever performed however this could be a sigshynificant omission The Bureau of the Census in taking the census of manufadures for 1939 asked respondents to report separately the number of persons employed in manufacturing establishments who were primarily engaged in distribution activities More than 100000 sueh I(ISOl1S crlllep0l1ed by IIHLnu facturers specializing in processing domestic farm food products This is about 4 percent of the number of full-time equivalent persons we estimate were engaged in food d istlibutionin1959 and about I) percent of those in food retailing and wholesaling During the three decades reviewed in this report there a~ It sll ift in packaging from Ietail stores to factories however in the opposite direction there was a decline in home delivery services by bakery and milk manufact1llers in favor of retail stores Output in distriblltion also inrllld(s a small amount of manutaeturing activishyties by food distributors Fnfortunately data are not wailable for e~lttimating the importanCe of these intersector shifts
The series on net output in food distribution was constructed by major food groups-meats manufaetured diary products and so on-and then added to obtain the total for all foods The constant dollar figures were then put OIl an index number basis The Geary (3) formula for measuring double-deflated net output was used
(1)
where
Xil=quantity of goods and services (in ] 947-49 dollars) added in distributing the ith food group in period t
V~I= value of domestic civilian consumption (in current conshysumer prices) of the ith fnrm food group in period t
VI~ =costs of farm-originated foods (in wholesalers purchase prices) entering distribution sector for ith food group in period t
P~I=index of retail prices (1947-49=100) for ith food group consumed in period t
P=index of wholesale prices (1947-49=100) for ith food group in period t
Since our price deflators use base period weights the doubleshydeflated measure of net output is based on current weights
It was possible to double-deflate all food groups except fluid milk and cream for which adequate deflators were lacking The distr-ibushytiun bill for fluid milk and cream by retail stores however never aecounted for more than 2 percent of the total distribution bill for the years included in the study Much of the distribution was done by fluid milk processors which are not within the scope of this study A coverage adjustment developed by Mills (6) was used for this exshycluded group The adjustment assumes that the unit distribntion bill for fluid milk and cream varied in the same way as tlH average unit distribution bill for an the covered commodities
In efleet the index of net output in the wholesaling and retailing of farm-OJ ~inated foods was eOllstructed in the same way as the index for food distribution as a whole A double-deflated value series using equation (1) was developed for away-from-home eating places and this in tum was subtracted from the double-deflated value series for total distribution services
The value data used to construct the net output indexes are from Gales estimates of the farm-food marketing bill by commodity group and agency These estimates were eonstructed using Kuznetss commodity-flow method for years in which eensus data were available Essentially this involved ehanueling the Talue of finished commodishyties (ommoclities in their ultimate form for purchase by houseshyholds) through diflerent kinds of wholesalers retailers and awayshyfrom-home eating placeuros and raising these through-puts by the respective agenCy markup Gales estimates are based on (lata from the (enSmiddotU8 of J1fnnufactu1middotes Oen~ll~ of Retail Trade amI Oen8U8 of lVho[(wilf Jmde from public-ations of the Internal Hevenue Service and the ~tatistical Reporting Service of the Department of Agrishy(mlture and from trade journals and on data available from special and continuing studies made by the Marketing Economics Division of ERS
Although some of the basiC elata especially on markups leaNe much to be desired we know of no secular biases in the final vaJue series13
IVe yould however underline the faet that the information used to measuremiddot the bill for fway-from-home eating places is indeed sketchy and tenuous
The errors in the priee deflators used in (onstructing the net output series are in some ways easier to evt11uate than the errors in the value series The retail (ost (price) series which is constructed as part of the ERS farm-food market basket series was used to deflate the value of consumer expenditures for brm-originated foods The ERS retail cost (price) series is based 011 US average food prices reported by the BLS as part of the food component of the BLS Consumer Price Index The s(ope of the ERS series used to deflate the minuend of tho double-deflated distribution bill is onsistent with the data on civilian food expenditures in that they are both for farm-originated foods only they both exclude imported foods (coffee) and nonfarm
L Gales fStimat(S of thr total farmmiddot food mnrketing bill showed about the gtlame dN(nninl tngtnds as till regularly computed BRS farm-food marketing hill betw((n l02U and 105f Other comparisons of Gales estimates with related puiJlish((1 Sltricgts arcgt in(luded in his report on the farm-food marketing bill and its (middotomponents now in preparation
lH
foods (fish) However as we have pointed out the problem in using the ERS series (or any other consumer price series available for the period) is that it does not reflect prices of foods eaten in restaurants ~lnd other aWl~y-f~om-home e~ting places nor does t flect the ~eater lmJortance of eatmg out by smgle persons The cIvIlIan expenditures series does reflect these factors The BLS began collecting informashytion on prices for meals away from home in 1953 and according to these data our use of ERS retail cost (price) data could significantly overstate the rise in the minuend of the double-deflated net output series for food distribution From 1954 to 1958 BLS prices for all foods (including foods purchased away from home) increased 06 pershycent more than the price index for foods at home
The same ploblem does not arise in constructing the minuend of the let output index for the food wholesaling and retailing comshyponent of middotfood distribution The vltlue series for foods vurchased for home consumption is deflated by the I~RS retail cost (price) series This is Itt least concept ually the correct deflator There is a good preshysumption howev(r that in pmctice the collected BLS 1ebtil food prices tend to overstate the tTue price incleases because they 1eshyfll(t quality improvements in foods as well as additional services per unit (7) To the extent that this is tTue it results in an understateshymentin the rise of the minuend
The pli(e series lIsed to deflate the fmbtrahends for both the distrishybution bill and its whollsale-retail component were constructed from BL~ wholesale priCNfOImiddotfoods As with retail prices tJlere is a good p1eltumption that the reported wholesale price series 1ave upward secular bia ie8 bteause they mlty reflect quality improvements in foods and additional processing services per unit of productH To that exshytent the deflated costs of foods entering distribution and the deflated costs of foods entering the whole laling and retailing component will both tend to be understated Thus the seeular biases in the deflated subtrahend and milHlInd lUe in the same direction in measuring net output in food distribution but they are in the opposite direction in measUling net output in the food wholesaling and rebliling component
To sumll1nrize there is no evidence that the value data used to conshystnlet the net output indexs are subject to secular errors The genshyend presumptions about the enols in the price deflators point to a very likely upward Sl(lrltLI bias in our measure of net output in food clistJmiddotibution However the seculal errors in the price deflators are probably oflsetting to some unknown extent in our measure of net output in the food wholesaling and rebtiling component of food distlmiddotibntion
Man-hours
The s(ope of the mall-hours selies nsed to measure output per manshyhour is fOI practical PllI-POSelt the same fiS the scope of the output S(1il8 The Trum-hours index was designed to measure changes in manshyhours worked by all persons engaged in distributing farm foods
Vnldort v H DEMANIl ~OR ~rANUFACTUREIl FOOIlS MANUFACTURERS SERVshyICES ANIl FAin PROIgttCTS IN FOOIl MANU~middotCTURING US De[)t Agr Tech Bul lal7
19
Nearly all of the employment data are from the (ienw~ of B1lsine88 which reports the statistics on an establishment basis (10 11) Alshylocations based on sales by commodity lines wele made in order to estimate employment on a commodity basis The information on avershyage weekly hours was estimated largtly from B1S published sources and is approximately for hours paid for including paid vac(ltions (lnd sick leave
Employment
Our measure of employment in food distribution includes paid poundu11shytime employees paid part-time employees proprietors of unincorshyporated businesses and unpaid family workers Each of these groups accounts for a sizable fractioll of the total number of workers Also there has been tL significant shift among the groups so that omission of anyone could sifTJlificantly affect the trend ill output per man-hour Fnfoltunately the Bureau of the Censllsreported the numher of unshypaid family wOImiddotkers in 1939 and 19-R only In 1948 unpaid family workers accounted pound01 about 11 percent of all persons engaged in food distribution and food wholesaling and retailing The figure was extrapolated to 1954 and 19i)8 using the ratio of unpaid family workers to proprietors for 1948 it was extrapolated backward to 1929 using the ratio for 1939
The employment estimates also follow the (1(n~I_~ of Bwnne88 classishyfication of kind of business except for the adjustments described bdshylow to bling t11em in line with the scope of the output index In food retailing we included workers in retail food stores (except fish and seafood stores) nonstore retailing and administratie offices and warehouses servicing retail food stores (10) ~Vorkers engaged in home deJivlly of bakery products and milk employeltl by food manushyfacturers were excluded In food wholesaling we included all pershysons classified under merchant wholesalers manufacturers sales branches (with and without stocks) and agents and brokers wholesalshying grocerie and related products (11) Fish and seafood distribshyutors and wholesalers of farm products (raw materials) were excluded Finally in workers in eating places we included all pershysons wOIking in resbturants lunchrooms cafeterias refreshment stands and catering establishments and those working for in-plant food contractors ~Yorkers in drinking places (places in which haH I)f the total revenue is for alcoholic beverages) were excluded For lack of dlLta no attempt was made to separate the proportion of emshyployees in eating-and-drinking places who handled foods from those handling alcoholic bevelmiddotages However for purposes of our aggregate productivity measures this would probably not be It significant adjustment
The basic employment data are from the Oenm~ of BU8ine88 for each census year between 1929 and 1958 These data are for all pershysons working in establishments speeializing in food disttmiddotibution Therefore the employment series excludes persons distributing foods who are employed by establishments primarily engaged in other ftctivities The effed of this omission however is probably negligible According to the Oen8U~ of Retail Trade for 1948 general stores
~o
department stores and variety stores were the only nonfood outlets selling any significant quantities of food (10) Sales of foods by these three groups together accounted for less than 3 percent of total retllil food sales in that year
Food wholesalers and retailers sell nonfood items and foods not originating on US farms 1-Ve therefore had to adjust the employshyment series for these sales in order to make it comparable to the scope of the output series The adjustments were based on a simple pershycentage al1ocation of sales by commodity line reported in the Censuses of Business As far as we could tell from the data the trend to nonshyfood sales by food distributors first bec1me significant in the postwar period Therefore we adjusted the figures for 1954 and 1958 only According to our estimates food sales as a proportion of total sales of retail food stores declined about 4 percent from 1948 to 1954 and about 3 percent from 1954 to 1958 For food wholesalers the proportion decliMd only about 1 perc~nt from 1948 to 1954 and about 3 percent from 1951 to ID58 The adjusted employment and man-hours figures for food distribution are about 4 percent below the unadjusted fibTUres in 1958 for the wholesaling and retailing component the adjusted figures are 6 percent lower Thus these adjustments alone raise our estimated relative productivity gains for the postwar period 1948-58 by 4 percent for food distributIOn and 6 percent for the food-trade component These adjustments are obviously significlnt5
In order to adjust the employment data for non-farm-originated foods we omitted employment in fish and seafood markets These are not reflected in the net output index We did not adjust the employment in establishments of other food retailers and wholesalers of fish and seafoods because the adjustment would have been virtually within a rounding error Our estimat~ indicate that in ret~il food stores (not includmg fish and other seafood markets) farm foods sold as a percentage of total food sold remained about constant during the postwar period 1948-58 This presumably would be equally true for food wholesalers and away-from-home eating places
There is still one more adjustment needed to bring the scope of the employment series and the output indexes in line The employshyment series including the above adJustments reflect distribution servshyices related to farm-originated foods destined for all uses Since we are only interested in foods destined for civilian consumption we also had to adjust employment in food wholesa1ing to allow for handling imported foods and foods for noncivilian consumption The allocation was based on utilization dat~ developed by ERS According to our ectimates farm-originated foods destined for civilian consumption declined as a percentage of total sales of foods by wholesalers from 1939 to 1958 The decline was nearly 4 percent and therefore raised the relative increases in productivity in food wholesaling by about 4 percent over the two decades The efect of the adjustment was thereshy
15 These adjustments are best avoided in constructing productivity indexes by meusuring both output and lubor inputs on un ugencmiddoty basis rather than a comshymodity busis As we have pointed out our starting point was Gales estimate of the fann-food distribution blll which was necessarily by commodity Thereshyfore we had to adjust the employment and Illan-hours data to a commodity bash also
21
fore insignificant both for distribution as a whole and for its wholeshysaling and retailing component
Besides adjustments for scope it was also necessary to correct the reported census employment data for comparability over time As far as we CflT Lell the most significant changes in coverages in the Oen8U8 of nusineS8 occurred in 1954 and even these were not highly significant for purposes of this study The Bureau of the Census transferred their data on milk pasteurizing and bottling plants from the Oen8US of Whole8ale Trade to the OentJ1lS of llfantLfact1t1es in 1954 In the same year they transferred data on retail bakery stores with baking on premises and operated as multiunit estabHshments from the OensUB of AIamtjact1tres to the Oen~1t8 of Retail T7ade The Oensu~ of Wholesale Trade and Oennt8 of Retail Trade for 1954 reshyported data for 1948 which were comparable with the 1954 coverage The difference in the total number of persons in wholesale and retail trade in 1948 caused by the ehange in coverage was about 4 percent Sinee the employment data from 1929 through 1948 were comparable nnder the old definitions (except for minor adjustments) and the data from 1948 to 1958 were eomparable under the new dennitions the two series were simply linked in the over1apping year Also beshyginning in 1948 emp10yment has been reported for the work week ended nearest November 15 whereas for 1929 through 1939 the emshyployment data were given only on an average annual basis Employshyment data were reported on both bases for 1948 and this was another reason for linking the series
Finally the only changes in scope of the Oen~1l8 of B1t~-ine88 that eould possibly significantly affect the comparability of the series were made in 1954 The OenntY of B1t~ine88 for 1954 excluded establishshyments with no paid employment in 1954 and with sales volume of less than $2500 in that year The enSU8 of Bu~ine88 for 1948 excluded establishments which operated the entire year but had a sales volume of less than $500 However comparable figures for the new cutoff for 1948 were published in the 1954 Oen~1l8 of B1tsineS8 This was still another reason for simply linking the series in 1948
To summarize we had to make various adjustments in the employshyment data to bring them in ]ine with the scope of the output series and to take account of historical changes in the coverage and scope of the Oen~1t8 of B1tsine88 None of the errors introduced by making these adjustments are likely to be significant in gaging productivity gains over the three decades 1929-58 covered by the stndy However they could be significant in gaging the postwar gains for 1948-58
Average Hours
The difficulty of measuring average weekly 110urs per person enshygaged in food distribution is underlined by the fact that the only availab1e series specifically applicable to food distribution workers (average hours for nonsupervisory employees in food and liquor stores) accounted for less than 25 percent of the total employment in 1948 And the data for this specific group are availab1e only since 1939 Although it would be more comforting to have a better coverage of ~ours the picture is not aR dim aR the above figure suggests Closely
22
related series are available in some cases and in general average hours worked by paid employees aIPong different parts of the nonfarm sector of the economy tend to move together
For food retailing data on average hours worked by nonsupervis~ry paid employees in food and liquor stores are available beginning WIth 1~3D The series was extrapolated back to 1929 using Kings data on an~rage hours of all employees in total retailing for 1920-22 (5) and BLS data for average hours in manufacturing (12) This linked series for nonsupervisory employees was applied to all paid emshyployees (including executives of corporations and supervisory workshyers) and to unpaid family workers For lack of any better inforshymation we simply followed Barger (1) and assumed a 60-hour work week for proprietors of unin(orporated businesses for the entire period
Data on average weekly 110urs for food wholesaling are available only since 1958 For the period 1939-58 BLS published data on average weekly honrs of paidnonsupervisory employees in all wholeshysaling wen adjusted to the 1958 average for food wholesaling (that is inereased about 6 percent) Ve extrapolated back to 1929 using Kings data on average weekly hours for employees in total retailing for 1020-22 and BLS statistiCs on average hours in manufacturing This linked series for a11 wholesaling was applied to all employees in food wholesaling including supervisors and corporate executives Itc(ol(ling to data reported in the OenRlt8 of Wholesale Trade there were no unpaid family workelS in food wholesaling during the period studied Ve assumed a constant 60-hour week for proprietors of unincorporated whl]esaling establishments
For eating places there are no continuing series reported on average weekly hours for any group of employees in restaurants or other awayshyfrom-homo eating places Using data obtained in a special surrey made by the BLS in 1)64- (14) e estimated that average liomS worked by paid employees in away-from-home enting places were 8 percent greater than werage llonrs worked by paid employees in retail food stores On the assumption that trends in average llOUrs per person htwe been the same in both kinds of distribution outlets we simply inshyflated the average weekly homS chLta for retail food stores by 8 percent and applied this to the rota number of paid employees and unpaid family lyorkerS hl away-flOm-home eating places For pmprietorn of unincorporated eating places we again used the 60-hour week assumption
The ahove description of our estimates of average weekly hours in food distribution indicates how sparse the data are for this sector and the difficulties of measuring or even gu~ssing the direction of errors in the man-hours index We did experiment with different nsshysumptions about weekly hours worked by proprietolS and the results indicated that our conclusions about trench in labor productivity are not likely to be signi ficantly affected by using the 60-hour assumption t
t If we hlld assumed the same avelllge hours for active proprietors as for paid employeps (prtuinly an extreme assumption average hours in food distribushytion would have decrpased only 2 percent more from 1039 to 1958 than in our estimllte using the GO-hour assumption rhe effect would have been more Hignifi(lInt for 1020 to 1939 but it is doubtful that the percentage decline for propriptors could have been as great as that for paid employees (11 percentoyer the dpcade)
23
This at least suggests that our estimated series on average weekly hours may not lie too unsatisfactory unless we have been so unlucky that all of the errors are in the same direction Less conjecturally however the above description of the estimates for each kind of disshytributor indicates that we can have more confidence in the accuracy of the man-hours series in the food wholesaling and retailing comshyponent than of the series for food distribntion including eating places and that the series for the postwar years are better than those for the prewar years
us GOVERNMENT PRINTING OFFICE 1965 o-76Z~75 24
middot
( ~ (~
r I I
I
1
1
bull 1 r
t ~
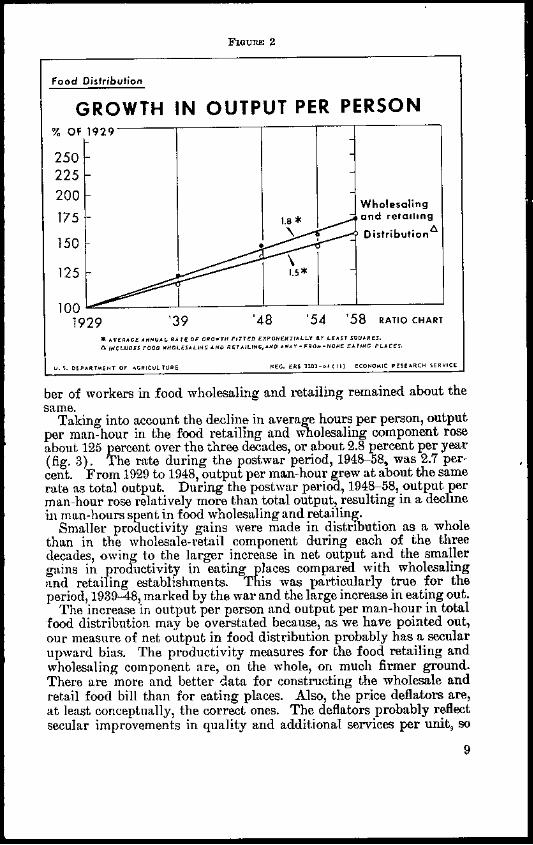

middot
( ~ (~
r I I
I
1
1
bull 1 r
t ~


