1 revised Outsourcing of Intermediate Manufacturing Products in Asian Economies * Dec 2005 Yushi Yoshida ** Faculty of Economics Kyushu Sangyo University * We would like to thank participants of the “WTO, China and the Asian Economies III” conference at Xi’an Jiatong University and Japanese Economic Association Conference at Chuo University, especially Chul Chung, Li Chuntao, Shujiro Urata and Yiping Zhu for their insightful comments. ** Yushi Yoshida, 2-3-1 Matsukadai, Higashi-ku, Fukuoka, 813-8503 Japan. e-mail: [email protected]
Transcript
1
revised
Outsourcing of Intermediate Manufacturing Products
in Asian Economies*
Dec 2005
Yushi Yoshida** Faculty of Economics
Kyushu Sangyo University
* We would like to thank participants of the “WTO, China and the Asian Economies III” conference at Xi’an Jiatong University and Japanese Economic Association Conference at Chuo University, especially Chul Chung, Li Chuntao, Shujiro Urata and Yiping Zhu for their insightful comments. ** Yushi Yoshida, 2-3-1 Matsukadai, Higashi-ku, Fukuoka, 813-8503 Japan. e-mail: [email protected]
2
Outsourcing of Intermediate Manufacturing Products
in Asian Economies
Dec 2005
[Abstract] We aim to investigate transition and trend of outsourcing production among Asian Economies. With the use of highly-disaggregated Harmonized System (HS) classification code dataset, we can investigate narrowly-defined intermediate manufacturing products within automobile industry. By calculating unit value of intermediate products, we created the quality rankings of products among these countries. After making clear recent trend for production of intermediate products in Asian countries, we investigate whether these trends are autonomous or Japanese-FDI related. We find investments by automobile suppliers increase automobile component trade in the region. Keywords: Asian Economies, Automobile Industry, Component Trade, Fragmentation, Outsourcing, JEL classification codes: F14(Country and Industry Studies of Trade), F21(International Investment) L62(Automobiles, Other Transportation Equipment)
3
1. Introduction
Table 1 presents the shares of Japan, the Asia and the US in the exports of
the Asian countries for the period between 1990 and 2000. We can see that US and
Japan have been taking prominent roles in purchasing products from Asian economies.
In 2000, the share of the US as the export destination ranges from 14 percent
(Indonesia) to 30 percent (the Philippines), while that of Japan as the export destination
varies from 6percent (Hong Kong) to 23percent (Indonesia). For the Asian economies,
regional trade is also important along trades with the US and Japan. The share of the
Asia as a region for exports ranges from 25 percent (Philippines) to 42 percent (Hong
Kong).
However, these aggregate data only reveal partial picture of complicated,
multinational trade dynamics among Asian countries. It is well documented that more
productions are internationally fragmented, or outsourced, that is some parts of
production process are shifted outside of national boundary from developed economy’s
point of view, see Yeats (2001). From developing countries side, it is direct increase in
intermediate production and consequently increase in intermediate exports.
Fragmentation of production process allows a firm to locate parts of production
in regions where intensively used factors are available at lower cost. At the same time,
a firm faces extra cost incurred for “service links” among physically dislocated
production sites, see Jones (2000). By a dramatic reduction in information and
communication cost across borders in recent years, we observe on-going expansion of
international fragmentation of process and a consequent rise in the volume of
international inter-industry trade.
The direct empirical examination of outsourcing is not straightforward because
4
outsourcing data is not readily available. For example, Swenson (2005) uses US
offshore assembly program (OAP) data to examine the extent of overseas assembly
which uses the US components and ship value-added products back to the US. From
the OAP trade data, however, assembly by independent foreign firms and assembly by
subsidiary firms can not be distinguished. Outsourcing always involves fragmentation
of production process; however, it does not go the other way around.
Locations of production for some industries have moved around the world as
firms constantly searched better production sites in terms of cost reduction. For a well
cited example, productions of textile and apparel industry have shifted from North
America and Western Europe, first to Japan, then to the ‘Big Three’ Asian apparel
producers (Hong Kong, Taiwan and Korea), and finally to China and Southeast Asian
countries, see Gereffi (1999)1.
A more interesting and more complex example involves continuous expansion
of production locations for automotive industry. In 2002, 23 countries are producing
more than 100,000 units of automobiles2. More countries are also involved in
supplying automobile parts. It is also well documented in automobile industry that
complex global production networks involve intra-industry trades both at the levels of
final products and intermediate products.
In this paper we aim to investigate exports of finely disaggregated intermediate
products among the Asian economies, including Japan. Namely, we focus on exports
of parts and components for automobiles. We examine the recent growth in trades for
1 The objective of Gereffi (1999) is, however, to explain the production shift in 1990’s to higher wage countries by industrial upgrading. 2 Fourin (2004) reports automobile productions for the following countries; US, Canada, Mexico, Brazil, Argentina, Germany, France, Italy, UK, Spain, Belgium, Portugal, Sweden, Czech, Turkey, Japan, Korea, China, India, Taiwan, Thailand, Malaysia, and Indonesia.
5
automobile components among the region. Among 28 categories for automobile
components, we observe the trend in recent years that more countries in the Asia
participate in global automobile production network and the Asian countries increases in
the variety of production for automobiles components.
We also examine on the changing roles in component exports among the Asian
economies. By comparing unit prices among the Asian exporters, we can presumably
rank the quality of their exporting products. Qualities of automobile products
measured by unit price are shown to reveal head-to-head competition for one group of
products and are ranked among the Asian economies for other groups of products.
Then we investigate whether these changes are brought by the production
growth of local firms or led by multinationals’ direct investments in these countries.
The production processes for automobiles are highly fragmented and most of the
processes are outsourced to components suppliers. In our empirical examinations we
distinguish foreign direct investment by automobile makers from FDI by automobile
component suppliers. We present empirical evidence that automobile makers’
investments in importing country and automobile suppliers’ investments in both
exporting and importing country increases components trade in the region.
We also find some evidence for two important effects of foreign direct
investments in China; the growing role of China as assemblers and the spillover effect
of components production in China. When trade flows are restricted only to bilateral
trade between Japan and the Asian economies, we find that the only significant effect of
FDI is shown to be suppliers’ investments on exports of the Asian economies to Japan.
This result is clearly consistent with the recent important development of fragmentation
and outsourcing in international trade literature.
6
This paper is organized as follows. In next section we review and discuss the
complex production networks for automobile industry among the Asian economies.
We describe the dataset used for empirical investigation in section 3. Section 4
investigates if quality ladder among the Asian economies has changed in recent years.
In section 5, we investigate whether these changes are based on the autonomous growth
of local manufactures or led by multinationals’ investments. Section 6 summarizes the
study’s findings and conclusions.
2. Automobile industry: car manufactures and parts suppliers in Asian economies
With cross-border investments in foreign competitors, mergers and acquisitions
formed several global giant automobile groups. These are General Motors group, Ford
group, Daimler Chrysler group, Toyota group, Volkswagen group, and Renault/Nissan
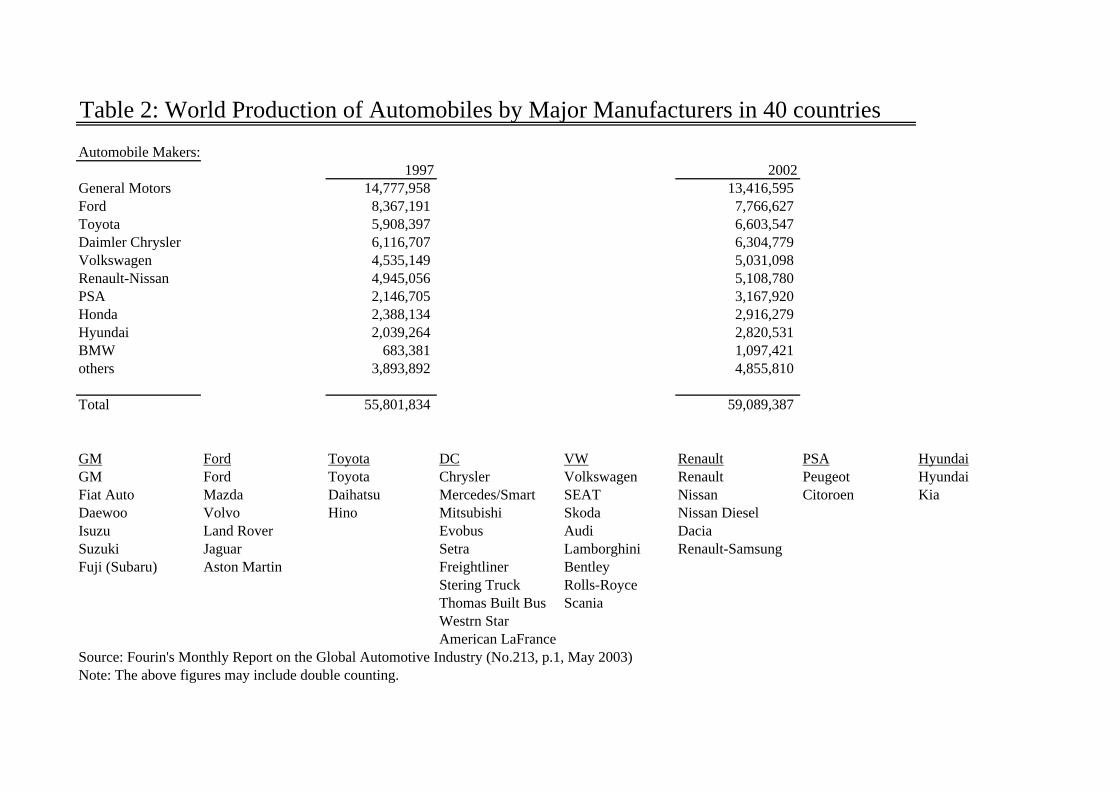
group.3 Table 2 provides recent production by these groups and lists major affiliates
for these groups. These car manufacturers develop multinational production networks
throughout the world.
Reflecting the expansion of global production strategies of multinational
manufacturers and the emergence of local manufacturers, Japan and eight Asian
economies as the region produced 12.6 million units of automobiles in 1984 and came
close to double its production to 21.1 million units in 2003, see table 3. These eight
Asian economies include Korea, China, Taiwan, India, Thailand, Malaysia, Indonesia,
and Philippines. The increase in automobiles production in the region came from
these non-Japan Asian economies; production in Japan actually decreased about one
million during the sample periods. Main contributions go to China, Korea and India, 3 Other major automobile manufactures includes Peugeot group, Honda, Hyundai/Kia, and BMW.
7
each respectively increased 4.1 million, 2.9 million and 1 million units between 1984
and 2003.
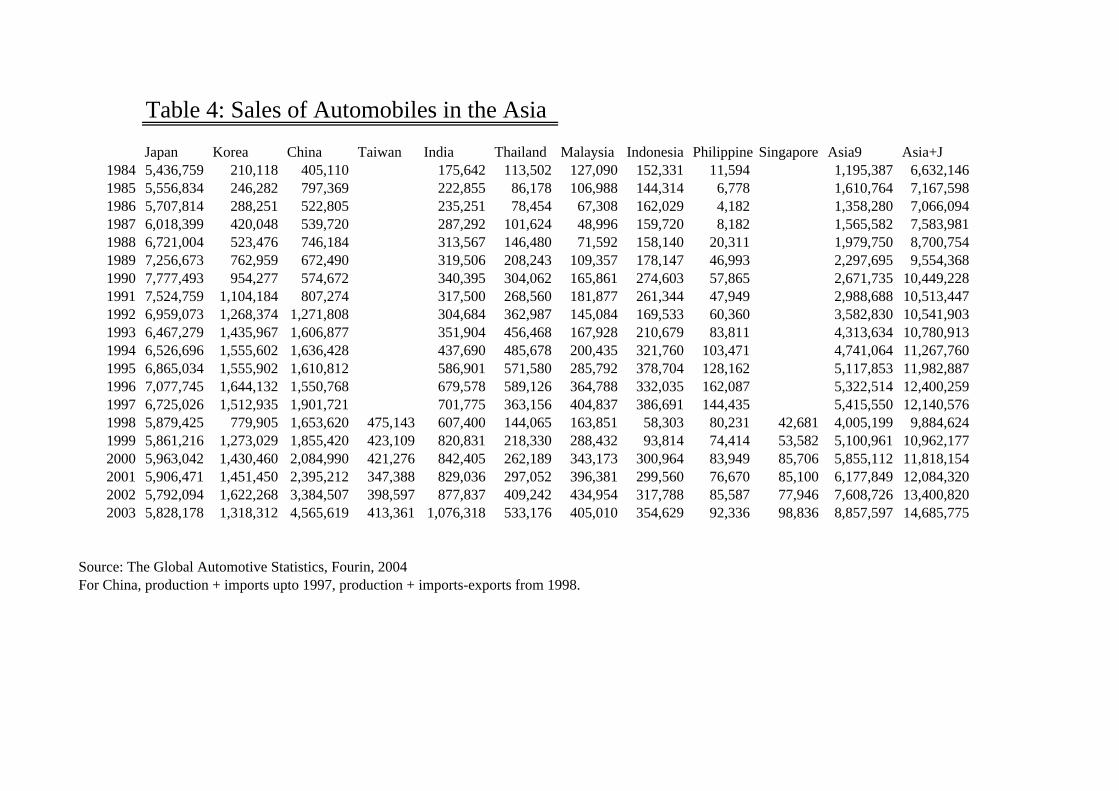
Sales in the region increased from 6.6 million in 1984 to 14.7 million in 2003,
see table 4. While sales in Japan are not much different at beginning and end of the
sample, China increased sales about 4.1 million and India increased about 0.9 million
units. These figures closely matches with their national production, reflecting the fact
automobile imports are restricted in these countries. Sales increase was also large in
Korea, about 1.1 million; however, it does not match with increase in Korean
production, reflecting export promotion strategy of Korean automobile manufacturers.
Developing countries often give automobile industry the highest priority for
national development strategy. These policies include import restrictions, limited
foreign ownership and local contents requirements among other measures. For
example, Philippines introduced in 1986 Motor Vehicle Development Program which
required automobile assembling manufactures 35 to 40 percent of content procurements
locally. Due to this local content requirement, automobile parts suppliers started to
operate in Philippines.
On the other hand, Taiwan reviewed previous automobile policy, which aimed
to keep out foreign manufactured cars from Taiwan, in 1985. The Taiwan government
declared that tariff on automobiles would be eventually reduced to 30% from 65% and
local content requirement to 50% from 70%. The Taiwan government also welcomed
investments and technology transfers from foreign countries. This is called New
Automobile Industry Development Project.
China had two strict regulations for automobile makers to establish assembly
subsidiaries/plants in China. One is to keep foreign ownership no more than 50
8
percent and limits joint ventures up to maximum of two firms for each international
automobile makers. The other is on local content requirement. However, regulation
on local content requirement was lifted upon accession to a WTO membership.
These protective measures seemed to successfully foster the growth of
automobile manufactures in China 4 . Now in China, there are more than 100
automobile makers, both purely local and joint ventures with foreign makers. The top
ten automobile makers in terms of sales in 2003 are China FAW Group Corporation,
Shanghai Volkswagen Automotive Co., Ltd., Dongfeng Motor Co., Ltd.,
Coupled with the national protective measures in automobile industry, we
observed multinationals constant search for optimal locations to outsource parts of their
production process formed complex regional production network in the Asia. As a
consequence, intra-industry trade for automobile industry among the region has
increased rapidly. We will examine more closely these intra-industry trade in the
following sections.
3. Data Description
Harmonized System (HS) classification code defines traded goods with
corresponding 6-digit codes. Each country is left with discretion of further
4 We can also observe emergence of local automobile makers in India and Malaysia.
9
disaggregation with additional digits after universal 6-digit codes. 5 The United
Nations Commodity Trade Statistics database (UNCOMTRADE) collects trade data at
HS 6-digit level from 130 countries including non-OECD countries. Moreover,
Ministry of Finance (MOF), Japan, provides more finely disaggregated 9-digit trade
data. These finely disaggregated data are optimal for our empirical object, however,
these data not readily available for non-OECD countries.
In section 4, we use MOF data due to its superiority in data disaggregation
because we examine unit price for each category of automobile components. If
products are more broadly defined, more likely it is to be biased. In section 5, however,
we turn to UNCOMTRADE data for its broader coverage for bilateral trades among the
Asian economies. MOF data only covers trade directly associated with Japan.
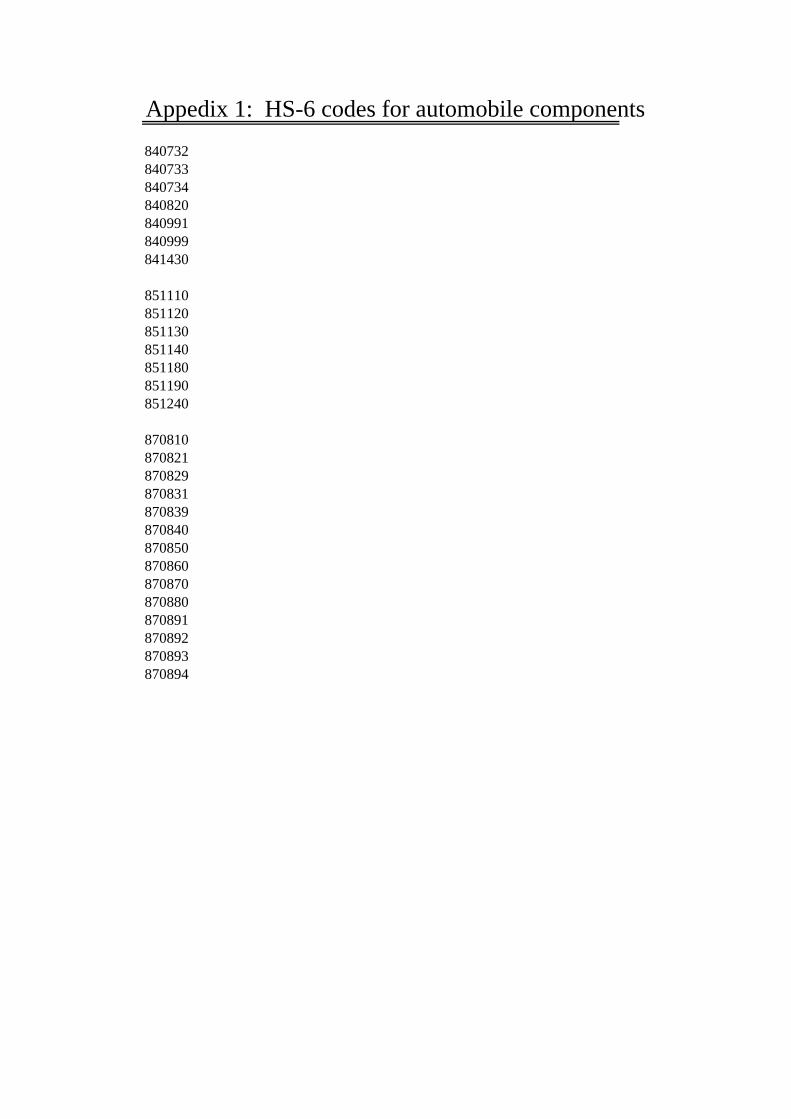
For our investigation, “8708” subsection represents parts and components for
automobile and other transportation equipment and contains 17 subcategories. Under
the subheading of Machinery “84” and Electrical Appliances “85”, there are parts
related to automobiles, seven subcategories in each. Appendix 1 contains list of
definitions for these 31 subcategories. Exports data are collected for each pair among
nine economies; Japan, China, Hong Kong, Korea, Indonesia, Malaysia, Philippines,
Thailand, and India6,7.
Overseas Japanese Companies Data (OJCD), Toyo Keizai, provides detailed
data for over 20,000 Japanese subsidiaries. These subsidiaries are described for host 5 For example, Japan uses 9-digit codes whereas US uses 10-digit coding systems for trade accountings. For Japanese data, Ministry of Finance (MOF) provides downloadable monthly-organized data files on its website. For US data, Bureau of Census (BOC) also provides monthly CD-ROM datasets. 6 From 1992 to 1995 for Philippines we used imports data from other eight economies to construct Philippine exports although we sometimes observed large discrepancies, which can not be explained by CIF/FOB difference, between export and import data. 7 As an importing country only, we also included the US.
10
country, object of investment, industry, established year, invested capital, parent
company among other information. From OJCD, we extract these subsidiaries
associated with automobile industry. We further distinguish these subsidiaries between
makers and components suppliers. Therefore, our foreign direct investment data is
represented by the accumulated number of subsidiaries for each year in each country.
Annual units of automobile production for 23 countries are provided in Fourin
(2004). Automobile production in the Asian economies is summarized in our table 3.
4. Changing roles for Intermediate Productions in the Asia
In this section we restrict our attention to exports of the Asian countries to
Japan in order to examine the recent development in automobile components production
in the Asian economies. One reason to use MOF data in this section is the fact that we
observed large discrepancies for COMTRADE datasets from comparisons of same trade
from the report of exporting country and importing country. The advantage of using
MOF data is the general reliability of reports from importing country because of more
strict enforcement is imposed for tariff collection. For the purpose of comparing
exporting countries, it is well-suited to use only one reporting country in order to avoid
some reporting country’s bias.
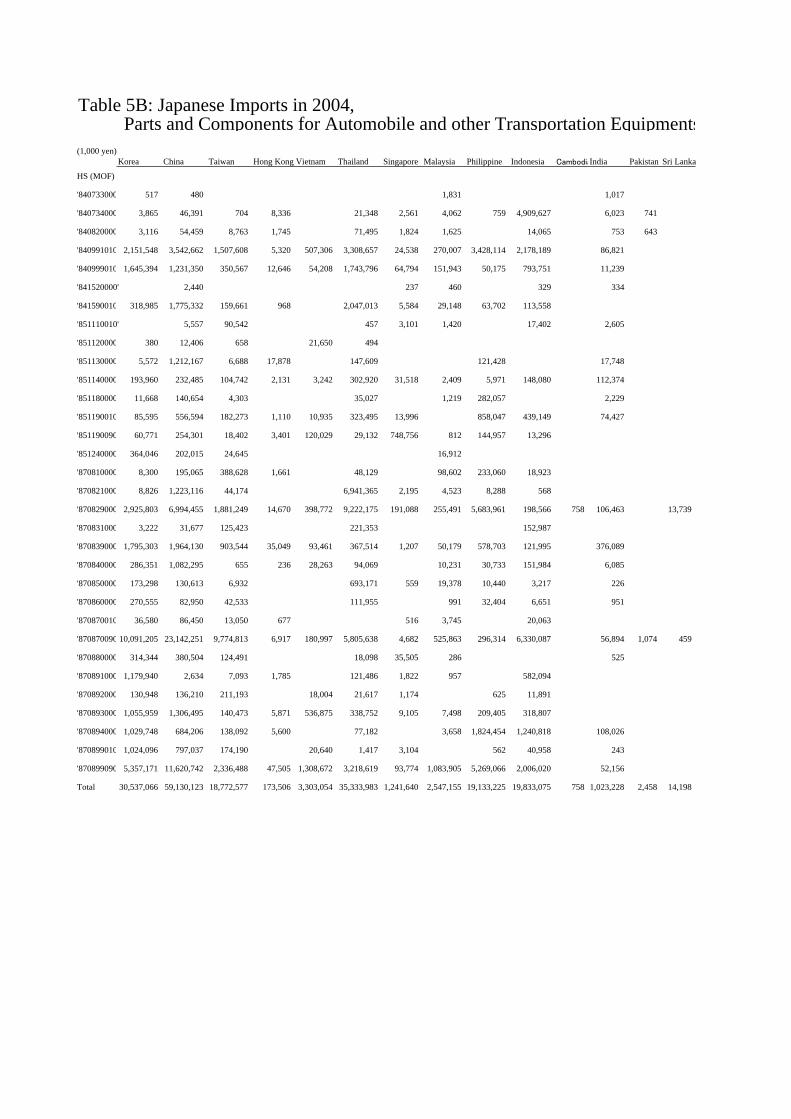
Table 5A and 5B present value of exports for subcategories of automobile parts
and components for Asian economies in 1988 and 2004 respectively 8 . From
comparing two tables, we find outsourcing in Asia has gone through dramatic changes
during this period. First, number of Asian economies participating in fragmentation of
Japanese automobile production became larger, from 11 countries to 14 countries. 8 Due to the occasional changes in HS coding, HS codes in two periods do not match exactly. Please see the appendix for the definitions of HS codes used in this study.
11
(Myanmar dropped and Vietnam, Cambodia, Pakistan and Sri Lanka joined.) Many
countries are participating in producing for more variety of intermediate products in
2004. Most of Asian economies are producing same products under very finely
classified category in recent years.
In 1988 Korea and Taiwan represents the two largest automobile component
exporters to Japan, 3.4 billion yen for Korea and 3.7 billion yen for Taiwan. Exports
from China and Hong Kong combined come only slightly above one percent of exports
of these two countries. In 2004 China emerges as the largest automobile components
exporter for Japan with the traded value of 59 billion yen. The second largest exporter
of automobile components is Thailand with 35 billion yen. From these tables alone,
we can observe how outsourcing strategy of Japanese automobiles production has
evolved in recent years.
At the early stage of developing automobile industry in the Asian economies,
there were only a few categories a country can produce and export facing competition
from neighboring countries. As the industry in a country accumulates skilled labors
and acquire technologies, the variety of products for production increases. Figure 1
represents the number of automobile components exports for 11 Asian countries. As
Korea and Taiwan have been exporting almost all categories from 1988, the rest of
Asian countries stated from 3 (India and Philippines) to 15 (Singapore) categories in
1988 and expanded to export 19 (Hong Kong) to 32 (China) categories.
For better understanding interactions of intermediate export data among Asian
economies, we calculate unit price from MOF. The MOF reports both values and
quantity for each partner country. We calculate unit price from the ratio of traded
value to traded quantity, shown as equation (1).
12
tji
tjitji Q
VP
,,
,,,, = (1)
, ,i j tP is unit price, tjiV ,, is export value and tjiQ ,, is export quantity. Subscripts
denote country i, for component product j in year t.
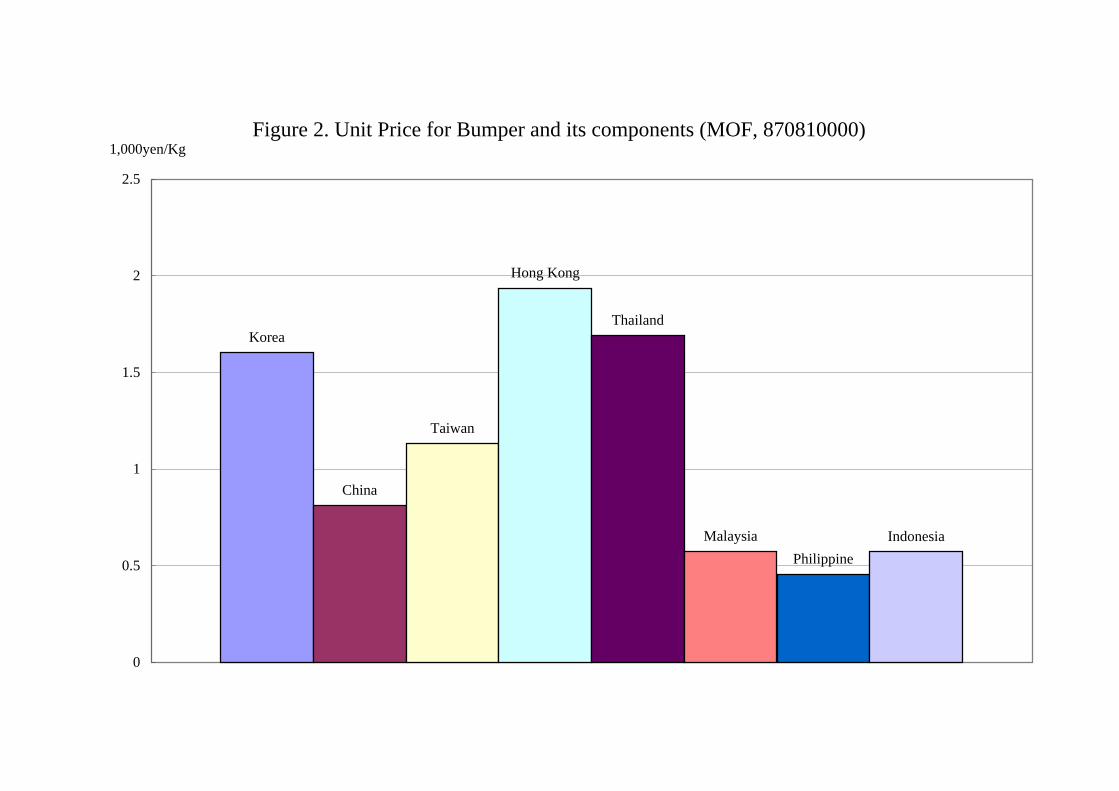
There is one caveat for interpretation of unit price index as an indicator for
quality for products. We have to note that even within this most disaggregated trade
category there is heterogeneity in products. If the products are so narrowly defined
such as 3.5 inch floppy disk then difference in unit prices are reflecting quality of
products if there is no market distortion. However, definitions in intermediate
products in automobile and other transportation equipments are not that specific. For
example, “870810000” in MOF code is “bumper and its components,” which does not
distinguish the corresponding size of automobiles. This category includes bumpers for
both compact car and large-scale truck. Of course, a bumper for larger size automobile
should cost higher because of more use of raw materials. However, using metric
weight for denominator should mitigate this bias. Figure 2 represents Japanese import
unit prices for bumper and its components from Asian economies in 2004. Hong Kong,
Thailand, and Korea export high price bumper and its components (relative to amount
of material used), whereas Malaysia, Indonesia and Philippines export low price
products.
In order to capture the dynamic changes in quality of exports from the Asian
countries, we ranked unit price for each category from highest to lowest in each year9.
9 There are some researches which compare import unit price with export unit price to determine whether a product can be classified as vertical intra-industry trade, see Ando (2005) for an example.
13
The highest price is scored as 11 and score decreases as ranking lowers. If a country
does not export for a particular category, score of 0 is assigned. Then these ranking
scores are summed for each country in each year. The summed ranking score for a
country increases if a country expands variety of exporting products and/or climbs the
quality ladder in each exporting products. Figure 3 represents unit-price ranking for
all automobile components exports for the 11 Asian economies.
The most striking feature is that we can observe convergence among the Asian
exporting countries. Countries with lowest ranking scores in 1988 were Philippines
and India. China, Malaysia, Thailand, Hong Kong, Indonesia belong to the second
lowest ranking group in 1988. All these countries raised ranking scores in recent years.
The highest ranking group in 2004 includes Korea, Taiwan, Thailand, China, Singapore
and Malaysia. The second ranking group consists of Hong Kong, Indonesia,
Philippines, and India. Vietnam is still far below the rest of the Asian countries.
5. Autonomous Production or FDI-led Production?
Having observed changes in automobile components trade among the region in
the previous section, we aim to answer empirically very important question, i.e.,
whether these changes in the region are the results of autonomously chosen strategy by
domestic exporting firms in the Asian economies or foreign multinationals business
strategies to reallocate production plants in the region.
Straightforward way to investigate this question is to regress export values in a
panel regression equation on foreign direct investment data as an explanatory variable
along with other control variables as in equation (2).
The dependent variables is the value of exports, EXi,j,k,t. Subscripts are for exporting
country, i, importing country, j, component product, k, and time, t. Foreign direct
investments are distinguished between investments in exporting countries, FDIXi,t and
importing countries, FDIMj,t. Country dummies and commodity dummies are
respectively captured by iλ and kμ . Control variables are included as a Z vector
and tkji ,,,ε represents the disturbance term.
Relationship between exports and FDI in destination country is investigated in
the number of researches, see Belderbos and Sleuwagen (1998), Clausing (2000),
Blonigen (2001) and Head and Ries (2001). These papers all focused on
substitution/complimentarity relationship between exports of a country and FDI by that
country. In our framework we capture this effect in M0α . Theoretical framework for
relationship between exports and FDI in exporting country is called export-platform
FDI in the literature. The seminal work in this literature is Motta and Norman (1996)
who investigate various patters of investment strategies by multinational firms in a
game theoretic three-country framework. Other important works include Neary (2002),
Yeaple (2003), Ekholm et al. (2003) and Grossman et al. (2003). Ito and Yoshida
(2006) provides empirical evidence that inward FDIs in exporting country promote its
exports. In our framework this effect is captured in X0α .
Although the use of foreign direct investment at this aggregation is very
common; however, the expected effect of foreign direct investments are different
whether investments are made by automobile makers or automobile components
suppliers. Our data source allows us to distinguish foreign direct investments between
automobile makers and automobile components suppliers. Now we have four FDI
15
variables according to whether export or import and whether makers or component
suppliers as in equation (3).
tkjitkjitj
Mti
X
tjM
tiX
kitkji
ZPartsFDIMPartsFDIX
FDIMMaFDIXMaEX
,,,,,,,,
,,,,,
kerker
εδββ
ααμλ
++++
+++=(3)
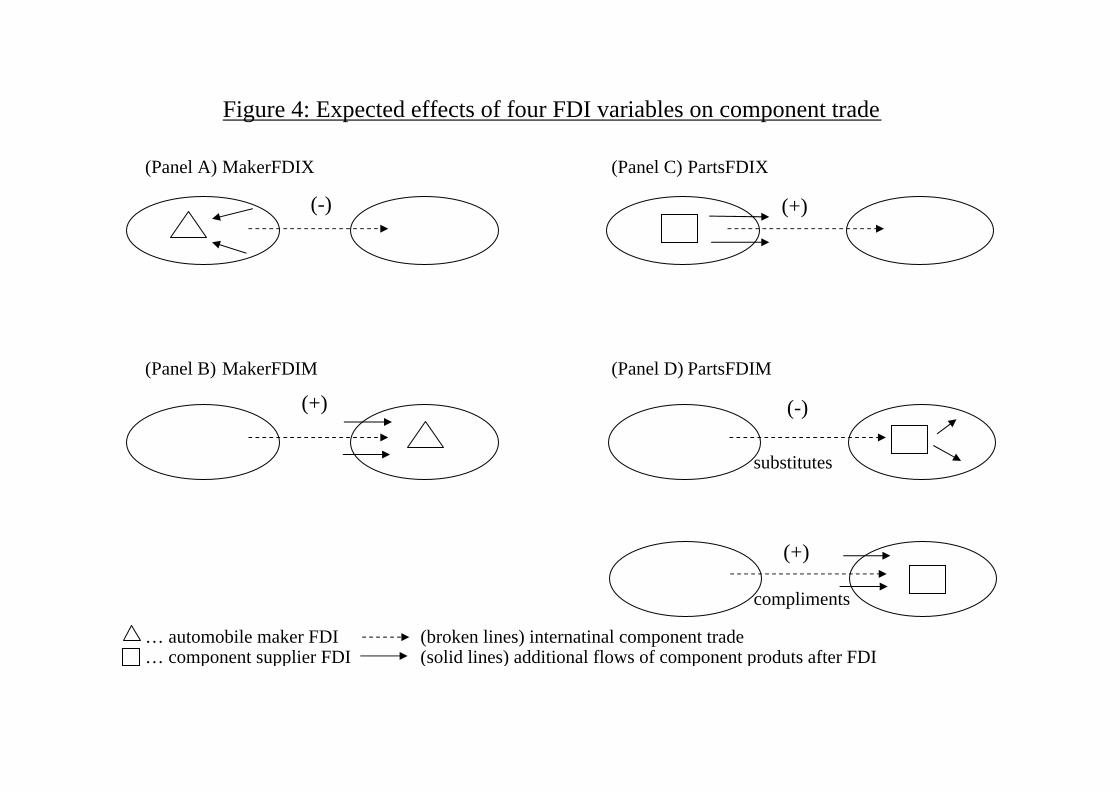
Expected effects of these four FDI variables on international component trades are
summarized with simple diagrams in figure 4.
In panel A, direct investment in an exporting country by makers, MakerFDIX, is
very likely to discourage component exports because the new plant may procure
component produced domestically, therefore reducing export capacity.
The effects of MakerFDIM and PartsFDIX on component trade are very clear.
In panel B, direct investment in an importing country by automobile makers,
MakerFDIM, promotes component exports to that recipient country because an increase
in automobile production in importing country creates additional demand for
components. In panel C, direct investment in an exporting country by component
suppliers, PartsFDIX, also increases component exports due to an increase in
production capacity. If export is directed to Japan, associated direct investment is
classified as vertical FDI. On the other hand, if export is directed to other countries,
associated direct investment is called as export-platform FDI
The effect of PartsFDIM on component trade can be ambiguous. In panel D,
direct investment in an importing country by component suppliers, PartsFDIM, are
described in two cases. Top figure in panel D presents the case for high substitution
relationship between component FDI and component trade. For example, the effect is
obviously negative for engine trade if FDI is to establish a new plant for engine
16
production. However, expected sign might be reversed if there are complimentary
relationship between FDI and trade. Although our direct investment variable is more
disaggregaed than those used in previous studies, PartsFDIM still includes different
automobile component products. For example, gear box exports from other countries
might be induced if a new plant for drive axels is established in one country in the
region.
A. General results
For the exporting countries, eight Asian economies and Japan are selected.
For destination or importing countries, the US is included in addition to those selected
nine exporting economies. As control variables, we use the units of automobile
production, PROD, in importing countries and time trend, TREND. First, foreign
direct investments are constructed as accumulated number of Japanese subsidiaries
combining both automobile makers and automobile components industry as in equation
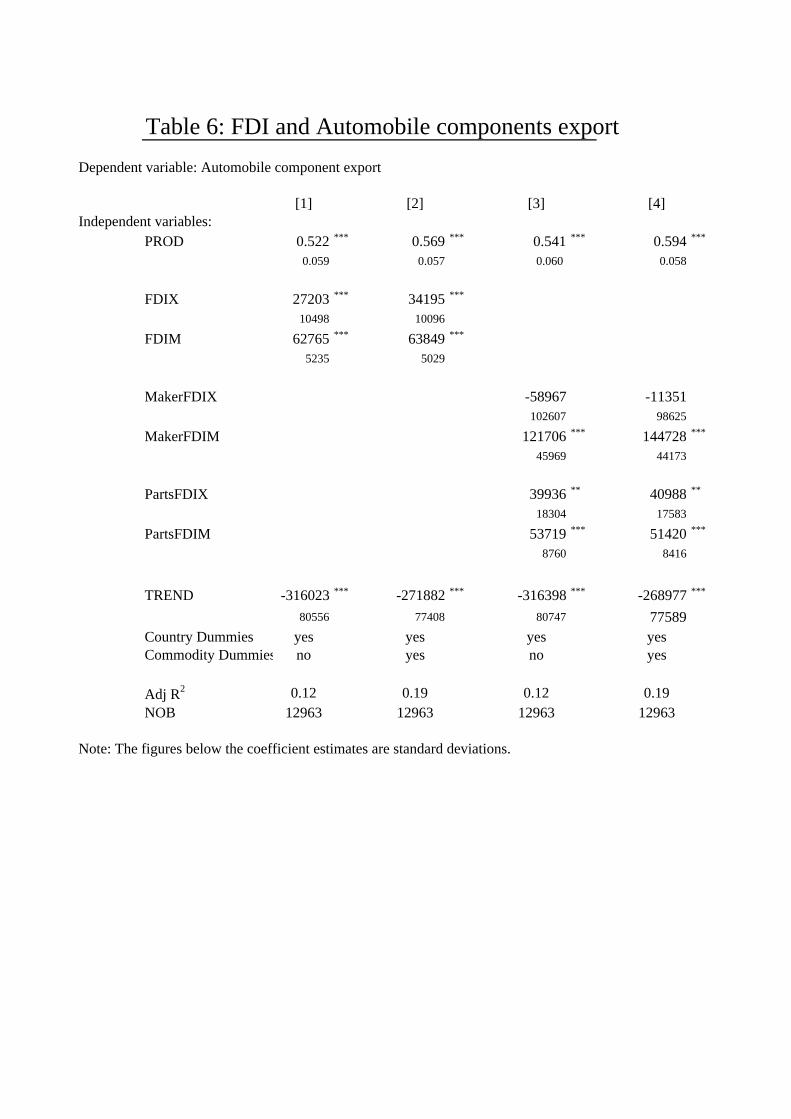
(2)10. The first two columns in table 6 show that automobile component exports are
positively linked with foreign direct investments in both exporting country and
importing country. If our analysis stops here, we might interpret the results to
conclude that component trade is always promoted by FDI in trading countries
notwithstanding whether it is in importing country or exporting country. However, this
result needs to be interpreted with qualifications.
The last two columns in table 6 provide that automobile makers’ investments
in exporting countries, MakerFDIX, do not promote automobile components exports
from these countries whereas other investments raise component exports. The 10 We should note that our results in the followings need to be interpreted with the caution because we do not observe any Japanese FDI in Japan.
17
expected sign of MakerFDIX is consistent with the estimators in table 6 although it is
not statistically significant. Ambiguity for the effect of PartsFDIM in figure 4 leaves
it to a pure empirical question. The result seems to suggest that complimentary effect
is overwhelming at the level of aggregation for current FDI variable construction. The
one last noteworthy point is that difference in the size of estimators for FDI between
makers and component suppliers. Because our FDI is constructed as the number of
subsidiaries instead of value of subsidiaries, the size difference in FDI between two
groups are captured in estimated coefficients. For the importing country, FDI by
automobile makers increase component trade by two to three times more than FDI by
component suppliers.
Other important parts of the regression results can be summarized as the
followings. First, productions of car units in importing countries, PROD, appear
always significant and positive. Second, after controlling foreign direct investments
and automobile productions, we observe significant downward trend in component
exports. It is very difficult at this stage to provide a reasonable interpretation of this
downward trend; however, we can present a partial answer in the immediately following
subsection. Third, commodity dummies appear to increase substantially the fitness of
regression as observed in adjusted R-squared. We will always include both country
and commodity dummies in the following analysis.
B. China effects
We have already observed recent rapid growth of automobile industry in China.
Chinese automobile production became the fourth largest in the world following the US,
Japan and Germany. We now turn to examine whether investments in China have any
18
significant effect on exports of other Asian economies within the region not involving
China. This is to say, for example, that we estimate the impact of investment in China
on Indonesian export to Thailand. Table 7 presents estimation results for automobile
components exports with Chinese FDI variables in addition to previous regressions.
For this analysis we exclude China from both exporting and importing countries from
the original sample. Because the number of observation is reduced due to exclusion of
trade with China, in the first column we rerun the previous regression with reduced
sample for the comparison purpose.
Interestingly, when we drop China from the sample, automobile makers FDI
becomes statistically insignificant. This result combined with column [4] in table 6
indicates that makers FDI in China promotes component exports of other Asian
countries to China while makers FDI in other Asian countries do not impose a
significant effect on component exports. This is the first asymmetry we observe in this
study between China and the rest of the Asian economies.
The second column shows that FDI in China significantly affect automobile
components trade between other Asian economies. First, establishments of new plants
in China by Japanese makers discourage automobile components trades among other
economies in the region while new plants for components in China promote
components trade between other Asian economies. This negative effect on trades in
the region can be interpreted as production shift of final assembly. As final production
process is shifted to China from other Asian countries, demand for components
decreased because some of assembly plants are shut down or used for other functions.
We interpret this result as the growing role of China for assemblers.
Second, new plants for component suppliers FDI are shown to be significantly
19
positive. This result might be demonstrating the spillover effect of expansion of
components production in China. Increase in production for one category of
automobile components in China increases demand for related components in the region.
Then increases in production of these related components in each Asian economy
further create new demand for other parts from neighboring countries.
We also note that, in the second column, the estimated coefficient of TREND is
no longer negative. Previous statistically significant negative estimates are very likely
to be driven by the lack of inclusion of MakerFDICHN in the regressions.
C. Japanese trades
We now turn our attention to the trade between the Asian economies and the
second largest world automobile producer country, namely Japan. Here we restrict our
investigation for the Asian trades to only those with respect to Japan. This analysis
can reveal only partial segment of trade in the region but it is more suitable with our use
of only Japanese FDI data.
Since we use only Japanese investments data for FDI variables in this empirical
investigation, we are restricted to use asymmetric structure for estimating trade
equations between Japan and the Asian countries. For the export of Japan, FDI in the
Asian countries are represented as MakerFDIM and PartsFDIM. On the other hand,
we do not have corresponding FDI variables for the exporting country. On the import
for Japan, appearance of FDI variables is just reversed.
On the Japanese export side, Japanese automobile components export are
shown not to be related with Japanese outward bilateral FDI. The first column of table
8 shows FDI by both automobile makers and components suppliers are not statistically
20
significant. This result is in stark contrast with the work of Blonigen (2001). He
finds that Japanese suppliers’ production in the US discourages Japanese exports;
however, we found that Japanese suppliers’ FDI in the Asian economies does not affect
Japanese exports. Comparisons of our work with Blonigen (2001) provides
confirming evidences that horizontal FDI in developed country and export-platform/ or
vertical FDI in developing country are quite different in nature. Our work
complements the work of Blonigen (2001) in this sense.
For the Japanese import side, i.e., automobile component exports from the
Asian economies, the maker-supplier distinction of Japanese outward FDI shows an
interesting result. Automobile makers’ investments do not increase exports of
components products, while suppliers’ investments do raise exports of these countries.
The second column 11 of table 8 shows investments by components suppliers is
statistically significant at one percent level. This result is clearly consistent with the
recent important development of fragmentation and outsourcing in international trade
literature.
6. Conclusions
One novelty in this paper is that we clearly distinguished between final product
and component product in the same industry for both trade and foreign direct
investment. The other novelty is use of FDI in both exporting country and importing
country for explaining bilateral trade. Two previous papers come partly close to our
framework. Belderbos and Sleuwaegen (1998) investigates the effect of FDI on
product level exports in electronics industry. They distinguish between distributional 11 We excluded TREND variable for Japanese import equation to avoid possible multicolinearity with PROD, which in this case represents only Japan.
21
subsidiaries and manufacturing subsidiaries in empirical examination, but not between
component subsidiaries and maker subsidiaries. On examining the effect of Japanese
automobile production in the US on Japanese exports to the US, Blonigen (2001)
distinguishes between makers’ production and suppliers’ production. However, FDI
data is used only on importing country’s side.
The direct evidences of role-changing among the Asian economies are
presented. The variety of automobile components exports increased for each Asian
economy. While Korea and Taiwan have been exporting almost all categories for
automobile components in our sample period, China and Thailand remarkably
quadrupled their exports variety. Qualities of automobile products measured by unit
price are shown to reveal head-to-head competition for one group of products and
differentiated quality among the Asian economies for other groups of products.
The dynamic changes in the regional trade for automobile components are
investigated in a relation with foreign direct investments. We have presented empirical
evidence that automobile makers’ investments in importing country and automobile
suppliers’ investments in both exporting and importing country increases components
trade in the region.
In addition, we have examined growing presence of China in terms of
dominant inward investments by multinational firms in the industry. Establishments of
makers’ assembly plants in China discourage components exports to other countries in
the region. We interpret this result as the growing role of China for assemblers. New
plants for automobile components in China promote inter-regional components trades.
This result might be demonstrating the spillover effect of expansion of components
production in China. Increase in production for one category of automobile
22
components in China increases demand for related components in the region. Then
increases in production of these related components in each Asian economy further
create new demand for other parts from neighboring countries.
We also examined bilateral trade between Japan and the Asian economies.
Interestingly, the only significant effect of FDI is shown to be suppliers’ investments on
exports of the Asian economies to Japan. This result is clearly consistent with the
recent important development of fragmentation and outsourcing in international trade
literature.
Finally, we should note that our empirical results should be interpreted with
qualifications in our mind that we have only used Japanese FDI data. Further
investigations with thorough FDI data including US and European investment data will
be fruitful. However, our current empirical investigation is also important in the sense
that partial data of inflow of FDI into the Asian economies revealed substantial
relationship with automobile component trade among the Asia.
23
References: Ando, Mitsuyo, 2005, Fragmentation and vertical intra-industry trade in East Asia,
mimeo. Arndt, Sven W. and Keirzkowski, Henryk, 2001, Fragmentation: New Production
Patterns in the World Economy, Oxford, Oxford University Press. Belderbos, Rene, and Sleuwaegen, Leo, 1998, Tariff jumping DFI and export
substitution: Japanese electronics in Europe, International Journal of Industrial Organization, 16, 601-638.
Blonigen, Bruce A., 2001, In search of substitution between foreign production and exports, Journal of International Economics, 53, 81-104.
Clausing, Kimberly A., 2000, Does multinational activity displace trade?, Economic Inquiry, 190-205.
Ekholm, K., Forslid, R., and Markusen, J.R., 2003, Export-platform foreign direct investment, NBER Working Paper No. 9517.
Fourin, Fourin Monthly Reports on Global Automotive Industry, in Japanese, various issues from January 1992 to December 2003.
Fourin, 2004, The Global Automotive Statistics 2004 Edition, in Japanese. Fourin, 2004, Chinese Automotive Industry, 2004/2005, in Japanese. Gereffi, Gary, 1999, International trade and industry upgrading in the apparel
commodity chain, Journal of International Economics, 48, 37-70. Grossman, G., Helpman, E., and Szeidl, A., 2003, Optimal integration strategies of US
multinational Firm, NBER Working Paper No. 10189. Head, Kieth and Ries, John, 2001, Overseas Investment and firm exports, Review of
International Economics, 9(1), 108-122. Ito, Hiro and Yushi Yoshida, 2006, How do the Asian economies compete with Japan in
the US market, China exceptional? A triangular trade approach, forthcoming in Asia Pacific Business Review.
Jones, Ronald W., 2000, Globalization and the Theory of Input Trade, Cambridge, the MIT Press.
Motta, M and Norman G., 1996, Does economic integration cause foreign direct investment?, International Economic Review, 37(4), 757-783.
Neary, J.P., 2002, Foreign direct investment and the single market, The Manchester School, 70(3), 291-314.
Swenson, Deborah L., 2005, Overseas assembly and country sourcing choices, Journal of International Economics, 66, 107-130.
Yeaple, S.R., 2003, The complex integration strategies of multinationals and cross
24
country dependencies in the structure of foreign direct investment, Journal of International Economics, 60, 293-314.
Yeats, A. J., 2002, Just how big is global production sharing?, in S. W. Arndt and H. Kierzkowski ed., Fragmentation: New Production Patterns in the World Economy, Oxford, Oxford University Press.
GM Ford Toyota DC VW Renault PSA HyundaiGM Ford Toyota Chrysler Volkswagen Renault Peugeot HyundaiFiat Auto Mazda Daihatsu Mercedes/Smart SEAT Nissan Citoroen KiaDaewoo Volvo Hino Mitsubishi Skoda Nissan DieselIsuzu Land Rover Evobus Audi DaciaSuzuki Jaguar Setra Lamborghini Renault-SamsungFuji (Subaru) Aston Martin Freightliner Bentley
Stering Truck Rolls-RoyceThomas Built Bus ScaniaWestrn StarAmerican LaFrance
Source: Fourin's Monthly Report on the Global Automotive Industry (No.213, p.1, May 2003)Note: The above figures may include double counting.
Table 3: Production of Automobiles in the AsiaJapan Korea China Taiwan India Thailand Malaysia Indonesia Philippine ASIA8 ASIA8+JPN