The European Journal of Comparative Economics Vol. 12, n. 2, pp. 79-131 ISSN 1722-4667 Available online at http://eaces.liuc.it Outward Foreign Direct Investment from BRIC countries: Comparing strategies of Brazilian, Russian, Indian and Chinese multinational companies Wladimir Andreff 1 Abstract An overall comparative study of outward foreign direct investment (OFDI) from BRIC countries and strategies conducted by multinational companies (MNCs) based in the BRICs is elaborated on with a same methodology for Brazil, Russia, India and China. The comparison pertains to the historical emergence of firms’ internationalisation, their booming expansion in the 2000s then their muddling through the current crisis, the specificities of OFDI from each home country, OFDI geographical distribution and industrial structure, econometric testing of the respective determinants of Brazilian, Russian, Indian and Chinese OFDI, and the role of home countries’ governments vis-à-vis home- based MNCs. Beyond some common characteristics, BRICs’ MNCs exhibit a number of major country-specific features. JEL: F21, F23, O57, P52 Keywords: foreign direct investment, multinational companies, emerging countries, BRICs, comparative economic studies Outward foreign direct investment (OFDI) from post-communist and fast- growing developing (emerging) countries started to increasingly draw attention in the early 2000s 2 . Since then, analysing foreign investment strategies of multinational companies (MNCs) whose parent headquarters are based in each BRIC country has actually become a fashioned avenue for research. The literature based on country case studies has been growing at a skyrocketing pace during the past decade, though overall comparative studies are still in the cradle; practically no one comparison samples all the four countries together 3 . Using a same methodology for comparing Brazilian and Indian MNCs (Andreff, 2014) then Russian and Chinese MNCs (Andreff, 2015) has facilitated an overall and systematic comparison of OFDI from all four BRICs presented below. Such comparison is of interest since Russia and China are transition countries while, at about the same time, India and Brazil have liberalised their economies without a post- communist systemic change. Any deep comparison between the four BRICs’ economies will find out so many disparities, sometimes more than similarities that the country grouping coined BRIC 1 Wladimir Andreff, Professor Emeritus at the University Paris 1 Panthéon Sorbonne, Honorary Member of the European Association for Comparative Economic Studies, Honorary President of the International Association of Sports Economists and the European Sports Economics Association, former President of the French Economic Association. 2 Among pioneering references: Andreff (2002 & 2003a), Chudnovsky and Lopez (2000), and Yeung (1999). 3 The comparison here is somewhat more extensive than those available in Duanmu and Guney (2009), Goldstein and Pusterla (2010), Milelli, Hay and Shi (2010), Pradhan (2011), Zhao (2011), De Beule and Van den Bulcke (2012), Kothari, Kotabe and Murphy (2013). Holtbrügge and Kreppel (2012) indeed cover all the four BRICs’ OFDI together though only with case studies of eight companies.
Transcript
The European Journal of Comparative Economics
Vol. 12, n. 2, pp. 79-131
ISSN 1722-4667
Available online at http://eaces.liuc.it
Outward Foreign Direct Investment from BRIC countries:
Comparing strategies of Brazilian, Russian, Indian and Chinese multinational companies
Wladimir Andreff1
Abstract
An overall comparative study of outward foreign direct investment (OFDI) from BRIC countries and strategies conducted by multinational companies (MNCs) based in the BRICs is elaborated on with a same methodology for Brazil, Russia, India and China. The comparison pertains to the historical emergence of firms’ internationalisation, their booming expansion in the 2000s then their muddling through the current crisis, the specificities of OFDI from each home country, OFDI geographical distribution and industrial structure, econometric testing of the respective determinants of Brazilian, Russian, Indian and Chinese OFDI, and the role of home countries’ governments vis-à-vis home-based MNCs. Beyond some common characteristics, BRICs’ MNCs exhibit a number of major country-specific features.
Outward foreign direct investment (OFDI) from post-communist and fast-growing developing (emerging) countries started to increasingly draw attention in the early 2000s2. Since then, analysing foreign investment strategies of multinational companies (MNCs) whose parent headquarters are based in each BRIC country has actually become a fashioned avenue for research. The literature based on country case studies has been growing at a skyrocketing pace during the past decade, though overall comparative studies are still in the cradle; practically no one comparison samples all the four countries together3. Using a same methodology for comparing Brazilian and Indian MNCs (Andreff, 2014) then Russian and Chinese MNCs (Andreff, 2015) has facilitated an overall and systematic comparison of OFDI from all four BRICs presented below. Such comparison is of interest since Russia and China are transition countries while, at about the same time, India and Brazil have liberalised their economies without a post-communist systemic change.
Any deep comparison between the four BRICs’ economies will find out so many disparities, sometimes more than similarities that the country grouping coined BRIC
1 Wladimir Andreff, Professor Emeritus at the University Paris 1 Panthéon Sorbonne, Honorary Member of the European Association for Comparative Economic Studies, Honorary President of the International Association of Sports Economists and the European Sports Economics Association, former President of the French Economic Association.
2 Among pioneering references: Andreff (2002 & 2003a), Chudnovsky and Lopez (2000), and Yeung (1999).
3 The comparison here is somewhat more extensive than those available in Duanmu and Guney (2009), Goldstein and Pusterla (2010), Milelli, Hay and Shi (2010), Pradhan (2011), Zhao (2011), De Beule and Van den Bulcke (2012), Kothari, Kotabe and Murphy (2013). Holtbrügge and Kreppel (2012) indeed cover all the four BRICs’ OFDI together though only with case studies of eight companies.
EJCE, vol.12, n.2 (2015)
Available online at http://eaces.liuc.it
80
may appear heterogeneous enough to contest that gathering the four countries together is relevant. In the same vein, the present paper unveils a number of significant differences between OFDI strategies conducted by MNCs from different BRICs, beyond some marked similarities. A sensible expectation would be to consider that Russian and Chinese MNCs, since they are based in two post-communist economies in transition toward some kind of state capitalism, should be closer in terms of OFDI strategies while Brazilian and Indian MNCs operating from freer market economies should have together more similar features and strategies that would differentiate them from their Russian and Chinese competitors. The outcome of the comparison led in this article does not entirely confirm such expectation: BRICs’ MNCs similarities and differences do not draw a clear-cut dividing line between transitional MNCs and emerging MNCs that emanate from more liberalized, though not fully-fledged, market economies like Brazil and India.
OFDI is compared across the BRICs first in terms of historical emergence (Section 1), then as regard how it has boomed in the early 2000s and is muddling through the current financial crisis (Section 2). Specificities of their MNCs’ strategies are pointed out (Section 3), including their geographical (Section 4) and industrial distribution (Section 5), as well as the respective determinants of their OFDI as they show up from surveying a sample of econometric tests (Section 6). Finally, the role of home-country government vis-à-vis home-based MNCs is differentiated (Section 7). Conclusion grasps some main comparative results (Section 8).
1. The emergence of multinational companies based in BRICs
Indian and Brazilian firms are known to have started up investing abroad earlier than Chinese and Russian MNCs. According to Lall (1983), the first OFDI from India occurred as early as 1962 with Jay Engineering Works setting an assembly line for sewing machines in Sri Lanka. Actually, the first one was the establishment of a textile mill in Ethiopia by Birla in 1955 (Saikia, 2012). Indian firms begun to significantly invest abroad in the 1960s, but India’s restrictive OFDI regime limited them to small joint ventures (JVs) in developing countries such as Kenya, Uganda, Nigeria, Malaysia Thailand and Sri Lanka. Liberalisation of OFDI policy pushed up Indian firms to invest abroad though under stringent conditions fixed by the state. A major objective of the new policy was to developing JVs rather than fully-owned subsidiaries. Indian OFDI was felt – by the government – as a tool for export promotion in the equipment goods industry. This drove market seeking OFDI primarily to neighbouring host countries, but also in the Middle-East and a few African countries, with a focus on countries having a significant number of people with Indian origins as local residents. Compared to other BRICs’ MNCs, the Indian ones have been benefiting from a first mover advantage4.
A classical presentation of India’s OFDI in historical perspective splits it into three phases (Hansen, 2010). The first phase (1970s-1980s) was mainly led by modest investments made in JVs in Asia and Africa and shaped by political and regulatory restrictive government policies. Some MNCs were partially or fully state-owned but
4 Major Indian MNCs in the 1980s were Birla, Thapar, Tata group, JK Group, Modi, Hindustan Machine Tools, Usha Martin Black, Kirloskar, Shahibag, Godrej, Larsen & Toubro, Sarabhai, Indian Tobacco, Mahindra & Mahindra, Nowrosjee Wadia, and Mafatlal.
W. Andreff, Outward Foreign Direct Investment from BRIC countries: Comparing strategies of Brazilian, Russian, Indian and Chinese multinational companies
Available online at http://eaces.liuc.it
81
most were held by Indian family capital though often in collaboration with public financial institutions. Second was a start-up phase (1990s-early 2000s) which was largely an outcome of more liberal government stance on FDI. Liberalisation of the Indian economy in the 1990s targeted inward and outward FDI since 1994. The number of Indian firms investing abroad grew up. The emergence of new Indian MNCs has been boosted by a preliminary substantial inward FDI of Western MNCs into India in tune with the so-called LLL - Linkage, Leverage, and Learning - approach (Matthews, 2002). Instilling spill-overs, incubators and learning by doing business with foreign investors in India have pushed the internationalisation of Indian firms. With the 1998-2002 downturn of the Indian economy, Indian firms internationalised their operations not only for survival but with specific strategies for sustained growth (Kant, 2008). The third was a take-off phase (after early 2000s) when Indian OFDI exhibited a totally different trend as compared to the previous two phases in terms of growth, industrial composition, and geographical orientation.
Brazilian companies started investing abroad in the 1970s. Domestic economic slowdown of the late 1970s and the 1980s’ crisis are main reasons mentioned by Brazilian entrepreneurs to explain this first wave of Brazilian OFDI; it played as a push factor for Brazilian firms to internationalise. Banks, engineering service firms and Petrobrás expanded their activities to bordering countries. Between 1975 and 1980, a dozen Brazilian MNCs had already emerged (Andreff, 1982). The Brazilian Central Bank data show that 54% of FDI outflows were concentrated in financial services in 1980. A strong presence of banking investments overseas was strategically targeted to support the expansion of Brazilian firms’ exports. Besides, first Brazilian MNCs were involved in industries such as oil exploration and production, construction and engineering, and a few manufacturing namely in the agro-food industry. Main destinations of Brazil’s OFDI were Latin America, Africa and the Middle East. Villela (1983) provides a list of the largest non-financial investors abroad in the 1980s5.
In the 1990s, large Brazilian companies have entered a new stage in their internationalisation process (Cyrino et al., 2010). OFDI flows soared as a consequence of deregulation, privatisation and trade liberalisation followed by new Brazil’s outward economic orientation. By the late 1990s, due to economic and institutional reforms, a growing internationalisation of Brazilian firms was registered; OFDI was triggered by a strategy of expanding business in foreign markets which has particularly developed after 2002, corresponding to a recovery of Brazilian economy from the 2001 crisis (Amal and Tomio, 2012).
Though lagging behind the emergence of Indian and Brazilian MNCs, Chinese MNCs held a first mover advantage compared to MNCs from all other transition economies, including those from Russia and Central Eastern European countries (CEECs). They have begun establishing subsidiaries abroad as early as 1979, primarily to open new export markets (Ye Gang, 1992). Since then they were ahead of Russian companies in investing abroad: OFDI from China in 1992 ($7,401 million) was of about the same magnitude as the one from Russia in 1998 ($7,385 million). Just like Indian MNCs, the growth of mainland China’s MNCs has been led by the LLL approach and
5 Such as Petrobràs (oil and gas), Copersucar (coffee), Mendes Junior (construction), Vale do Rio Doce (mining), Camargo Corrêa (engineering), Odebrecht (construction) and Brahma (beverages).
EJCE, vol.12, n.2 (2015)
Available online at http://eaces.liuc.it
82
past technology transfers from foreign MNCs resulting in productivity spill-overs to domestic Chinese firms. In a future last phase, it is expected that China’s OFDI would channel comparable transfers and spill-overs from China to developing countries (Lian and Ma, 2011). This should make Chinese MNCs more acceptable in this sort of host countries.
Former USSR opened up to inward FDI comparatively later, in 1987, and the LLL process did not operate in the 1990s given the bad domestic investment climate in Russia (Andreff, 1999a). So-called Soviet “red multinationals” (Hamilton, 1986) vanished nearly overnight in the wake of the USSR’s break-up and subsequent transformational recession. OFDI stock from the USSR fell from $699 million in 1990 down close to nil in 1992 and 1993. Paradoxically, number of Russian firms spontaneously transformed into MNCs overnight simply because they were located in more than one former Soviet republic. Since these republics obtained the status of new independent states by end of 1991 or in 1992, a same company located in two or more former Soviet republics – it was often so under central planning - became all at once a so-called “born multinational” company (Liuhto, 2001).
From the mid-1990s on, the number of subsidiaries settled abroad by Russian firms started growing again, fuelled by a recovery in new FDI outflows from Russia (Andreff, 2002). However, if 1994 is the milestone for a new emergence of Russian MNCs, one has to wait until end of 1998 Russian financial crash consequences to witness a swift growth pace of Russian OFDI stock. Most of the biggest 100 Russian firms have gone multinational since 1999 or so. Russian MNCs benefited from global accelerated internationalisation in the early 2000s and from a catching-up surge of late-coming MNCs, previously lagging behind other BRICs’ MNCs in FDI business.
Let us end up with a paradox: Brazil and primarily India had benefited from a first mover advantage, compared to other BRICs, as regard investing abroad. However, at the end of the day, in 2009-2013, both countries are lagging behind China and Russia whose OFDI in fact benefited from a last mover fast growth since the 1990s – a sort of swift catching-up process.
During the lapse of time they took to emerge from the late 1970s up to the late 1990s, MNCs from transition and emerging economies, of which BRICs’ MNCs, exhibited major features which differentiated them from big MNCs based in developed countries, that is:
• They were not all or not primarily in private ownership; still a significant number of them were state-owned; they had not much ownership specific advantages over local companies.
• They had a modest size compared to Western and Japanese MNCs.
• The government often interfered heavily in their strategies, much more than it is used to do in developed countries.
• The great bulk of their OFDI was located in neighbouring countries or in the same geographical region as the home country.
• The number of countries hosting their foreign subsidiaries was comparatively low.
W. Andreff, Outward Foreign Direct Investment from BRIC countries: Comparing strategies of Brazilian, Russian, Indian and Chinese multinational companies
Available online at http://eaces.liuc.it
83
• Each of these BRICs’ MNCs had only settled a rather small number of subsidiaries abroad.
• They often had primarily invested abroad in the manufacturing industry while big MNCs from developed countries were already privileging the services industry for their OFDI.
• Their profitability was quite below those of big Western and Japanese MNCs.
However, some of these features were used as specific competitive advantages to challenge big MNCs from developed countries through market seeking OFDI. Only a few BRICs’ MNCs, if any, were investing abroad with an efficiency seeking objective – looking for lower unit labour cost abroad - since their domestic production costs were comparatively low. Econometric testing (Andreff, 2002 & 2003a) has verified that the investment development path – IDP – model (Dunning, 1981; Dunning and Narula, 1998) fitted with these early stages of emergence of MNCs from transition, emerging and developing economies. According to IDP model, in a first stage of its economic development, a country hosts very few FDI and does not invest at all abroad. In a second stage, it becomes attractive to inward FDI and achieves its very first OFDI, being a net FDI importer. In a third stage, due to its new technological competences and low unit labour cost, the country attracts very significant inward FDI and its MNCs start to substantially invest abroad even though the country still remains net FDI importer. In such analytical framework, emerging economies are supposed to definitely move from the second to the third stage and even to come close to a fourth stage. In the latter, a country is assumed to be a developed one and invest more outwards than it is invested by inward FDI; its FDI balance becomes positive. In a fifth and last stage, the now post-industrial country roughly reaches a balance between its inward and outward FDI.
2. From the golden early 2000s to muddling through the crisis
Overall BRICs OFDI growth actually skyrocketed in 2000-2007 (Table 1). Brazil’s OFDI had a fast development momentum between 1997 and 2000 in the wake of privatisation and deregulation; it multiplied by 7 as against Russian OFDI multiplied by 3, Indian OFDI multiplied by 2 and Chinese OFDI6 increasing by 33% over 1997-2000. Brazilian OFDI stock in 2000-2007 multiplied by 2.5 and grew exactly at the same pace as the world OFDI stock overall; consequently, its pace was passed over by OFDI stock from China (x 3.5), Russia (x 13) and India (x 16). Despite its impressive growth, Indian OFDI stock remained by far quite smaller than the Russian (8 times smaller), Brazilian (4 times) and Chinese (3 times) ones in 2007. On the brink of financial crisis, the major BRIC investing abroad was Russia whereas the laggard was India, with Brazil and China in between. Russian OFDI achieved a world record in terms of growth7 from 2000 to 2007, growing faster than OFDI from other BRICs.
6 All the comments refer to OFDI from mainland China, Hong Kong OFDI excluded. 7 Until 2007, Russian MNCs showed a double-digit growth and high profitability (Kalotay, 2008a).The dramatic growth of Russian OFDI may be somewhat overestimated due to data collection methodology; however the latter improved throughout the 2000s, namely with a better accounting for
EJCE, vol.12, n.2 (2015)
Available online at http://eaces.liuc.it
84
Table 1 - Outward FDI stock from Brazil, Russia, India, and China
China and Hong Kong 157928 411944 1122386 923869 1063689 1246094 1411901 1818850 1352353
Source: UNCTAD (2014) and previous issues.
Table 2 - Comparative features of OFDI from the BRICs (in %)
Outward FDI stock / GDP Outward / Inward FDI stock
BRICs: 1999 2007 2011 1999 2007 2011
Brazil 1.4 9.9 9.0 7.4 40.0 30.3
India 0* 2.6 6.0 6.5 38.6 55.2
Russia 2.3 19.8 19.5 51.9 75.4 79.2
China 2.5 3.0 5.0 8.4 29.3 51.4
China & Hong Kong 15.9 30.3 18.7 45.3 74.3 76.3
* Below 0.1%
Calculated from UNCTAD's World Investment Reports.
Looking at Table 2 with reference to Dunning’s IDP model, Brazil exhibits a quite lower OFDI/GDP ratio than Russia – twice lower from 1999 to 2011 – while it is much higher than in India and China which compare in this respect. If an OFDI/GDP ratio higher than 5% were assumed to be required for a country to be in the third step of IDP model (Andreff, 2003a), Brazil and Russia reached it in the early 2000s while India and China attained such step only by 2011. Outward to inward FDI stock ratio is the lowest in Brazil and India in 1999; this ratio multiplied by more than 5 in Brazil between 2000 and 2007 and was only outperformed by Russian OFDI at this date. Due to the crisis, of which Brazilian and Russian OFDI suffered more than their Indian and Chinese counterparts, in 2011 Brazil was lagging behind India and China as to outward/inward FDI stock ratio, and of course Russia. However, if a 25% ratio is hypothetically retained for qualifying the third step of IDP model all the BRICs stick to the criterion in 2007 as well as in 2011, with only Russia having met it before 1999.
cumulative investments made in previous years. Nevertheless, it is not enough to be the sole factor of the observed dramatic OFDI growth (Filipov, 2010).
W. Andreff, Outward Foreign Direct Investment from BRIC countries: Comparing strategies of Brazilian, Russian, Indian and Chinese multinational companies
Available online at http://eaces.liuc.it
85
The growth of global OFDI stock sharply slowed down during the financial crisis in 2008, 2010 and 2011, with uneven recoveries in 2009, 2012 and 2013. The financial crisis had a negative impact on OFDI from emerging markets as well. However, emerging market MNCs’ contribution to OFDI was more resilient to the crisis and less volatile than that of other MNCs. While the growth of overall world OFDI significantly and repeatedly fell on average one year out of two (Table 3), OFDI fluctuations were scattered among the BRICs during the crisis.
Table 3 – BRICs outward FDI stock during the global economic crisis: rate of growth
2007/ 2000
2008/ 2007
2009/ 2008
2010/ 2009
2011/ 2010
2012/ 2011
2013/ 2012
Brazil x 2.5 24.9% - 2.8% 14.8% 12.0% 14.9% 25.9%
Russia x 13 - 20.5% 22.7% 74.2% - 16.5% 14.1% 21.3%
India x 16 110% 25.0% 19.7% 20.4% 6.2% 1.4%
China x 3.5 54.4% 55.2% 29.6% 23.0% 39.1% 20.5%
China & Hong Kong x 2.7 - 17.7% 15.1% 17.1% 13.3% 28.8% -25.6%
World OFDI x 2.5 3.9% 17.1% 7.5% 3.7% 11.3% 11.5%
Calculated from UNCTAD (2014) and previous issues.
Russian OFDI stock was by far the most unstable and the most affected by crisis suffering a 20% decrease in 2008, and again 17% down in 2011; but in between its recovery was the strongest in the world with the highest growth rate (74%) in 2010; the 2012-2013 recovery is milder. Russian OFDI was harshly affected by the crisis with a cut in its stock value (not only a fall in outflows), due to both divestments from abroad and foreign asset depreciation in 2008. Russian MNCs have been stifled by a lack of external finance. Russian OFDI stock grew again in 2010 fuelled by new investments abroad, foreign asset appreciation and likely capital flight. These figures exhibit that crisis entailed a much higher instability in Russian than other BRICs’ OFDI. The rouble depreciation since 2014 is bad news for further OFDI expansion.
Though fluctuating, Chinese OFDI stock kept on growing at between 21% and 55% a rate per year from 2008 to 2013: the most stable and the least affected by crisis. Chinese OFDI stock did better than other BRICs’ OFDI so that it slightly passed over the value of the Russian one since 2011. Its rate of growth remained significantly higher than in other BRICs just like the annual rate of Chinese domestic economic growth which did not fall below 7% so far – much higher than in other BRICs’ economies. Moreover Chinese OFDI has been facilitated by a strong domestic currency – all the more so with remminbi being often assessed as undervalued at official exchange rate.
Brazilian and Indian OFDI stocks stand in between. Brazilian OFDI stock is the most unstable after the Russian one, decreasing by 3% in 2009 then sticking to a 12% to 15% growth rate until 2012 and reaching 26% in 2013. The high growth rate of Brazilian OFDI stock in 2008 was mainly due to intra-company loans from parent companies to underperforming subsidiaries abroad as well as new acquisitions of mining
EJCE, vol.12, n.2 (2015)
Available online at http://eaces.liuc.it
86
and natural-resource-based industries. In 2009, in response to worldwide crisis, FDI outflows from Brazil were negative, with Brazilian parent companies repatriating $10 billion from their foreign subsidiaries through intra-company transfers. The combination of Brazilian real depreciation and loss of market value of overseas equity did not result in more ventures abroad for Brazilian companies. The latter were strongly hit by tightened international credit conditions and uncertainty fueled by the crisis. Trans-border mergers and acquisitions (M&As) by Brazilian MNCs plummeted sharply in 2009. Since 2010, Brazilian OFDI stock located in Europe has considerably raised namely in Austria, through special purpose entities and takeovers of Austrian banks.
Indian OFDI rate of growth peaked up at 98% per year in 2004-2007. Indian OFDI stock was still one of the fastest growing in the world in 2008 but dropped off significantly in 2009 and since then its growth rate is on a decreasing slope down to 6% in 2012 and 1% in 2013. This growth rate declined, on average, less than in other BRICs but China. Indian MNCs had borrowed heavily in dollars to finance mega trans-border M&As. They were thus hit badly by the sharp rupee depreciation and tightened international credit conditions. Since 2008 continuously tumbling trans-border M&As by Indian MNCs were driving the decline in OFDI growth. After years of overseas expansion, Indian MNCs started consolidating their foreign operations and adjusting to the crisis. They suffered from a credit crunch and difficulties in raising financial resources. However, after Chinese MNCs, Indian ones are the least affected by crisis among the BRICs’ MNCs so far.
In terms of OFDI stock, India became the world’s 34th largest outward investor in 2007 whereas Brazil had reached the 19th rank the same year as against Russia the 12th, and mainland China the 23rd. In 2012, Brazil was the 18th most important source of OFDI worldwide and India the 23rd, as against Russia being the 15th and China the 12th. From 2007 to 2012, during the crisis, all the BRICs have climbed this ranking based on UNCTAD data, except Russia.
3. Specificities of multinational companies from Brazil, Russia, India and China
3.1 Global players and small-medium sized firms: Brazilian multinationals
In 2006, 885 identified Brazilian MNCs had invested in 52 countries where they were employing 77,000 people; Gammeltoft (2008) even identified more than 1,000 Brazilian firms that had invested abroad in the late 1990s. The group of Brazilian firms with significant amounts of OFDI is around 100 of which about 50 global players (Carvalho et al., 2010). In 2013, seven Brazilian MNCs were listed among the Fortune 500 biggest companies in the world: Petrobras, Banco de Brasil, Bradesco, Vale, JBS, Itau, Ultrapar Holdings, and Brazilian Distribution. Major Brazilian companies investing abroad are listed in Table 4 but quite smaller or less known Brazilian firms invest abroad as well. Overall, Brazilian MNCs form a mixed sample of global players and small and medium-sized enterprises.
W. Andreff, Outward Foreign Direct Investment from BRIC countries: Comparing strategies of Brazilian, Russian, Indian and Chinese multinational companies
Available online at http://eaces.liuc.it
87
Table 4 - The biggest Brazilian multinationals, 2009-2010
($ billion)
Company Industry Foreign assets 2009
Foreign assets 2010
Itau-Unibanco (Itausa) Banking 50.0 75.2
Vale Mining 46.1 55.6
Odebrecht Construction 24.4 n.a.
Petrobras Oil and gas 20.4 17.9
Gerdau Steel 14.3 15.1
Grupo Votorantim Conglomerate 9.1 15.8
JBS-Friboi Food 9.1 10.7
Embraer Aerospace 3.7 3.1
CSN Steel 2.2 n.a.
Marfrig Food 1.4 2.5
Andrade Guttierez Construction 0.7 n.a.
Brasil Foods Food 0.6 3.6
Marco Polo Automotive 0.5 0.2
WEG Machinery 0.4 0.8
FIBRIA Pulp and paper 0.3 n.a.
Braskem Chemicals 0.1 n.a.
Metalfrio Electrical equipment 0.1 n.a.
Natura Cosmetics 0.1 0.04
Lupatech Machinery 0.1 n.a.
ALL Logistica Railroad transportation 0.1 n.a.
Totvs Information technology 0.02 n.a.
Bematech Information technology 0.002 n.a.
Banco do Brazil Banking n.a. 32.7
Bradesco Banking n.a. 26.2
Industrias Romi Machinery n.a. 0.8
Magnesita Mining n.a. 0.7
Source: Columbia FDI Profiles
EJCE, vol.12, n.2 (2015)
Available online at http://eaces.liuc.it
88
Since the very beginning, Brazilian MNCs had adopted either an export-substitution or an export-complementing OFDI strategy that is a market seeking strategy in any case. The latter was fueled in the long run by trade liberalisation at home and abroad. Brazilian MNCs invest abroad by means of both greenfield investment and trans-border M&As. Overseas acquisitions have gained strength, due to the stabilisation of the Brazilian economy and a temporary appreciation of real against the US dollar. An appreciated currency has made M&As cheaper. Brazilian MNCs have taken this opportunity to expand their market and access natural resources that are not available in domestic market: this was the purpose for instance of Vale-Inco Steel, Votorantim-US Zinc, and Gerdau-Chaparral Steel acquisitions.
Table 5 – A Sample of significant trans-border mergers-acquisitions achieved by Brazilian companies, 2008-2010
Brazilian acquirer Acquired company Target country Industry acquired % Value $million
Vale BSRG Resources Guinea UK Ferroalloy ores 51 2500
Marfrig Keystone Foods USA Meat packing 100 1260
Votorantim Cimpor Cimentos Portugal Cement, hydraulic 17 982
DHC Outsourcing Diveo Braodband Networks USA Information retriev. 100 422
Votorantim Métais Cia Minera Milpo Peru Copper ores 15 419
Petrobras Pasadena Refining System USA Petroleum refining 50 350
Braskem Sunoco Chemicals USA Chemicals 100 350
Votorantim Cimpor Cimentos Portugal Cement, hydraulic 4 210
Petrobras Devon Energy CorpCascade USA Petroleum and gas 50 180
Camargo Correa Cimpor Cimentos Portugal Cement, hydraulic 3 180
Banco Itau Holding
Banco Itau Europa Portugal Security services 89 498
Marfrig Grupo Zenda Uruguay Leather products 51 49
Petrobras Chevron Chile Chile Petroleum and coal 100 12
JBS-Friboi Pilgrim's Pride USA Food 64 3
Gerdau Quanex Corp USA Steel 100 1749
Magnesita LWB Refractories Germany Brick and clay tile 100 944
JBS-Friboi Smithfield Beef Group USA Beef cattle 100 565
JBS-Friboi Inalca Italy Meat products 50 425
Votorantim Métais US Zinc Corp USA Nonferrous metals 100 295
Gerdau Corporacion Sidenor Spain Steel 20 287
AmBev Quilmes Industrial Argentina Malt beverages 6 252
JBS-Friboi Tasman Group Services Australia Meat packing 100 150
Gerdau Corsa Controladora Mexico Steel 49 101
Source: Campanario, Stal & Silva (2012).
W. Andreff, Outward Foreign Direct Investment from BRIC countries: Comparing strategies of Brazilian, Russian, Indian and Chinese multinational companies
Available online at http://eaces.liuc.it
89
From Table 5 one can infer that trans-border M&As by Brazilian MNCs target foreign companies geared towards consumer markets (food, services, banking), which confirms market-oriented OFDI. Then come M&As for acceding natural resources (petroleum, gas, various ores), and just one trans-border M&A is asset seeking in information retrieval; this highlights a resource seeking OFDI strategy. Thus, predominantly Brazilian MNCs’ strategy is market seeking, to some extent resource seeking and to a much lesser degree, and only recently, technological asset seeking, less than 10% of declared OFDI motives. There is no sign of an efficiency seeking strategy with relocating production units in low unit labour cost countries. Despite the rise of some big investors, mostly in the extractive sector, Brazilian MNCs have not yet developed a global strategy8, much less than other BRICs’ MNCs.
Searching technological assets that firms do not avail in their domestic market is an important driver of OFDI in general, and has become a central motivation for emerging market firms to internationalise (Dunning et al., 2008; Dunning and Lundan, 2008). But in Brazil, technology seeking OFDI responds of only 7.2 percent of sampled MNCs (Carvalho, 2009). The recent increase in trans-border M&As might be a signal that Brazilian MNCs are seeking now to augment their strategic position through investment in technological assets. Tolentino (2000) contends that Brazilian MNCs had the disadvantage of not having global brands (in some cases not even strong national brands) and, most important, had neither attained worldwide technological leadership nor developed significant technological advantage to compete abroad. However, some Brazilian MNCs have significantly invested in R&D expenditures abroad, but not yet in very high tech industries like MNCs from developed countries and some Indian or Chinese MNCs. Galina and Moura (2013) found that Brazilian MNCs basically internationalise Product Development (not the whole R&D process) while Research properly speaking remains at the headquarters in Brazil. Adaptation of products to local markets is often observed as a factor that led to internationalise R&D.
Partnership with local suppliers was used for product or technology development. Maehler et al. (2011) have shown that in four Brazilian subsidiaries located in Portugal, in different industries, frequent innovations take place which are typically incremental in nature and occur in strong interaction with local markets, especially with customers contributing with suggestions and influence on the new products’ creation in the subsidiaries. At odds with Russian and Chinese MNCs strategy of tapping technological assets abroad, Fleury et al. (2013) contend that Brazilian MNCs derive innovative capabilities from core competences and competence formation at firm level which are influenced by the national environment. Thus Brazilian MNCs which do not exhibit the expected strength in R&D are able to combine their organisational competences and manage to develop innovative capabilities as a springboard for their internationalisation.
8 As defined in Andreff (2003b).
EJCE, vol.12, n.2 (2015)
Available online at http://eaces.liuc.it
90
3.2 Conglomerates and family groups: Indian multinationals
In 2007, the number of Indian MNCs stood at 3,149 operating across 122 countries, but many had a relatively small size. In 2008, seven Indian firms were listed in the Fortune 500 biggest companies of the world: Indian Oil, Reliance Industries, Bharat Petroleum, Hindustan Petroleum, Tata Steel, Oil and Natural Gas Corporation and State Bank of India. In 2013, they were eight, the same plus Tata Motors. Some of these biggest Indian firms did not show up among the biggest Indian MNCs in 2006 (Table 6).
Early Indian OFDI was market seeking and concentrated in developing countries where there was little technological competition. Indian MNCs invested abroad largely to circumvent a stagnant domestic market and policy restrictions on large firms’ growth stemming from the Monopolies and Trade Restrictive Practices Act, the Foreign Exchange Regulation Act, and licensing regulation and reservation policies for public-owned and small scale sector (Pradhan, 2008). Indian firms investing abroad before the 1990s were mostly conglomerates (Lall, 1982) competing into those industries that required simple technology, low product differentiation and labour intensive techniques in developing countries. After a first liberalisation phase, continual industrialisation in the domestic market, experience attained from home and abroad, financial relaxation and local government supports paved the way for Indian MNCs to invest more globally, including increasingly into developed countries since the 1990s (Arockia Baskaran and Chaarlas, 2012). A number of Indian MNCs attempted globalising their businesses and revenue sources as a means for reducing dependence on the Indian market and domestic business cycle.
W. Andreff, Outward Foreign Direct Investment from BRIC countries: Comparing strategies of Brazilian, Russian, Indian and Chinese multinational companies
Available online at http://eaces.liuc.it
91
Table 6 - The biggest Indian multinationals, 2006
($ million)
Company Industry Foreign assets
Oil and Natural Gas Corporation (ONGC) Oil and gas 4700
Then, Indian OFDI became more high-tech and trade supporting, as Indian IT firms begun to win large global contracts and relocated in developed countries to be close to key clients. Indian pharmaceutical firms followed such route to break into Western generic markets. India’s pharmaceutical companies looked for new unregulated markets for their generic drugs while seeking to acquire facilities that have regulatory clearance in regulated markets such as the USA and Western Europe. The conglomerate structure of some well-known Indian MNCs is considered as a key factor of their success (Ruet, 2010). It helped them catching up as regard production process-efficiency and technology while raising their borrowing capacity in international markets. Those non-conglomerate Indian firms that became MNCs often used foreign networks, namely parental networks (Elango and Pattnaik, 2007) of big families like the Kalyani’s (Bharat Forge), the Mahindra brothers, Dilip Shanghvi (Sun Pharmaceuticals), or Nicholas Piramal.
EJCE, vol.12, n.2 (2015)
Available online at http://eaces.liuc.it
92
Some Indian MNCs have persistently pursued natural resources. Resource seeking OFDI aims at ensuring a stable and secure supply of resources to fuel the country’s energy-intensive growth. There has recently been a surge in resource seeking OFDI by Indian MNCs, especially to acquire energy resources in Australia, Indonesia and Africa. Indian OFDI to the US and Western Europe has taken off since 2000. The major driver of this takeoff is to get an access to better R&D, skill infrastructure, and strategic assets. This (technological) asset seeking strategy reflects an aspiration by Indian MNCs to buy technology, processes, and management know-how. Finally, as trade barriers declined, some Indian MNCs undertook industrial restructuring with creating regional production networks, which looks like an efficiency seeking strategy though it is not heavily based on a search for lower unit labour cost9. Indian IT companies have established major global sourcing bases in China. Similarly, Tata Motors’ acquisition of Daewoo Heavy Vehicles of South Korea in 2005 has led to a regional production networking strategy whereby small and medium-sized vehicles are manufactured in Indian plants and sold through Daewoo outlets and brands while, simultaneously, heavy trucks built at the Daewoo plant are sold by Tata outlets in India and other countries under Tata brand name.
Though relatively small in a global context, Indian MNCs are noticeable for their buy-outs of foreign enterprises far larger than themselves. Indian MNCs started being seriously involved into overseas M&As in the 2000s (Table 7). They have systematically acquired leading firms in developed countries to boost domain expertise, technological competitiveness, market size, and brand recognition. In some cases, these acquisitions were specifically undertaken to attain global size and status, and to build new competitive advantages by combining the best international technology with low-cost Indian labour (Andreff and Balcet, 2013). Severe domestic competition triggered increasingly larger strategic asset-seeking trans-border M&As in the automotive industry, auto-components, electronics, electrical machinery and the metals sector, including the acquisition of established and prestigious brands, for example, Tata Motors’ purchase of Jaguar and Ford assets. While the largest overseas M&As were smaller than $500 million in the early 2000s, they became bigger than $10 billion after the mid-2000s with the record takeover of Arcelor by Mittal ($47 billion). Many Indian firms also used M&As to bring home new products and services and build competitive strength in India. Improving competitiveness also explains the dominance of natural resource seeking investments in India’s recent trans-border M&As.
A survey of Indian MNCs revealed that market access was the most significant motive of their OFDI for 51% of the respondents, followed by efficiency seeking (22%), resource seeking (13%) and created-asset seeking (14%) (Nayyar, 2008).
9 Since a low unit labour cost is a typical home country’s advantage for Indian MNCs.
W. Andreff, Outward Foreign Direct Investment from BRIC countries: Comparing strategies of Brazilian, Russian, Indian and Chinese multinational companies
Available online at http://eaces.liuc.it
93
Table 7 – A sample of significant trans-border mergers-acquisitions achieved by Indian companies, 2006-2010
ONGC Imperial Energy U. K. Energy & power 100 2800
Sterlite Industries India Asarco United States Mining n.a. 2600
Tata Motors Jaguar & Land Rover U. K. Automotive 100 2300
Suzlon Energy Repower Systems Germany energy & power 66 1700
Essar Global Algoma Steel Canada Metals & mining 100 1570
ONGC Petrobras Brazil Oil and gas n.a. 1400
Tata Power Kaltim Prima Coal Indonesia Metals & mining 30 1300
United Spirits Whyte and Mackay U. K. Food, beverage 100 1180
Tata Power PT Bumi Resources Thailand Energy & power n.a. 1100
GMR Infrastructure Intergen Netherlands Energy & power 50 1100
Tata Chemicals General ChemicalIndustrial United States Plastic,chemicals 100 1100
JSW Steel Jindal United Steel United States Metals & mining 90 900
HCL EAS Axon Group U. K. IT & ITES 100 800
Wipro Infocrossing United States IT & ITES 100 600
Rain Calcining CII Carbon United States Energy & power 100 600
DS Constructions Globeleq Bermuda Energy & power 100 600
Dr Reddy's Laboratories Betapharm Germany Parmaceuticals n.a. 582
Tata Tea Tetley Group U. K. Food, beverage n.a. 431
Videocon/Bharat Petro Encana Brasil Petroleo Brazil Energy & power 50 400
Ranbaxy Laboratories Trapia Romania Parmaceuticals n.a. 324
Firstsource Solutions MedAssist United States IT & ITES 100 300
RelianceCommunications Yipes Holding United States Telecom 100 300
Videocon Appliances Thomson Multimedia France IT & ITES n.a. 292
Wockhardt Negma Laboratories France Parmaceuticals 100 265
Jubilant Organosys Draxis Health Canada Pharmaceuticals n.a. 258
Kiri Dyes and Chemicals DyStar Group Germany Plastic,chemicals 100 200
Essar Group Warid Telecom Uganda/Congo Telecom 51 200
United Phosphorus Cerexagri France Chemicals n.a. 142
Subex Systems Azure Solutions U. K. Technology n.a. 140
Inox India Cryogenic VesselInitiatives United States Logistics 51 100
S. Kumar's Hartmarx United States Textiles,apparels 100 100
* In 17 African countries Sources: UNCTAD, Hattari & Rajan (2010).
3.3 From opacity to globalisation: Russian multinationals
An unknown number – probably less than 1,000 Russian firms10 - have invested abroad. Despite their growing size, no one Russian MNC has entered yet the list of top 100 biggest non-financial MNCs ranked by UNCTAD according to the value of their foreign assets (Table 8). Russian MNCs were used to disclose very little information with regards to their economic activity abroad. This strategy of opacity, non-transparency and information concealment is a typical feature of Russian MNCs, even though it is stepping back now.
10 The exact number of Russian multinational parent companies is not well known; the UNCTAD reckoned 1,176 foreign subsidiaries of Russian companies in 2004.
EJCE, vol.12, n.2 (2015)
Available online at http://eaces.liuc.it
94
Table 8 – The biggest Russian multinationals, 2004-2009
*** rank among the biggest 500 European companies.
TMK 2402 474
W. Andreff, Outward Foreign Direct Investment from BRIC countries: Comparing strategies of Brazilian, Russian, Indian and Chinese multinational companies
Available online at http://eaces.liuc.it
95
Table 9 - A sample of significant trans-border mergers-acquisitions achieved by Russian companies, 2005-2010
Source: adapted from UNCTAD, Filipov (2010) and Vahtra (2010).
The expansion of Russian MNCs abroad has often been interpreted in a first phase as capital runaway, if not exodus, toward friendly more stable and less risky foreign investment climates than in the Russian domestic market (Bulatov, 1998; Vahtra and Liuhto, 2004).
Following up the former red multinationals developed to serve Soviet foreign trade purposes, a rather frequent strategy of Russian MNCs is market seeking OFDI relaying previous export. This strategy first pertains to traditional markets such as the CIS; it is also the rationale for Russian OFDI in Western markets where Russian products face tough competition. Those Russian MNCs which invest abroad in mining, oil and gas industries have adopted a resource seeking approach and attempted to take over their most needed suppliers abroad by means of M&As. Russian OFDI in the CIS is basically resource seeking geared towards oil, gas and mining. The same strategy applies to the fairly recent Russian OFDI in Africa though it is mitigated here with a motive of accessing to new consumer markets. Russian MNCs have not yet adopted an efficiency seeking strategy although they could have envisaged it in the CIS and developing countries with lower production costs than in Russia.
EJCE, vol.12, n.2 (2015)
Available online at http://eaces.liuc.it
96
Russian companies have conducted an asset seeking strategy based on overseas M&As in view of acquiring Western technology and R&D intensive units. Trans-border M&As enable them to consolidate their global competitiveness in creating or reaching the advantages of a monopoly or dominant oligopoly position in some foreign markets. The main target for M&As by Russian MNCs is to take over European and North American firms. Between 2005 and 2010, M&As have primarily targeted an entry in industries linked to natural resources in the U.S., Canada, Italy, Switzerland and South Africa (Table 9). Big trans-border M&As are less frequent in the close abroad whose firms are of smaller size and less attractive in terms of high tech assets. The proportion of M&As in Europe peaked up in 1997-2000 whereas the one in the CIS climaxed in 2001-2004. First asset acquisitions appeared in developing countries since 2005. Financial crisis impacted M&As undertaken by Russian MNCs downwards. The overall number of trans-border M&A deals was 114 in 2007 and 119 in 2008; it fell down to 102 in 2009 and 70 in 2010 (Filipov, 2011).
OFDI by Russian MNCs directly in R&D is less the rule than exception so far, but it is a significant sign of a step forward toward a more global strategy. For instance, Sistema entered the stock equity of an Indian company in the mobile telecom industry in 2008 and then attempted to acquire a German firm involved in microelectronics, Infineon, in 2009 (Vahtra, 2010). Similarly Sberbank had attempted (but failed) to participate into the purchase of Opel, a General Motors subsidiary, during the bankruptcy proceeding of this company, in view of capturing its high tech. In the iron and steel industry, Evraz, Severstal and Rusal have invested a big deal of money for technological development in their foreign subsidiaries whereas, in oil industry, Lukoil and TNK-BP have acquired foreign firms in view of upgrading their own technological level. This spread of overseas M&As by Russian MNCs in high-tech industries was backed and supported by the highest Russian authorities.
3.4 Predominant state ownership: Chinese multinationals
In 2005, 3,429 parent companies of Chinese MNCs had settled about 28,000 foreign subsidiaries. Most of the biggest Chinese MNCs are state-owned and backed by governmental financial assistance while private ones are fast-growing and even faster-globalising (Table 10). State-owned enterprises (SOEs) and privately-owned MNCs differentiate with regards to their motives of internationalisation since the government influence is absolutely decisive on the former while looser with the latter.
Chinese SOEs are attracted in countries with big markets or large endowment in natural resources and rather risky political environment. Private MNCs are more purely market seekers. Although all Chinese public and private firms have strategic intent with asset seeking, the attraction is toward commercially viable technology rather than core research content. Such technological asset seeking strategy is primarily adopted when investing in advanced developed economies where Chinese MNCs are motivated by an access to strategic assets corresponding to China’s strategic needs (Deng, 2007). Chinese MNCs are often portrayed as internationalising in order to improve their access to foreign proprietary technology and enhance competitiveness through diversifying their activity. Asset seeking has been used on purpose. With domestic wage inflation in the recent years, some Chinese companies started relocating their production in geographically close countries with markedly lower unit labour costs such as Vietnam
W. Andreff, Outward Foreign Direct Investment from BRIC countries: Comparing strategies of Brazilian, Russian, Indian and Chinese multinational companies
Available online at http://eaces.liuc.it
97
and North Korea. This signals the emergence of a new efficiency-seeking strategy which is likely to develop in the years to come with the current rise of unit labour cost in China.
Table 10 - The biggest 50 Chinese multinationals ranked by foreign assets, 2010
Rank Company Rank Company
1 China Unicom Corporation 26 China Huneng Group
2 China National Petroleum (CNPC) 27 China Communication Construction Co, Ltd
3 China Petrochemical Corporation 28 China Vanke Co, Ltd
4 China Resources (Holdings) Co, Ltd 29 China Metallurgical Group
5 China National Offshore Oil (CNOOC) 30 Yanzhou Coal Mining Company Ltd
6 China Merchants Group 31 SINOTRANS Changjiang Nl Shipping Corp.
7 China State Construction Engineering Co 32 State Grid Corporation of China
16 Geely Holding Group 41 Shanghai Baosteel Group Corporation
17 China Minmetals Corporation 42 Changsha Zoomlion HI S&T Development
18 CITIC Group 43 Shum Yip Holdings Company Ltd
19 China Poly Group Corporation 44 China Non Ferrous Metal Mining & Constr.
20 Beijing Enterprises Group Company Ltd 45 SINOHYDRO Co, Ltd
21 Hunan Valin Iron & Steel Co, Ltd 46 Jiangsu Shagang Group
22 China Shipping Company 47 China International Marien Containers Ltd
23 China National Aviation Holding Corp. 48 Wuhan Iron & Steel Corporation
24 GDH Limited 49 China National Gold Group Corporation
25 SinoSteel Corporation 50 Jinchuan Group Ltd
Source: MOFCOM Statistical Bulletin.
EJCE, vol.12, n.2 (2015)
Available online at http://eaces.liuc.it
98
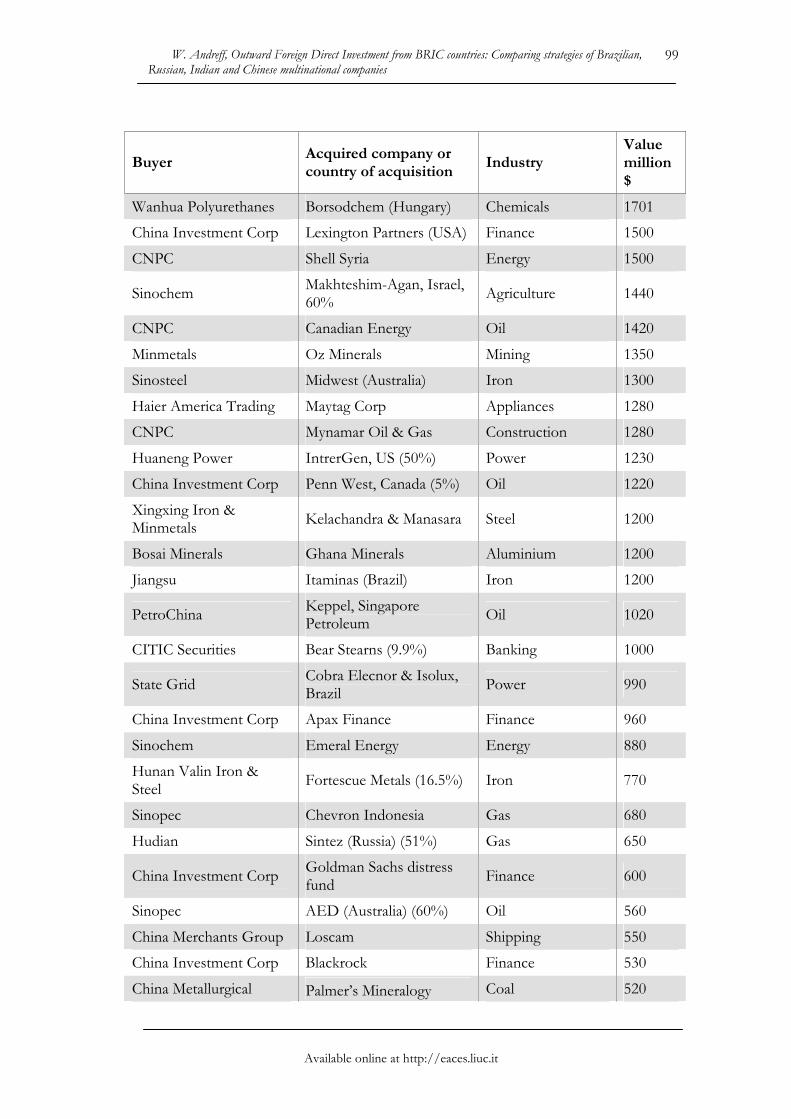
Table 11 - A sample of significant trans-border mergers-acquisitions achieved by Chinese companies, 2004-2011
Buyer Acquired company or country of acquisition
Industry Value million $
CNOOC (1) Unocal Oil 18500
Chinalco Rio Tinto (12%) Mining 14280
Sinopec Addax Petroleum (Swizt.) Oil 7200
Sinopec Repsol, Brazil (40%) Oil 7100
China Investment Corp Morgan Stanley (9.9%) Banking 5000
Sinopec Conoco Phillip, Canada (9%)
Oil 4650
COSL Awilco Offshore Drilling 3890
Huaneng Power Tuas Power (Singapore) Power 3070
Sinopec Udmurneft Oil 3500
CNPC PetroKazzakhstan Oil 3960
CNOOC Bridas (Argentina) Oil 3100
Sinochem Peregrino field (Brazil) 40%
Oil 3070
China Investment Corp Blackstone Group L.P. Private equity 3000
Yanzhou Coal Felix Resources (Australia) Coal 2950
CNPC KaMunaigas Gas 2600
CNOOC Awilco Offshore (Norway)
Oil 2500
CNOOC Pan American, Argentina 30%
Oil 2470
Sinopec Occidental (Argentina) Oil 2450
CNOOC South Atlantic Petroleum Oil 2268
CNOOC Chesapeake Energy, US (33%)
Oil 2200
Investor Group Kazakhstan Energy 1874
Geely Volvo Automobile 1500
Lenovo Group IBM PC Business Computers 1760
CNPC National Iranian Oil Company
Oil 1760
CNPC Athabasca Oil Sands Oil 1740
W. Andreff, Outward Foreign Direct Investment from BRIC countries: Comparing strategies of Brazilian, Russian, Indian and Chinese multinational companies
China Investment Corp Nobel Holdings (Russia) Oil 300
Tencent Digital Sky, Russia (10%) Technology 300
Jiangsu Shagang Bulk Minerals & Grange Iron 270
China Railway Materials African Minerals,Sierra Leone
Iron 260
Zoomlion Compagnia Forme Acciaio
Construction 250
China Investment Corp South Gobi Energy, Mongolia
Coal 250
Baosteel Aquila Resources (Australia)
Iron 240
Jinchuan Group Wesizwe Platinu Mining 230
Nanjing Automobile MG Rover Automobile 205
Mindray Medical Datascope Corporation unit
Medical devices 202
CNPC Pluspetrol Norte Oil 200
Hanlong Mining Moly Mines Iron 200
W. Andreff, Outward Foreign Direct Investment from BRIC countries: Comparing strategies of Brazilian, Russian, Indian and Chinese multinational companies
Available online at http://eaces.liuc.it
101
Buyer Acquired company or country of acquisition
Industry Value million $
BAIC Saab Automobile 200
Baiyin, CITIC & Chang Xin
Oxus (Uzbekistan) Mining 190
Ningbo Qingchun Clothing
Youghwa Weaving & Dyeing
Textile 184
Cosco Peninsular & Oriental Steam
Shipping 181
Navigation
Three Gorges EuroSibEnergo (Russia) Power 170
China Merchants Group Ming Wah Universal Transportation 168
Great Wall Motor Litex Motors (Bulgaria) Automobile 120
China Investment Corp GDF Suez (30%) Electric services n.a.
(1) Eventually failed due to national security issues.
(2) Failed due to political objections and national security reasons.
Source: adapted from H. Rui, G.S. Yip & S. Prashantham (2010) and Salidjanova (2011).
The M&A mode of Chinese MNCs’ entry suddenly took off after 2000 targeting both developed and developing countries (Table 11). In 2004, a circular issued by the National Development Research Council (NDRC) and the Export-Import Bank of China explicitly promoted trans-border M&As. Renminbi appreciation against the US dollar and Euro in the recent years has reduced the cost of Chinese M&As over Western companies. From 2000 to 2010, Chinese MNCs merged or acquired 83 companies located in EU countries (Clegg and Voss, 2012). But between 2007 and 2009, the total number of Chinese overseas M&As plummeted from 243 to 82; the total trans-border M&A value fell from $32.8 billion to $1.4 billion. Most overseas M&As achieved between 2008 and 2010 failed and translated into a fall in the stock value of those companies involved. Thus, in presence of very high country risk, Chinese MNCs prefer greenfield investment. When a host country has stronger national innovation ability or higher level of human capital, Chinese firms tend to choose M&As. An increase in the cultural distance appears to induce Chinese MNCs to select M&As as well (Hu et al., 2012). The number and magnitude of trans-border M&A deals by Chinese MNCs on average are much bigger than those observed with other BRICs’ MNCs, except the giant Mittal-Arcelor deal.
EJCE, vol.12, n.2 (2015)
Available online at http://eaces.liuc.it
102
4. Geographical orientation of BRICs’ outward foreign direct investment
Tax havens such as Cyprus, Hong Kong, Virgin Islands, Cayman Islands, Channel Islands, Bahamas, Gibraltar, Macau, and St Vincent & Grenadines are highly ranked among the major host countries of BRICs’ OFDI as well as tax-friendly developed countries like Luxembourg, Switzerland, the Netherlands, and Austria (Table 12). Most of them, like Cyprus, are well-known rocket pads for round tripping circular investment. A part of OFDI in tax havens consists in round tripping FDI, i.e. for instance investment by Russian enterprises and citizens in offshore companies, in particular in Cyprus and the Virgin Islands, in view of reinvesting the corresponding capital later on in Russia11. A significant share of Chinese OFDI consists in round tripping as well, since 75% of overall stock in 2010 is invested in tax havens12, which is a much higher share than with Russian OFDI. It is what most of Chinese OFDI in Hong Kong, Macau, the Virgin and Cayman Islands is all about.
Top host countries of Brazilian OFDI are Caribbean tax havens and tax-friendly developed countries. FDI outflows to tax havens often flow back to Brazil, mainly in the form of intra-company transfers: 91% of annual cross-border intra-company transfers of Brazilian MNCs were with tax havens in 2008. However this sort of round tripping seems to be less widespread than in the case of Russian and Chinese OFDI. Fiscal regulation in Brazil seemingly induces investment in tax havens to escape regulatory and tax obligations. This suggests that Brazilian MNCs undertake trans-shipping FDI in tax-haven countries while waiting for good opportunities to make productive investment in third countries. This behaviour is different from that of Chinese MNCs that tend to be involved in round tripping OFDI due to favorable conditions offered by Chinese government to foreign investors in mainland China. The share of round tripping via tax havens in Indian OFDI must be lower than in the three other BRICs though the great bulk of OFDI channeled from India to countries such as Mauritius, Cyprus and Virgin Islands is ultimately geared toward third countries.
11 Since the 2008-on crisis round tripping and trans-shipping OFDI received in offshore economies has accelerated again to reach up to two-thirds of Russian OFDI. Its final destination is the CIS, CEECs and primarily the Russian Federation herself.
12 Indeed, only a part of Chinese OFDI transiting through tax havens namely Hong Kong, are round tripping flows. There is no official assessment of round tripping OFDI published by the MOFCOM. Western experts of China and press articles assess that it may be up to 50% of OFDI to Hong Kong.
W. Andreff, Outward Foreign Direct Investment from BRIC countries: Comparing strategies of Brazilian, Russian, Indian and Chinese multinational companies
Available online at http://eaces.liuc.it
103
Table 12 - Major host countries of BRICs’ OFDI stock
Brazilian OFDI 2012 $mn % Russian OFDI 2011 $mn %
Austria 56618 22.9 Cyprus 121596 33.6
Cayman Islands 40264 16.3 Netherlands 57291 15.8
Netherlands 28186 11.4 Virgin islands 46137 12.8
Virgin Islands 22291 9.0 Switzerland 12679 3.5
United States 18401 7.4 Luxembourg 11599 3.2
Spain 15376 6.2 United Kingdom 10662 2.9
Luxembourg 14719 6.0 United States 9501 2.6
Bahamas 14500 5.9 Jersey 7035 1.9
Argentina 5511 2.2 Germany 6692 1.8
Hungary 3207 1.3 Gibraltar 5701 1.6
Peru 2986 1.2 Bahamas 5481 1.5
Uruguay 2951 1.2 Belarus 4663 1.3
Panama 2430 1.0 St Vincent Grenad. 4421 1.2
Portugal 2139 0.9 Ukraine 4395 1.2
Canada 1804 0.7 Austria 4229 1.2
Indian OFDI 2009* $bn % Chinese OFDI 2010 $mn %
Singapore 14.2 20.8 Hong Kong 199056 62.8
Netherlands 10.6 15.4 Virgin Islands 23243 7.3
Mauritius 5.6 8.1 Cayman Islands 17256 5.4
Channel Islands 5.4 7.9 Australia 7868 2.4
United Kingdom 5.2 7.6 Singapore 6069 1.9
United States 5.1 7.4 Luxembourg 5787 1.8
Cyprus 4.7 6.8 USA 4874 1.5
United Arab Emirates 2.1 3.1 South Africa 4153 1.3
Russia 1.4 2.0 Russia 2788 0.9
Sudan 1.2 1.7 Canada 2603 0.8
Switzerland 1.1 1.6 Macau 2229 0.7
China 0.9 1.3 Myanmar 1947 0.6
Virgin Islands 0.9 1.2 Pakistan 1828 0.6
Egypt 0.8 1.2 Kazakhstan 1591 0.5
Denmark 0.8 1.2 Germany 1502 0.5 * Cumulative stock of outward investment approvals, 2002-2009 Sources: Banco Central do Brazil, Central Bank of Russia, Reserve Bank of India and MOFCOM Statistical Bulletin.
A next destination of BRICs OFDI encompass developed countries and major export markets, like the Netherlands, the UK, Germany, Austria, Turkey, Spain, Bulgaria, France for Russian OFDI. Western advanced economies are important hosts of Chinese OFDI as well, first of all Australia and the US (the Pacific Rim). As other BRICs’ MNCs, in the past decade Brazilian firms have re-oriented their investment abroad toward Europe (44.7% of total in 2012) which is now their major host area.
EJCE, vol.12, n.2 (2015)
Available online at http://eaces.liuc.it
104
Developed countries started enhancing their position since the 1990s and had overtaken developing countries in 2000-2007 as the most attractive host region for Indian OFDI. In the 1990s and 2000s Indian OFDI shifted toward M&As in developed countries (Kumar, 2007). In fact, since 2000, Indian MNCs have used overseas M&As as the main mode of entry into developed countries as against greenfield investment into developing ones. Indian MNCs continue to invest in developed-country based companies, particularly now that they are more affordable due to global crisis. The rise of host developed countries is also due to the adoption of overseas acquisitions by a large number of Indian MNCs to access foreign technologies and knowledge mostly concentrated in innovation driven developed region. Improved attractiveness of developed countries to Indian OFDI is also rooted in the rise of service firms like software, communication, etc., as India’s global players mostly focused on service-dominated developed countries.
A third geographical orientation of BRICs OFDI – which had originally been the most attractive one – is toward neighbouring countries. In the 1990s, Russian OFDI was first geared towards the close abroad, i.e. the CIS independent member states, as a legacy from the past. Various studies confirmed a still significant involvement of Russian FDI in Belarus, Kazakhstan and Ukraine (Yeremeyeva, 2009; Blyakha, 2009). The next most important host countries were CEECs as former CMEA members in which, like in the CIS, Russian companies enjoyed familiarity with local business conditions. Future new EU members, in a short lapse of time, took place among the most significant host countries for Russian OFDI. Such geographical distribution was specific to the first decade of Russian companies’ expansion abroad. Now, more non-European countries appear among the major host areas for Russian MNCs settlement, namely the U.S., Canada, the United Arab Emirates, and India.
Since 2005, Russian MNCs have made noticeable acquisitions in developing countries focused on Asia and Africa. Russian MNCs are somewhat losing their specificity as companies supposed to achieve most of their OFDI on an intra-regional base in countries located in the same region of the world as their home country. The only exception so far is Latin America – with no one of the first 30 host countries for Russian OFDI that belongs to – due to its remote location and institutional barriers such as absent bilateral non double taxation and investment treaties with Russia.
Some major host countries for Chinese OFDI are located in neighbouring South East Asia and East Asia, i.e. 15 among the first 36 host countries. Hence, Chinese MNCs, like Russian ones, are lean to privilege a close geographical area as well as developed market economies. However, they have already significantly spread in some African (South Africa, Nigeria, Zambia, Congo DR) and Latin American (Brazil, Peru) countries. At the end of the day, geographical distribution of China’s OFDI is more diversified than the Russia’s; first Russian OFDI in Latin America and Africa has emerged only recently.
Chinese MNCs invest in transition economies though the latter’s share in Chinese OFDI is small (3% of 2010 overall stock) but its growth rate is fast, concentrated in the CIS and Mongolia (Korniyenko and Sakatsume, 2009), with an increased interest in Central Asia (Kazakhstan, Turkmenistan). However, the focus in this area is definitely on Russia, ranked the 9th host country of Chinese OFDI, and the 5th one after Australia, Singapore, the US and South Africa when excluding offshore destinations and Hong Kong. For instance, Hisense owns a sales base in Russia and a production centre in Hungary, TCL disposes of factories in Russia and Poland. Chery Automobile invested in
W. Andreff, Outward Foreign Direct Investment from BRIC countries: Comparing strategies of Brazilian, Russian, Indian and Chinese multinational companies
Available online at http://eaces.liuc.it
105
an assembly line in Russia in 2006. Geely holds a joint production plant in Russia and sales companies in Ukraine. In the textile industry, there are many Chinese investments in Mongolia. CNOOC is a major shareholder in the Kazakhstan North Caspian Operations Company. Thus, Chinese MNCs harshly compete with Russian MNCs since the mid-2000s in the latter’s privileged areas for OFDI: Central Asia, other CIS countries and to some extent CEECs. A deep asymmetry lies in there: China significantly invests in Russia whereas the reverse investment from Russia into China is much less impressive. Chinese investors are much visible in Russia east of the Urals whereas Russian investors are nearly invisible in most Chinese provinces.
Brazil’s OFDI former concentration in the Americas has somewhat changed with expansion in Europe. High regional concentration, particularly in North America, Latin America and the Caribbean, which together accounted for 79% of all Brazil’s OFDI stock between 2001 and 2008, now belongs to the past. Among the first 32 host countries of Brazilian OFDI, just one developing country shows up that is Angola, a Portuguese-speaking country. Mozambique is further down the list. Overall Brazilian MNCs are neither attracted in less developed countries by their markets nor by their unit labour cost so far; when they invest in such countries this is basically for securing natural resources.
The share of developing countries in early OFDI from India increased all over the 1970s to attain its highest share ever: 96%. Then, Indian OFDI into Africa declined mainly because of growing policy restrictions on inward FDI, political violence and internal strife in African countries. The attraction of developing regions to Indian OFDI continued to be very high until 1999 though reoriented toward Asia. Over 1961-2007, a total of 1,674 Indian parent companies invested in as many as 92 developing countries. A last wave was led by Indian pharmaceutical MNCs that started up locating direct investment in Latin American countries, in particular Brazil, since 1999 (Sweet, 2010). Geographical pattern of Indian OFDI in developing countries has shown trends of spatial diversification in 2000-2007, the host Asia-Oceania region received about 39% of Indian OFDI, followed by Africa with 34%, South-East Europe and the CIS with 15% and Latin America and Caribbean with 13%. Since the 2000s, geographical distribution of Indian OFDI is a mix between neighbouring countries, major developed countries and tax havens. Such a distribution is rather similar to the one observed with other BRICs’ OFDI. Singapore is now the largest hosts to Indian OFDI since the two countries have signed a Comprehensive Economic Cooperation Agreement in 200513.
5. Industrial distribution of BRICs’ outward foreign direct investment
Since the industrial classifications used by central banks for publishing OFDI data are not identical at a disaggregated level across the BRICs14, a comparison of industrial distribution of their OFDI can only be conducted in rather broad terms.
Industrial distribution of Russian OFDI is specific when compared to other BRICs’ OFDI. Not only it is concentrated on a few industries, like in other BRICs, but Russian MNCs are overrepresented in natural resource exploitation, mining and
13 In the 1990s, Russia dominated as a host of Indian OFDI, largely due to a rupee-rouble agreement which enabled Indian MNCs to conduct Russian trade and investment in rupees.
14 The Central Bank of Russia has not published regularly a breakdown of OFDI by industry so far, and one is compelled to refer to the common knowledge about Russian MNCs’ industrial activity.
EJCE, vol.12, n.2 (2015)
Available online at http://eaces.liuc.it
106
metallurgical industries, then in traditional manufacturing industries, all inherited from the top pecking order of heavy industries in the former Soviet system. Cases in point are Gazprom, Lukoil, Itera, Tatneft, Novatek in the hydrocarbons industry; Severstal, Evraz, Norilsk Nickel, Alrosa, Basic Element (which owns Rusal), NMLK, Mechel, TMK, Koks, Metalloinvest, MMK, and Novolipetsk Steel in the metallurgical industry; Inter RAO UES in electricity production; Renova, OMZ and Borodino in machinery; AvtoVAZ, GAZ, UAZ and KAMAZ in the automotive industry; and in various industries, Investlesprom (paper-wood), Eurocement and LSR Group (building materials), Eurochem (chemical fertilizers), Acron (agro-chemistry), WimmBillDann, Russian Solod, SGI Group, Alterwest and Russian Wine Trust (agro-food industry).
However, Russian OFDI started booming in the 2000s in more modernised parts of the manufacturing industry with Sistema group (which owns MTS) in telephone production, Sitronics in telecom equipment, Vimpelcom, Altimo, Megafon and Alfa Group in telecom, Korolev Rocket and Space Corporation Energia in aeronautics, RTI Systems in aerospace and missile production, NPO Mashinostroyenia in military equipment. Big Russian insurance and financial companies and big banks have developed and internationalised in the formerly underdeveloped (Soviet) services industry such as Sberbank, VTB, Gazprombank, Alfa-bank and Bank of Moscow. Such MNCs exemplify a more recent industrial diversification of Russian OFDI which spreads over high tech and services industries resulting from a partial modernisation of the Russian industry which was launched at the dawn of the post-Soviet transition and became more deeply rooted after 1999.
The most striking feature in the industrial structure of Chinese OFDI is the high share of services. If one adds banking and trade to other services, the share of the tertiary sector is up to about 60% of overall OFDI (Table 13), which resembles the industrial distribution of OFDI from developed countries. Investing abroad in the tertiary sector is typical of the global strategy conducted by major Western MNCs (Andreff, 2003b). Chinese MNCs are about to stick to such strategy and likely to be ahead of Russian MNCs in this respect, none of the latter being known as a leader in the global services industry so far. A resource seeking strategy of Chinese MNCs is at work in mining. However, it is far from the overwhelming share of mining, oil and gas in Russian OFDI. With a noticeable difference: while Russian MNCs invest abroad looking for both new supply sources and new markets (oil and gas stations), Chinese strategy is almost exclusively geared towards securing a supply of raw materials for the domestic economy. Chinese MNCs look for securing their supply in natural resources all around the world: in Australia, Russia and Canada, but increasingly in Latin America, Central Asia, and Africa. Chinese OFDI in the manufacturing industry is less significant than in mining and its share has decreased in total from 2004 to 2010.
W. Andreff, Outward Foreign Direct Investment from BRIC countries: Comparing strategies of Brazilian, Russian, Indian and Chinese multinational companies
Available online at http://eaces.liuc.it
107
Table 13 - Industrial distribution of BRICs outward FDI stock (in %)
Brazil India* China Industry
2004 2010 2003 2010 2004 2010
Primary sector, of which: 1.9 31.2 4.3 8.3 15.2 14.9
Mining and quarrying 0.4 27.4
Petroleum and gas 1.0 3.7
Agriculture, forestry, fishing 0.5 1.1 1.9 0.8
Mining 13.3 14.1
Secondary sector, of which: 3.4 9.4 71.8 29.9 25.1 18.6
Food, beverage & tobacco 0.4 3.3
Non metallic products 0.1 2.3
Metallurgy 0.05 2.0
Manufacturing 10.1 5.6
Construction, real estate, infrastructures
4.8 5.7
Transportation, storage 10.2 7.3
Tertiary sector, of which: 94.7 59.3 23.9 61.8 59.7 66.5
Finance and insurance 51.9 38.3
Services to companies 37.1 10.5
Finance, banking 0.1 38.8 0 17.4
Trade 4.7 11.2 17.5 13.2
Other services 19.0 11.8 42.2 35.9
* FDI outflows
Sources: Banco Central do Brazil; UNCTAD and Reserve Bank of India; and MOFCOM Statistical Bulletin for China.
Brazilian MNCs primarily expanded abroad in the tertiary sector – over 88% of all OFDI until 2007, which compares with Chinese OFDI concentration in the services industry. Crisis has affected this industrial distribution: the share of the tertiary sector fell down to 59% while the share of the primary sector grew from 2-3% up to 31%. Above-listed trans-border M&As were many in the primary sector for securing natural resource supply in times of crisis. The manufacturing industry still remains minor in Brazilian OFDI which explains that efficiency seeking relocation of production in view of lowering unit labour costs has not emerged yet. A significant share of OFDI in resource-based industries and quite few manufacturing investments abroad reveal comparative advantages of a home country well-endowed in natural resources that Brazil shares to some extent with Russia (Andreff, 2015).
EJCE, vol.12, n.2 (2015)
Available online at http://eaces.liuc.it
108
Overall, industrial distribution of Indian OFDI reflects a change from essentially market seeking to more asset seeking strategy (Kumar, 2007). Until 1990, Indian OFDI concentrated in the manufacturing industry, in particular pharmaceuticals and chemicals. There was a first shift from manufacturing to services in the 1980s. Inefficiencies and low productivity due to inward looking policies led to a slowdown in OFDI from Indian manufacturing industry while the faster growing services sector in the national economy increased its share in OFDI. In the pre-1991 period market seeking OFDI developed on the basis of Indian firms’ intermediate technology in relatively low tech industries such as light engineering (Lall, 1986). The main technological advantage that Indian MNCs achieved through absorbing, assimilating, adapting and reverse engineering of foreign tech-nologies offered limited scope for exploitation in developed countries. Those modified foreign technologies to suit local demand and factor conditions rather provided Indian MNCs certain competitive advantages in other developing countries having similar economic conditions to India’s.
Since 1991, about 60% of Indian OFDI concentrated in IT, communication, software and media, trade, banking and finance. Within the manufacturing industry, power generation, electronic equipment, telecom, chemicals, pharmaceuticals and software development were among the predominant investors abroad. Knowledge-based industries - software and IT, depository institutions, professional, technical and scientific services – have heavily invested abroad since 2000. This maturing technologi-cal strength of large-sized Indian MNCs is now allowing them to exploit their competitive advantages even in developed countries. Consequently, in the 2000s, manufacturing has displaced services as the principal OFDI industry, and the primary sector’s share is now growing quickly. While pharmaceuticals, consumer electronics and automotive accounted for the bulk of manufacturing OFDI in the first half of the decade, the second half has seen a concentration in metals, energy and natural resource investments, and increasing activity by consumer goods and food and beverage MNCs. In the aftermath of global economic crisis, Indian FDI outflows15 shifted again toward services since 2010. While IT initially dominated services OFDI, investment in other services industries, such as financial and insurance services, entertainment and broadcasting, construction, and telecom, is now mounting.
6. The determinants of BRICs’ outward foreign direct investment
Economic determinants of a country’s OFDI are usually studied relying on econometric testing of their statistical significance as in Andreff (2003a). In this section is collected a sample of recent econometric studies (none of my own) that attempt to specify which variables are explanatory of OFDI respectively from Brazil, Russia, India and China. However, the surveyed econometric studies are classified here in an analytical framework that distinguishes FDI pull factors from push factors (Andreff, 2015). Pull factors are much in tune with IDP model (Dunning, 1981); they attract and drive inward FDI into a given country, otherwise coined host country’s factors of attractiveness to FDI (Andreff, 1999a). They differentiate host countries. Thus, when analysing OFDI, the explanatory power of pull factors is basically to point out which
15 Since Indian data about OFDI are basically published in terms of flows, they are more fluctuating than in other BRICs which publish OFDI stock; consequently, industrial distribution of OFDI flows (India) appears to be more fluctuating than the one of OFDI stock in other BRICs.
W. Andreff, Outward Foreign Direct Investment from BRIC countries: Comparing strategies of Brazilian, Russian, Indian and Chinese multinational companies
Available online at http://eaces.liuc.it
109
host countries do attract foreign investment flowing from any home country. Pull factors definitely are determinants of the geographical distribution between host countries of OFDI from (a given set of) home countries. They determine an outward investor’s trade-off between host countries, therefore a MNC choice to invest in one host country rather than another one on the basis of their attractiveness variables (Michalet 1997; Andreff 1999b).
Push factors usually are referred to as home country-specific. They are drivers for a home country substituting investment abroad to domestic investment; they explain why investment is pushed outwards domestic borders. They are embedded in the home country’s economy, in particular all factors that may depend on domestic industries and markets a company is involved in. Therefore, push factors are related to domestic industrial structure and are drivers of OFDI industrial distribution abroad. Push factors such as domestic market size (population as a proxy), economic development (GDP per capita), technological level, industrial distribution of value added across different industries have been successfully tested (Andreff, 2003a) as underlying the IDP model, at least in initial stages of OFDI development.
Starting with Brazil, it is the only BRIC for which recent econometric testing has retained push factors as explanatory variables of OFDI (Carvalho, 2009). However Ellström and Engblad (2009) have found that though the shape of Brazilian IDP correlates with the conceptual IDP model, the underlying factors causing the shifts in net outward investment are not due to development of the country´s OLI-advantages16. OFDI was initially caused by economic reforms and later by global business cycles as in many late outward investor countries such as Brazil: IDP theory explains the development of Brazil’s OFDI only to a limited extent. Indeed, in a further maturing stage of IDP model, pull factors have been tested as major explanatory variables for all BRICs’ OFDI (Appendix 1).
Four important factors pushed Brazilian firms to become new MNCs (Fleury and Fleury, 2009): privatisation; consolidation of the domestic consumer goods industry; denationalisation of the durable goods industry; and the creation of Mercosur. Concer et al. (2010) assess the common wisdom prevailing in Brazil that accounts for exchange rate variations as a significant push factor. Their results stress that although strong exchange rate is often blamed in Brazil for forcing companies to invest abroad, the evidence found in the aggregate data suggests that there is not that significant relationship between the level of foreign exchange rate and Brazilian OFDI.
Relying on host country data, Amal and Tomio (2012) estimate a model for Brazilian OFDI over eight years (2002-09) and 22 host countries data. Brazilian OFDI is positively related to host country’s economic performance, its market size assessed by GDP (the higher a host country’s GDP, the higher Brazilian OFDI into this country), macroeconomic stability (inflation, real exchange rate), and trade openness. GDP is statistically significant at a 1% threshold, meaning that Brazilian MNCs invest more in large economies, providing support to the market seeking hypothesis. Brazilian MNCs
16 A firm’s OFDI is a strategic response to its (O) ownership specific or competitive advantages, to the (L) locational advantages of host countries, and to (I) the opportunities open to internalize its O advantages between the home and selected host countries, with reference to the eclectic paradigm of international production (Dunning, 1988).
EJCE, vol.12, n.2 (2015)
Available online at http://eaces.liuc.it
110
are more likely oriented to invest in host markets with a growing demand and a higher level of economic openness, measured by a proxy of trade flows between the home and host countries. A negative relation between OFDI and real exchange rate means that the more the real is overvalued, the higher OFDI. Since GDP per inhabitant is not significant, Brazilian OFDI is not basically attracted to the most developed countries and spreads to less developed countries as well.
The above model also includes cultural distance as an explanatory variable. Cyrino et al. (2010) go further in considering psychic distance as a major determinant of Brazilian companies’ OFDI referring to Vahlne and Wiedersheim-Paul (1973). Psychic distance is a broad concept encompassing different administrative, economic and legal systems, as well as language and religious differences. The path of Brazilian OFDI is coherent with the gradualist perspective of the behavioural approach to internationalisation which states that companies choose to enter countries considering their psychic distance in order to accumulate experience in those markets before entering successively more distant countries, in line with the Uppsala school (Johanson and Vahlne, 1990). Amal and Tomio (2012) check a high correlation between cultural and geographical distance on the one hand and, on the other hand, institutional indicators meaning that a positive institutional environment in host country affects positively Brazilian MNCs’ investment strategy. This suggests that Brazilian MNCs are more involved in host countries exhibiting an improved institutional environment in terms of business climate, political stability, law enforcement, and government effectiveness.
When it comes to Russia the IDP model - though successfully tested for transition countries (Andreff, 2003a) - does not entirely account for the whole specificity of Russian MNCs any longer. It is contented that Russian OFDI is not actually verifying this model (Kalotay, 2008b) because it started up as a form of capital flight linked to bad domestic investment climate until 1998 – however it is a push factor. Moreover, a number of companies became MNCs overnight with the break-up of the former Soviet Union whereas those assets grabbed by a handful of powerful oligarchs in the privatisation drive had rapidly evolved into MNCs. Besides, some Russian MNCs compare to MNCs based in developed countries (Kuznetsov, 2010), as if Russia already was on the brink of reaching the fourth step of IDP model.
Kalotay and Sulstarova (2010) econometric testing relies only on data about trans-border M&As involving Russian firms which is indeed a major part of Russia’s overall OFDI. Market size is the most significant explanatory variable: Russian MNCs first invest abroad to capture foreign markets. Then they invest abroad to secure their supply of natural resources. The share of the tertiary sector in the host economy, distance from Russia, exchange rate, and cultural proximity are not significant determinants. Such modelling has two limitations: it does not check the determinants of Russian greenfield investment abroad and, more basically, it does not introduce a dummy variable for the influence of Russian government17 on strategies conducted by Russian MNCs or any other push factor.
17 Kalotay and Sulstarova (2010) take into account a change in the government policy with simply distinguishing the period when B. Yeltsin was the President of the Russian Federation from the one when V. Putin stepped in. Kalotay (2008b) stresses an increasing role of the government in controlling
W. Andreff, Outward Foreign Direct Investment from BRIC countries: Comparing strategies of Brazilian, Russian, Indian and Chinese multinational companies
Available online at http://eaces.liuc.it
111
With regards to India, an exhaustive survey of its OFDI determinants would have gone beyond the scope of this paper since it is the most studied country among the BRICs in this respect. Determinants that are looked for are pull factors. Anwar et al. (2008) test a significant relationship between Indian OFDI and host country’s real GDP (positive and significant at a 5% threshold). Real exchange rate of the host country’s currency is positively but not significantly related to Indian OFDI: it cannot be concluded that Indian MNCs invest in those countries with stronger or weaker currencies. The coefficient of distance to the host country’s capital city is negative and significant: the further a country from New Dehli the lower Indian OFDI, which explains the latter’s location primarily in neighbouring countries. The real GDP deflator in host country is positively related to Indian OFDI: Indian MNCs are attracted in rather inflationary countries.
Anwar and Mughal (2012) test whether economic freedom in host countries has a positive impact on attracting Indian OFDI: the relationship is found highly significant (at a 1% threshold) for all regions except Europe and the group of OECD countries (only significant at 5 %), and statistically non-significant for North America. The latter result may be due to the small number of observations for this region. Indian OFDI to all regions is strongly influenced by a prior experience of Indian investment in the region indicating that it is driven by prior knowledge of these markets (market seeking). The relationship with linguistic affinity is positive. Other results are that government size, tax incentives, ease of trade, credit regulation, access to sound money and business regulations are determinants of Indian OFDI whereas the security of property rights and inflation are less important drivers.
A gravity model is applied by Hattari and Rajan (2008) to a panel of annual data for 57 home and 57 host countries between 2000 and 2005 with a dummy variable for India. The outcome of econometric testing is that distance is statistically significant. A greater distance between home and host countries lowers OFDI flows. Physical distance may be a proxy for transaction costs, time zone differences and/or information gaps. Larger host countries experience more FDI inflows from India. OFDI flows to host countries with higher R&D spending as a share of GDP and with abundant natural resource endowment and where stock market capitalisation is significant. With regards to Indian OFDI three findings are noticeable. First, real exchange rate appears statistically significant – a rise in host country’s real exchange rate vis-à-vis the rupee reduces OFDI from India. Second, there is evidence that Indian OFDI is relatively more market seeking and somewhat less R&D seeking than OFDI from other Asian countries. Third, Indian MNCs appear to be as much resource seeking as MNCs from Asian countries.
In a further work, Hattari and Rajan (2010) test another specification of the gravity model where a binary variable is equal to one if two economies share a common official language, another binary variable is equal to one if two economies have a past colonial relationship; and a variable stands for the unobservable type of home country effects. Econometric results are basically the same: distance, a common official language, a past colonial relationship, bilateral real exchange rate, R&D spending,
those companies exploiting natural resources as the most specific factor that impeded applying all the FDI explanatory theories to the analysis of Russian MNCs.
EJCE, vol.12, n.2 (2015)
Available online at http://eaces.liuc.it
112
natural resource abundance, and stock market capitalisation are significant. In addition, a better pool of educated workers in host country is positive and significant, as well as a higher degree of trade openness and more intensive bilateral trade relations. However, the existence of a bilateral free-trade agreement is not statistically significant. With the India dummy, the gravity model variables (size and distance) remain highly robust, suggesting that drivers of OFDI by Indian MNCs are not that much different from their Asian counterparts.
Nunnenkamp et al. (2012) find that market-related factors, rather than motives to access raw materials or superior technologies, have dominated location choices of Indian MNCs. India’s OFDI is assumed to be resilient to weak institutions and economic instability in host countries. The impact of independent variables on location choices proves to be weak for the overall sample. Most strikingly, no evidence is found for either horizontal or vertical FDI choices. Horizontal FDI should be reflected in significantly positive coefficients of size and growth in host country markets while vertical FDI should be reflected in significantly negative coefficients of average per-capita income in host countries and significantly positive coefficients of their openness to trade. All these coefficients are statistically non-significant.
Results are ambiguous with respect to the hypothesis that India’s OFDI should be resilient to political uncertainty, weak institutions and economic instability in host countries. A positive coefficient for inflation, suggesting that economically less stable host countries with higher inflation rates receive more FDI from India, supports this hypothesis; a positive coefficient for the Heritage Index of Economic Freedom is in conflict with the hypothesis. Better governance and institutions as reflected in higher values of the Heritage index attract more FDI from India18. Since the index ranges from one to 100, one point improvement in economic freedom leads to an increase in FDI flows by 0.19%. A dummy variable equal to one for English speaking host countries is not significant. However, the presence of an Indian Diaspora in host country is significantly positive19. Those variables introduced to capture vertical and asset seeking FDI suggest that both types of OFDI played a minor role during the period under consideration (1996-2009). No evidence is found that India’s OFDI is strongly motivated by access to raw materials in resource-rich host countries or access to superior technology in advanced host countries, or in host countries with lower per-capita income. Market-related factors appear to have dominated location choices of Indian MNCs in the past.
Finally turning to China, Buckley et al. (2008) have tested the determinants of Chinese OFDI with basically a pull factors model, the only push factor being the liberalisation of renminbi exchange rate. More variables about Chinese governmental policy toward OFDI are missing on the push factor side. Significant variables coming out from econometric testing are market size, WTO membership, and cultural proximity; all favour market seeking. The change in exchange rate policy is significant
18 An efficient governance system in host countries is tested as attracting higher Indian OFDI (Garcia-Herrero and Deorukhkar, 2014). However, when controlling for Indian OFDI located in offshore financial centers, the host country’s ability to control corruption is not a significant determinant of Indian OFDI.
19 That Diaspora plays a crucial role in augmenting Indian OFDI through facilitating acquisition and exchange of technical know-how, market information and physical capital is also tested significant and positive by Anwar and Mughal (2013).
W. Andreff, Outward Foreign Direct Investment from BRIC countries: Comparing strategies of Brazilian, Russian, Indian and Chinese multinational companies
Available online at http://eaces.liuc.it
113
but not with the expected sign: surprisingly, Chinese OFDI is negatively associated with liberalisation of foreign exchange controls. Probably OFDI should be determined by ‘go global’ measures (see below) but they are not tested. No significant relationship is found between Chinese OFDI and economic and institutional variables while paradoxically the model does not provide support to resource seeking and advanced technology and know-how asset seeking strategies by Chinese MNCs, no more than a gravity (distance) determination. The contention that Chinese MNCs are attracted - or less reluctant to invest - in highly risky countries (Buckley et al., 2007; Morck et al., 2007) is not confirmed20. The primary strategy of outward Chinese investors is market seeking whereas resource seeking strategy is empirically less crystal-clear than with Russian firms.
In a comparable model, Rodriguez and Bustillo (2011) introduce a host country’s governance variable taken as an average of the six World Bank’s indicators for control of corruption, government effectiveness, political stability, regulation quality, rule of law, voice and accountability (Kaufmann et al., 2008 ). No significant relationship is found between governance and Chinese OFDI; strong governance in a host country neither attracts Chinese OFDI nor does low quality (thus risky) institutional framework hinder it. A resource seeking motive is found significant which fits better with actual strategies of Chinese MNCs observed at enterprise level. Poor institutions may well be linked to natural resource endowment because rent appropriation leads to rent-seeking, patronage and corruption. This is what Kolstad and Wiig (2009) had demonstrated beforehand, successfully testing the effect of interaction between natural resources and poor institutions on Chinese OFDI. In host countries with poor institutions natural resources attract Chinese OFDI. Finally, Fung and Garcia-Herrero (2012) find that Chinese OFDI is more attracted (than Indian OFDI) to more corrupt countries, but this result is mostly driven by Chinese investment in African countries. Chinese OFDI flows there into larger and poorer countries well-endowed with fuels.
7. BRICs’ multinationals and home country state
A study on BRICs-based MNCs (Holtbrügge and Kreppel, 2012) concludes that internationalisation of Brazilian and Indian companies is primarily driven by economic motives whereas Chinese and Russian firms receive substantial political support from their governments21 to invest abroad in strategically important industries. Is it so?
20 Due to risks involved in institutional uncertainty, barter and networking business, guanxi relationships based on informal norms, mutual trust, personal connections, ethnic linkages, corruption and the like in the Chinese post-communist transition, Chinese companies are often assumed to be more capable (than Western MNCs) to deal with troublesome regulation and opaque political constraints. They easily survive in comparably weak institutions in Central Asian and African host countries. Such experiences are even considered as an intangible asset of Chinese MNCs by Morck et al. To say the least, Russian MNCs started evolving at home in no less corrupted, networking and informal surroundings in a first stage of Russia’s economic transition, and they hold the same intangible asset.
21 A focus on the governments’ national development strategies and OFDI in emerging economies is found in Gammeltoft and Kokko (2013).
EJCE, vol.12, n.2 (2015)
Available online at http://eaces.liuc.it
114
7.1 China Incorporated: state promotion of Chinese state-owned multinationals
State intervention over Chinese OFDI relied on a high degree of regulation and control, a high number of state-owned MNCs, and the government quest for natural resources in short supply at home. The government formally pushes Chinese firms to go overseas by releasing motivating policies and providing support from the bureaucratic administration; informally it shapes their choices through propagating firm state ideology and national pride. Chinese government had adopted a ‘go global’ (zouchuqu) policy in 1999 which explicitly supported OFDI by Chinese companies; not only explicit, this support was eventually materialised in three fiats passed in 2004-05 which all promoted and regulated OFDI.
Chinese OFDI is subject to multiple layers of hierarchical bureaucratic supervision and regulation. The first layer is the State Council which blueprints China’s overall OFDI in the long term. A second layer, the NDRC is responsible for putting forward OFDI strategies and plans. Guided by the NDRC strategic plan, the Department of Foreign Capital and Overseas Investment (a unit of NDRC) drafts a list of privileged industries for OFDI, examines and approves key projects. Then the Ministry of Commerce (MOFCOM) is responsible for conducting multilateral negotiations on foreign investment and trade treaties, and its Department of Outward Investment and Economic Cooperation drafts operational OFDI regulation and supervises non-financial enterprises’ OFDI. The Ministry of Finance provides financial support to OFDI through special funds. The State-owned Assets Supervision and Administration Commission (SASAC) - in charge of reforming SOEs since 2003 so as to create profitable ‘national champions’ - manages and monitors state-owned assets in non-financial industries, including those invested abroad. A third layer consists in several other departments such as the State Administration of Foreign Exchange (SAFE) which surveys and approves the sources of funds, checks the legality of OFDI payments, manages overseas foreign exchange accounts, the China Development Bank, the Export-Import Bank of China and the China Export & Credit Insurance Corporation. Most Chinese OFDI are undertaken after state approval and with lax credits that fuel a soft budget constraint in state-owned MNCs. Province officials are involved: starting in 2003, SAFE and MOFCOM allowed OFDI of less than $3 million to be approved at provincial level. Thus, the state can act as the major player by explicitly and implicitly influencing firms’ decision making as regard OFDI.
In 2003, the NDRC defined the content of key OFDI projects which included: a/ natural resource seeking in areas where China is in short supply; b/ investment in manufacturing that promotes export of technologies, products, and equipment; c/ R&D collaborative projects which could bring in advanced technologies, managerial experience and talents; d/ M&As to increase firms’ international competitiveness and spread their market. State control over international activities of Chinese MNCs has been relaxed partly as China’s WTO accession commitment and in response to increasing ‘marketisation’ of domestic economy (Sauvant, 2005). The government deregulated OFDI approval and foreign exchange control. Since 2006, it overtly conducted a ‘national champions’ policy fuelled with accumulated foreign exchange reserves, just like in Russia; and the promotion of actually global champions since 2010. A new regulatory framework in 2009 further eased and decentralised OFDI approval procedures, eased foreign exchange management for overseas projects, and broadened
W. Andreff, Outward Foreign Direct Investment from BRIC countries: Comparing strategies of Brazilian, Russian, Indian and Chinese multinational companies
Available online at http://eaces.liuc.it
115
the sources of finance available for OFDI. Since 2010, in the 12th Five-year Plan, an ‘accelerating go-out’ strategy is pushed forward encouraging Chinese companies to invest abroad under policy guidance and with promised corporate autonomy. New rules for promoting OFDI with renminbi settlements were announced in 2011.
The efforts of China’s big businesses to go global can be thought of as being part of a national power-building of China state capitalism’s globalisation strategy. Facilitated by extended protection from the state, reaching beyond China’s national boundaries, Chinese large SOEs raise investment capital and take risks that their foreign competitors, submitted to a hard budget constraint, cannot (Yao et al., 2010). Indeed, the great bulk of Chinese OFDI stock is held by state-owned MNCs: 160 of them currently managed by SASAC account for about 84% of overall OFDI. Moreover, the government has effectively been the key operational decision maker in many investment projects and, with the creation of a sovereign investment fund in 2007, the China Investment Corporation (CIC), very active in overseas M&As, it is increasingly so. CIC is accountable for tunnelling foreign currency reserves into foreign equities, industrial OFDI, investment banks and hedge funds.
Chinese SOEs are large domestic players in major industries and backed up by the state as officially-recognised monopolies. They are suspected by foreign competitors to behave as monopolies outside China as well. Another fear deriving from Chinese OFDI by SOEs in some host countries is that it may act as a Chinese state soft power and influence abroad, promoting the interests of Chinese government and Communist Party. It is so because Chinese state-owned MNCs receive high level of state support in the form of credit lines and low interest rate loans from state-owned banks that reduce their capital cost and give them a competitive advantage over Western MNCs. Even partly privately-owned MNCs such as Haier, Lenovo, Huawei, which promote themselves as private companies, keep strong ties with the government. Besides, CEOs of the largest 53 Chinese state-owned MNCs are directly appointed by the Communist Party and senior managers of most SOEs are appointed by the SASAC; the concern is with weak corporate governance and state influence on companies’ management.
Chinese SOEs not only possess more firm-specific advantages than private companies (Liu and Scott-Kennel, 2011) but benefit from competitive advantages built up by state OFDI regulation and promotion. However, OFDI determinants are different for Chinese state-owned MNCs and privately-owned MNCs (Amighini et al., 2012). Private MNCs are attracted in large markets and by host country strategic assets; they are averse to economic and political risks when choosing their location abroad. State-owned MNCs follow China’s strategic needs and thus invest more in natural resources abroad, and are widely indifferent to political and economic conditions in host countries. They definitely have a dominant strategic role in Chinese OFDI and are very sensitive to push factors while privately-owned MNCs react more intensively to pull factors.
A significant difference between Chinese state-owned and Russian MNCs is that the former have been ‘corporatized’ but not privatised with a different outcome in terms of corporate governance. Listing their stocks in financial markets, at home and abroad, Chinese corporatized SOEs were transformed into joint stock companies benefiting from larger access to public finance. However their ownership highly concentrated in state hands gives their largest or unique shareholder a substantial
EJCE, vol.12, n.2 (2015)
Available online at http://eaces.liuc.it
116
discretionary power to use the firm’s resources; there from emerges more serious issues of insider control and possible minority shareholder despoilment than after Russian privatisations (Andreff, 2005). A dominant government ownership and control plants the worst seeds for flourishing corruption (Luo and Tung, 2007). Therefore, when transforming into MNCs, Chinese SOEs met deep criticisms, at least from Western competitors and host countries, about the accountability, transparency, and trustworthiness of their corporate governance.
Ren et al. (2010) contend that in conducting OFDI Chinese firms have three strategic motives that are to pursue country-level political objectives, seek for firm-level global competence, and escape domestic institutional constraints. The state plays a crucial role by designing formal and informal institutional framework to push up OFDI business. Formal and informal institutional supports are sources of comparative ownership advantages for Chinese firms, i.e. a push factor for OFDI which is nevertheless contingent on the firm’s size (small vs. large MNCs) and ownership (private companies vs. SOEs). The rise of China on the global political and economic scene reflects a significant impact of informal institutions such as national pride and state ideology. What is good for Chinese MNCs is good for China (Incorporated).
7.2 Russian multinationals: instrumental to Russia’s policy
Before crisis, Russian MNCs were described as a form of soft power which had replaced military power of the Russian regime, in particular throughout the close abroad (Vahtra, 2005). Under Yeltsin, the government was proactive through privatisation in creating big privately-owned companies in monopoly situation22 which swiftly transformed into MNCs though it did not really promote OFDI. Under Putin, Russian government has shifted its objectives toward promoting OFDI, mostly in the service of national strategic goals. Russia conducts a ‘national champions’ policy providing support to companies investing abroad in key industries.
In the 2000s, the government has reinforced its role in the economy through a swifter SOEs’ expansion and partial re-nationalisation in some industries. Since 2001, state ownership appeared to be on the rise in Russia and this affected Russian MNCs as well. Both state participation in the stock equity of some Russian MNCs and their internationalisation strategy have increasingly been influenced by Russia’s foreign policy. In addition, in 2007 seven big state corporations were launched the CEOs of which were appointed directly by the president of the Russian Federation. These corporations are in charge of industrial restructuring through gathering activities into big industrial trusts under public control in aeronautics, shipyards, the nuclear energy, new technologies, and banking. They started up internationalising by acquiring technological assets abroad (Vahtra, 2010) while the pressure of presidential administration on to them accentuated. Their strategies serve both domestic industrial policy and Russia’s foreign policy. In 2008, when Dmitry Medvedev, a former Gazprom CEO, was elected President of the Russian Federation, and Igor Sechin, a former Rosneft CEO, was appointed Deputy Prime Minister, the relationships between the government and its state-owned MNCs tightened a lot. The dividing line between government and business
22 Resulting in a number of oligarchs still being at the head of significant Russian MNCs today (Kuznetsov, 2007).
W. Andreff, Outward Foreign Direct Investment from BRIC countries: Comparing strategies of Brazilian, Russian, Indian and Chinese multinational companies
Available online at http://eaces.liuc.it
117
became blurred. In a meeting with Russian CEOs from the manufacturing industry in 2007, Putin enjoined them to proceed more and more with a production diversification, export of high tech products and investment abroad. Thus Russian MNCs, whatever privately or state-owned, are incited by the state to go on internationalising.
In industries linked to raw materials and natural resources, the government intends to keep an overall direct and indirect control over economic activity, including over Russian MNCs. A part of the manufacturing industry is considered by the state as strategic (aeronautics, ship building, automotive industry) and is hardly open to free competition while the government intervenes on Russian MNCs’ decisions. The part of the manufacturing industry which has modernised (ex: telecom, telephone) is more open to competition and here MNCs are much less dependent from the state. However, in November 2008, Prime Minister Putin asked to CEOs of big Russian enterprises to discuss with the state administration of their perspectives and future orientation, industry by industry. President Medvedev appealed Russian companies to “copy China” by expanding overseas and going on in a global spread of their foreign assets, though the government had not yet developed a consistent policy frame for assisting Russian MNCs’ global expansion.
The hydrocarbons industry, and its MNCs, is especially turned into a tool to serve Russia’s international relationships, including through controlling the network of oil and gas pipes, which is a means for a state control over exports. Indeed, many Russian MNCs achieve their OFDI for the sake of national economic interest as it is meant by highest governmental authorities. Russian state-owned MNCs are often heavily influenced by or incited to stick to major objectives of Russia’s foreign policy. Expansionist objectives of state- and privately-owned Russian MNCs are not autonomous vis-à-vis the government willingness to be a global player in the world economy. Russian political influence is a push factor of Russian investment expansion for instance in Central Asia; Russian government tries to help Russian MNCs in Asia and Africa as well.
7.3 Indian government policies geared toward outward foreign direct investment
India being a current account deficit economy, there was a need to closely monitor the country’s capital outflows in the past. Like most oil importing less developed countries India was a capital scarce economy. Besides, it introduced a planning system to force rapid economic development in the 1950s. Consequently, foreign (hard) currencies were in shortage and any OFDI by Indian firms was therefore subject to state permission (Agarwal, 1985). Before 1969 such permission was given only in exceptional cases. In the 1980s, Indian government granted incentives to OFDI through financial assistance, concessional loans from the Industrial Development Bank of India, and tax exemptions.
Since 1991, alongside with economic liberalisation, the policy geared toward inward FDI and governing OFDI has been liberalised. Liberalisation proceeded with national treatment to foreign firms, opening up of many sectors hitherto closed to FDI, and instituting an automatic approval route. A number of Indian firms like Tata (Goldstein, 2008) had to face global competition since the opening-up of Indian economy in 1991, making it imperative to become competitive in the face of new
EJCE, vol.12, n.2 (2015)
Available online at http://eaces.liuc.it
118
entrants, first in India, then through investing abroad. Indian companies adapted to foreign investors’ entrance through linkages, alliances and JVs, leveraging resources on them, imitating and learning from them23, and eventually investing abroad like them. Indian MNCs are often mentioned as fitting well with the LLL approach.
The Guidelines for Indian Joint Ventures and Wholly Owned Subsidiaries was emended in 1992, 1999 and 2002, and provided for automatic approval of OFDI proposals up to $2 million in 1992, $15 million in 1995 and $100 million in 2002 (and up to $150 million for OFDI in South Asian Association for Regional Cooperation countries - excluding Pakistan - and Myanmar). In 2004 the limit was removed and Indian MNCs are now permitted to invest abroad up to 100% of their net worth on an automatic basis. In the past recent years, the Reserve Bank of India (RBI) raised the overseas investment limit from 100% then 300% to 400% of the net worth under the automatic route. Indian MNCs were allowed to invest in energy and natural resources sectors in excess of the current limits with the prior approval of the RBI. A three year profitability requirement was removed for Indian companies making OFDI under the automatic route. Furthermore, Indian MNCs can now invest or buy assets abroad in areas unrelated to their business at home.
In the second half of the 2000s, the overall foreign exchange reserve position provided comfort to progressive relaxation of capital controls and simplification of procedures for OFDI from India. OFDI in banking sector and real estate activities must still be considered by an inter-Ministerial group. In 2005, access of Indian MNCs to international capital markets was liberalised, allowing them to float international special purpose vehicles to finance their overseas M&As. Earlier, Indian firms had to compensate for foreign exchange outflows with matching export earnings. Now they are allowed to use domestic bank borrowing and to borrow abroad to finance OFDI. In 2006, the prudential limit on bank financing was raised from 10% to 20% of overseas investment. Banks in India were allowed in 2007 to extend funded and/or non-funded credit facilities to wholly owned step-down subsidiaries of subsidiaries of Indian companies (where the Indian company holds 51% or more) abroad.
In 2011, the Reserve Bank allowed Indian parties to disinvest their stake abroad without prior approval where the amount repatriated on disinvestment is less than the amount of original investment. The Department of Industrial Policy and Promotion has identified South East Asia, Eastern Europe and Africa as zones where Indian MNCs would be encouraged to acquire assets as well as buy-out companies. The government approved a policy to support raw material asset purchases made by select public sector undertakings abroad. However beyond this liberalisation, from time to time the RBI cuts the maximum OFDI allowed to companies and individuals in order to bolster the rupee as, for example, in August 2013.
Indian OFDI has been primarily led by private enterprises except a few state-owned firms operating in the energy sector (Pradhan, 2010). As against the Chinese experience of OFDI’s soft power abroad, India’s OFDI has been largely driven by private initiative, with little coordination by the government, except in the energy sector. Indeed, India’s first wave of liberalisation, geared toward assisting partners from the
23 Singal and Jain (2012) stress that Indian firms built up strategic capacity to invest abroad through strategic alliances, JVs and technology acquisition.
W. Andreff, Outward Foreign Direct Investment from BRIC countries: Comparing strategies of Brazilian, Russian, Indian and Chinese multinational companies
Available online at http://eaces.liuc.it
119
South, and enhancing South-South cooperation and the Non-Aligned movement, was more obviously aimed at using its soft power in the conventional sense. In contrast, OFDI in the post-liberalisation period is targeted at buying existing firms in developed countries for competitiveness considerations.
7.4 Brazilian economic policies that affect outward foreign direct investment
Brazilian government does not strongly interfere in internationalisation of Brazilian firms; it has not designed a policy heavily targeting OFDI. However, some economic policies aim at helping the development of Brazilian MNCS like a privileged credit policy launched in 2002 and the creation of a sovereign fund while other policies do affect it indirectly such as the (former) privatisation process, trade liberalisation, a competitiveness policy geared towards Brazilian firms, and the exchange rate policy.
Special lines of credit are offered by the Brazilian National Development Bank – BNDES – to Brazilian companies that invest abroad. The BNDES created a specific credit line to support their outward expansion in 2002. Since then the Bank operates a credit line called “Investimento Direto Externo” to stimulate direct investment abroad, offering interest rates lower than market’s and covering the construction of new installations abroad, acquisition of equipment, M&As, turnover capital, and export support (Campanario et al., 2011). In 2009, as a counter-cyclical policy intervention, the BNDES lent $8 billion to foster the expansion of Brazilian MNCs in agribusiness, capital goods, construction, engineering, consumer electronics, energy, technical services, and IT. However Brazilian MNCs’ access to domestic finance is still limited and most have to use their own capital or rely on foreign funding.
Another policy initiative was the creation in December 2008 of a Brazilian sovereign wealth fund (Fundo Soberano do Brazil, FSB), a state-owned investment fund, to maximise long-term returns by investing some of Brazil’s foreign exchange reserves. This fund has a higher risk tolerance than official funds managed by monetary authorities, such as the BNDES and the Central Bank. The FSB objective is to support strategic Brazilian overseas M&As and greenfield projects in response to new investment opportunities abroad.
The process of companies’ internationalisation in Brazil followed the exhaustion of the import-substitution industrialisation model but without direct industrial policy to support new MNCs. Privatisation of industries such as steel, energy, mining, chemical products, and telecom in Brazil all over the 1990s have stimulated Brazilian OFDI. Privatisation in Brazil in the 1990s promoted the creation of national champions that later became large MNCs. The intent was to create large, specialised, restructured and publicly-listed firms such as Vale, Embraer and Petrobras; but the government still holds controlling shares in Petrobras, and golden shares in Vale and Embraer for strategic purpose and to prevent takeovers.
In the 1990s, together with a reversal of the former import substitution strategy, the Collor administration promoted a wide trade liberalisation effort. The result was one of promoting internal competition. The Mercosur devices implemented in 1994 have contributed to increased access into Brazilian market in that period. This indirectly encouraged FDI both ways, inward and outward. A competitiveness policy consisted in
EJCE, vol.12, n.2 (2015)
Available online at http://eaces.liuc.it
120
incentives for mergers to domestic firms offered by the BNDES which indirectly helped to promote Brazilian firms’ internationalisation by facilitating the creation of large MNCs, most notably in the past ten years. In absence of a clear investment policy and tax incentives to promote OFDI, Campanario et al. (2011) contend that public policies may contribute to better competitiveness and innovation of Brazilian enterprises and strengthen their capital outflows. The competitiveness of Brazilian MNCs may also improve with better regulating exchange rate fluctuations, attracting foreign savings and making the best of Brazilian foreign trade. Policy-making takes place in an institutional environment in which there are no generally accepted norms or rules to construct policy measures and instruments to deal with inward or outward FDI.
The appreciation of real due to an exchange rate anchor between 1995 and 1998 was relevant not only to curb inflation, but also trigger a fierce competitive pressure over domestic producers. After the administered regime was relaxed in 1999, the currency floated and weakened. However the quite favourable international environment helped both inward and outward capital flows in the following years until the exchange rate plummeted with the 2008 crisis. Although the impact of exchange rate policy on OFDI must not be overemphasised since it has been tested as non-significant by Concer et al. (2010).
8. Similarities and differences: a concluding snapshot
An overall comparative view of OFDI features by BRICs’ MNCs shows up in Table 14. First, there are four basic characteristics: a/ OFDI by BRICs’ MNCs primarily followed a market seeking strategy; b/ it initially privileged neighbouring markets; c/ it resorted to trans-border M&As rather than greenfield investment; d/ in particular when OFDI was geared toward developed countries’ markets. To a lesser extent three other features are common to all BRICs’ MNCs: e/ all BRICs have home-based MNCs investing abroad in a resource seeking perspective in the primary sector; f/ the share of the tertiary sector is significant in overall OFDI; while g/ the expansion of BRICs’ MNCs has been eased in the past decade by the home country foreign reserve accumulation.
Some traits oppose Brazilian and Indian MNCs to the legacy inherited from the past by post-communist Russian and Chinese MNCs. Round tripping and capital flight is less significant from Brazil-India than from Russia-China. Brazilian and Indian MNCs have benefitted from linkage, leverage and learning when competing with foreign inward investors into their home market whereas this approach was slightly less obvious with Chinese MNCs and not at all with Russian MNCs. The proportion of SOEs is lower among Brazilian-Indian MNCs as compared with the Russian-Chinese ones, thus fewer MNC managers are appointed by the state in the former than the latter. State support to OFDI promotion in Brazil-India cannot compare with Russia-China where OFDI is used as a tool for foreign policy and diplomacy. Though not absent in Brazil-India, state interference over OFDI is less invasive than in Russia-China, and less fueled by national pride and state ideology.
In all other dimensions listed in Table 14, MNCs from each BRIC are rather specific. In a face-to-face comparison between Brazilian and Indian MNCs, efficiency seeking is a secondary target of some Indian MNCs whereas it is hardly detected in Brazilian MNCs. The latter do not really pursue technological asset seeking while the
W. Andreff, Outward Foreign Direct Investment from BRIC countries: Comparing strategies of Brazilian, Russian, Indian and Chinese multinational companies
Available online at http://eaces.liuc.it
121
former are involved in such strategy, though less than Russian-Chinese MNCs, because Indian MNCs already are on the technological frontier in some industries like pharmaceuticals and IT services. For quite clear geographical reasons, Brazilian OFDI is geared toward Latin America contrary to Indian OFDI which is oriented to Asia and Africa in a more general context where Indian MNCs (just like Chinese MNCs) are investing in other BRICs. Brazil has not a remarkable share of its OFDI settled in other BRICs, just like Russia. The privatisation drive was an impulse to internationalisation of some Brazilian companies while liberalisation and deregulation in home economy have boosted OFDI by already internationalised Indian firms though triggering their geographical diversification toward developed countries. Indian MNCs are more threatened by foreign competitors in domestic market which contrasts with some local monopoly positions of Brazilian MNCs; this leads to more transparent corporate governance in the former though resorting to informal practices and corruption may not be much different in both. Two last striking contrasts are the significant share of the manufacturing industry in overall OFDI from India (much lower a share in Brazil) and a past temporary OFDI push factor of Brazilian real exchange rate appreciation.
The boom of Russian-based just like Chinese-based MNCs was really impressive in the past decade. It had taken place in a kind of oligarchic capitalism. A strategic coordination between big Russian-Chinese MNCs and Russia’s-China’s economic and foreign policies had been strengthened by the governments’ decisions to counteract the effects of global crisis. The foundations of a state capitalism intending to weigh on the global scene are more and more deeply rooted in both countries. Nowadays, state capitalisms accept the globalisation game and play on all cords of state influence and intervention in view of providing “institutionally embedded” competitive advantages to their state-owned MNCs. It is a success story so far: Gazprom, Lukoil, CNOOC, Sinochem, Norilsk Nickel, Vimpelcom, Huawei, Geely and so on actually are flourishing companies today and account for as standing among the global leaders in their respective industries.
Beyond these strong similarities, one witnesses some visible differences between Chinese and Russian MNCs. The privileged market-seeking strategy is more successful with China’s MNCs than Russia’s MNCs. In particular, a market asymmetry is noticed between Chinese MNCs significantly investing in Russia and its close abroad while Russian MNCs are shy investors in China and its neighbourhood. Some signs of a new efficiency-seeking strategy can be checked with Chinese MNCs whereas such strategy is absent from Russian MNCs. Chinese MNCs develop an asset-seeking strategy geared toward acquiring commercially viable technology rather than core research content while Russian MNCs’ asset-seeking focuses on Western technology and R&D intensive units. Round tripping OFDI is even more important from China than Russia whereas it is the other way round as regard capital flight. The geographical distribution of Chinese OFDI is more diversified than the Russian one, namely in Latin America and Africa - where first Russian OFDI have emerged only recently. The industrial structure of Chinese OFDI exhibits a higher share of services than in Russian OFDI. The proportion of privatised and privately-owned firms among MNCs is much higher in Russia than China. Chinese MNCs may well be bold enough to invest in more institutionally risky host countries with markedly weak governance and corruption, much more than Russian MNCs. Finally OFDI promotion is more institutionalised and structured in China than in Russia. Most of these differences explain why Chinese
EJCE, vol.12, n.2 (2015)
Available online at http://eaces.liuc.it
122
MNCs were only slightly, if at all, affected by the crisis from 2009 on, contrarily to Russian MNCs.
Table 14 - Similarities and differences between Brazilian, Indian, Russian and Chinese multinationals
OFDI features and strategies of MNCS from: Brazil India Russia China
Market-seeking strategy ++ ++ ++ ++
Resource-seeking strategy ++ + ++ ++
Efficiency-seeking strategy -- - -- --
Asset-seeking strategy - + ++ ++
Transborder mergers & acquisitions ++ ++ ++ ++
Round tripping OFDI - - + ++
Capital flight OFDI -- -- + --
Preliminary LLL role of inward FDI ++ ++ -- +
Initially neighbour markets for OFDI ++ ++ ++ ++
OFDI in developed countries' markets ++ ++ + +
OFDI in Latin America ++ - -- +
OFDI in Africa + ++ - ++
FDI in other BRICs -- + -- ++
Proportion of SOEs among big MNCs - - + ++
MNCs originating in the privatisation drive + - ++ --
Monopoly/dominant oligopoly in home market + - ++ ++
W. Andreff, Outward Foreign Direct Investment from BRIC countries: Comparing strategies of Brazilian, Russian, Indian and Chinese multinational companies
Available online at http://eaces.liuc.it
123
Table 15 : Major determinants of BRICs' outward foreign direct investment
Authors Models
Push factor models
Transition, emerging and developing economies
Andreff, 2003 OFDI/capita i = a + b GDP/capita i + c SECT i + d TECH i + e Gi + f DR i + ui
OFDI/capitai : outward foreign direct investment stock per inhabitant in the home country (i = home country)
GDP/capitai : gross domestic product per inhabitant in the home country
SECTi : GDP distribution across groups of industries in the home country
TECHi : technological level in the home country
Gi : GDP rate of growth in the home country
DRi : exchange rate variation of the home county’s currency
NOIpc : net outward foreign investment (outward direct minus inward direct investment) per capita
GNIpcap : gross national income per capita
OFDI: outward foreign direct investment
EJCE, vol.12, n.2 (2015)
Available online at http://eaces.liuc.it
124
GDPi : gross domestic country of a host country i
GDPi/POPi : GDP per inhabitant in country i
INFi inflation rate in country i
RERi : real exchange rate between country i’s currency and the real
TRDi : trade flows (import, export) between Brazil and country i
CDi : cultural distance between Brazil and country i
GDi : geographical distance between Brazil and country i
CCi : control of corruption in country i
GEi : government effectiveness in country i
PSi : political stability and absence of violence / terrorism in country i
RLi : rule of law (law enforcement) in country i
RQi : quality of regulation in country i
VAi : voice and accountability in country i
FDIMArh : OFDI from Russia to a host country h
GDPh and GDPr : Russia’s and host country’s gross domestic product, as proxies for their respective market sizes
NRh: share of natural resources and raw materials in overall Russian exports to each host country h, proxy for comparative endowment in natural resources
SERh : share of services in the host country’s GDP
DISTrh: the geographical distance between Russia and each host country, classical gravity variable
τrh : ruble exchange rate against a host country’s currency
CIS : dummy variable standing for CIS membership, proxy for cultural proximity between Russia and some host countries
PATh : the number of patents registered in a host country showing whether a country h is a favourable location for Russian MNCs where to acquire technological assets.
LogYi : logarithm of OFDI volume in year i
X1 : host country’s real GDP in $ billion
X2 : real GDP per capita
X3 : host country’s real GDP rate of growth
X4 : real exchange rate of the host country’s currency into US dollar
X5 : geographical distance between New Dehli and the host country’s capital (gravity variable)
X6 : real GDP deflator in host country (% change)
Ln (FDIijt) : logarithm of foreign direct investment outflow from country i to country j at time t
GDPit and GDPjt : respectively home and host country’s real GDP in US dollar at time t
LANGij : binary variable equal to one if the two economies share a common official language
COLONYij : binary variable equal to one if the two economies have a past colonial relationship
DISTij : geographical distance between one home and one host country
Xijt : vector of other explanatory variables influencing FDI outflows: bilateral real exchange rate of a home country’s with host country’s currency; R&D expenditure as a percentage of host country’s
W. Andreff, Outward Foreign Direct Investment from BRIC countries: Comparing strategies of Brazilian, Russian, Indian and Chinese multinational companies
Available online at http://eaces.liuc.it
125
GDP, energy production in host country, a ratio of market capitalisation to host country’sGDP, and a ratio of total trade to GDP in host country
ηi : unobservable type of home country effects
λt : unobservable time effects (year dummies)
FDIit : outward foreign direct investment from country i at time t
Xit : a vector that comprises variables varying by host country and over time: GDP, GDP per capita, GDP growth, inflation, trade openness, the ratio between current FDI stock and GDP, the Heritage index, the existence of a bilateral investment (or tax) treaty, and in some specifications the natural resource endowment and patents relative to population
Xi : a vector that comprises time-invariant host country characteristics: distance, the size of Indian diaspora in country i, and whether there is a common language
δt : year dummies
θi : host country dummies
GDPh : GDP per capita in host country h (captures market-seeking motives)
OILh : oil and gas exports of h to China (captures resource-seeking motives)
PATENTh : total annual patent grants in h (captures a technological asset-seeking strategy)
TD94 : the liberalisation of foreign exchange control in China in 1994
BITh : number of bilateral investment treaties concluded by a country with China
ACBIT : total number of BITs a country has concluded
DTTh : number of non-double taxation treaties concluded by a country with China
ACDTT : total number of DTTs a country has concluded
WTOh : membership of a country h in the World Trade Organisation
CPh : cultural proximity of country h to China
DISh : geographical distance of a country h from China
RISKh : political risk in country h
PPPh : purchasing power parity (to check the difference in inflation rates between a country h and China)
ERATEh : exchange rate of the h country’s currency against the renminbi
INFh : inflation in country h
EXPh : exports from country h to China
IMPh : country h imports from China INFDIh : index of market openness to FDI in country h, i.e. the ratio of inward FDI to GDP.
EJCE, vol.12, n.2 (2015)
Available online at http://eaces.liuc.it
126
References:
Agarwal J.P. (1985), ‘Pros and Cons of Third World Multinationals: A Case Study of India’, Kieler Studien, 195, Tübingen, J.C.B. Mohr (Paul Siebeck).
Amal M., Tomio B.T. (2012), Determinants of Brazilian Outward Foreign Direct Investment: A Host Country Perspective, EnANPAD, Rio de Janeiro.
Amighini A., Rabellotti R., Sanfilipo M. (2012), ‘Do Chinese SOEs and Private Companies Differ in their Foreign Location Strategies?’, EUI Working Paper, RSCAS2012/27, Florence, European University Institute.
Andreff W. (1982), Les multinationales hors la crise, Paris, Le Sycomore.
Andreff W. (1999a), ‘The global strategy of multinational corporations and their assessment of Eastern European and C.I.S. countries’, in: V. Tikhomirov, ed., Anatomy of the 1998 Russian Crisis, Contemporary Europe Research Centre, The University of Melbourne, Melbourne, 9-53.
Andreff W. (1999b), ‘Peut-on empêcher la surenchère des politiques d’attractivité à l’égard des multinationales?’, in: A. Bouët, J. Le Cacheux, eds., Globalisation et politiques économiques. Les marges de manœuvre, Paris, Economica, 401-423.
Andreff W. (2002), ‘The New Multinational Corporations from Transition Countries, Economic Systems, 26 (4), 371-379.
Andreff W. (2003a), ‘The Newly Emerging TNCs from Economies in Transition: A Comparison with Third World Outward FDI ’, Transnational Corporations, 12 (2), 73-118.
Andreff W. (2003b), ‘Les multinationales globales’, Repères, 187, Paris, La Découverte.
Andreff W. (2005), ‘Russian privatisation at bay: Some unresolved transaction and governance cost issues in post-Soviet economies’, in: A. Oleynik, ed., The Institutional Economics of Russia’s Transformation, Aldershot, Ashgate, 213-244.
Andreff W. (2014), ‘Outward foreign direct investment by Brazilian and Indian multinational companies: Comparison with Russian-Chinese multinationals’, in: S. Balshova, V. Matyushok, eds., The Trajectory of Growth and Structural Transformation of the World Economy Amid International Instability, People’s Friendship University of Russia, Moscow, 252-297.
Andreff W. (2015), ‘Maturing strategies of Russian multinational companies: Comparison with Chinese multinationals, in: D. Dyker, ed., Foreign Investment, in The World Scientific Reference on Globalisation in Eurasia and the Pacific Rim: Investment, Innovation, Energy, Migration and Development, Volume 1, London: Imperial College Press/World Scientific, forthcoming.
Andreff W., Balcet G. (2013), ‘Emerging Countries’ Multinational Companies Investing in Developed Countries: At Odds with the HOS Paradigm?’, European Journal of Comparative Economics, 10 (1), 3-26.
Anwar A.I., Hasse R., Rabbi F. (2008), ‘Location Determinants of Indian Outward Foreign Direct Investment: How Multinationals Choose their Investment Destinations?’, Copenhagen Business School, mimeo.
Anwar A.I., Mughal M. (2012), ‘Economic Freedom and Indian Outward Foreign Direct Investment: An Empirical Analysis’, Economics Bulletin, 32 (4), 2991-3007.
Anwar A.I., Mughal M. (2013), ‘The Role of Diaspora in Attracting Indian Outward FDI’, International Journal of Social Economics, 40 (11), 944-55.
Arockia Baskaran S., Chaarlas L.J. (2012), ‘A Study on the Outward FDI from India’, Zenith International Journal of Business Economics & Management Research, 2 (6), 49-60.
W. Andreff, Outward Foreign Direct Investment from BRIC countries: Comparing strategies of Brazilian, Russian, Indian and Chinese multinational companies
Available online at http://eaces.liuc.it
127
Blyakha N. (2009), ‘Russian Foreign Direct Investment in Ukraine’, Electronic Publications of Pan-European Institute, Turku School of Economics, 7/2009.
Buckley P.J. et al. (2007), ‘The Determinants of Chinese Outward Foreign Direct Investment’, Journal of Investment Business Studies, 38 (4), 499-518.
Buckley P.J. et al. (2008), ‘Explaining China’s outward FDI: An institutional perspective’, in: K.P. Sauvant, ed., The Rise of Transnational Corporations from Emerging Markets. Threat or Opportunity?, Cheltenham, Edward Elgar, 107-146.
Bulatov A. (1998), ‘Russian Direct Investment Abroad: Main Motivations in the Post-Soviet Period’, Transnational Corporations, 7 (1), 69-82.
Campanario M.A. et al. (2011), ‘Foreign Direct Investment: Diagnosis and Proposals for a Brazilian Public Policy’, Internext – Revista Eletrônica de Negócios Internacionais da ESPM, 6 (1), 125-158.
Campanario M.A., Stal E., Silva M.M. (2012), ‘Outward FDI from Brazil and its Policy Context, 2012’, Columbia FDI Profiles, Vale Columbia Center, Columbia University, New York.
Carvalho F.P. (2009), ‘What explains Brazilian Multinationals? An investigation on the relationship between internationalization and economic structure’, UNU MERIT, United Nations University, Maastricht, mimeo.
Carvalho F.P., Costa I., Duysters G. (2010), ‘Global Players from Brazil: Drivers and Challenges in the Internationalization Process of Brazilian Firms’, UNU-MERIT Working Paper Series, 2010-16, United Nations University, Maastricht.
Chudnovsky D., Lopez A. (2000), ‘A Third Wave of FDI from Developing Countries: Latin American TNCs in the 1990s’, Transnational Corporations, 9 (2), 31-73.
Clegg J.L., Voss H. (2012), Chinese Overseas Direct Investment in the European Union, Europe China Research and Advice Network, London.
Concer O.R., Turolla F.A., Margarido M.A. (2010), ‘Outward Brazilian Foreign Direct Investment: Impulses and Responses’, Internext – Revista Eletrônica de Negócios Internacionais da ESPM, 5 (1), 132-47.
Cyrino A.B., Barcellos E.P., Tanure B. (2010), ‘International Trajectories of Brazilian Companies: Empirical Contribution to the Debate on the Importance of Distance’, International Journal of Emerging Markets, 5 (3/4), 358-76.
De Beule F., Van den Bulcke D. (2012), ‘Locational Determinants of Outward Foreign Direct Investment: An Analysis of Chinese and Indian Greenfield Investments’, Transnational Corporations, 21 (1), 1-34.
Deng P. (2007), ‘Investing for Strategic Resources and its Rationale: The Case of Outward FDI from Chinese Companies’, Business Horizons, 50, 71-81.
Duanmu J.-L., Guney Y. (2009), ‘A Panel Data Analysis of Locational Determinants of Chinese and Indian Outward Foreign Direct Investment’, Journal of Asia Business Studies, 3 (2), 1-15.
Dunning, J.H. (1981), ‘Explaining the International Direct Investment Position of Countries: Towards a Dynamic or Development Approach’, Weltwirtschaftliches Archiv, 119, 30-64.
Dunning J.H. (1988), Explaining International Production, London, Unwin Hyman.
Dunning J., Kim C., Park, D. (2008), ‘Old wine in new bottles: A comparison of emerging market TNCs today and developed country TNCs thirty years ago, in: K. Sauvant, ed., The Rise of Transnational Corporations from Emerging Markets: Threat or Opportunity?, Cheltenham, Edward Elgar.
Dunning J.H., Lundan S.M. (2008), Multinational Enterprises and the Global Economy, Cheltenham, Edward Elgar.
EJCE, vol.12, n.2 (2015)
Available online at http://eaces.liuc.it
128
Dunning J.H., Narula R. (1998), ‘The investment development path revisited: Some emerging issues, in: J. H. Dunning, R. Narula, eds., Foreign Direct Investment and Governments. Catalysts for Economic Restructuring, Routledge, London, 1-41.
Elango B., Pattnaik C. (2007), ‘Building Capabilities for International Operations through Networks: A Study of Indian Firms’, Journal of International Business Studies, 38 (4), 541-95.
Ellström E., Engblad N. (2009), ‘The Investment Development Path of Brazil, School of Economics and Management’, Lund University, mimeo.
Filipov S. (2010), ‘Russian Companies: The Rise of New Multinationals’, International Journal of Emerging Markets, 5 (3/4), 307-332.
Filipov S. (2011), ‘Russia’s Emerging Multinational Companies amidst the Global Economic Crisis’, UNU-MERIT Working Paper Series, 2011-003.
Fleury A., Fleury M.T.L. (2009), ‘Brazilian multinationals: Surfing the waves of internalization’, in: R. Ramamurti, J.V. Singh, eds., Emerging Multinationals in Emerging Markets, Cambridge, Cambridge University Press, 200-43.
Fleury A., Fleury M.T.L., Bonini F.M. (2013), ‘The Brazilian Multinationals’ Approaches to Innovation’, Journal of International Management, 19 (3), 260-75.
Fung K.C., Garcia-Herrero A. (2012), ‘Foreign Direct Investment Outflows from China and India’, China Economic Policy Review, 1 (1), 1-15.
Galina S.V.R., Moura P.G.D. (2013), ‘Internationalization of R&D by Brazilian Multinational Companies’, International Business Research, 6 (8), 55-67.
Gammeltoft P. (2008), ‘Emerging Multinationals: Outward FDI from the BRICS Countries’, International Journal of Technology and Globalization, 4 (1), 5-22.
Gammeltoft P., Kokko A. (2013), ‘Outward Foreign Direct Investment from Emerging Economies and National Development Strategies: Three Regimes’, International Journal of Technological Learning, Innovation and Development, 6 (1-2), 1-20
Garcia-Herrero A., Deorukhkar S. (2014), ‘What Explains India’s Surge in Outward Direct Investment?’, BBVA Research Hong Kong, Working Paper, 14/16.
Goldstein A., Pusterla F. (2010), ‘Emerging Economies’ Multinationals: General Features and Specificities of the Brazilian and Chinese Cases’, International Journal of Emerging Markets, 5 (3/4), 289-306.
Hamilton G. (1986), ed., Red Multinationals or Red Herrings?: The Activities of Enterprises From Socialist Countries in the West, London, Frances Pinter.
Hansen M.W. (2010), ‘In search of the Indianness of Indian multinational enterprises: Is there anything special about the Indian path to outward foreign direct investment?’, in: K.P. Sauvant, J.P. Pradhan, A. Chatterjee, B. Harley, eds., The Rise of Indian Multinationals: Perspective of Indian Outward Foreign Direct Investment, New York, Palgrave MacMillan.
Hattari R., Rajan R. S. (2008) ‘Trends and Drivers of Bilateral FDI Flows in Developing Asia’, Hong Kong: Hong Kong Institute for Monetary Research, Working Paper, 11/2007.
Hattari R., Rajan R.S. (2010), ‘India as a Source of Outward Foreign Direct Investment’, Oxford Development Studies, 38 (4), 497-518.
Holtbrügge D., Kreppel H. (2012), ‘Determinants of Outward Foreign Direct Investment from BRIC Countries: An Explorative Study’, International Journal of Emerging Markets, 7 (1), 4-30.
Hu S.H., Ma H.Y., Zen G.T. (2012), ‘The Influence of Host Country’s Environments on the FDI Entry Mode Choice of Chinese Companies’, Business and Management Research, 1 (2), 39-47.
Johanson J., Vahlne J.E. (1990), ‘The Mechanism of Internationalisation’, International Marketing Review, 7 (4), 11-24.
W. Andreff, Outward Foreign Direct Investment from BRIC countries: Comparing strategies of Brazilian, Russian, Indian and Chinese multinational companies
Available online at http://eaces.liuc.it
129
Kalotay K. (2008a), ‘Takeoff and turbulence in the foreign expansion of Russian multinational enterprises’, in: K.P. Sauvant, ed., The Rise of Transnational Corporations from Emerging Markets. Threat or Opportunity?, Cheltenham, Edward Elgar, 113-144.
Kalotay K. (2008b), ‘Russian Transnationals and International Investment Paradigms’, Research in International Business and Finance, 22, 85–107.
Kalotay K., Sulstarova A. (2010), ‘Modelling Russian outward FDI’, Journal of International Management, 16, 131-142.
Kant R. (2008), ‘The rise of TNCs from emerging markets: Challenges face by firms from India’, in: K. Sauvant, ed., The Rise of Transnational Corporations from Emerging Markets, Cheltenham, Edward Elgar.
Kaufmann, D., Kraay A., Mastruzzi M. (2008), ‘Governance Matters VII: Aggregate and Individual Governance Indicators 1996-2007’, Policy Research Working Paper 4654, World Bank, Washington D.C.
Kolstad I., Wiig A. (2009), ‘What Determines Chinese Outward FDI?’, Working Paper, 3,CMI (Bergen).
Korniyenko Y., SakatsumeT. (2009), ‘Chinese Investment in the Transition Countries’, EBRD Working Paper, 107, January.
Kothari T., Kotabe M., Murphy P. (2013), ‘Rules of the Game for Emerging Market Multinationals. Companies from China and India’, Journal of International Management, 19 (3), 276-99.
Kumar N. (2007), ‘Emerging TNCs: Trends, Patterns and Determinants of Outward FDI by Indian Enterprises’, Transnational Corporations, 16 (1), 1-26.
Kuznetsov A.V. (2007), ‘Prospects of Various Types of Russian Transnational Corporations’, Electronic Publications of Pan-European Institute, 10.
Kuznetsov A.V. (2010), ‘Urgent Tasks for Research on Russian TNCs’, Transnational Corporations, 19 (3), 81-95.
Lall S. (1982), ‘The Emergence of Third World Multinationals: Indian Joint Ventures Overseas’, World Development, 10 (2), 127-46.
Lall S. (1983), ‘Multinationals from India’, in: S. Lall, ed., The New Multinationals: The Spread of Third World Enterprises, Chichester, John Wiley & Sons.
Lall S. (1986), Multinationals from the Third World: Indian Firms Investing Abroad, Dehli, Oxford University Press.
Lian L., Ma H. (2011), ‘Overview of Outward FDI Flows of China’, International Business Research, 4 (3), 103-107.
Liu J., Scott-Kennel J. (2011), ‘Asset-seeking Investment by Chinese Multinationals: Firm Ownership, Location, and Entry Mode’, Asia Pacific and Globalization Review, 1 (1), 16-35.
Liuhto K. (2001), Born International - The Case of the Latvian Shipping Company, Lappeenranta University of Technology, Lappeenranta.
Luo Y., Tung R.L. (2007), ‘International Expansion of Emerging Market Enterprises: A Springboard Perspective’, Journal of International Business Studies, 38, 481-498.
Maehler A.E. et al. (2011), ‘Knowledge Transfer and Innovation in Brazilian Multinational Companies’, Journal of Technology Management & Innovation, 6 (4), 1-14.
Matthews J.E. (2002), Dragon Multinationals: Toward a New Model for Global Growth, New York, Oxford University Press.
Michalet C.-A. (1997), ‘Strategies of Multinationals and Competition for Foreign Direct Investment’, Occasional Paper, 10, FIAS.
Milelli C., Hay F., Shi Y. (2010), ‘Chinese and Indian Firms in Europe: Characteristics, Impacts and Policy Implications’, International Journal of Emerging Markets, 5 (3/4), 377-97.
EJCE, vol.12, n.2 (2015)
Available online at http://eaces.liuc.it
130
Morck R., Yeung B., Zhao M. (2008), ‘Perspectives on China’s Outward Foreign Direct Investment’, Journal of International Business Studies, 39 (3), 337-350.
Nayyar D. (2008), ‘The Internationalization of Firms from India: Investment, Mergers and Acquisitions’, Oxford Development Studies, 36, 111-31.
Nunnenkamp P., Sosa Andrés M., Vadlamannati K.C., Waldkirch A. (2012), ‘What Drives India’s Outward FDI?’, Kiel Working Paper, 1800, Kiel Institute for the World Economy.
Pradhan J.P. (2008), ‘The Evolution of Indian Outward Foreign Direct Investment: Changing Trends and Patterns’, International Journal of Technology and Globalization, 4 (1), 70-86.
Pradhan J.P. (2010), ‘The Global Economic Crisis: Impact on Indian Outward Investment’, Transnational Corporations, 19 (1), 69-84.
Pradhan J.P. (2011), ‘Emerging Multinationals: A Comparison of Chinese and Indian Outward Foreign Direct Investment’, International Journal of Institutions and Economies, 3 (1), 113-48.
Ren B., Liang H., Zheng Y. (2010), ‘Chinese Multinationals’ Outward Foreign Direct Investment: An Institutional Perspective and the Role of the State’, Nankai University, Tianjin, mimeo.
Rodriguez C., Bustillo R. (2011), ‘A Critical Revision of the Empirical Literature on Chinese Outward Investment: A New Proposal’, Panoeconomicus, 5, 715-733.
Ruet J. (2010), ‘When a great industry globalizes: Indian conglomerates pioneering new trends in industrial globalization, in K.P. Sauvant, J.P. Pradhan, A. Chatterjee, B. Harley, eds., The Rise of Indian multinationals: Perspective of Indian Outward Foreign Direct Investment, New York, Palgrave MacMillan.
Rui H., Yip G.S., Prashantham S. (2010), ‘How different are Chinese foreign acquisitions? Adding an Indian comparison’, in: K.P. Sauvant, G. McAllister, A. Maschek, eds., Foreign Direct Investment from Emerging Markets. The Challenges Ahead, Basingstoke, Palgrave Macmillan, 173-195.
Saikia D. (2012), ‘India’s Outward Foreign Direct Investment’, International Business Management, 6 (1), 55-59.
Salidjanova N. (2011), Going Out: An Overview of China’s Outward Foreign Direct Investment, US-Chinese Economic & Security Review Commission, Beijing, 30 March.
Satyanand P.N., Raghavendran P. (2010), Outward FDI from India and its Policy Context, Vale Columbia Center on Sustainable International Investment, New York.
Sauvant K.P. (2005), ‘New Sources of FDI: The BRICs. Outward FDI from Brazil, Russia, India and China’, Journal of World Investment and Trade, 6, 639-709.
Singal A., Jain A.K. (2012), ‘Outward FDI Trends from India: Emerging MNCs and Strategic Issues’, International Journal of Emerging Markets, 7 (4), 443-56.
Skolkovo (2008), Emerging Russian Multinationals: Achievements and Challenges, Skolkovo Moscow School of Management, Moscow, November.
Sweet C. (2010), ‘Indian Pharmaceuticals in Brazil: Emerging Multinationals in Emerging Markets’, International Journal of Emerging Markets, 5 (3/4), 398-422.
Tolentino P.E. (2000), ‘Emergence and evolution of MNCs from Brazil’, in: P.E. Tolentino, ed., Multinational Corporations: Emergence and Evolution, London, Routledge, 93-122.
UNCTAD (2014), World Investment Report. Investing in the SDGs: An Action Plan, United Nations Conference on Trade and Development, New York and Geneva (and previous annual issues).
Vahlne J.E, Wiedersheim-Paul F. (1973), ‘Economic distance: Model and empirical investigation’, in: E. Hornell, J.E. Vahlne, F. Wiedersheim-Paul, eds., Export and Foreign Investments, University of Uppsala, Uppsala, 81-159.
Vahtra P. (2005), ‘Russian Investments in the CIS – Scope, Motivations and Leverage’, Electronic Publications of Pan-European Institute, 9/2005.
W. Andreff, Outward Foreign Direct Investment from BRIC countries: Comparing strategies of Brazilian, Russian, Indian and Chinese multinational companies
Available online at http://eaces.liuc.it
131
Vahtra P. (2010), ‘A Dawn for Outward R&D Investments from Russia?’,Electronic Publications of Pan-European Institute, 5/2010.
Vahtra P., Liuhto K. (2004), ‘Expansion or Exodus? – Foreign Operations of Russia’s Largest Corporations’, Electronic Publications of Pan-European Institute, 8/2004.
Villela A. (1983), ‘Brazilian multinationals’, in: S. Lall, ed., The New Multinationals: The Spread of Third World Enterprises, Chichester, John Wiley & Sons, 220-49.
Yao S., Sutherland D., Chen J. (2010), ‘China’s Outward FDI and Resource-seeking Strategy: A Case Study on Chinalco and Rio Tinto’, Asia-Pacific Journal of Accounting & Economics, 17, 313–326.
Ye Gang (1992), ‘Chinese Transnational Corporations’, Transnational Corporations, 1 (2), 125-133.
Yeremeyeva I. (2009), ‘Russian Investments in Belarus’, Electronic Publications of Pan-European Institute, 13/2009.
Yeung W. H. (1999), ed., The Globalization of Business Firms from Emerging Countries, Cheltenham, Edward Elgar.
Zhao H. (2011), ‘The Expansion of Outward FDI: A Comparative Study of China and India’, China: An International Journal, January.