Wharton Statistics Department Data Mining Bob Stine Department of Statistics The Wharton School of the Univ of Pennsylvania March 30, 2006 A regression modeler’s view on where it is and where it’s likely to go. Wharton Statistics Department Acknowledgments Colleagues Dean Foster in Statistics Lyle Ungar in Computer Science Support from Wharton Financial Institutions Center Cooperation of Federal Reserve Bank of Philadelphia Wharton Statistics Department Overview Some examples of data mining More detail on some than others Methods used in data mining Lots of choices! Challenges faced in data mining Common to all methods, old and new Directions Wharton Statistics Department Examples Finance Can I predict the stock market? Which loans are most likely to default? Management Which applicants to hire and train? Health Who is at greater risk of a disease? Images Is there a face in this image?
Transcript
Wharton Statistics Department
Data Mining
Bob StineDepartment of Statistics
The Wharton School of the Univ of PennsylvaniaMarch 30, 2006
A regression modeler’s viewon where it is and where it’s likely to go.
Wharton Statistics Department
Acknowledgments Colleagues
Dean Foster in Statistics
Lyle Ungar in Computer Science
Support from Wharton Financial Institutions Center
Cooperation of Federal Reserve Bank of Philadelphia
Wharton Statistics Department
OverviewSome examples of data mining
More detail on some than others
Methods used in data miningLots of choices!
Challenges faced in data miningCommon to all methods, old and new
Directions
Wharton Statistics Department
ExamplesFinanceCan I predict the stock market?Which loans are most likely to default?
ManagementWhich applicants to hire and train?
HealthWho is at greater risk of a disease?
ImagesIs there a face in this image?
Wharton Statistics Department
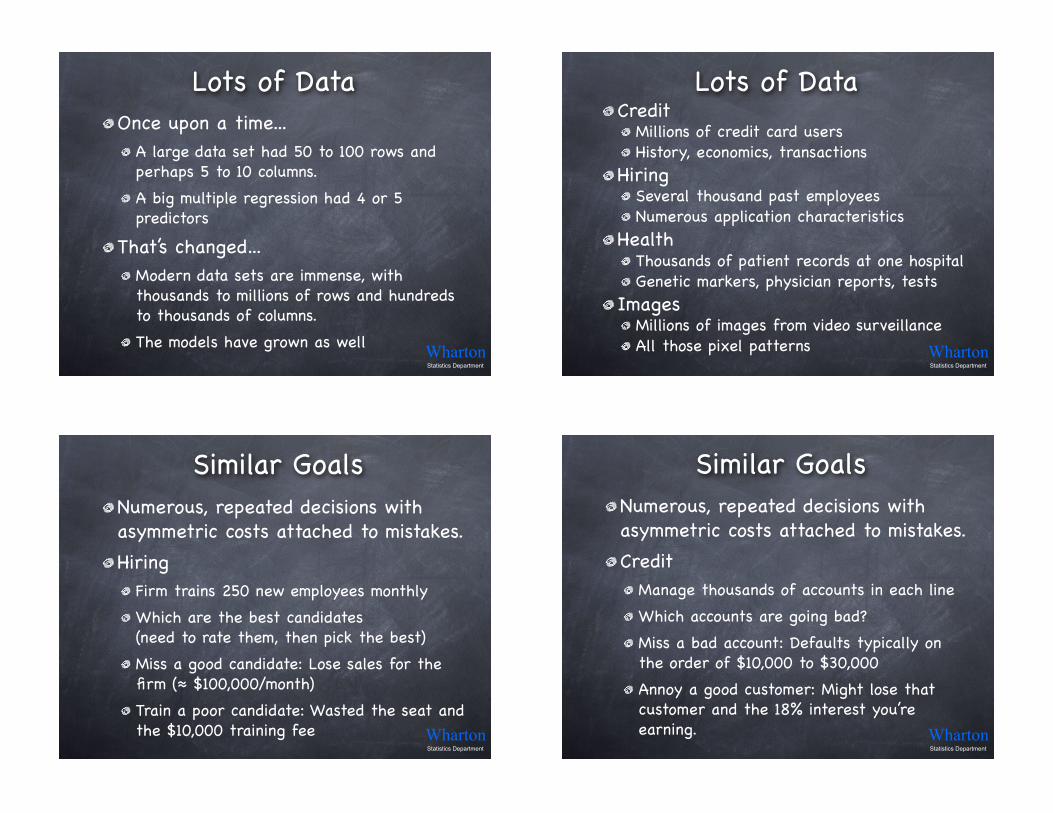
Lots of DataOnce upon a time...
A large data set had 50 to 100 rows and perhaps 5 to 10 columns.
A big multiple regression had 4 or 5 predictors
That’s changed...Modern data sets are immense, with thousands to millions of rows and hundreds to thousands of columns.
The models have grown as wellWharton Statistics Department
Lots of DataCredit
Millions of credit card usersHistory, economics, transactions
HiringSeveral thousand past employeesNumerous application characteristics
HealthThousands of patient records at one hospitalGenetic markers, physician reports, tests
ImagesMillions of images from video surveillanceAll those pixel patterns
Wharton Statistics Department
Similar GoalsNumerous, repeated decisions with asymmetric costs attached to mistakes.
HiringFirm trains 250 new employees monthly
Which are the best candidates(need to rate them, then pick the best)
Miss a good candidate: Lose sales for the firm (! $100,000/month)
Train a poor candidate: Wasted the seat and the $10,000 training fee Wharton
Statistics Department
Similar GoalsNumerous, repeated decisions with asymmetric costs attached to mistakes.
CreditManage thousands of accounts in each line
Which accounts are going bad?
Miss a bad account: Defaults typically on the order of $10,000 to $30,000
Annoy a good customer: Might lose that customer and the 18% interest you’re earning.
Wharton Statistics Department
Similar Use of ModelsPredictive models
Better predictions mean a competitive advantage
Classification
Prediction
But you sacrifice interpretation...Realize that the model is not causal.
Collinearity among features makes interpretation of the model a risky venture.
Lure of finding cause and effectWharton Statistics Department
Similar Problems, TooRare eventsRelatively few “valuable” decisions in the mix, buried among the more common cases.
Numerous explanatory featuresOften have more ways to explain the event than cases to check them (ie, more columns that rows in data)
Plus familiar complicationsMissing data, dependence, measurement error, changing definitions, outliers...
Wharton Statistics Department
Wide Data Sets
Application Rows Columns
Credit 3,000,000 350
Faces 10,000 1,400
Genetics 1,000 10,000
CiteSeer 500 "
Wharton Statistics Department
Choices in ModelingStructure of the model
Regression Y = b0 + b1 X1 + b2 X2 + ...Projection pursuit Y = c0 + c1D(X1, X2,..) + ...Trees Y = if(X1 < a) then ...
Scope of the searchRaw features, observed measurementsCombinations of features, interactionsTransformation of features
SelectionWhich features to use?
Wharton Statistics Department
Hands-on ExampleSmall model for pricing stocks suggests most of the key issues
ContextTheory in Finance known as the Capital Asset Pricing Model says that only one predictor explains returns on a stock...
namely returns on the whole market.
Day traders know this is wrong!Devise “technical trading rules” based on turning points, patterns in recent history
Wharton Statistics Department
CAPM Relationship
-0.3
-0.2
-0.1
0
0.1
0.2
Retu
rn o
n M
cD
onald
s
-0.1 -0.05 0 .05 .1
Return on SP500
Returns on McDonalds vsReturns on S&P 50048 months,2002-2005Slope is called “beta” of the stockR2 = 46.5%
t-stat for slope is 6.3
Fit = 0.006 + 1.4 S&PWe can do better than
that!
Wharton Statistics Department
A Better ModelAdd 16 features that implement variety of technical trading rules.Doubled R2 to 91%
Overall F = 17.8“Beta” about half prior sizet-statistic for slope still impressively large (t = 4.9)Seven other predictors have p-values less than 0.0001.
-0.3
-0.2
-0.1
0
0.1
0.2
Retu
rn o
n M
cD
onald
s
-0.25 -0.15-0.1 0 .05 .1 .15 .2
Fit
Fit = 0.017 + 0.7 S&P +...
Wharton Statistics Department
Other Features
Seven additional predictors add significant variation to the modelMany have larger t-statistics than the SP500 index
Model looks great from variety of perspectives.
Statistician says “great model”
Term Est |t| p
SP500 0.7 4.9 0
X22 0.2 3.7 .0009
X34 0.4 5.8 0
X36 0.3 5.0 0
X37 -.4 7.8 0
X39 0.3 6.3 0
X44 0.3 4.2 .0003
X46 -.4 6.5 0What are these other predictors?
Wharton Statistics Department
Better Mousetrap?Added predictors are random noise!So why do they look so good?
Selection biasPick variables to add from suite of 50 columns of random noise.
Forward stepwise regressionGreedy search adds most significant next predictor to the current model# “Optimization capitalizes on chance”
ResultBiased estimate of noise variance inflates t-stat and produces “cascade” of features Wharton
Statistics Department
ConsequencesExpanding the model
Claims better structure, higher accuracy
Replaces ! > 1 to ! < 1.
But in reality the expanded model is junk...
Adding random predictors ruins predictions
Conveys wrong impression of the role of the market on the returns of this stock
Stepwise regression... Evil?
Wharton Statistics Department
Feature SelectionDon’t blame stepwise for these problems
Failure: uncontrolled modeling processThe final model looks great on paper, if you don’t know how the predictors were chosen.
Cannot wait “until the end” and use classical methods to evaluate a model
Flaws in this example happen elsewhere Automatic methods expand the scope of the search for structure to wider spaces
Wharton Statistics Department
Easy to FixOnce you recognize the problem, it is relatively easy to control the modeling
Must keep random features out of model
Cross-validationUse a “hold-back” or “test” sample to evaluate the model.
Painful to give up data when you don’t have many cases (n = 48 here, or in genetics)
Bonferroni methodsUse all data to fit and evaluate model
Wharton Statistics Department
Second ExampleClassification problemIdentify onset of personal bankruptcy
IllustrateScope of data and size of models
Control greedy modeling process without using cross validation
Save validation data to show that “it works” rather than to pick the model itself
Make a claim about regressionWharton Statistics Department
Building a Predictive ModelClaimRegression is competitive with other types of predictive models
KeysExpand the scope of features
Interactions: subsets, nonlinearity
Missing data treated as interaction
Cautious control of selection of featuresAvoid bias in noise variance
Don’t trust CLT to produce accurate p-value
Wharton Statistics Department
Goals for ModelGoalReduce loss from bankrupt accounts without irritating profitable customers
Ideal customerBorrow lots of money, pay back slowly
Business strategy: triageContact customers who are “at risk” and keep them paying
Wharton Statistics Department
DataRows
3,000,000 months of activity
2200 bankruptcies
Columns350 basic features
Credit applicationLocation demographicsPast use of credit
Missing data indicators
Add all interactions... 66,430 more predictors
Wharton Statistics Department
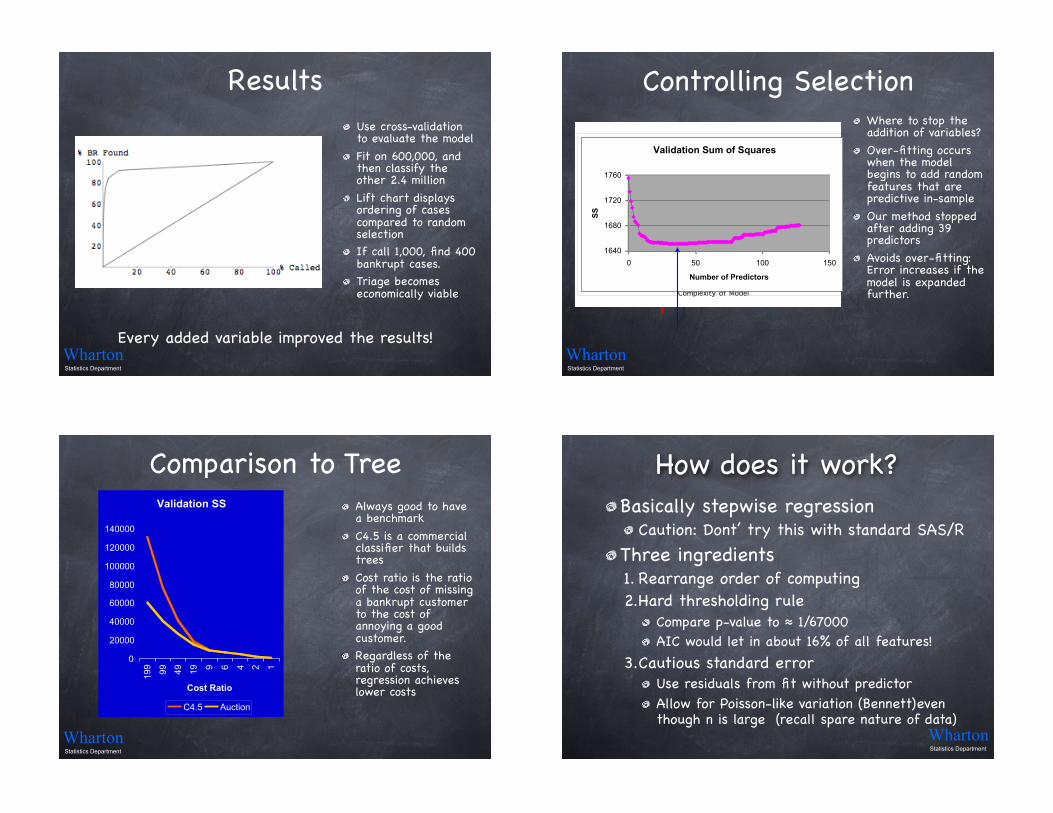
ResultsUse cross-validation to evaluate the model
Fit on 600,000, and then classify the other 2.4 million
Lift chart displays ordering of cases compared to random selectionIf call 1,000, find 400 bankrupt cases.Triage becomes economically viable
Every added variable improved the results!Wharton Statistics Department
Residual Sum of Squares
400
410
420
430
440
450
460
470
0 50 100 150
Number of Predictors
SS
20
40
60
80
100
120
0 10 20 30 40 50 60 70 80 90 100
Complexity of Model
Actual Error
Claimed Error
Controlling SelectionWhere to stop the addition of variables?
Over-fitting occurs when the model begins to add random features that are predictive in-sample
Our method stopped after adding 39 predictors
Avoids over-fitting: Error increases if the model is expanded further.
Validation Sum of Squares
1640
1680
1720
1760
0 50 100 150
Number of Predictors
SS
Wharton Statistics Department
Comparison to TreeAlways good to have a benchmark
C4.5 is a commercial classifier that builds trees
Cost ratio is the ratio of the cost of missing a bankrupt customer to the cost of annoying a good customer.Regardless of the ratio of costs, regression achieves lower costs
Validation SS
0
20000
40000
60000
80000
100000
120000
140000
199
99
49
19 9 6 4 2 1
Cost Ratio
C4.5 Auction
Wharton Statistics Department
How does it work?Basically stepwise regression
Caution: Dont’ try this with standard SAS/R
Three ingredients1. Rearrange order of computing2.Hard thresholding rule
Compare p-value to ! 1/67000AIC would let in about 16% of all features!
3.Cautious standard errorUse residuals from fit without predictorAllow for Poisson-like variation (Bennett)even though n is large (recall spare nature of data)
Wharton Statistics Department
Conclude from ExampleRegression is competitive with other methodologies for data mining... if you adapt it to the context
Ability to study residuals and other diagnostics facilitated improvements
DetailsOther adjustments include calibration
Foster and Stine, 2004, JASA
Portions of data are available from Dean’s web page Wharton
Statistics Department
Challenges
Lots of room for improvement!
Wharton Statistics Department
Challenges“That’s the way we used to work”
Population drift, moving target
Model in business changes the populationCredit: effective screening removes features
Hiring: model changed data collection
Cross-validation is optimistic!In CV, you truly predict new observations from the same population
How to fix this one?Can you detect this problem?
Wharton Statistics Department
Challenges“Simple models are better”
Often find that complex models offer little that not found with simpler model (Hand, 2006, forthcoming Stat Science)
Not our experience: Linear models do not find predictive structure in BR application, fare poorly compared to trees
Still suggests room to improve...Yuk: All but one predictor is an interaction
A different type of search finds linear terms
Wharton Statistics Department
Challenges“You missed some things”
Knowledgeable modelers with years of experience can suggest features that improve the model
Simple feature space omits special features that use domain-specific transformations
Can do better...Alternative methods allow additional expert input and do find richer structure
Wharton Statistics Department
ChallengesThere’s a lot more data!
Transaction information in the credit modelWe only used total spending and payments, not the nature of what was being bought
Semi-supervised modelingBillions of “unmarked” cases: images, text
Too expensive to mark them all
Room to improve...How to use the vast number of unmarked cases to improve the modeling of those that have been classified or scored?
Wharton Statistics Department
Overcoming ChallengesStill building regression models