REPORT of R.I.P.O. (Register of Orthopedic Prosthetic Implantology) Overall data Emilia-Romagna Region Hip and knee prostheses 1 st January 2000 – 31 st December 2003 Data elaborated by Register of Orthopedic Prosthetic Implantology (RIPO) Medical Technology Laboratory – I.O.R.
Transcript
REPORT of R.I.P.O.
(Register of Orthopedic Prosthetic Implantology)
Overall data Emilia-Romagna Region Hip and knee prostheses
1st January 2000 – 31st December 2003
Data elaborated by Register of Orthopedic Prosthetic Implantology (RIPO)
Medical Technology Laboratory – I.O.R.
INDEX
Foreword Pag. 4 PART ONE: HIP PROSTHESIS 6 1. RIPO support 7
1.1 Support for RIPO per hospital in years 2000-2003 7 1.2 Percentage of RIPO support year 2003 8 1.3 Ratio of public/private treatment
2. Quality of data 12 3. Type of operation 13
3.1 Number of operations according to province 14 3.2 Mobility of patients 16
4. Descriptive statistics of patients 18 4.1 Age 18 4.2 Sex 20 4.3 Side of surgery 21 4.4 Clinical condition 22 4.5 Bilateral surgery 23 4.6 Body mass index 23 4.7 Diagnosis according to operation 24 4.8 Reasons for revision 27
5. Types of hip prostheses 28 5.1 Cups in primary surgery 5.2 Cups in total revisions 29 5.3 Stems in primary surgery 30 5.4 Stems in total revisions 31 5.5 Number of different implanted types 32 5.6 Modular neck 32 5.7 Articular coupling and head diameter 33 5.8 Prostheses fixation 35 5.9 Cup fixation 37 5.10 Stem fixation 38 5.11Bone cement 39 5.12 Surgical techniques 40
6.Types of hemiarthroplasties 41 6.1 Stems and and heads used 41 6.2 Other characteristics of hemiarthroplasties 42
7. Antibiotic prophylaxis 43 7.1 Prophylaxis in primary surgery 43 7.2Prophylaxys in revision surgery 44
8. Blood transfusion 45 9. Complications during hospitalization 46 10. Death 47
10.1 Death after 30 and 180 days from surgery 48 11. Duration of hospitalization 49 12. Survival analysis of primary implants 51
12.1 Cox multivariate analysis 51 12.2 Survival curves 53 12.2.1 Survival analysis of total hip arthroplasty 54 12.2.2 Survival analysis of acetabular component 60 12.2.3 Survival analysis of femoral component 61 12.2.4 Survival analysis of total revisions 62 12.2.5 Survival analysis of hemiarthroplasties 64
2
PART TWO: KNEE PROSTHESIS 66 13. RIPO support 67
13.1 Support for RIPO per hospital in years 2000-2003 67 13.2 Percentage of RIPO support year 2003 68 13.3 Ratio of public/private treatment 71
14.Type of operation 72 15. Descriptive statistics 73
15.1. Age 73 15.2. Sex 75 15.3 Side of surgery 76 15.4 Clinical condition 77 15.5 Body mass index 78 15.6 Diagnosis according to operation with unicompartmental prostheses 79 15.7 Diagnosis according to operation with bicompartmental prostheses 80 15.8 Reasons for revision 81
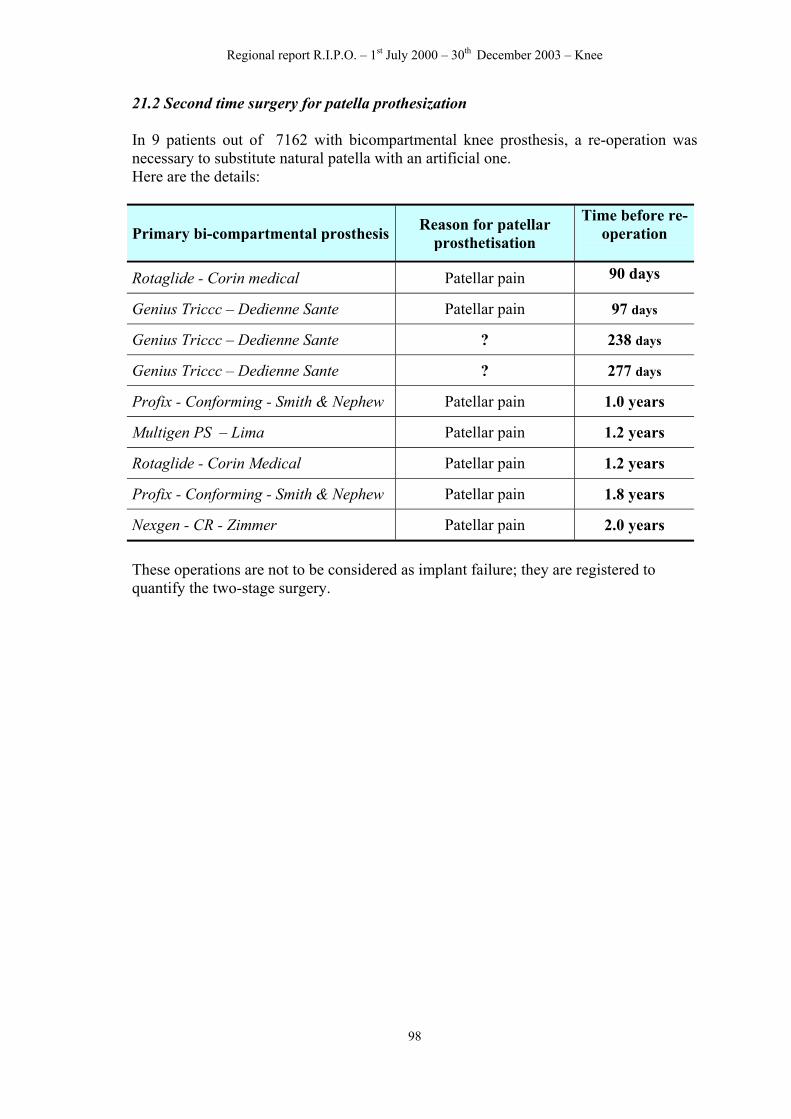
21.1 Survival analysis of uni and bi-tricompartmental prostheses 94 21.2 Second time surgery for patella prothesization 98
3
Foreword This report, elaborated by the Register of Orthopedic Prosthetic Implantology (RIPO), presents the most significant results of the descriptive statistical analyses performed on operations of hip and knee arthroplasty carried out in Emilia-Romagna, between 1st January 2000 and 31st December 2003. (http://ripo.cineca.it) The data include for the hip, besides primary arthroplasty, revision surgery, prosthesis removal and hemiarthroplasty In section two knee prostheses (both uni and bicompartmental) revisions and prosthesis removal are reported. As in the past, data from the orthopedic wards was provided on paper forms. Registry staff transferred the data via internet to the databank run by CINECA (Interuniversity Consortium of North-eastern Italy) which was responsible for computer management and security aspects of the data. Statistical analysis was performed by Registry statistics staff. When forms were missing or lacking important information (patient identification, type of prosthesis implanted), the representative of the hospital was asked to supply it. In addition, a process of comparison was started between the SDO (Regional Health Department) and RIPO to identify any omissions in sending information to the registry, thus allowing the agencies to fill any gaps. Up to now, the comparison has been made only for 2001. Over the next few months it should be complete. Likewise, a link has been established with the regional mortality databank to perform correct statistical assessments on patients actually alive. This report, combined with the report on the data of single units, provides a full picture of regional implantology practice, and offers surgeons a very useful tool for making decisions and informing patients. Notes on methodology Elaboration includes data concerning the period 1st January 2000 to 31st December 2003, which arrived before 1st June 2004. The collection of data about the knee started in July 2000. The identification of the type of prosthesis implanted is reported in detail: the manufacturer’s name is reported as it appears on the label, even if the trade mark varies slightly. The data collected to date has a maximum follow-up of 4 years, therefore, prosthesis survival evaluations can be made. Survival curves were calculated and plotted according the actuarial method of Kaplan and Meier. The prosthesis is considered to be “surviving” until surgical intervention is needed to replace even one component. Thus, revision surgery represents the end-point. The degree of reliability of the curves may be influenced by the incomplete communication of operations performed in Emilia-Romagna to RIPO; that is why comparison with the SDO databank was made.
4
Scientific board of RIPO On March 4th 2004 the Scientific board of RIPO met for the first time to elect its internal chairman. The board will remain in charge for three years is composed by::
- Dr.ssa Kyriakoula Petropulacos , Responsabile del Servizio Presidi Ospedalieri – Regione Emilia-Romagna;
- Dr. Salvatore Ferro, Dirigente Medico del Servizio Presidi Ospedalieri – Regione Emilia-Romagna;
- Dr. Roberto Grilli, Responsabile Area Governo Clinico – Agenzia Sanitaria Regionale – RER;
- Dr. Andrea Donatini, Responsabile Area Economia e Salute - Agenzia Sanitaria Regionale – RER;
- Dr. Paolo Costa, Direttore U.O. Ortopedia e Traumatologia – Az. Osp. di Reggio Emilia;
- Prof. Leo Massari, Direttore U.O. Ortopedia – Az. Osp. Universitaria di Ferrara;
- Dr Luigi Prosperi, Direttore U.O. Ortopedia - Ospedale di Bentivoglio – Azienda USL Bologna Nord;
- Dr. Luigi Specchia, Direttore U.O. Ortopedia - Ospedale di Cento – Az. USL di Ferrara;
- Dr. Aldo Toni, Dir. 1° Divisione Ortopedia e Traumatologia - Direttore Laboratorio Tecnologia Medica . – II.OO.RR; president
- Dr.ssa Susanna Stea, R.I.P.O. – II.OO.RR;
- Dr. Enzo Zanini, Chirurgo Ortopedico - Casa di Cura Villa Erbosa, Bologna;
- Dr.ssa Silvia Cremonini, Funzionario del Servizio Presidi Ospedalieri – Regione Emilia-Romagna.
Bologna, 20th June 2004 This report has been prepared by Dr. Susanna Stea, Dr. Barbara Bordini, Dr. Manuela De Clerico, with the collaboration of Greta Ghelfi, Elena Nanni, Carolina Sangiorgi, graphic by Luigi Lena. Supervision by Dr. Aldo Toni Translation by Keith Smith
Technological partner for computer management of the database is CINECA of Bologna.
5
Regional report R.I.P.O. – 1st January 2000 – 31st December 2003 – Hip
PART ONE: HIP PROSTHESIS
6
Regional report R.I.P.O. – 1st January 2000 – 31st December 2003 – Hip
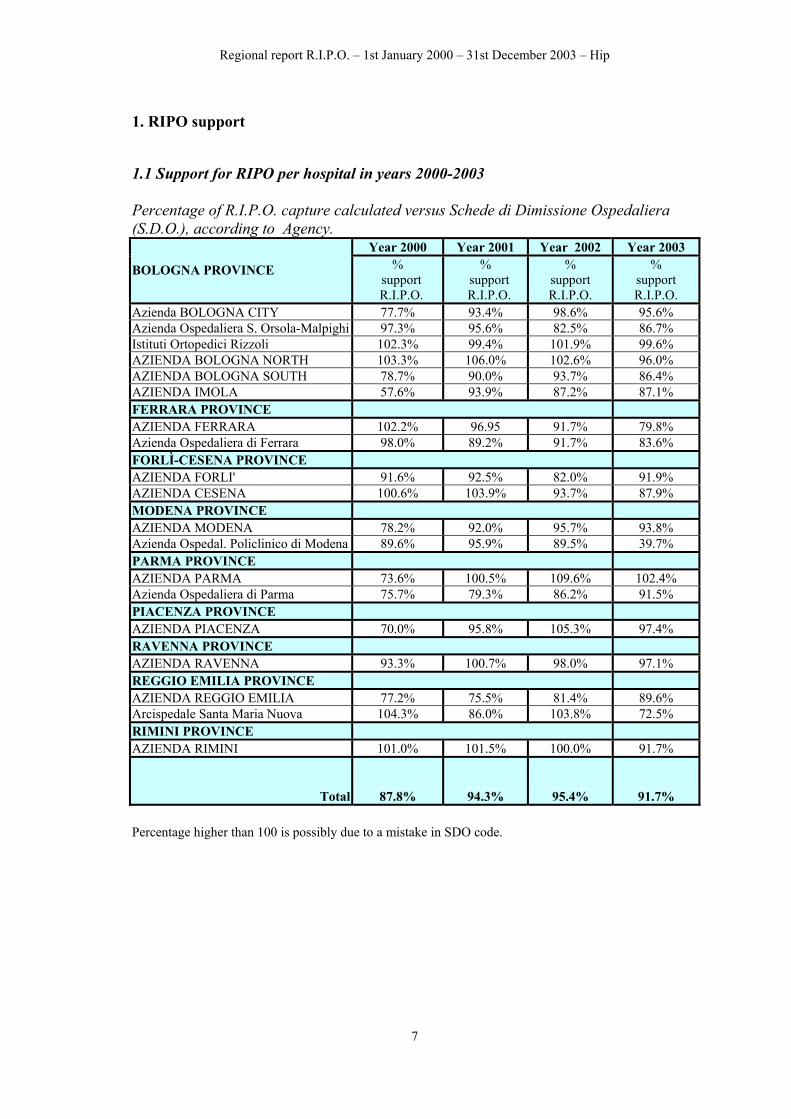
1. RIPO support 1.1 Support for RIPO per hospital in years 2000-2003 Percentage of R.I.P.O. capture calculated versus Schede di Dimissione Ospedaliera (S.D.O.), according to Agency.
Year 2000 Year 2001 Year 2002 Year 2003
BOLOGNA PROVINCE % support R.I.P.O.
% support R.I.P.O.
% support R.I.P.O.
% support R.I.P.O.
Azienda BOLOGNA CITY 77.7% 93.4% 98.6% 95.6% Azienda Ospedaliera S. Orsola-Malpighi 97.3% 95.6% 82.5% 86.7% Istituti Ortopedici Rizzoli 102.3% 99.4% 101.9% 99.6% AZIENDA BOLOGNA NORTH 103.3% 106.0% 102.6% 96.0% AZIENDA BOLOGNA SOUTH 78.7% 90.0% 93.7% 86.4% AZIENDA IMOLA 57.6% 93.9% 87.2% 87.1% FERRARA PROVINCE AZIENDA FERRARA 102.2% 96.95 91.7% 79.8% Azienda Ospedaliera di Ferrara 98.0% 89.2% 91.7% 83.6% FORLÌ-CESENA PROVINCE AZIENDA FORLI' 91.6% 92.5% 82.0% 91.9% AZIENDA CESENA 100.6% 103.9% 93.7% 87.9% MODENA PROVINCE AZIENDA MODENA 78.2% 92.0% 95.7% 93.8% Azienda Ospedal. Policlinico di Modena 89.6% 95.9% 89.5% 39.7% PARMA PROVINCE AZIENDA PARMA 73.6% 100.5% 109.6% 102.4% Azienda Ospedaliera di Parma 75.7% 79.3% 86.2% 91.5% PIACENZA PROVINCE AZIENDA PIACENZA 70.0% 95.8% 105.3% 97.4% RAVENNA PROVINCE AZIENDA RAVENNA 93.3% 100.7% 98.0% 97.1% REGGIO EMILIA PROVINCE AZIENDA REGGIO EMILIA 77.2% 75.5% 81.4% 89.6% Arcispedale Santa Maria Nuova 104.3% 86.0% 103.8% 72.5% RIMINI PROVINCE AZIENDA RIMINI 101.0% 101.5% 100.0% 91.7%
Total
87.8%
94.3%
95.4%
91.7% Percentage higher than 100 is possibly due to a mistake in SDO code.
7
Regional report R.I.P.O. – 1st January 2000 – 31st December 2003 – Hip
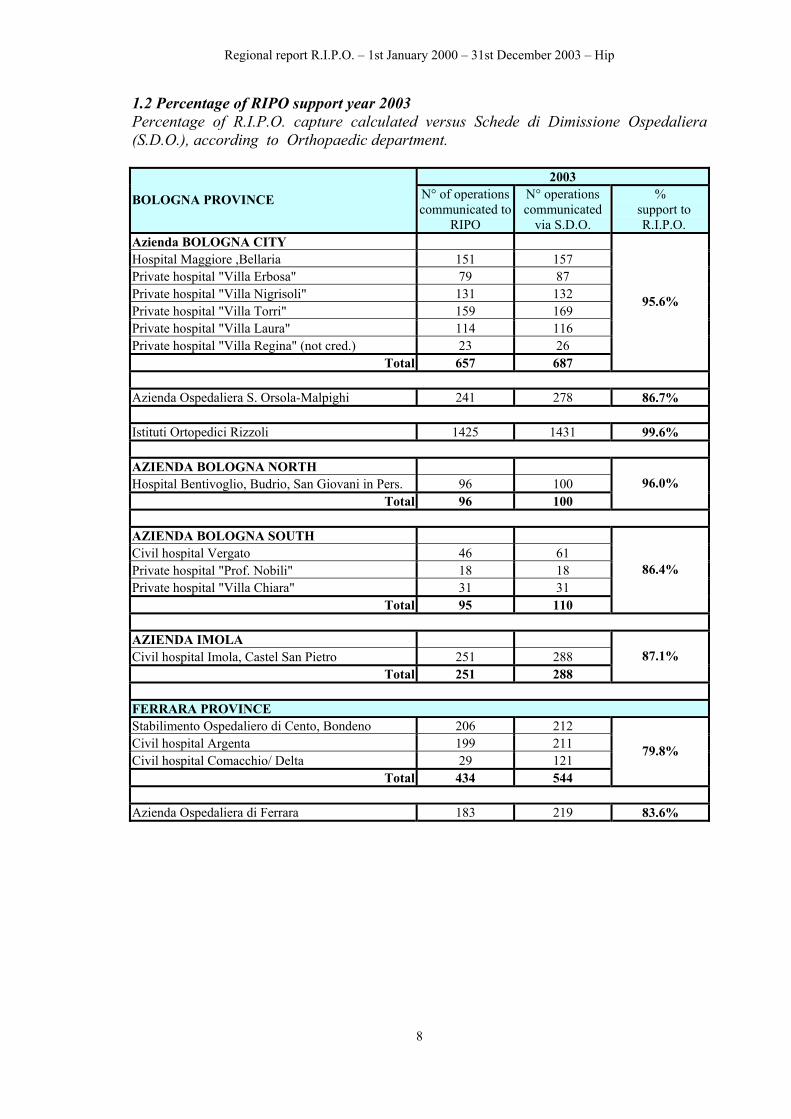
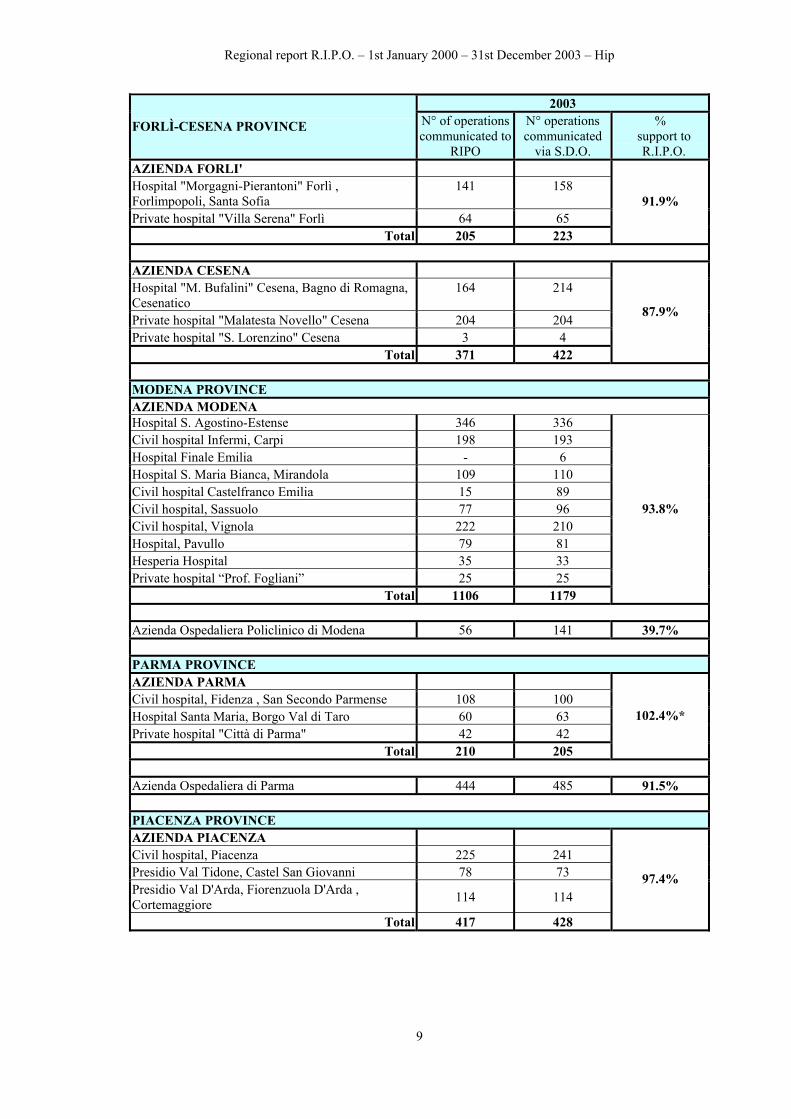
1.2 Percentage of RIPO support year 2003 Percentage of R.I.P.O. capture calculated versus Schede di Dimissione Ospedaliera (S.D.O.), according to Orthopaedic department.
Azienda Ospedaliera Policlinico di Modena 56 141 39.7% PARMA PROVINCE AZIENDA PARMA Civil hospital, Fidenza , San Secondo Parmense 108 100 Hospital Santa Maria, Borgo Val di Taro 60 63 Private hospital "Città di Parma" 42 42
Total 210 205
102.4%*
Azienda Ospedaliera di Parma 444 485 91.5%
PIACENZA PROVINCE AZIENDA PIACENZA Civil hospital, Piacenza 225 241 Presidio Val Tidone, Castel San Giovanni 78 73 Presidio Val D'Arda, Fiorenzuola D'Arda , Cortemaggiore 114 114
Total 417 428
97.4%
Regional report R.I.P.O. – 1st January 2000 – 31st December 2003 – Hip
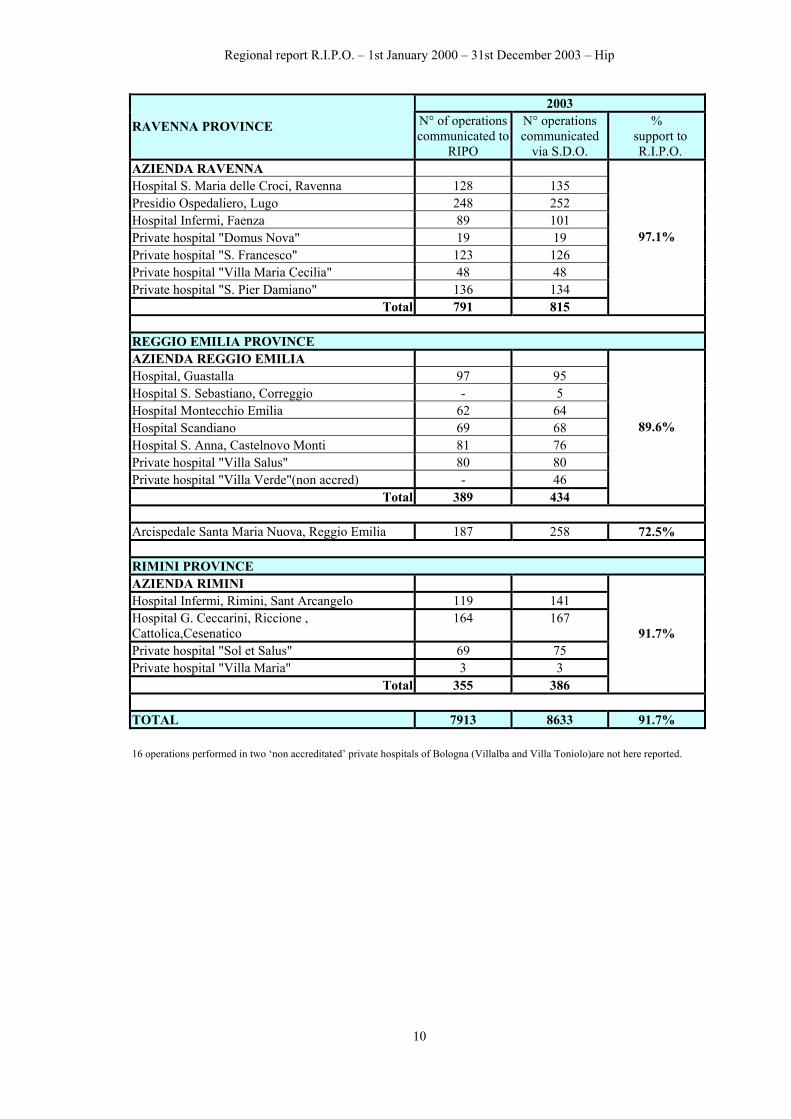
TOTAL 7913 8633 91.7% 16 operations performed in two ‘non accreditated’ private hospitals of Bologna (Villalba and Villa Toniolo)are not here reported.
10
Regional report R.I.P.O. – 1st January 2000 – 31st December 2003 – Hip
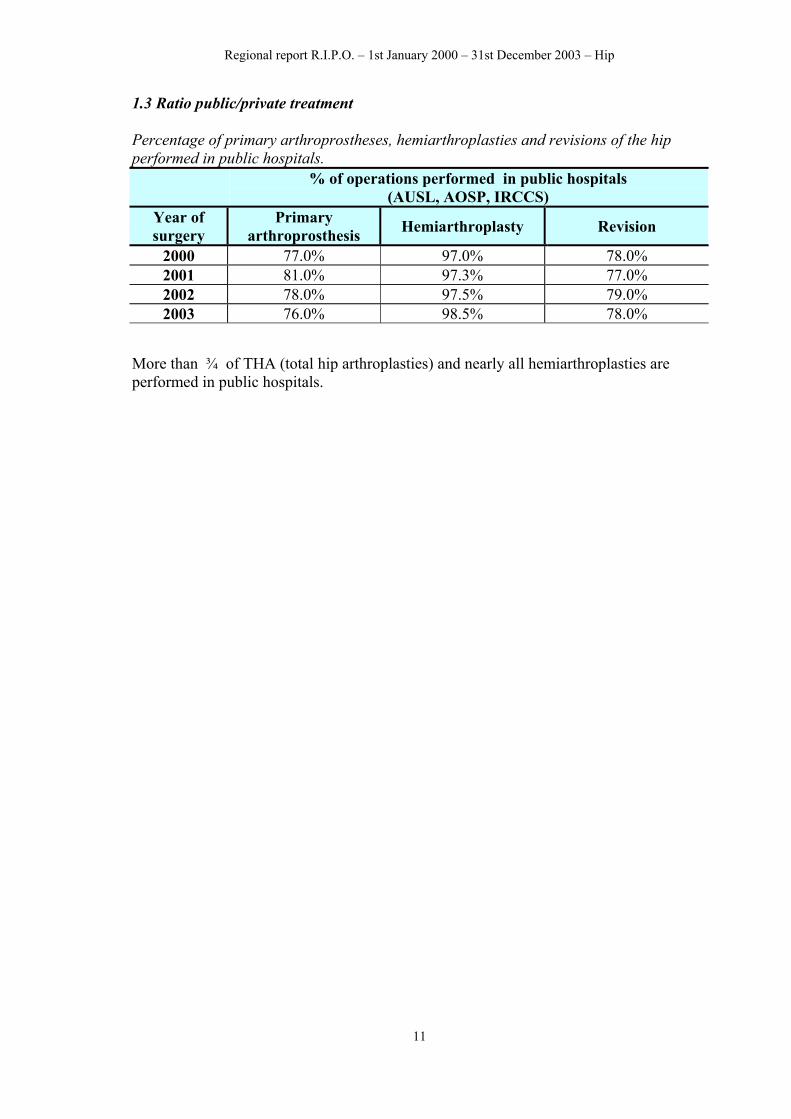
1.3 Ratio public/private treatment Percentage of primary arthroprostheses, hemiarthroplasties and revisions of the hip performed in public hospitals.
% of operations performed in public hospitals (AUSL, AOSP, IRCCS)
More than ¾ of THA (total hip arthroplasties) and nearly all hemiarthroplasties are performed in public hospitals.
11
Regional report R.I.P.O. – 1st January 2000 – 31st December 2003 – Hip
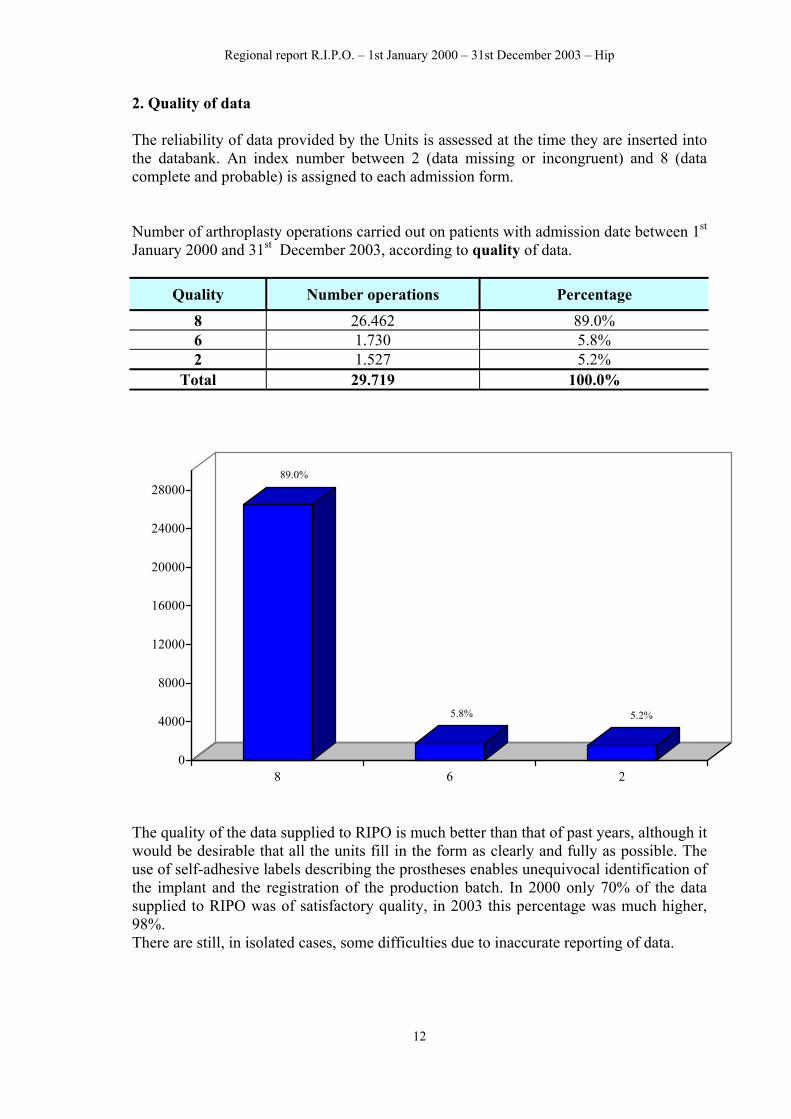
2. Quality of data The reliability of data provided by the Units is assessed at the time they are inserted into the databank. An index number between 2 (data missing or incongruent) and 8 (data complete and probable) is assigned to each admission form. Number of arthroplasty operations carried out on patients with admission date between 1st January 2000 and 31st December 2003, according to quality of data.
Quality Number operations Percentage
8 26.462 89.0% 6 1.730 5.8% 2 1.527 5.2%
Total 29.719 100.0%
89.0%
5.8% 5.2%
0
4000
8000
12000
16000
20000
24000
28000
8 6 2
The quality of the data supplied to RIPO is much better than that of past years, although it would be desirable that all the units fill in the form as clearly and fully as possible. The use of self-adhesive labels describing the prostheses enables unequivocal identification of the implant and the registration of the production batch. In 2000 only 70% of the data supplied to RIPO was of satisfactory quality, in 2003 this percentage was much higher, 98%. There are still, in isolated cases, some difficulties due to inaccurate reporting of data.
12
Regional report R.I.P.O. – 1st January 2000 – 31st December 2003 – Hip
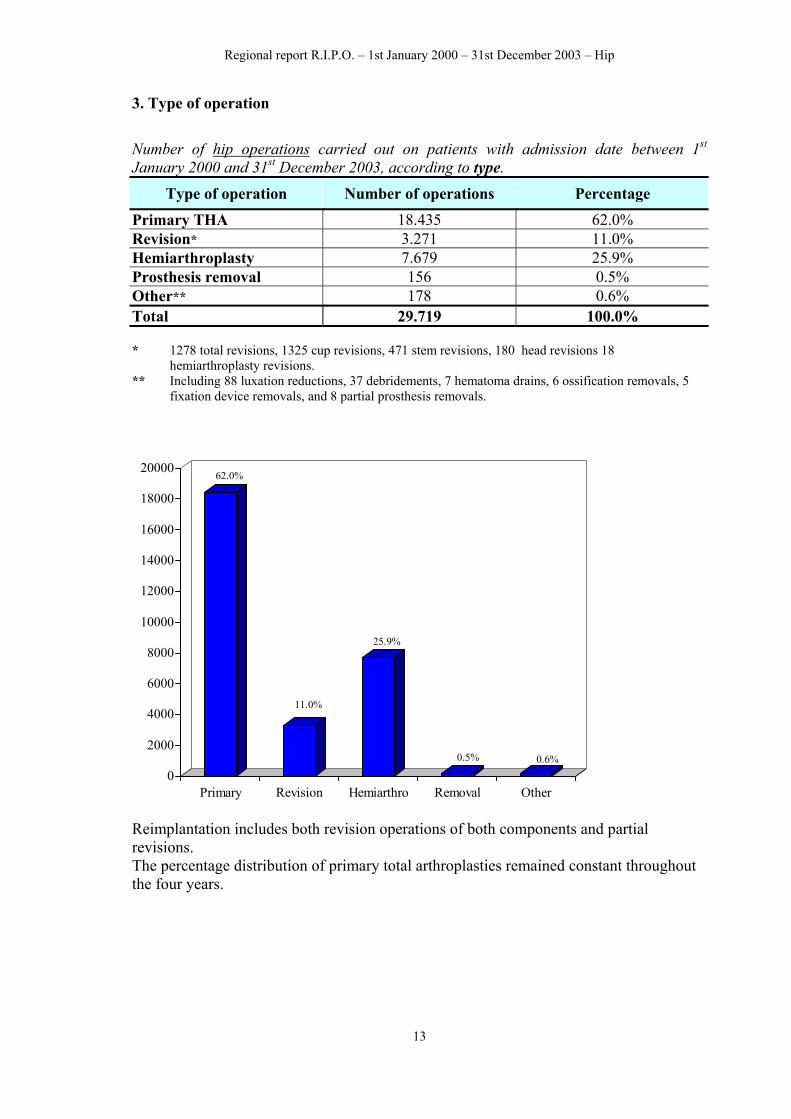
3. Type of operation
Number of hip operations carried out on patients with admission date between 1st January 2000 and 31st December 2003, according to type.
Type of operation Number of operations Percentage
Primary THA 18.435 62.0% Revision* 3.271 11.0% Hemiarthroplasty 7.679 25.9% Prosthesis removal 156 0.5% Other** 178 0.6% Total 29.719 100.0% * 1278 total revisions, 1325 cup revisions, 471 stem revisions, 180 head revisions 18
fixation device removals, and 8 partial prosthesis removals.
62.0%
11.0%
25.9%
0.5% 0.6%
0
2000
4000
6000
8000
10000
12000
14000
16000
18000
20000
Primary Revision Hemiarthro Removal Other
Reimplantation includes both revision operations of both components and partial revisions. The percentage distribution of primary total arthroplasties remained constant throughout the four years.
13
Regional report R.I.P.O. – 1st January 2000 – 31st December 2003 – Hip
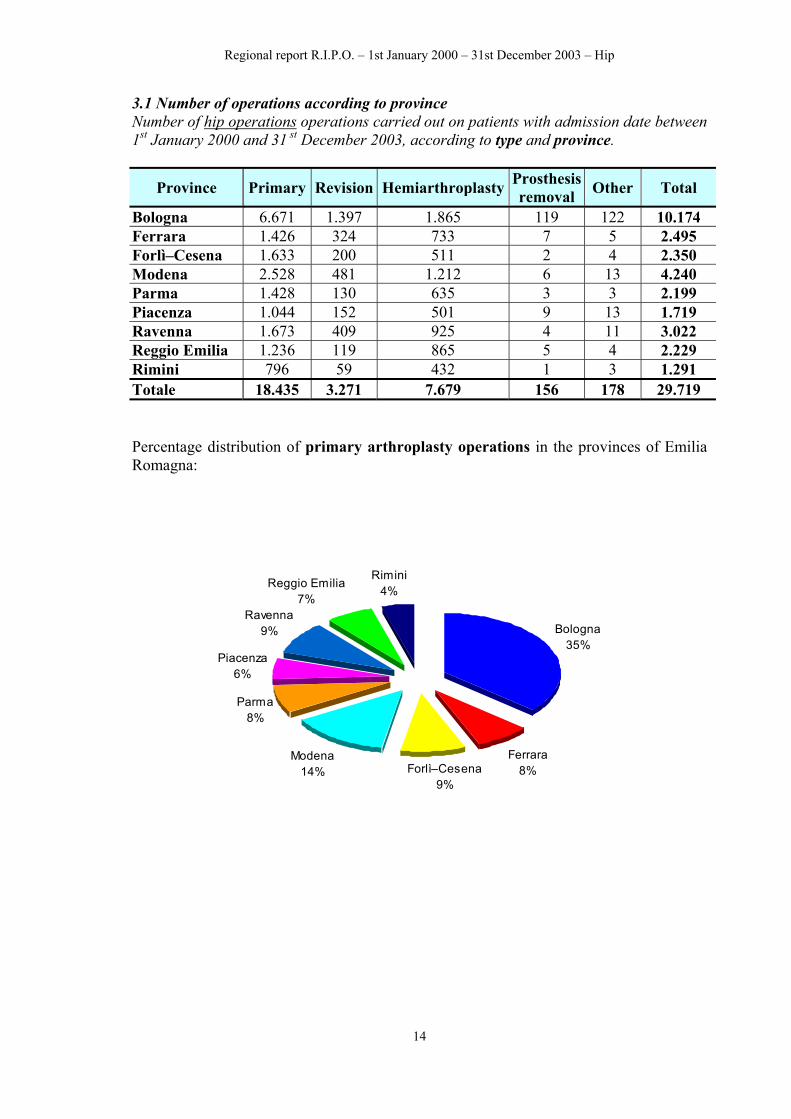
3.1 Number of operations according to province Number of hip operations operations carried out on patients with admission date between 1st January 2000 and 31 st December 2003, according to type and province.
Province Primary Revision Hemiarthroplasty Prosthesis removal Other Total
Regional report R.I.P.O. – 1st January 2000 – 31st December 2003 – Hip
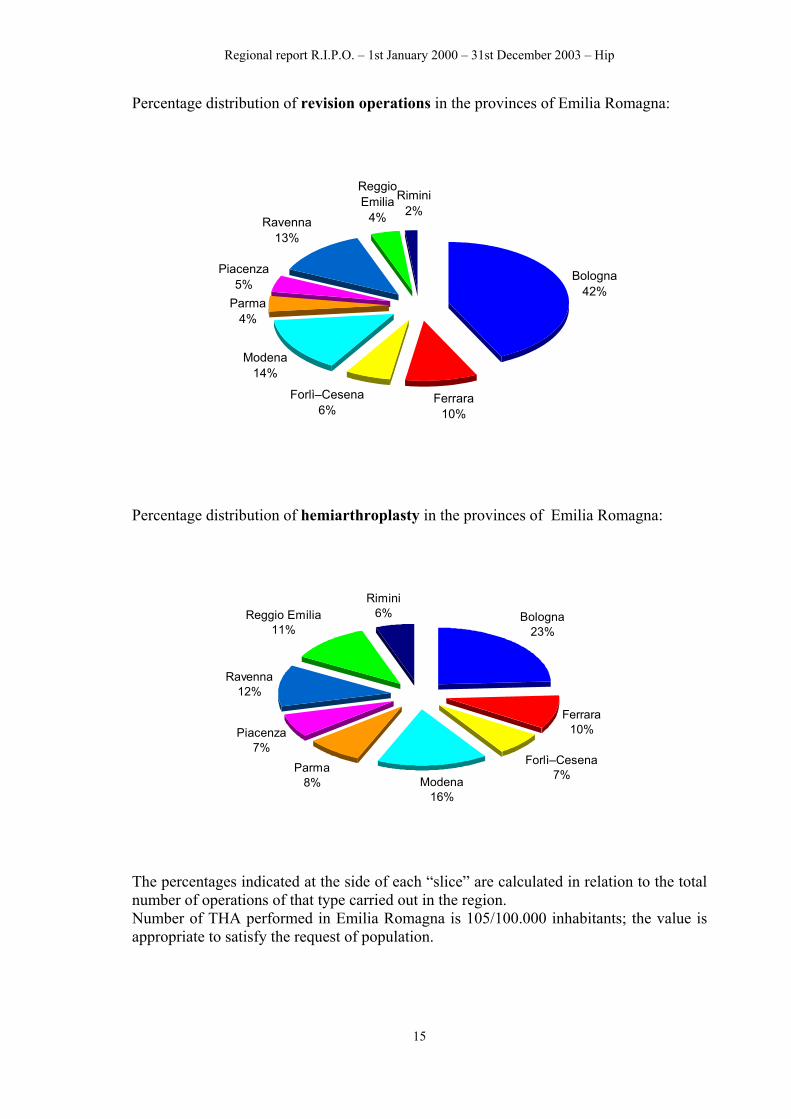
Percentage distribution of revision operations in the provinces of Emilia Romagna:
Bologna42%
Ferrara10%
Forlì–Cesena6%
Modena14%
Piacenza5%
Ravenna13%
Parma4%
ReggioEmilia
4%
Rimini2%
Percentage distribution of hemiarthroplasty in the provinces of Emilia Romagna:
Bologna23%
Ferrara10%
Forlì–Cesena7%Modena
16%
Parma8%
Piacenza7%
Ravenna12%
Reggio Emilia11%
Rimini6%
The percentages indicated at the side of each “slice” are calculated in relation to the total number of operations of that type carried out in the region. Number of THA performed in Emilia Romagna is 105/100.000 inhabitants; the value is appropriate to satisfy the request of population. 15
Regional report R.I.P.O. – 1st January 2000 – 31st December 2003 – Hip
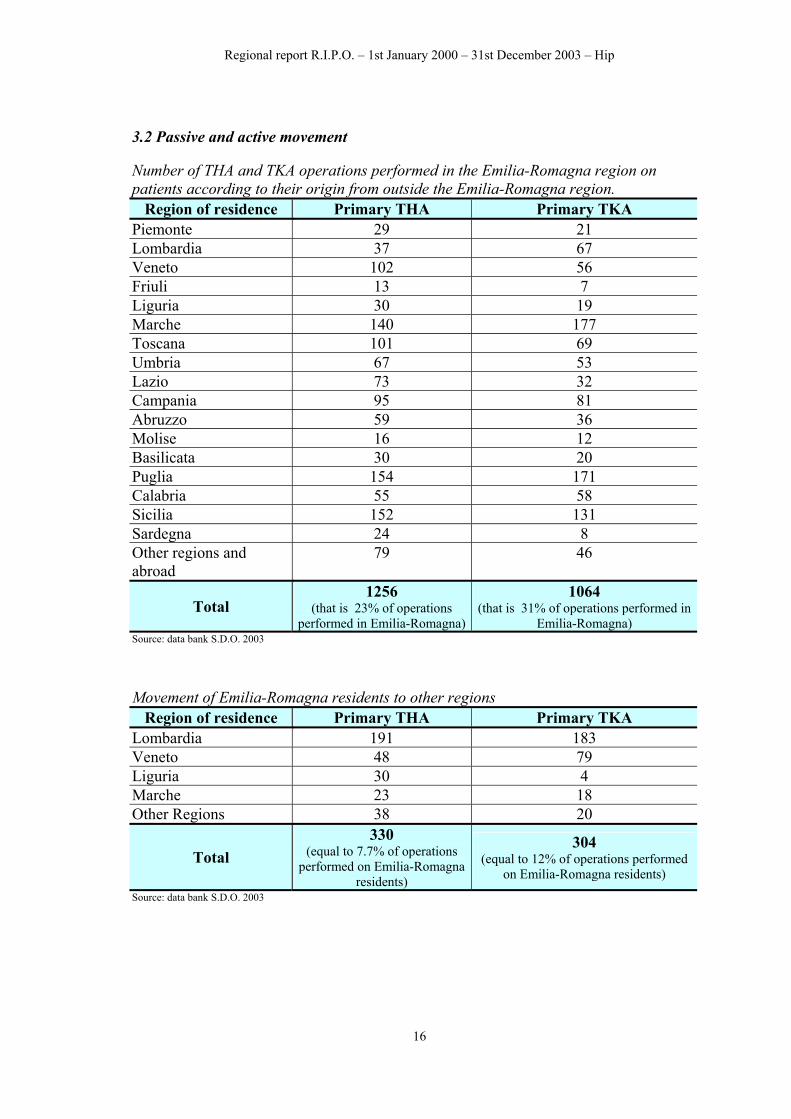
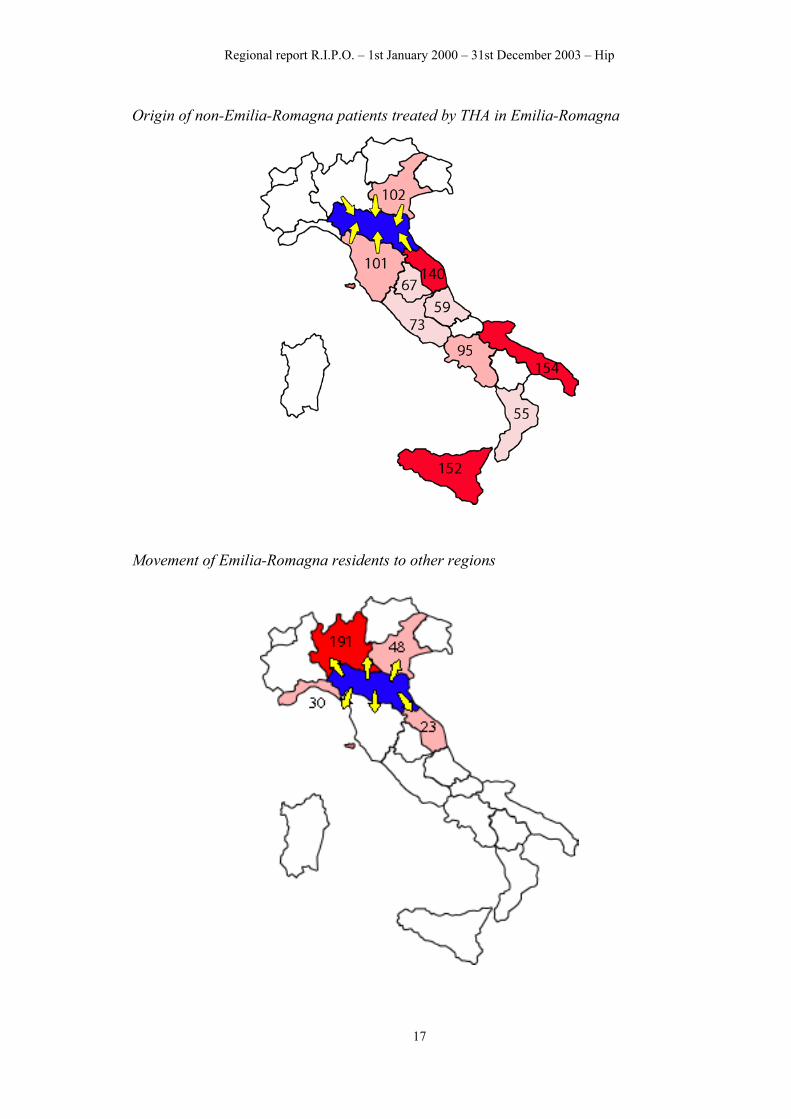
3.2 Passive and active movement Number of THA and TKA operations performed in the Emilia-Romagna region on patients according to their origin from outside the Emilia-Romagna region.
Region of residence Primary THA Primary TKA Piemonte 29 21 Lombardia 37 67 Veneto 102 56 Friuli 13 7 Liguria 30 19 Marche 140 177 Toscana 101 69 Umbria 67 53 Lazio 73 32 Campania 95 81 Abruzzo 59 36 Molise 16 12 Basilicata 30 20 Puglia 154 171 Calabria 55 58 Sicilia 152 131 Sardegna 24 8 Other regions and abroad
79 46
Total 1256
(that is 23% of operations performed in Emilia-Romagna)
1064 (that is 31% of operations performed in
Emilia-Romagna) Source: data bank S.D.O. 2003 Movement of Emilia-Romagna residents to other regions
Region of residence Primary THA Primary TKA Lombardia 191 183 Veneto 48 79 Liguria 30 4 Marche 23 18 Other Regions 38 20
Total 330
(equal to 7.7% of operations performed on Emilia-Romagna
residents)
304 (equal to 12% of operations performed
on Emilia-Romagna residents)
Source: data bank S.D.O. 2003
16
Regional report R.I.P.O. – 1st January 2000 – 31st December 2003 – Hip
Origin of non-Emilia-Romagna patients treated by THA in Emilia-Romagna
Movement of Emilia-Romagna residents to other regions
17
Regional report R.I.P.O. – 1st January 2000 – 31st December 2003 – Hip
4. Descriptive statistics of patients 4.1. Age Number of hip operations carried out on patients with admission date between 1st January 2000 and 31st December 2003, according to type of operation and age group of patients at the time of surgery.
<40 40-49 50-59 60-69 70-79 ≥ 80 Type of operation N. % N. % N. % N. % N. % N. %
Regional report R.I.P.O. – 1st January 2000 – 31st December 2003 – Hip
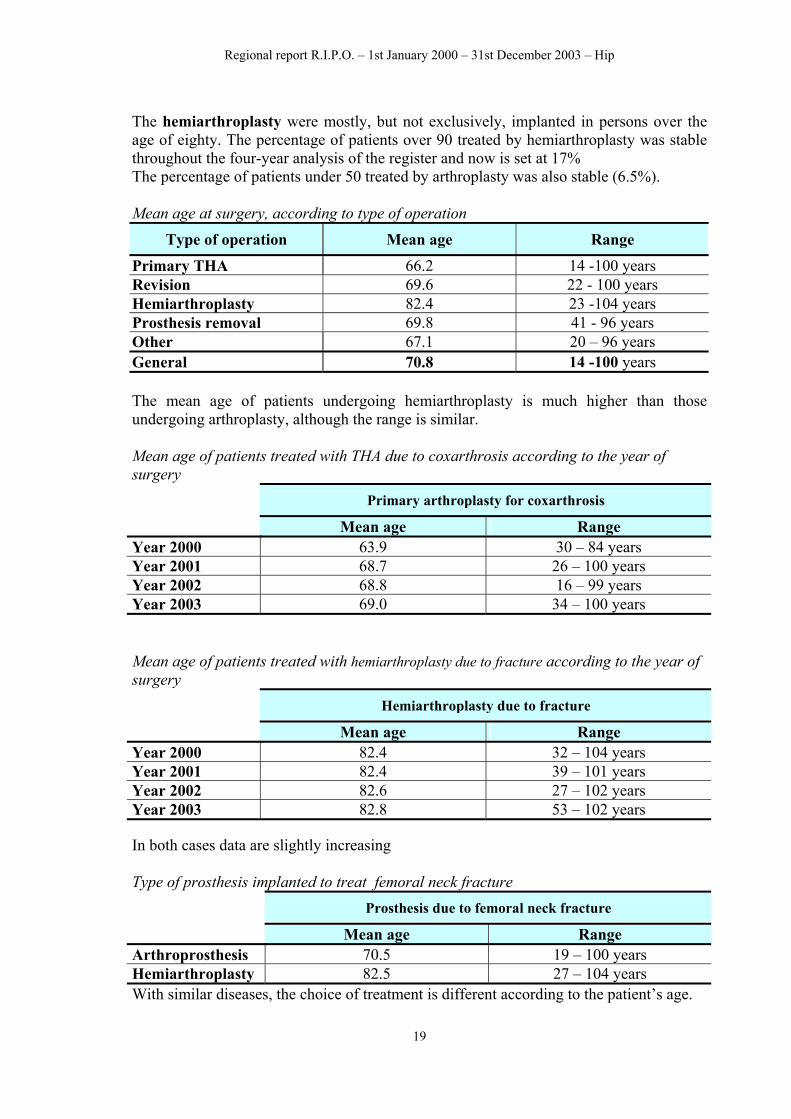
The hemiarthroplasty were mostly, but not exclusively, implanted in persons over the age of eighty. The percentage of patients over 90 treated by hemiarthroplasty was stable throughout the four-year analysis of the register and now is set at 17% The percentage of patients under 50 treated by arthroplasty was also stable (6.5%). Mean age at surgery, according to type of operation
Type of operation Mean age Range
Primary THA 66.2 14 -100 years Revision 69.6 22 - 100 years Hemiarthroplasty 82.4 23 -104 years Prosthesis removal 69.8 41 - 96 years Other 67.1 20 – 96 years General 70.8 14 -100 years The mean age of patients undergoing hemiarthroplasty is much higher than those undergoing arthroplasty, although the range is similar. Mean age of patients treated with THA due to coxarthrosis according to the year of surgery Primary arthroplasty for coxarthrosis
Mean age Range Year 2000 63.9 30 – 84 years Year 2001 68.7 26 – 100 years Year 2002 68.8 16 – 99 years Year 2003 69.0 34 – 100 years Mean age of patients treated with hemiarthroplasty due to fracture according to the year of surgery Hemiarthroplasty due to fracture
Mean age Range Year 2000 82.4 32 – 104 years Year 2001 82.4 39 – 101 years Year 2002 82.6 27 – 102 years Year 2003 82.8 53 – 102 years In both cases data are slightly increasing Type of prosthesis implanted to treat femoral neck fracture Prosthesis due to femoral neck fracture
Mean age Range Arthroprosthesis 70.5 19 – 100 years Hemiarthroplasty 82.5 27 – 104 years With similar diseases, the choice of treatment is different according to the patient’s age. 19
Regional report R.I.P.O. – 1st January 2000 – 31st December 2003 – Hip
4.2. Sex Number of hip operations carried out on patients with admission date between 1st January 2000 and 31st December 2003, according to type of operation and sex of patient.
The female sex is more affected by diseases that require operations of arthroplasty and hemiarthroplasty, due to their predisposition to coxarthritis and osteoporosis, and longer life expectancy. This datum also appears to be stable: in the four years of the register, women have accounted for 68.1%, 67.3% , 67.5% and 66.7%of all patients undergoing hip arthroplasty. Regarding only hemiarthroplasty, the percentage of women was 77.9% in 2000, 76.2% in 2001, 75.5% in 2002, and 76.8% in 2003. Concerning primary arthroplasty the female sex accounted for 64.0% of cases in 2000, 62.4% in 2001 , 63.7% in 2002 and 62.6% in 2003.
20
Regional report R.I.P.O. – 1st January 2000 – 31st December 2003 – Hip
4.3. Side of surgery Coxarthrosis more often affects right hip (58%). The percentage has been calculated on patients wearing only one implant. Percentage distribution of primary THA due to coxarthrosis, according to side
58%
42%Right Left
21
Regional report R.I.P.O. – 1st January 2000 – 31st December 2003 – Hip
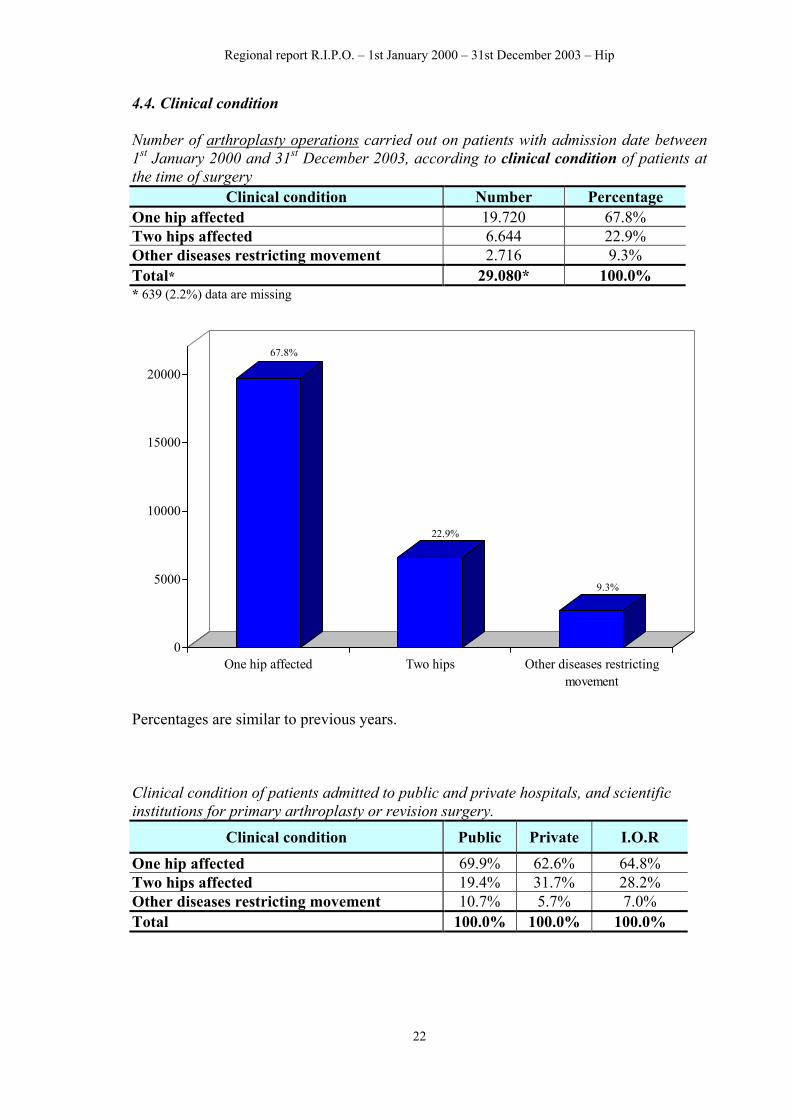
4.4. Clinical condition Number of arthroplasty operations carried out on patients with admission date between 1st January 2000 and 31st December 2003, according to clinical condition of patients at the time of surgery
Clinical condition Number Percentage One hip affected 19.720 67.8% Two hips affected 6.644 22.9% Other diseases restricting movement 2.716 9.3% Total* 29.080* 100.0% * 639 (2.2%) data are missing
67.8%
22.9%
9.3%
0
5000
10000
15000
20000
One hip affected Two hips Other diseases restrictingmovement
Percentages are similar to previous years. Clinical condition of patients admitted to public and private hospitals, and scientific institutions for primary arthroplasty or revision surgery.
Clinical condition Public Private I.O.R
One hip affected 69.9% 62.6% 64.8% Two hips affected 19.4% 31.7% 28.2% Other diseases restricting movement 10.7% 5.7% 7.0% Total 100.0% 100.0% 100.0%
22
Regional report R.I.P.O. – 1st January 2000 – 31st December 2003 – Hip
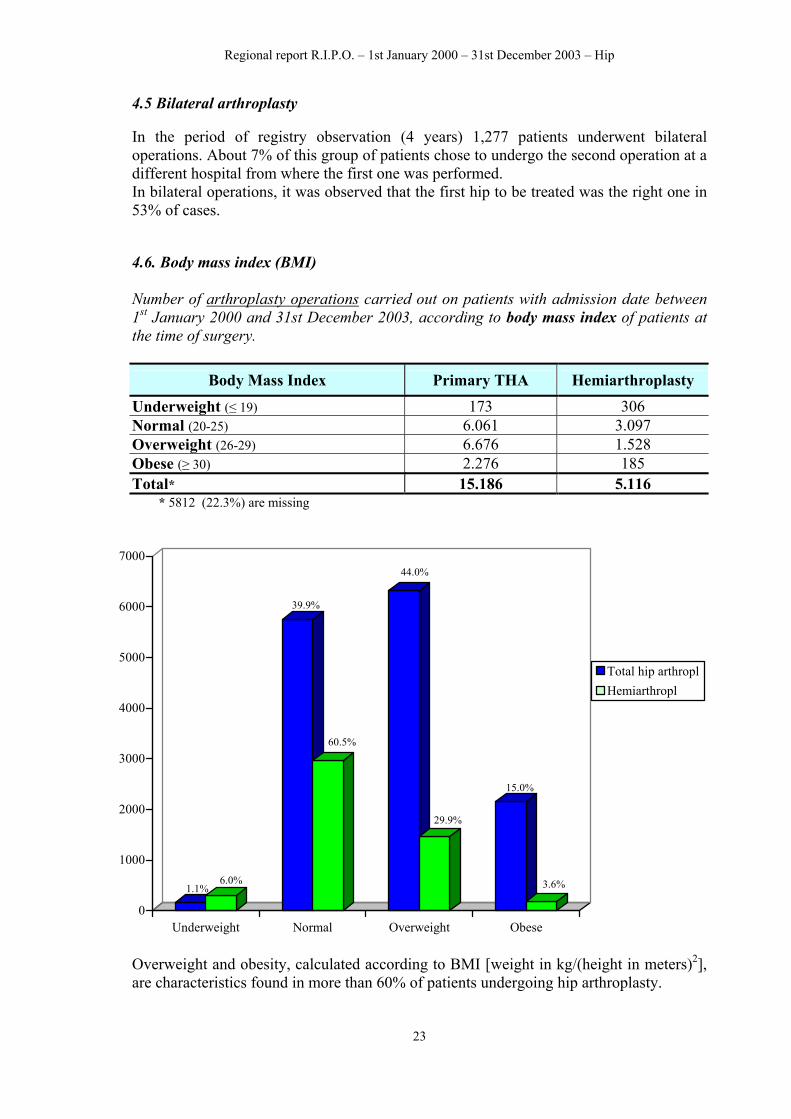
4.5 Bilateral arthroplasty In the period of registry observation (4 years) 1,277 patients underwent bilateral operations. About 7% of this group of patients chose to undergo the second operation at a different hospital from where the first one was performed. In bilateral operations, it was observed that the first hip to be treated was the right one in 53% of cases. 4.6. Body mass index (BMI) Number of arthroplasty operations carried out on patients with admission date between 1st January 2000 and 31st December 2003, according to body mass index of patients at the time of surgery.
Overweight and obesity, calculated according to BMI [weight in kg/(height in meters)2], are characteristics found in more than 60% of patients undergoing hip arthroplasty.
23
Regional report R.I.P.O. – 1st January 2000 – 31st December 2003 – Hip
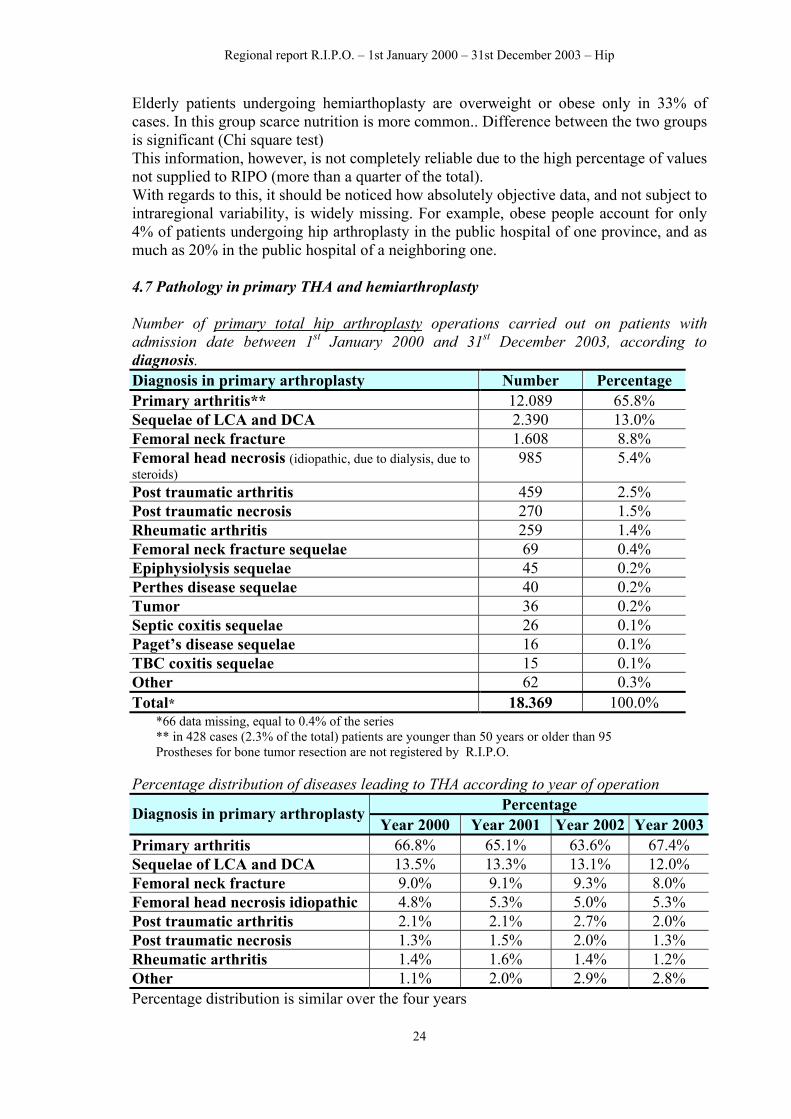
Elderly patients undergoing hemiarthoplasty are overweight or obese only in 33% of cases. In this group scarce nutrition is more common.. Difference between the two groups is significant (Chi square test) This information, however, is not completely reliable due to the high percentage of values not supplied to RIPO (more than a quarter of the total). With regards to this, it should be noticed how absolutely objective data, and not subject to intraregional variability, is widely missing. For example, obese people account for only 4% of patients undergoing hip arthroplasty in the public hospital of one province, and as much as 20% in the public hospital of a neighboring one. 4.7 Pathology in primary THA and hemiarthroplasty Number of primary total hip arthroplasty operations carried out on patients with admission date between 1st January 2000 and 31st December 2003, according to diagnosis. Diagnosis in primary arthroplasty Number Percentage Primary arthritis** 12.089 65.8% Sequelae of LCA and DCA 2.390 13.0% Femoral neck fracture 1.608 8.8% Femoral head necrosis (idiopathic, due to dialysis, due to steroids)
*66 data missing, equal to 0.4% of the series ** in 428 cases (2.3% of the total) patients are younger than 50 years or older than 95 Prostheses for bone tumor resection are not registered by R.I.P.O.
Percentage distribution of diseases leading to THA according to year of operation Percentage Diagnosis in primary arthroplasty
Year 2000 Year 2001 Year 2002 Year 2003Primary arthritis 66.8% 65.1% 63.6% 67.4% Sequelae of LCA and DCA 13.5% 13.3% 13.1% 12.0% Femoral neck fracture 9.0% 9.1% 9.3% 8.0% Femoral head necrosis idiopathic 4.8% 5.3% 5.0% 5.3% Post traumatic arthritis 2.1% 2.1% 2.7% 2.0% Post traumatic necrosis 1.3% 1.5% 2.0% 1.3% Rheumatic arthritis 1.4% 1.6% 1.4% 1.2% Other 1.1% 2.0% 2.9% 2.8% Percentage distribution is similar over the four years
24
Regional report R.I.P.O. – 1st January 2000 – 31st December 2003 – Hip
Percentage distribution of diagnosis in THA, according to type of healthcare center
Percentage Diagnosis in primary arthroplasty AOSP Private AUSL I.O.R
Primary arthritis 65.8% 75.5% 65.2% 54.7% Sequelae of LCA and DCA 12.9% 11.1% 11.3% 21.4% Femoral neck fracture 11.6% 1.3% 12.6% 6.4% Femoral head necrosis idiopathic 4.2% 5.4% 5.4% 4.2% Post traumatic arthritis 1.5% 2.3% 1.3% 5.4% Post traumatic necrosis 0.9% 1.2% 1.6% 2.3% Rheumatic arthritis 1.4% 1.6% 1.0% 2.7% Other 1.7% 1.6% 1.6% 2.9% With regards to distribution of diseases according to type of healthcare center, Hospital Agencies and Local Health Agencies have similar percentages, and they treat a high number of femur fractures, unlike the private centers. Rizzoli has a high percentage of treatment for sequelae of congenital and infant diseases and for traumas. Number of hemiarthroplasty carried out on patients admitted to hospital between 1st January 2000 and 31st December 2003, according to diagnosis. Diagnosis in hemiarthroplasty Number Percentage Femoral neck fracture 7.477 97.9% Tumor, pathological fracture 69 0.9% Primary arthritis* 33 0.4% Post traumatic arthritis* 12 0.2% Sequelae femoral neck fracture 24 0.3% Other 23 0.3% Total** 7.638 100.0% * data not fully reliable ** 41 data missing, equal to 0.5% of the series. Almost all hemiarthroplasty were implanted in the treatment of femoral neck fractures or their sequelae(fracture fixation device loosening, pseudoarthrosis..). The treatment of primitive or secondary coxarthritis seems unlikely.
25
Regional report R.I.P.O. – 1st January 2000 – 31st December 2003 – Hip
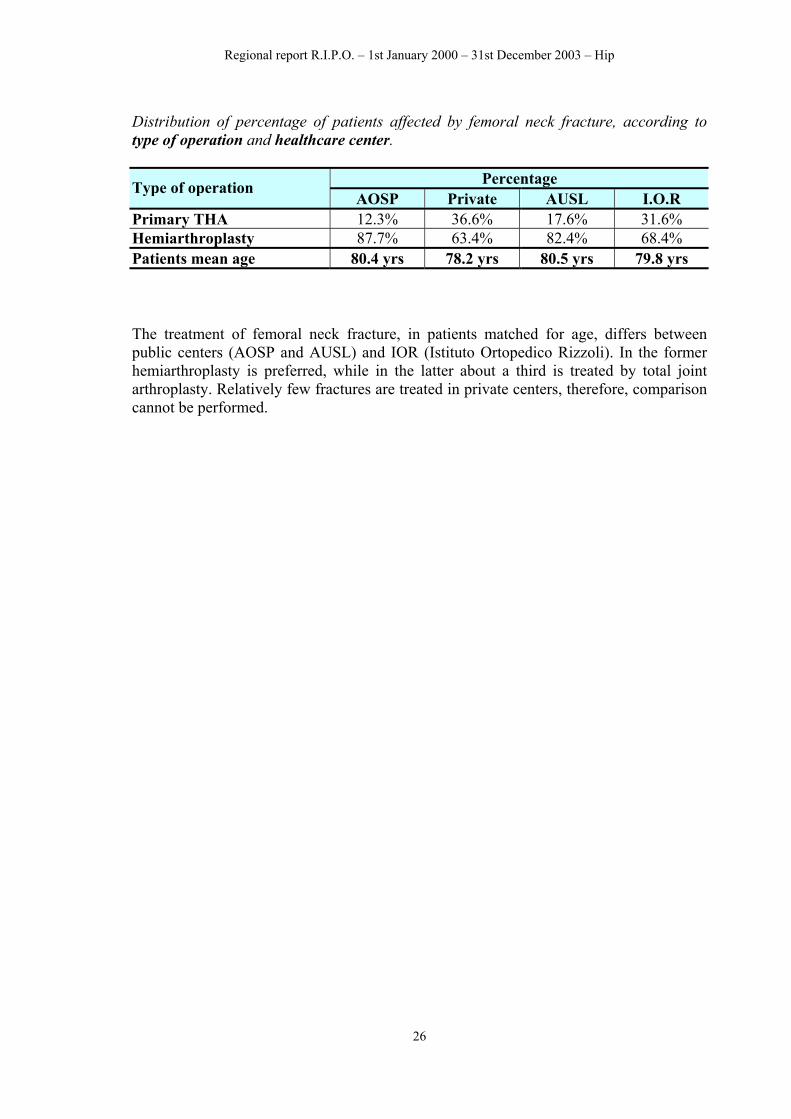
Distribution of percentage of patients affected by femoral neck fracture, according to type of operation and healthcare center.
Percentage Type of operation AOSP Private AUSL I.O.R
Primary THA 12.3% 36.6% 17.6% 31.6% Hemiarthroplasty 87.7% 63.4% 82.4% 68.4% Patients mean age 80.4 yrs 78.2 yrs 80.5 yrs 79.8 yrs The treatment of femoral neck fracture, in patients matched for age, differs between public centers (AOSP and AUSL) and IOR (Istituto Ortopedico Rizzoli). In the former hemiarthroplasty is preferred, while in the latter about a third is treated by total joint arthroplasty. Relatively few fractures are treated in private centers, therefore, comparison cannot be performed.
26
Regional report R.I.P.O. – 1st January 2000 – 31st December 2003 – Hip
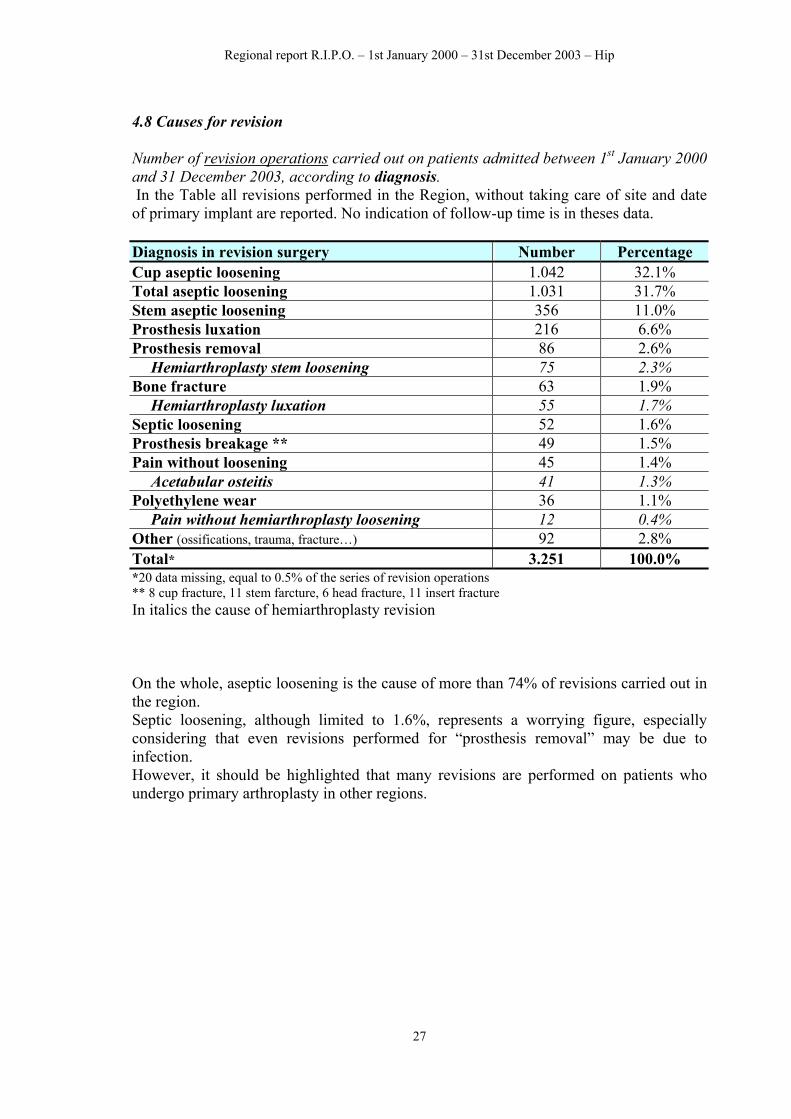
4.8 Causes for revision Number of revision operations carried out on patients admitted between 1st January 2000 and 31 December 2003, according to diagnosis. In the Table all revisions performed in the Region, without taking care of site and date of primary implant are reported. No indication of follow-up time is in theses data. Diagnosis in revision surgery Number Percentage Cup aseptic loosening 1.042 32.1% Total aseptic loosening 1.031 31.7% Stem aseptic loosening 356 11.0% Prosthesis luxation 216 6.6% Prosthesis removal 86 2.6%
Hemiarthroplasty stem loosening 75 2.3% Bone fracture 63 1.9%
Pain without hemiarthroplasty loosening 12 0.4% Other (ossifications, trauma, fracture…) 92 2.8% Total* 3.251 100.0% *20 data missing, equal to 0.5% of the series of revision operations ** 8 cup fracture, 11 stem farcture, 6 head fracture, 11 insert fracture In italics the cause of hemiarthroplasty revision On the whole, aseptic loosening is the cause of more than 74% of revisions carried out in the region. Septic loosening, although limited to 1.6%, represents a worrying figure, especially considering that even revisions performed for “prosthesis removal” may be due to infection. However, it should be highlighted that many revisions are performed on patients who undergo primary arthroplasty in other regions.
27
Regional report R.I.P.O. – 1st January 2000 – 31st December 2003 – Hip
5. Types of prostheses The following tables show the types of prostheses (cups, stems and hemiarthroplasty) commonly used in Emilia-Romagna, according to primary and revision surgery. 5.1 Cups used in primary surgery TYPE OF CUP NUMBER % ANCA FIT – Cremascoli 4436 24.1% CLS – Sulzer 1976 10.7% FITMORE – Sulzer 1023 5.5% ABG II – Howmedica 959 5.2% STANDARD CUP – Sulzer 929 5.0% DUOFIT PSF – Samo 894 4.8% MULLER – Cremascoli 731 4.0% TRILOGY– Zimmer 657 3.6% REFLECTION – Smith & Nephew 644 3.5% CONTEMPORARY – Howmedica 344 1.9% ABG – Howmedica 334 1.8% MULLER – Samo 321 1.7% ELLIPTICAL CUP – Stratec 316 1.7% ZCA – Zimmer 296 1.6% MULLER – Sulzer 288 1.6% BICON–PLUS – Endoplus 190 1.0% SPH CONTACT – Lima 174 0.9% MULLER – Smith & Nephew 174 0.9% OSTEOLOCK – Howmedica 170 0.9% SECUR–FIT – Osteonic 168 0.9% INTERSEAL – Wright 161 0.9% HILOCK LINE – Symbios 160 0.9% DURALOC – DePuy 154 0.8% METASUL STAR CUP – Sulzer 146 0.8% ALBI – Cremascoli 145 0.8% CFP – Link 143 0.8% MARBURG – Allopro Sulzer 131 0.7% EASY – Hit Medica 130 0.7% MULLER– Lima 98 0.5% FITEK – Sulzer 79 0.4% MBA – Groupe Lépine 74 0.4% SPH PEG – Lima 71 0.4% DURALOC SECTOR – Depuy 65 0.4% MC MINN – Link 58 0.3% TRILOGY AB – Zimmer 54 0.3% S II – Link 53 0.3% DURALOC OPTION – Depuy 52 0.3% SURFACE PROSTHESIS – Birmingham 98 0.5% UNKNOWN 77 0.4% TOTAL 16973 92.1% The remaining 1462 cups (7.9%) were of 55 different types, with less than 50 per type. On the whole, 94 different types of cups were used in primary operations.
28
Regional report R.I.P.O. – 1st January 2000 – 31st December 2003 – Hip
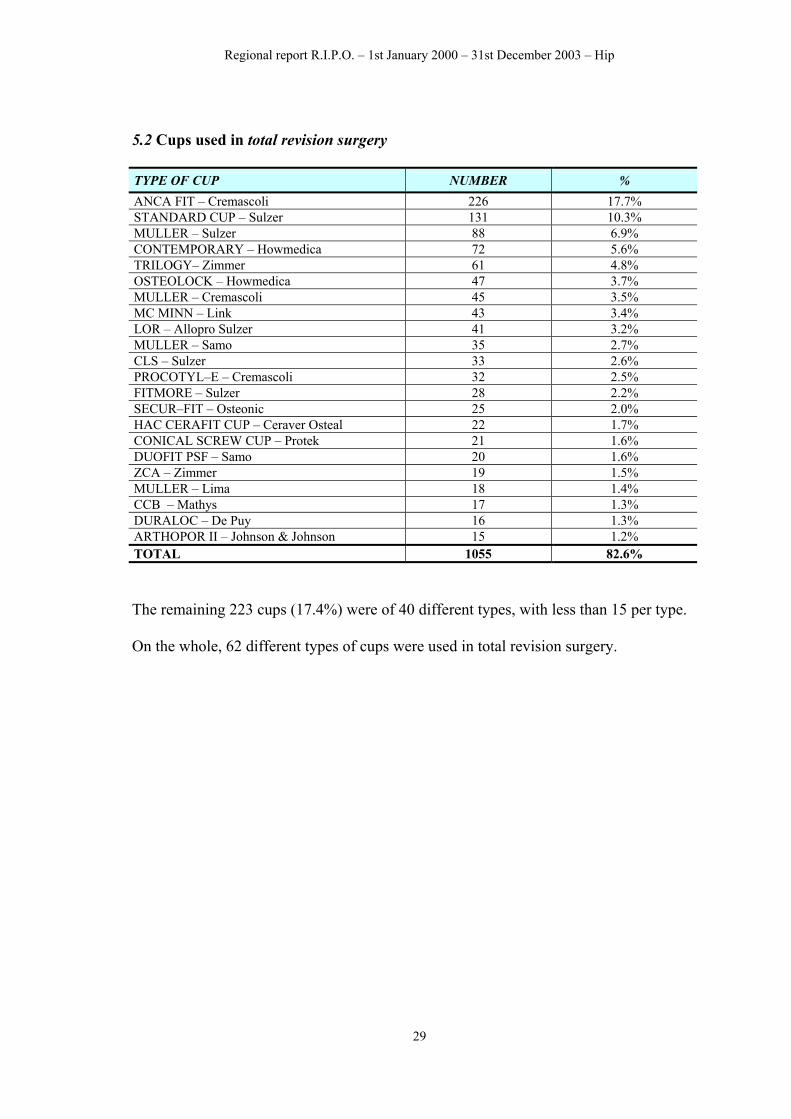
5.2 Cups used in total revision surgery TYPE OF CUP NUMBER % ANCA FIT – Cremascoli 226 17.7% STANDARD CUP – Sulzer 131 10.3% MULLER – Sulzer 88 6.9% CONTEMPORARY – Howmedica 72 5.6% TRILOGY– Zimmer 61 4.8% OSTEOLOCK – Howmedica 47 3.7% MULLER – Cremascoli 45 3.5% MC MINN – Link 43 3.4% LOR – Allopro Sulzer 41 3.2% MULLER – Samo 35 2.7% CLS – Sulzer 33 2.6% PROCOTYL–E – Cremascoli 32 2.5% FITMORE – Sulzer 28 2.2% SECUR–FIT – Osteonic 25 2.0% HAC CERAFIT CUP – Ceraver Osteal 22 1.7% CONICAL SCREW CUP – Protek 21 1.6% DUOFIT PSF – Samo 20 1.6% ZCA – Zimmer 19 1.5% MULLER – Lima 18 1.4% CCB – Mathys 17 1.3% DURALOC – De Puy 16 1.3% ARTHOPOR II – Johnson & Johnson 15 1.2% TOTAL 1055 82.6% The remaining 223 cups (17.4%) were of 40 different types, with less than 15 per type. On the whole, 62 different types of cups were used in total revision surgery.
29
Regional report R.I.P.O. – 1st January 2000 – 31st December 2003 – Hip
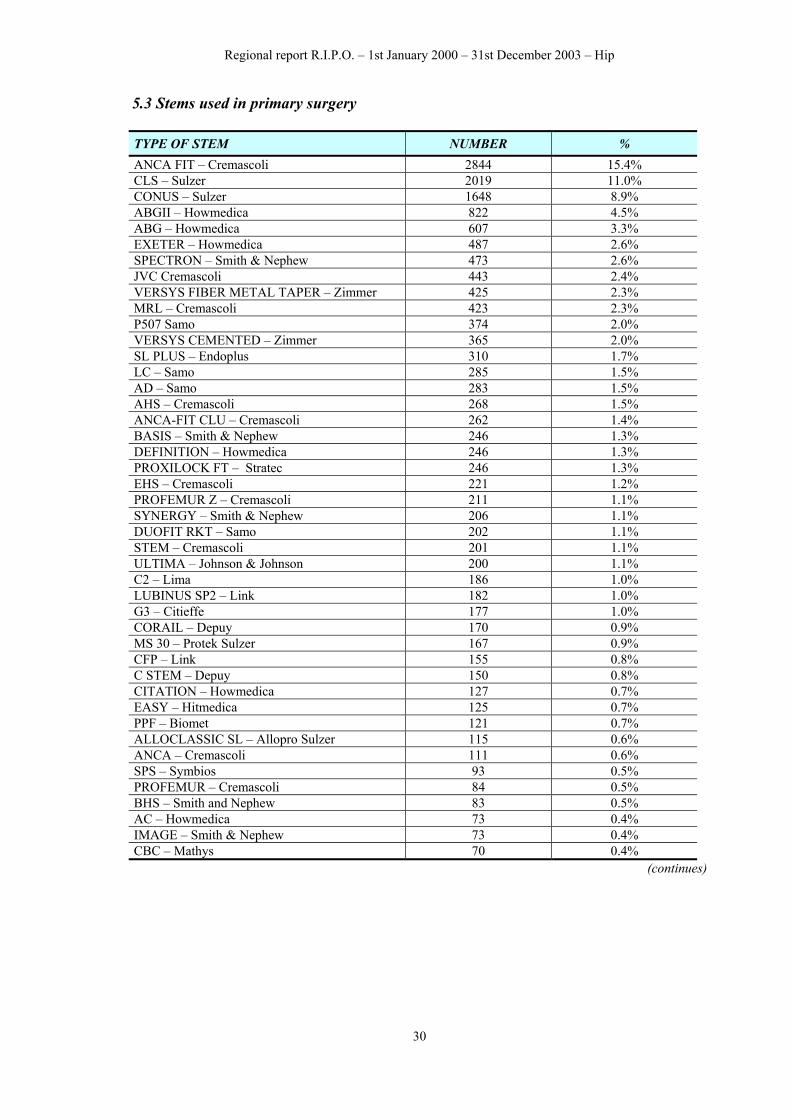
5.3 Stems used in primary surgery TYPE OF STEM NUMBER % ANCA FIT – Cremascoli 2844 15.4%
P507 Samo 374 2.0% VERSYS CEMENTED – Zimmer 365 2.0% SL PLUS – Endoplus 310 LC – Samo 285 1.5%
283 1.5% AHS – Cremascoli 268
1.7%
AD – Samo 1.5%
ANCA-FIT CLU – Cremascoli 262 1.4% BASIS – Smith & Nephew 246 1.3% DEFINITION – Howmedica 246 1.3% PROXILOCK FT – Stratec 1.3% EHS – Cremascoli 221 1.2% PROFEMUR Z – Cremascoli 211 1.1% SYNERGY – Smith & Nephew 1.1% DUOFIT RKT – Samo 202 1.1% STEM – Cremascoli 201 1.1% ULTIMA – Johnson & Johnson 1.1%
246
206
200 C2 – Lima 186 1.0% LUBINUS SP2 – Link 182 1.0% G3 – Citieffe 177 1.0% CORAIL – Depuy 170 0.9% MS 30 – Protek Sulzer 167 0.9% CFP – Link 155 0.8% C STEM – Depuy 150 0.8% CITATION – Howmedica 0.7% EASY – Hitmedica 125 0.7% PPF – Biomet 121 0.7% ALLOCLASSIC SL – Allopro Sulzer 115 0.6% ANCA – Cremascoli 111 0.6% SPS – Symbios 93 0.5% PROFEMUR – Cremascoli 84 0.5% BHS – Smith and Nephew 83 0.5% AC – Howmedica 73 0.4% IMAGE – Smith & Nephew 73 0.4% CBC – Mathys 70 0.4%
127
(continues)
30
Regional report R.I.P.O. – 1st January 2000 – 31st December 2003 – Hip
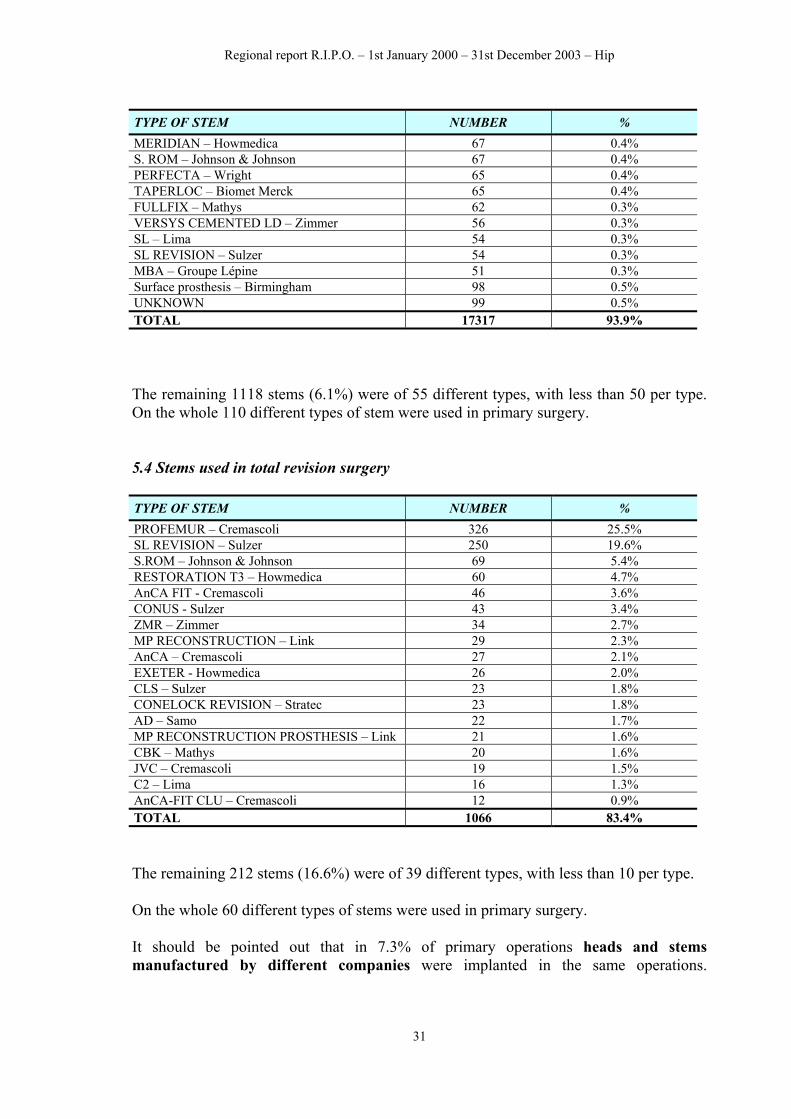
TYPE OF STEM NUMBER % MERIDIAN – Howmedica 67 0.4% S. ROM – Johnson & Johnson 67 0.4% PERFECTA – Wright 65 0.4% TAPERLOC – Biomet Merck 65 0.4% FULLFIX – Mathys 62 0.3% VERSYS CEMENTED LD – Zimmer 56 0.3% SL – Lima 54 0.3% SL REVISION – Sulzer 54 0.3% MBA – Groupe Lépine 51 0.3% Surface prosthesis – Birmingham 98 0.5% UNKNOWN 99 0.5% TOTAL 17317 93.9% The remaining 1118 stems (6.1%) were of 55 different types, with less than 50 per type. On the whole 110 different types of stem were used in primary surgery. 5.4 Stems used in total revision surgery TYPE OF STEM NUMBER % PROFEMUR – Cremascoli 326 25.5% SL REVISION – Sulzer 250 19.6% S.ROM – Johnson & Johnson 69 5.4% RESTORATION T3 – Howmedica 60 4.7% AnCA FIT - Cremascoli 46 3.6% CONUS - Sulzer 43 3.4% ZMR – Zimmer 34 2.7% MP RECONSTRUCTION – Link 29 2.3% AnCA – Cremascoli 27 2.1% EXETER - Howmedica 26 2.0% CLS – Sulzer 23 1.8% CONELOCK REVISION – Stratec 23 1.8% AD – Samo 22 1.7% MP RECONSTRUCTION PROSTHESIS – Link 21 1.6% CBK – Mathys 20 1.6% JVC – Cremascoli 19 1.5% C2 – Lima 16 1.3% AnCA-FIT CLU – Cremascoli 12 0.9% TOTAL 1066 83.4% The remaining 212 stems (16.6%) were of 39 different types, with less than 10 per type. On the whole 60 different types of stems were used in primary surgery. It should be pointed out that in 7.3% of primary operations heads and stems manufactured by different companies were implanted in the same operations.
31
Regional report R.I.P.O. – 1st January 2000 – 31st December 2003 – Hip
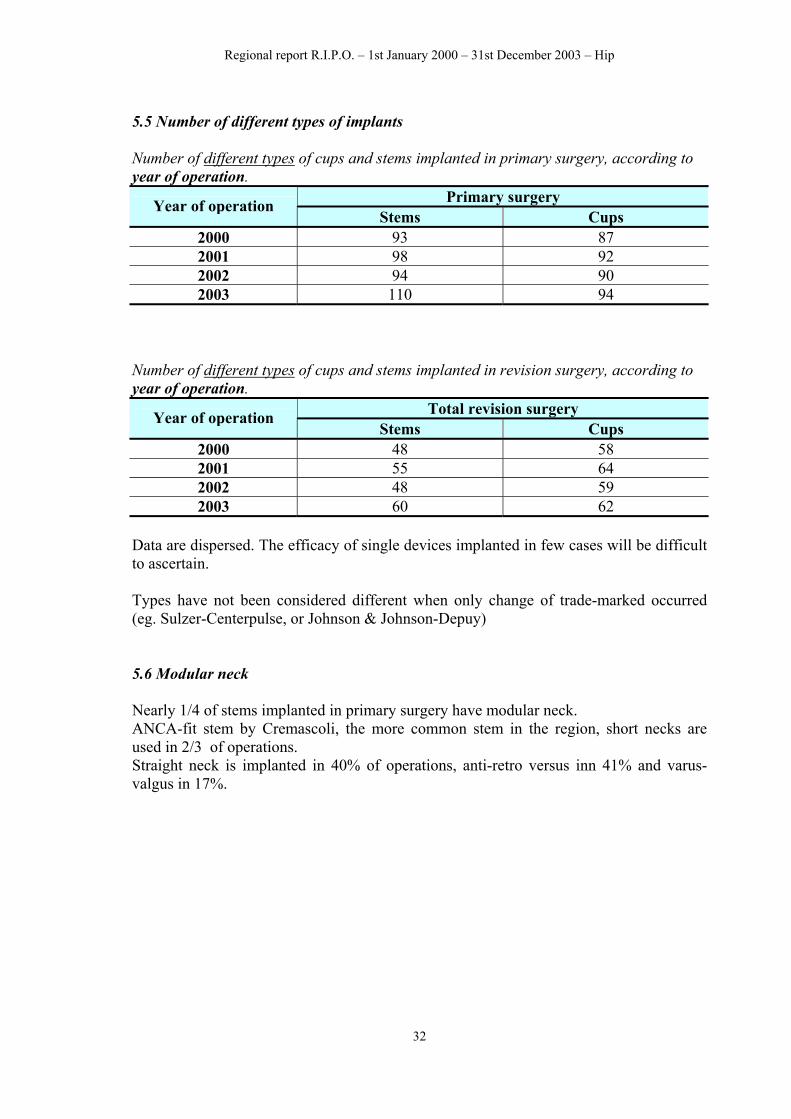
5.5 Number of different types of implants Number of different types of cups and stems implanted in primary surgery, according to year of operation.
Primary surgery Year of operation Stems Cups
2000 93 87 2001 98 92 2002 94 90 2003 110 94
Number of different types of cups and stems implanted in revision surgery, according to year of operation.
Total revision surgery Year of operation Stems Cups
2000 48 58 2001 55 64 2002 48 59 2003 60 62
Data are dispersed. The efficacy of single devices implanted in few cases will be difficult to ascertain. Types have not been considered different when only change of trade-marked occurred (eg. Sulzer-Centerpulse, or Johnson & Johnson-Depuy) 5.6 Modular neck Nearly 1/4 of stems implanted in primary surgery have modular neck. ANCA-fit stem by Cremascoli, the more common stem in the region, short necks are used in 2/3 of operations. Straight neck is implanted in 40% of operations, anti-retro versus inn 41% and varus-valgus in 17%.
32
Regional report R.I.P.O. – 1st January 2000 – 31st December 2003 – Hip
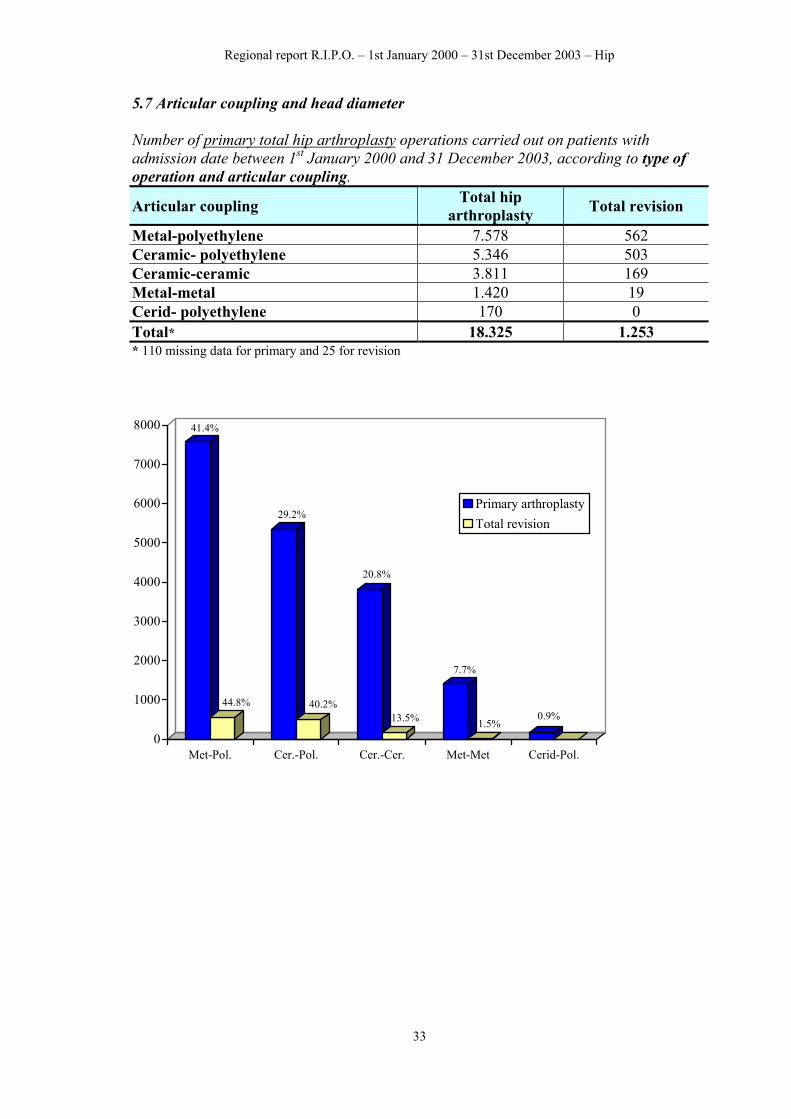
5.7 Articular coupling and head diameter Number of primary total hip arthroplasty operations carried out on patients with admission date between 1st January 2000 and 31 December 2003, according to type of operation and articular coupling.
Articular coupling Total hip arthroplasty Total revision
Metal-polyethylene 7.578 562 Ceramic- polyethylene 5.346 503 Ceramic-ceramic 3.811 169 Metal-metal 1.420 19 Cerid- polyethylene 170 0 Total* 18.325 1.253 * 110 missing data for primary and 25 for revision
41.4%
44.8%
29.2%
40.2%
20.8%
13.5%
7.7%
1.5%0.9%
0
1000
2000
3000
4000
5000
6000
7000
8000
Met-Pol. Cer.-Pol. Cer.-Cer. Met-Met Cerid-Pol.
Primary arthroplastyTotal revision
33
Regional report R.I.P.O. – 1st January 2000 – 31st December 2003 – Hip
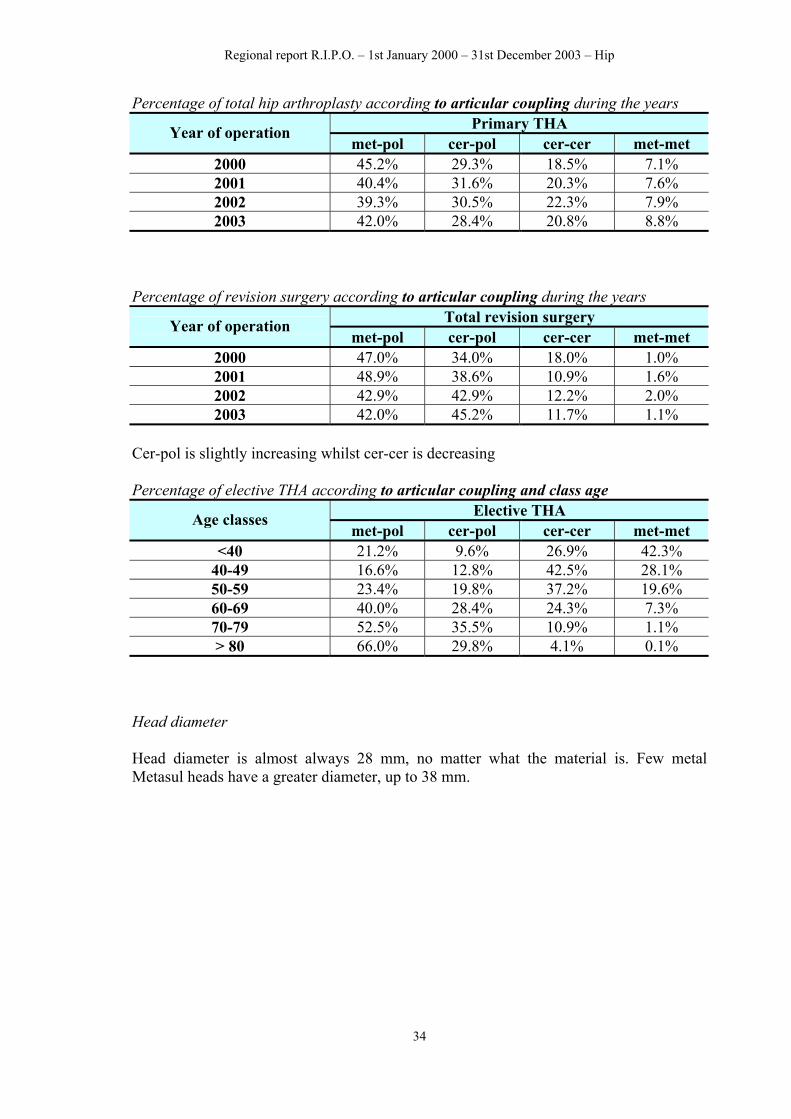
Percentage of total hip arthroplasty according to articular coupling during the years Primary THA Year of operation
Head diameter Head diameter is almost always 28 mm, no matter what the material is. Few metal Metasul heads have a greater diameter, up to 38 mm.
34
Regional report R.I.P.O. – 1st January 2000 – 31st December 2003 – Hip
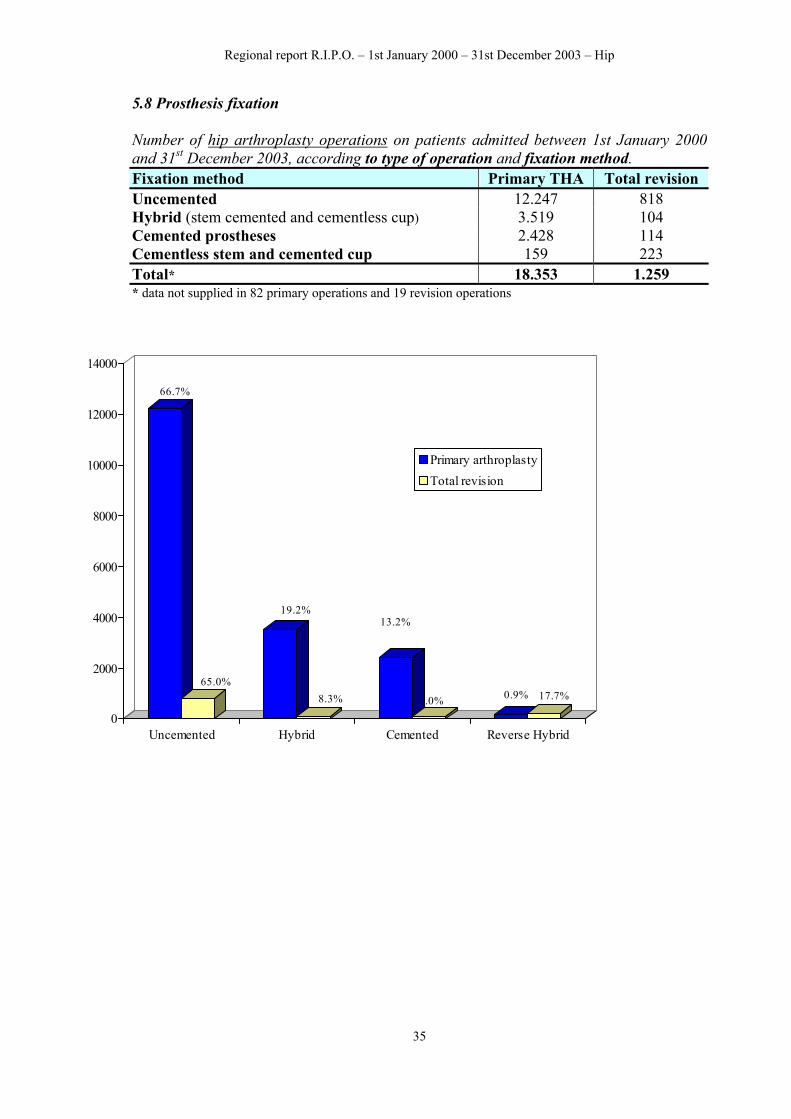
5.8 Prosthesis fixation Number of hip arthroplasty operations on patients admitted between 1st January 2000 and 31st December 2003, according to type of operation and fixation method. Fixation method Primary THA Total revision Uncemented 12.247 818 Hybrid (stem cemented and cementless cup) 3.519 104 Cemented prostheses 2.428 114 Cementless stem and cemented cup 159 223 Total* 18.353 1.259 * data not supplied in 82 primary operations and 19 revision operations
13.2%
9.0%
66.7%
65.0%
19.2%
8.3% 0.9% 17.7%
0
2000
4000
6000
8000
10000
12000
14000
Uncemented Hybrid Cemented Reverse Hybrid
Primary arthroplastyTotal revision
35
Regional report R.I.P.O. – 1st January 2000 – 31st December 2003 – Hip
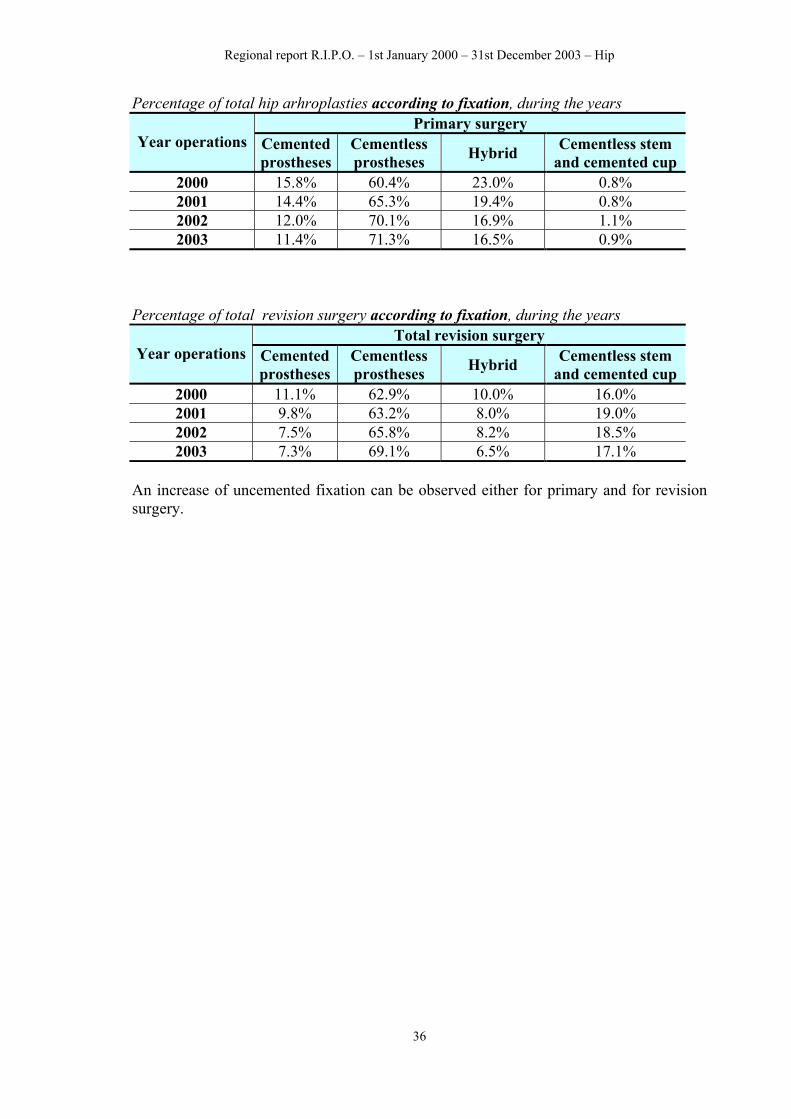
Percentage of total hip arhroplasties according to fixation, during the years Primary surgery
An increase of uncemented fixation can be observed either for primary and for revision surgery.
36
Regional report R.I.P.O. – 1st January 2000 – 31st December 2003 – Hip
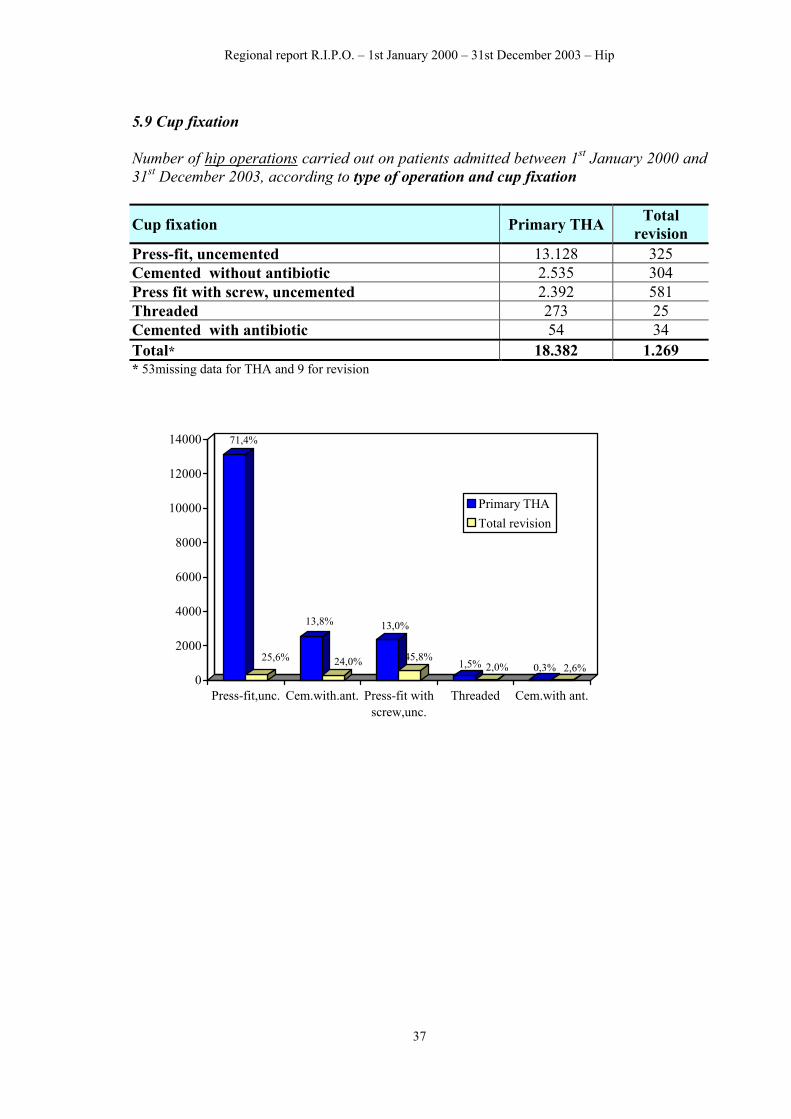
5.9 Cup fixation Number of hip operations carried out on patients admitted between 1st January 2000 and 31st December 2003, according to type of operation and cup fixation
Cup fixation Primary THA Total revision
Press-fit, uncemented 13.128 325 Cemented without antibiotic 2.535 304 Press fit with screw, uncemented 2.392 581 Threaded 273 25 Cemented with antibiotic 54 34 Total* 18.382 1.269 * 53missing data for THA and 9 for revision
Regional report R.I.P.O. – 1st January 2000 – 31st December 2003 – Hip
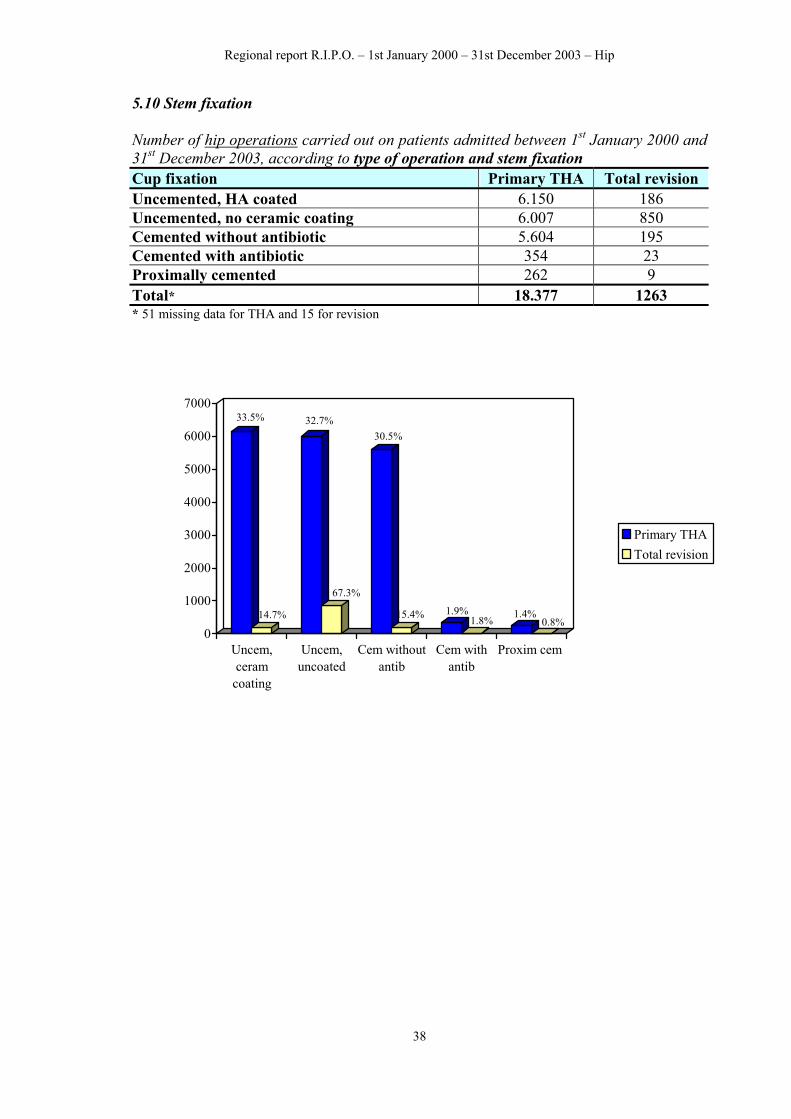
5.10 Stem fixation Number of hip operations carried out on patients admitted between 1st January 2000 and 31st December 2003, according to type of operation and stem fixation Cup fixation Primary THA Total revision Uncemented, HA coated 6.150 186 Uncemented, no ceramic coating 6.007 850 Cemented without antibiotic 5.604 195 Cemented with antibiotic 354 23 Proximally cemented 262 9 Total* 18.377 1263 * 51 missing data for THA and 15 for revision
33.5%
14.7%
32.7%
67.3%
30.5%
15.4% 1.9%1.8% 1.4%
0.8%0
1000
2000
3000
4000
5000
6000
7000
Uncem,ceram
coating
Uncem,uncoated
Cem withoutantib
Cem withantib
Proxim cem
Primary THATotal revision
38
Regional report R.I.P.O. – 1st January 2000 – 31st December 2003 – Hip
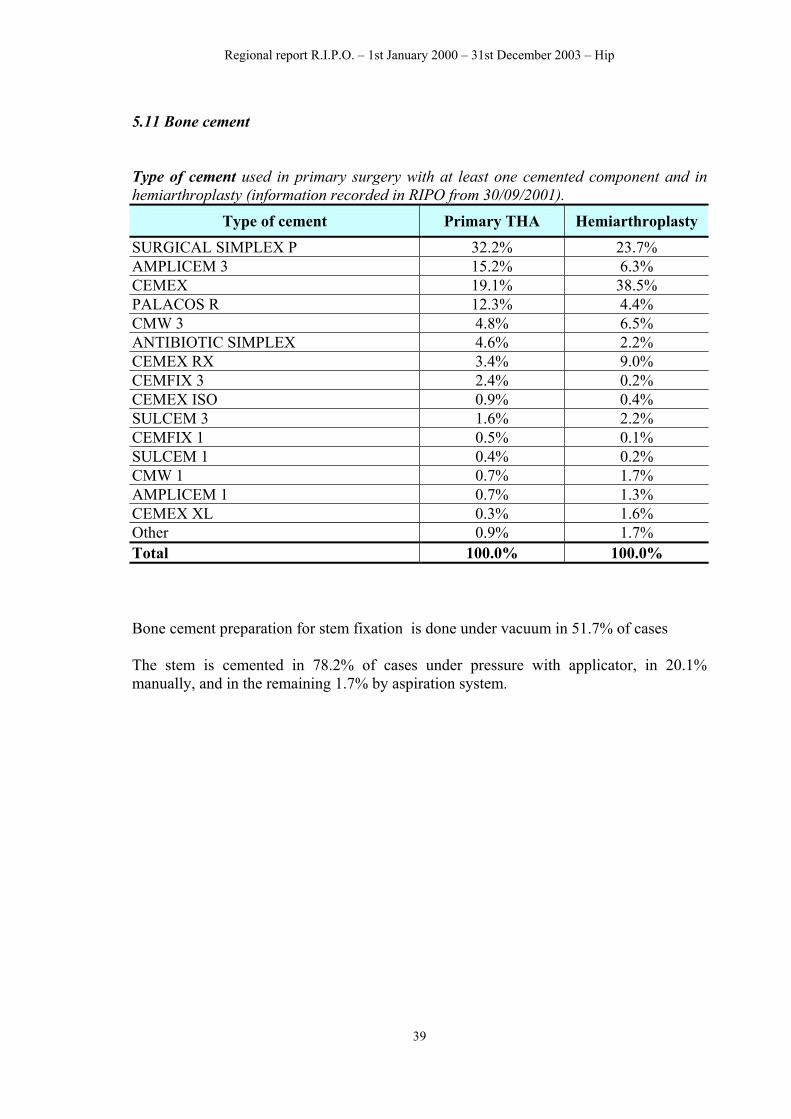
5.11 Bone cement Type of cement used in primary surgery with at least one cemented component and in hemiarthroplasty (information recorded in RIPO from 30/09/2001).
Type of cement Primary THA Hemiarthroplasty SURGICAL SIMPLEX P 32.2% 23.7% AMPLICEM 3 15.2% 6.3% CEMEX 19.1% 38.5% PALACOS R 12.3% 4.4% CMW 3 4.8% 6.5% ANTIBIOTIC SIMPLEX 4.6% 2.2% CEMEX RX 3.4% 9.0% CEMFIX 3 2.4% 0.2% CEMEX ISO 0.9% 0.4% SULCEM 3 1.6% 2.2% CEMFIX 1 0.5% 0.1% SULCEM 1 0.4% 0.2% CMW 1 0.7% 1.7% AMPLICEM 1 0.7% 1.3% CEMEX XL 0.3% 1.6% Other 0.9% 1.7% Total 100.0% 100.0% Bone cement preparation for stem fixation is done under vacuum in 51.7% of cases The stem is cemented in 78.2% of cases under pressure with applicator, in 20.1% manually, and in the remaining 1.7% by aspiration system.
39
Regional report R.I.P.O. – 1st January 2000 – 31st December 2003 – Hip
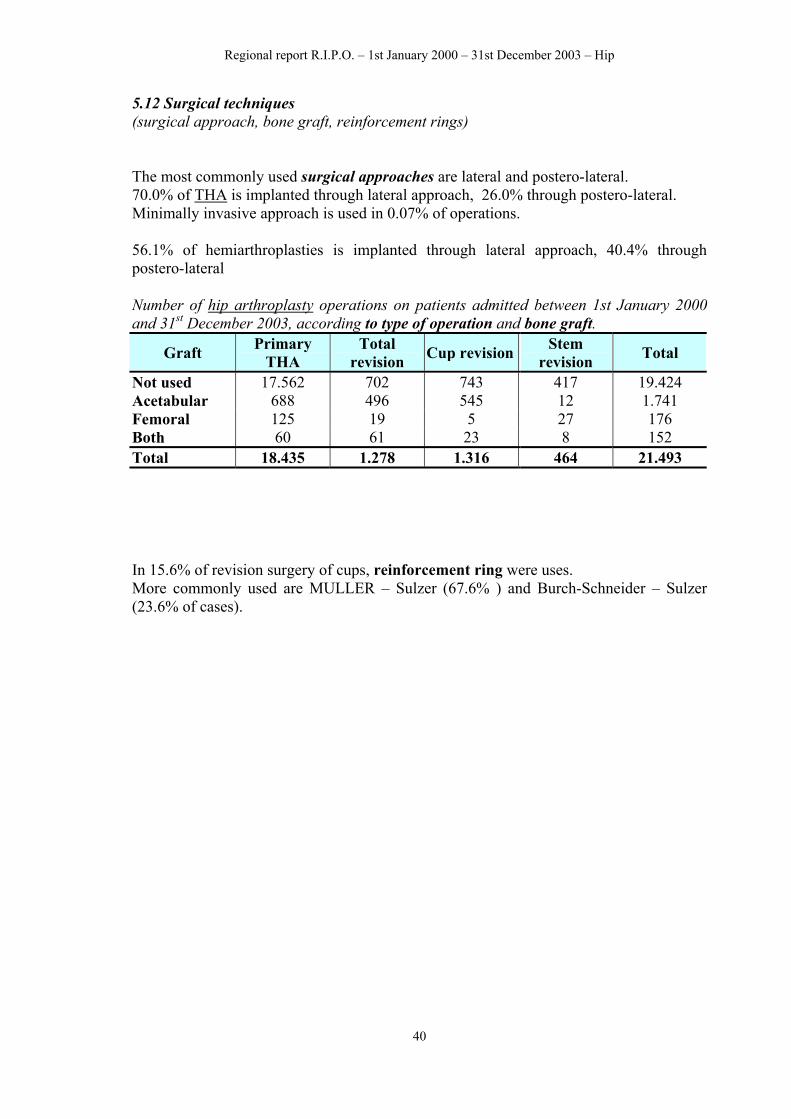
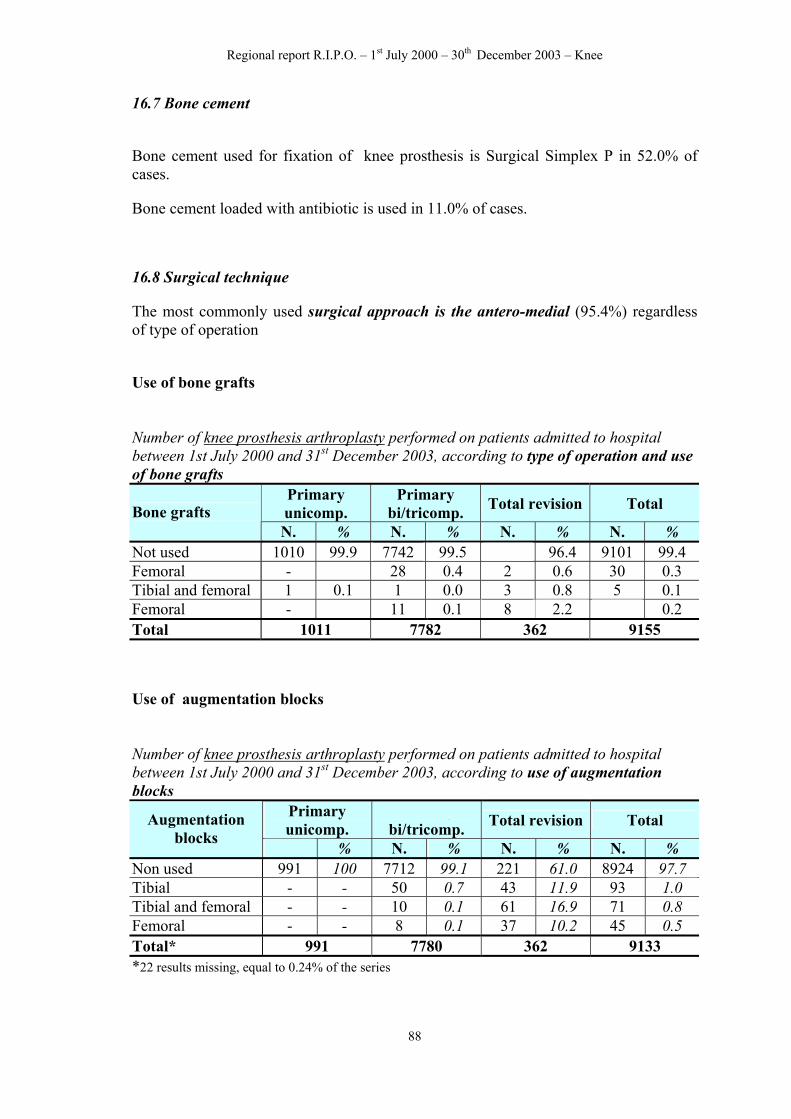
5.12 Surgical techniques (surgical approach, bone graft, reinforcement rings) The most commonly used surgical approaches are lateral and postero-lateral. 70.0% of THA is implanted through lateral approach, 26.0% through postero-lateral. Minimally invasive approach is used in 0.07% of operations. 56.1% of hemiarthroplasties is implanted through lateral approach, 40.4% through postero-lateral Number of hip arthroplasty operations on patients admitted between 1st January 2000 and 31st December 2003, according to type of operation and bone graft.
Graft Primary THA
Total revision Cup revision Stem
revision Total
Not used 17.562 702 743 417 19.424 Acetabular 688 496 545 12 1.741 Femoral 125 19 5 27 176 Both 60 61 23 8 152 Total 18.435 1.278 1.316 464 21.493 In 15.6% of revision surgery of cups, reinforcement ring were uses. More commonly used are MULLER – Sulzer (67.6% ) and Burch-Schneider – Sulzer (23.6% of cases).
40
Regional report R.I.P.O. – 1st January 2000 – 31st December 2003 – Hip
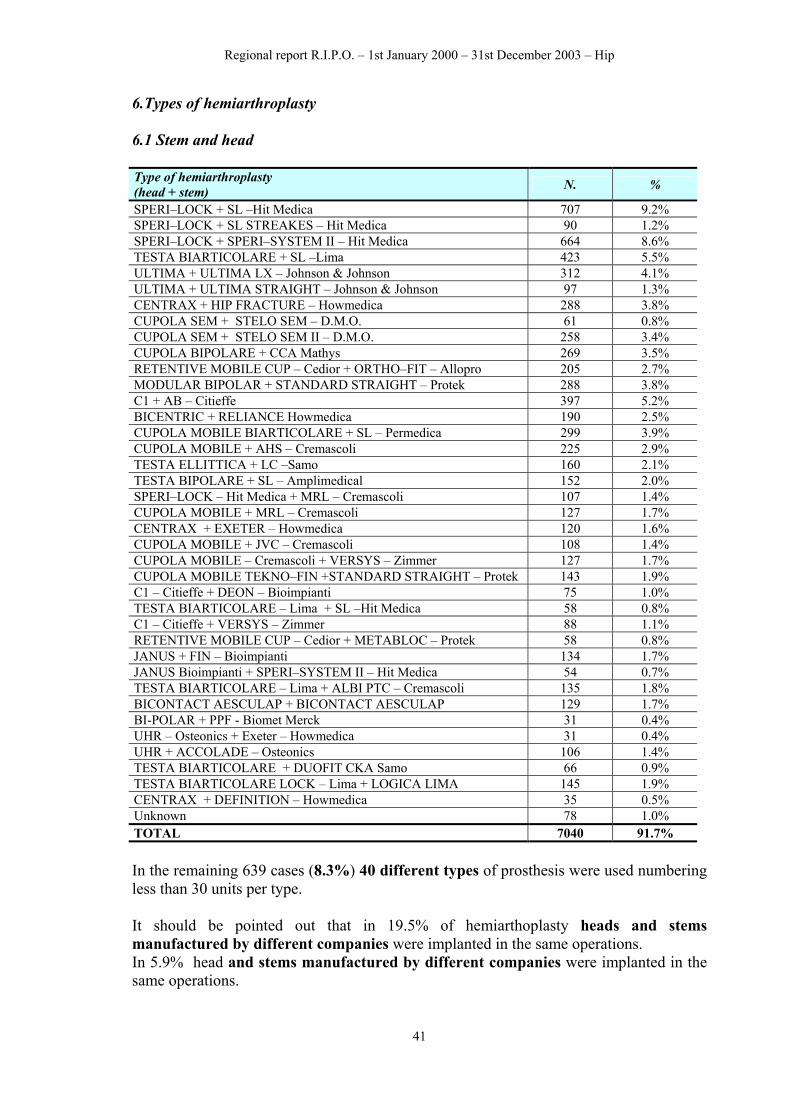
6.Types of hemiarthroplasty 6.1 Stem and head Type of hemiarthroplasty (head + stem) N. %
SPERI–LOCK + SL –Hit Medica 707 9.2% SPERI–LOCK + SL STREAKES – Hit Medica 90 1.2% SPERI–LOCK + SPERI–SYSTEM II – Hit Medica 664 8.6% TESTA BIARTICOLARE + SL –Lima 423 5.5% ULTIMA + ULTIMA LX – Johnson & Johnson 312 4.1% ULTIMA + ULTIMA STRAIGHT – Johnson & Johnson 97 1.3% CENTRAX + HIP FRACTURE – Howmedica 288 3.8% CUPOLA SEM + STELO SEM – D.M.O. 61 0.8% CUPOLA SEM + STELO SEM II – D.M.O. 258 3.4% CUPOLA BIPOLARE + CCA Mathys 269 3.5% RETENTIVE MOBILE CUP – Cedior + ORTHO–FIT – Allopro 205 2.7% MODULAR BIPOLAR + STANDARD STRAIGHT – Protek 288 3.8% C1 + AB – Citieffe 397 5.2% BICENTRIC + RELIANCE Howmedica 190 2.5% CUPOLA MOBILE BIARTICOLARE + SL – Permedica 299 3.9% CUPOLA MOBILE + AHS – Cremascoli 225 2.9% TESTA ELLITTICA + LC –Samo 160 2.1% TESTA BIPOLARE + SL – Amplimedical 152 2.0% SPERI–LOCK – Hit Medica + MRL – Cremascoli 107 1.4% CUPOLA MOBILE + MRL – Cremascoli 127 1.7% CENTRAX + EXETER – Howmedica 120 1.6% CUPOLA MOBILE + JVC – Cremascoli 108 1.4% CUPOLA MOBILE – Cremascoli + VERSYS – Zimmer 127 1.7% CUPOLA MOBILE TEKNO–FIN +STANDARD STRAIGHT – Protek 143 1.9% C1 – Citieffe + DEON – Bioimpianti 75 1.0% TESTA BIARTICOLARE – Lima + SL –Hit Medica 58 0.8% C1 – Citieffe + VERSYS – Zimmer 88 1.1% RETENTIVE MOBILE CUP – Cedior + METABLOC – Protek 58 0.8% JANUS + FIN – Bioimpianti 134 1.7% JANUS Bioimpianti + SPERI–SYSTEM II – Hit Medica 54 0.7% TESTA BIARTICOLARE – Lima + ALBI PTC – Cremascoli 135 1.8% BICONTACT AESCULAP + BICONTACT AESCULAP 129 1.7% BI-POLAR + PPF - Biomet Merck 31 0.4% UHR – Osteonics + Exeter – Howmedica 31 0.4% UHR + ACCOLADE – Osteonics 106 1.4% TESTA BIARTICOLARE + DUOFIT CKA Samo 66 0.9% TESTA BIARTICOLARE LOCK – Lima + LOGICA LIMA 145 1.9% CENTRAX + DEFINITION – Howmedica 35 0.5% Unknown 78 1.0% TOTAL 7040 91.7% In the remaining 639 cases (8.3%) 40 different types of prosthesis were used numbering less than 30 units per type. It should be pointed out that in 19.5% of hemiarthoplasty heads and stems manufactured by different companies were implanted in the same operations. In 5.9% head and stems manufactured by different companies were implanted in the same operations.
41
Regional report R.I.P.O. – 1st January 2000 – 31st December 2003 – Hip
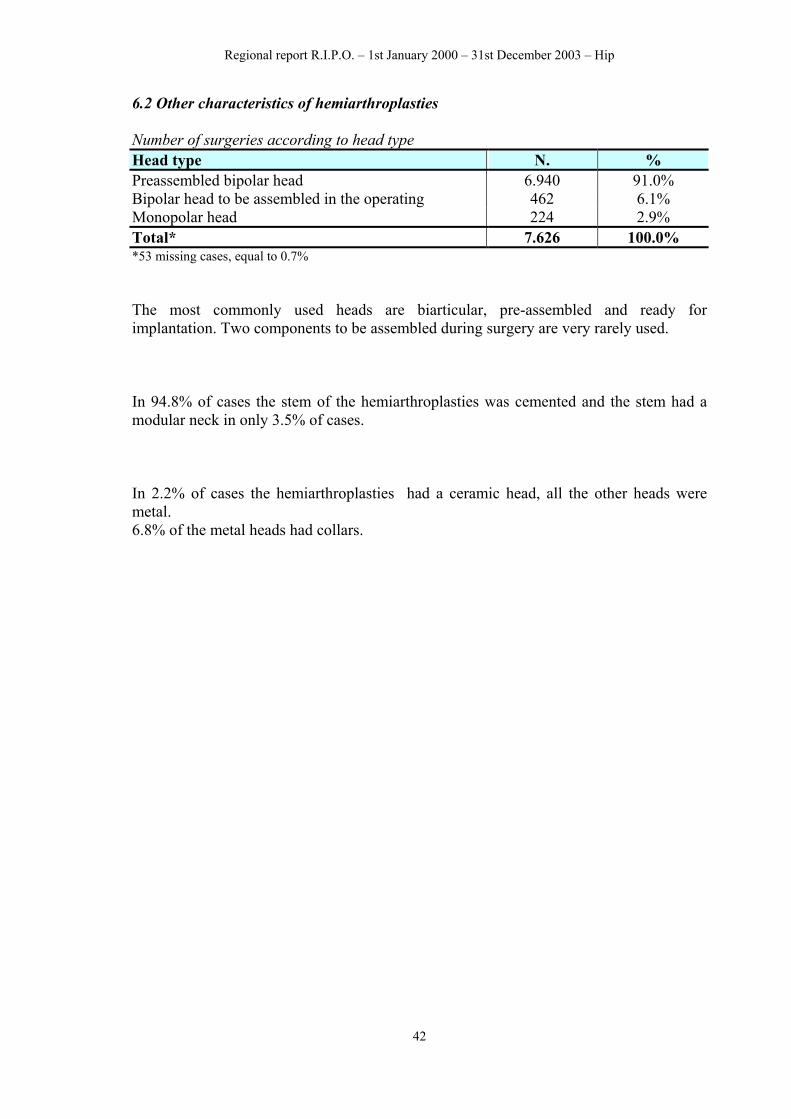
6.2 Other characteristics of hemiarthroplasties Number of surgeries according to head type Head type N. % Preassembled bipolar head 6.940 91.0% Bipolar head to be assembled in the operating 462 6.1% Monopolar head 224 2.9% Total* 7.626 100.0% *53 missing cases, equal to 0.7% The most commonly used heads are biarticular, pre-assembled and ready for implantation. Two components to be assembled during surgery are very rarely used. In 94.8% of cases the stem of the hemiarthroplasties was cemented and the stem had a modular neck in only 3.5% of cases. In 2.2% of cases the hemiarthroplasties had a ceramic head, all the other heads were metal. 6.8% of the metal heads had collars.
42
Regional report R.I.P.O. – 1st January 2000 – 31st December 2003 – Hip
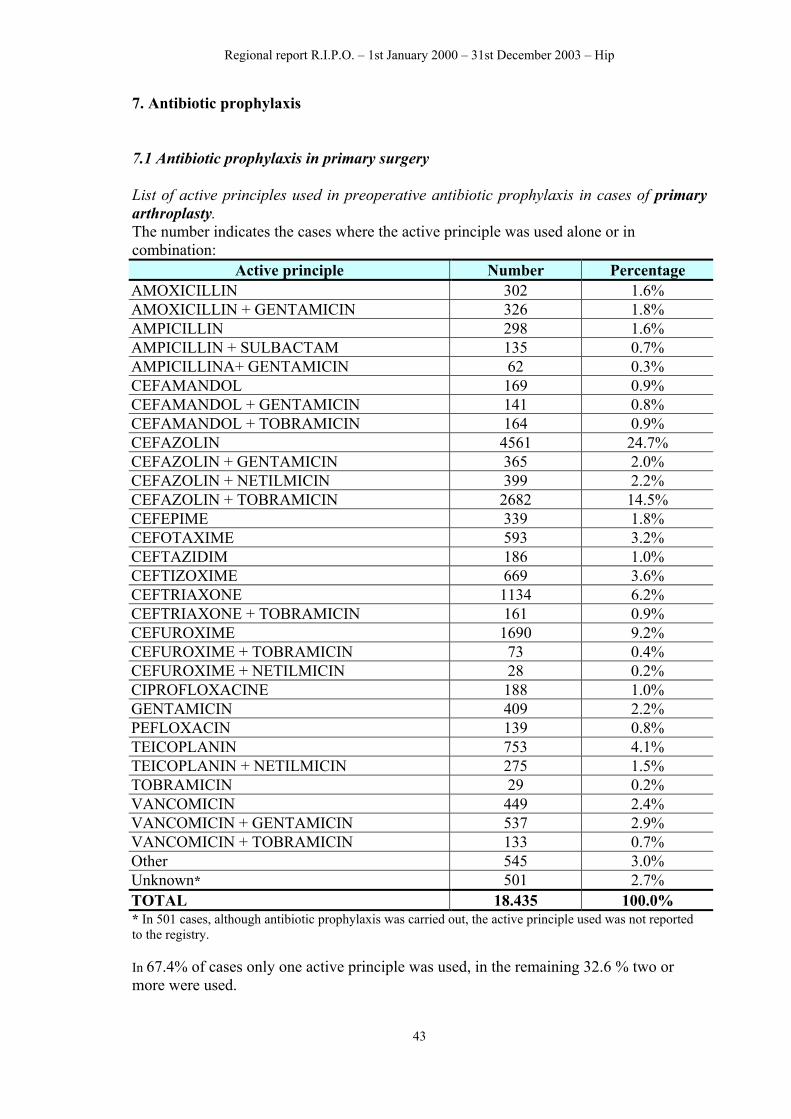
7. Antibiotic prophylaxis 7.1 Antibiotic prophylaxis in primary surgery List of active principles used in preoperative antibiotic prophylaxis in cases of primary arthroplasty. The number indicates the cases where the active principle was used alone or in combination:
Active principle Number Percentage AMOXICILLIN 302 1.6% AMOXICILLIN + GENTAMICIN 326 1.8% AMPICILLIN 298 1.6% AMPICILLIN + SULBACTAM 135 0.7% AMPICILLINA+ GENTAMICIN 62 0.3% CEFAMANDOL 169 0.9% CEFAMANDOL + GENTAMICIN 141 0.8% CEFAMANDOL + TOBRAMICIN 164 0.9% CEFAZOLIN 4561 24.7% CEFAZOLIN + GENTAMICIN 365 2.0% CEFAZOLIN + NETILMICIN 399 2.2% CEFAZOLIN + TOBRAMICIN 2682 14.5% CEFEPIME 339 1.8% CEFOTAXIME 593 3.2% CEFTAZIDIM 186 1.0% CEFTIZOXIME 669 3.6% CEFTRIAXONE 1134 6.2% CEFTRIAXONE + TOBRAMICIN 161 0.9% CEFUROXIME 1690 9.2% CEFUROXIME + TOBRAMICIN 73 0.4% CEFUROXIME + NETILMICIN 28 0.2% CIPROFLOXACINE 188 1.0% GENTAMICIN 409 2.2% PEFLOXACIN 139 0.8% TEICOPLANIN 753 4.1% TEICOPLANIN + NETILMICIN 275 1.5% TOBRAMICIN 29 0.2% VANCOMICIN 449 2.4% VANCOMICIN + GENTAMICIN 537 2.9% VANCOMICIN + TOBRAMICIN 133 0.7% Other 545 3.0% Unknown* 501 2.7% TOTAL 18.435 100.0% * In 501 cases, although antibiotic prophylaxis was carried out, the active principle used was not reported to the registry. In 67.4% of cases only one active principle was used, in the remaining 32.6 % two or more were used.
43
Regional report R.I.P.O. – 1st January 2000 – 31st December 2003 – Hip
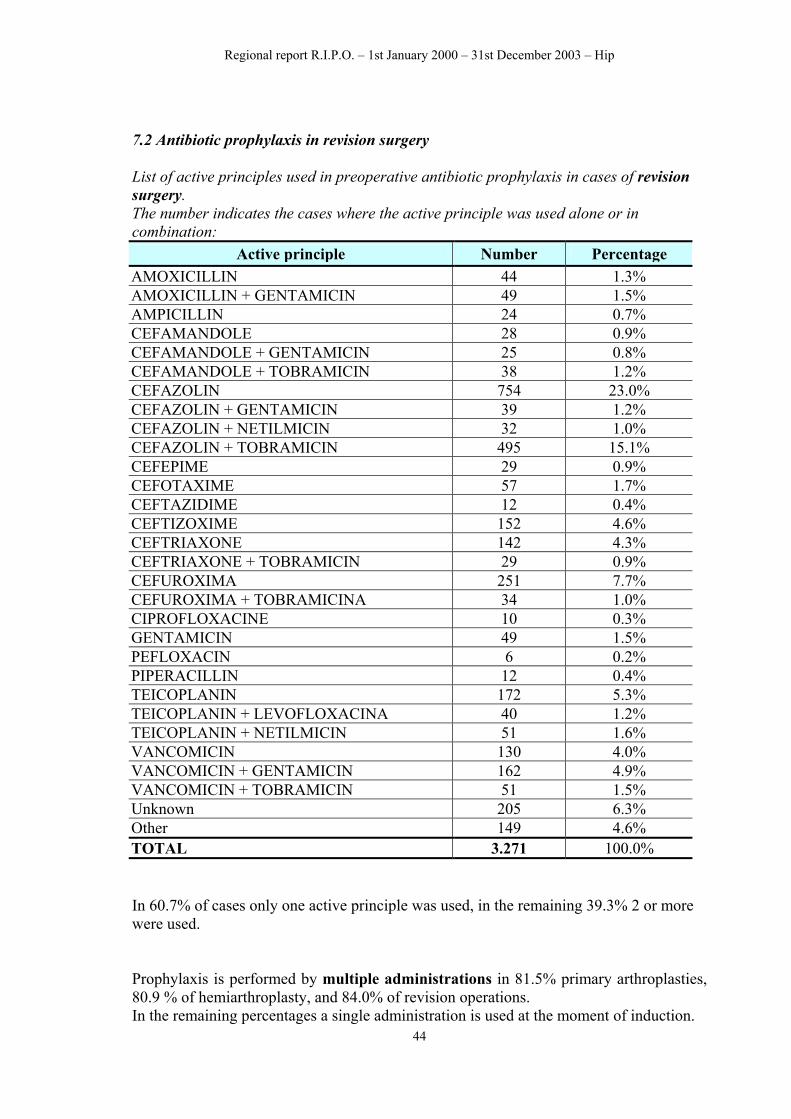
7.2 Antibiotic prophylaxis in revision surgery List of active principles used in preoperative antibiotic prophylaxis in cases of revision surgery. The number indicates the cases where the active principle was used alone or in combination:
Active principle Number Percentage AMOXICILLIN 44 1.3% AMOXICILLIN + GENTAMICIN 49 1.5% AMPICILLIN 24 0.7% CEFAMANDOLE 28 0.9% CEFAMANDOLE + GENTAMICIN 25 0.8% CEFAMANDOLE + TOBRAMICIN 38 1.2% CEFAZOLIN 754 23.0% CEFAZOLIN + GENTAMICIN 39 1.2% CEFAZOLIN + NETILMICIN 32 1.0% CEFAZOLIN + TOBRAMICIN 495 15.1% CEFEPIME 29 0.9% CEFOTAXIME 57 1.7% CEFTAZIDIME 12 0.4% CEFTIZOXIME 152 4.6% CEFTRIAXONE 142 4.3% CEFTRIAXONE + TOBRAMICIN 29 0.9% CEFUROXIMA 251 7.7% CEFUROXIMA + TOBRAMICINA 34 1.0% CIPROFLOXACINE 10 0.3% GENTAMICIN 49 1.5% PEFLOXACIN 6 0.2% PIPERACILLIN 12 0.4% TEICOPLANIN 172 5.3% TEICOPLANIN + LEVOFLOXACINA 40 1.2% TEICOPLANIN + NETILMICIN 51 1.6% VANCOMICIN 130 4.0% VANCOMICIN + GENTAMICIN 162 4.9% VANCOMICIN + TOBRAMICIN 51 1.5% Unknown 205 6.3% Other 149 4.6% TOTAL 3.271 100.0% In 60.7% of cases only one active principle was used, in the remaining 39.3% 2 or more were used. Prophylaxis is performed by multiple administrations in 81.5% primary arthroplasties, 80.9 % of hemiarthroplasty, and 84.0% of revision operations. In the remaining percentages a single administration is used at the moment of induction. 44
Regional report R.I.P.O. – 1st January 2000 – 31st December 2003 – Hip
8. Blood transfusion Percentages of operations performed on patients admitted between 1st January 2000 and 31st December 2003 according to type of operation and transfusion..
Nearly half elective primary operations are supported by predeposited blood. In the following tabs, the analysis has been performed according to type of operation and and healthcare structure. The quote of missing data is still quite high.
Regional report R.I.P.O. – 1st January 2000 – 31st December 2003 – Hip
Revision surgery
None
Autologus (recovery)
Autologus (predeposit) Homologous
Autologous and
Homologous
Missing data
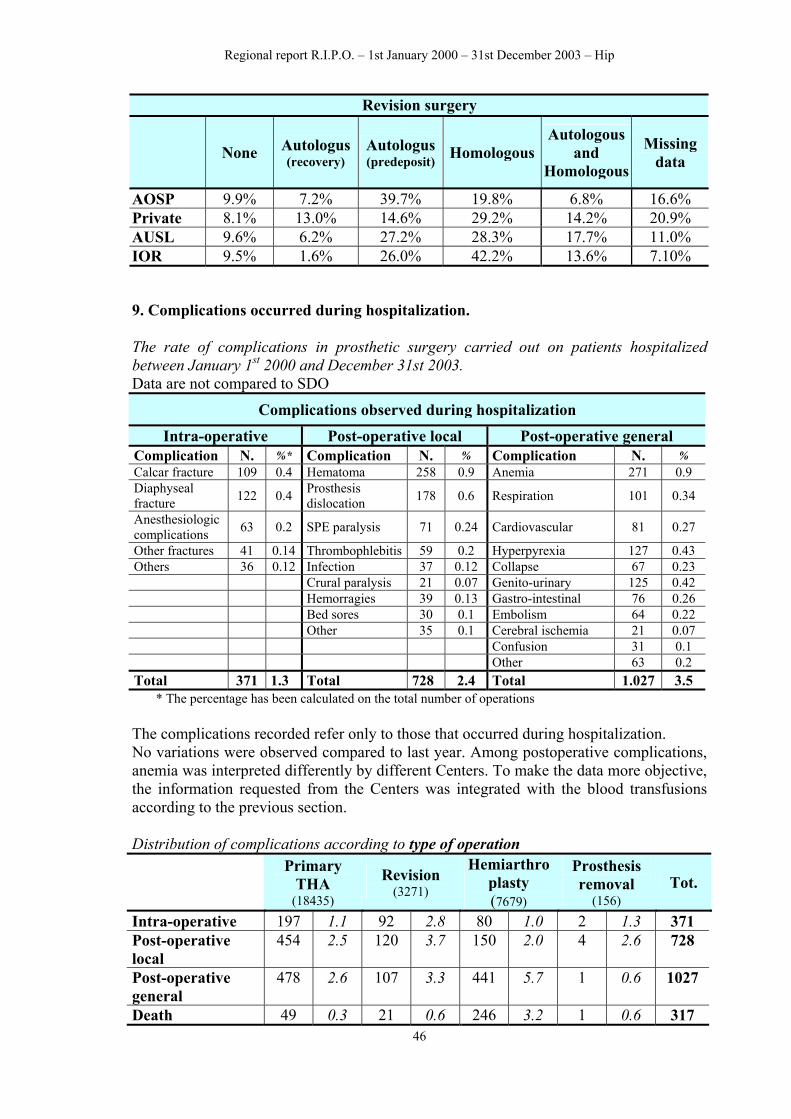
AOSP 9.9% 7.2% 39.7% 19.8% 6.8% 16.6% Private 8.1% 13.0% 14.6% 29.2% 14.2% 20.9% AUSL 9.6% 6.2% 27.2% 28.3% 17.7% 11.0% IOR 9.5% 1.6% 26.0% 42.2% 13.6% 7.10% 9. Complications occurred during hospitalization. The rate of complications in prosthetic surgery carried out on patients hospitalized between January 1st 2000 and December 31st 2003. Data are not compared to SDO
Complications observed during hospitalization
Intra-operative Post-operative local Post-operative general Complication N. %* Complication N. % Complication N. % Calcar fracture 109 0.4 Hematoma 258 0.9 Anemia 271 0.9 Diaphyseal fracture 122 0.4 Prosthesis
Other fractures 41 0.14 Thrombophlebitis 59 0.2 Hyperpyrexia 127 0.43 Others 36 0.12 Infection 37 0.12 Collapse 67 0.23 Crural paralysis 21 0.07 Genito-urinary 125 0.42 Hemorragies 39 0.13 Gastro-intestinal 76 0.26 Bed sores 30 0.1 Embolism 64 0.22 Other 35 0.1 Cerebral ischemia 21 0.07 Confusion 31 0.1 Other 63 0.2 Total 371 1.3 Total 728 2.4 Total 1.027 3.5
* The percentage has been calculated on the total number of operations
The complications recorded refer only to those that occurred during hospitalization. No variations were observed compared to last year. Among postoperative complications, anemia was interpreted differently by different Centers. To make the data more objective, the information requested from the Centers was integrated with the blood transfusions according to the previous section. Distribution of complications according to type of operation Primary
Regional report R.I.P.O. – 1st January 2000 – 31st December 2003 – Hip
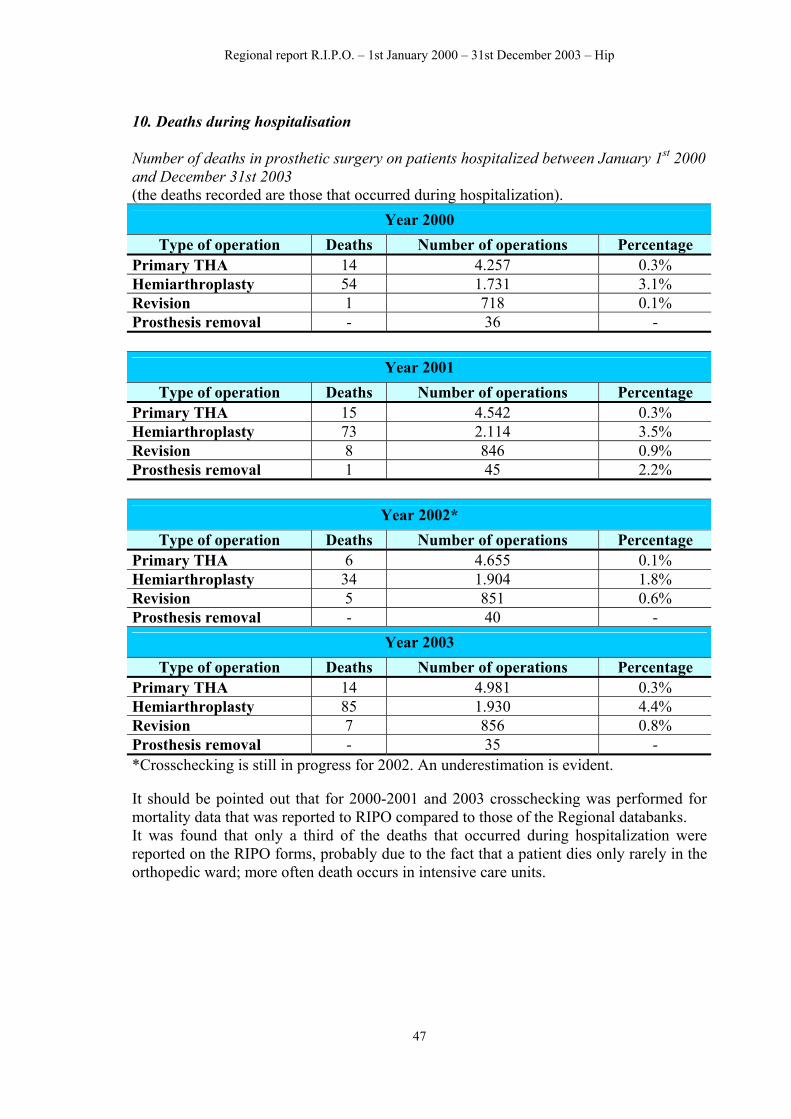
10. Deaths during hospitalisation Number of deaths in prosthetic surgery on patients hospitalized between January 1st 2000 and December 31st 2003 (the deaths recorded are those that occurred during hospitalization).
Year 2000 Type of operation Deaths Number of operations Percentage
Year 2003 Type of operation Deaths Number of operations Percentage
Primary THA 14 4.981 0.3% Hemiarthroplasty 85 1.930 4.4% Revision 7 856 0.8% Prosthesis removal - 35 - *Crosschecking is still in progress for 2002. An underestimation is evident. It should be pointed out that for 2000-2001 and 2003 crosschecking was performed for mortality data that was reported to RIPO compared to those of the Regional databanks. It was found that only a third of the deaths that occurred during hospitalization were reported on the RIPO forms, probably due to the fact that a patient dies only rarely in the orthopedic ward; more often death occurs in intensive care units.
47
Regional report R.I.P.O. – 1st January 2000 – 31st December 2003 – Hip
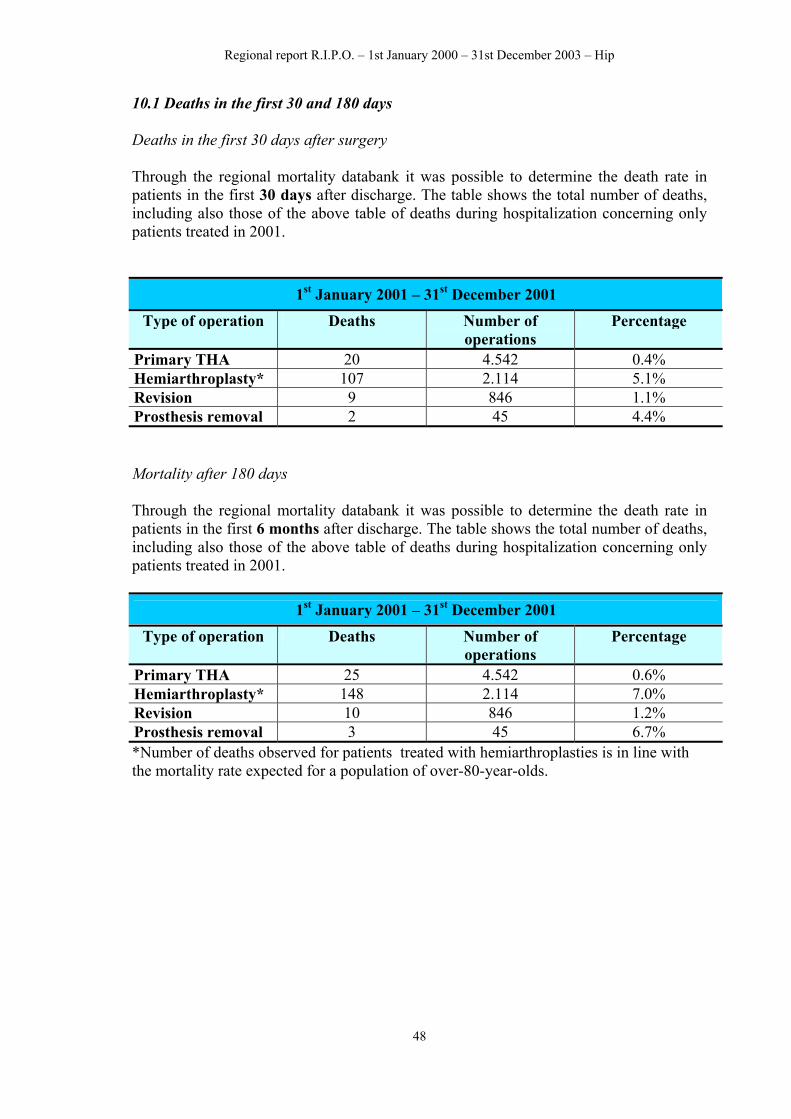
10.1 Deaths in the first 30 and 180 days Deaths in the first 30 days after surgery Through the regional mortality databank it was possible to determine the death rate in patients in the first 30 days after discharge. The table shows the total number of deaths, including also those of the above table of deaths during hospitalization concerning only patients treated in 2001.
1st January 2001 – 31st December 2001
Type of operation Deaths Number of operations
Percentage
Primary THA 20 4.542 0.4% Hemiarthroplasty* 107 2.114 5.1% Revision 9 846 1.1% Prosthesis removal 2 45 4.4% Mortality after 180 days Through the regional mortality databank it was possible to determine the death rate in patients in the first 6 months after discharge. The table shows the total number of deaths, including also those of the above table of deaths during hospitalization concerning only patients treated in 2001.
1st January 2001 – 31st December 2001
Type of operation Deaths Number of operations
Percentage
Primary THA 25 4.542 0.6% Hemiarthroplasty* 148 2.114 7.0% Revision 10 846 1.2% Prosthesis removal 3 45 6.7% *Number of deaths observed for patients treated with hemiarthroplasties is in line with the mortality rate expected for a population of over-80-year-olds.
48
Regional report R.I.P.O. – 1st January 2000 – 31st December 2003 – Hip
11. Duration of hospitalization Preoperative hospitalization is the difference between date of surgery and date of admittance. Postoperative hospitalization is the difference between the date of discharge and the date of surgery.
Total 13.5 0-217 2.7 0-84 10.8 0-149 Postoperative hospitalization equal to 0 days occurs when the patient is transferred to another ward (intensive care). Total hospitalization equal to 0 days occurs in operations carried out on patients staying in non-orthopedic wards, who return to their ward after surgery. No variations are observed compared to last year. The following tables show mean hospitalization divided according to year of surgery: Elective primary THA Number of cases Mean
hospitalization Range
hospitalization Year 2000 3880 12.6 1-93 Year 2001 4137 12.4 1-114 Year 2002 4234 12.3 1-78 Year 2003 4273 11.9 1-134 Emergency primaryTHA Number of cases Mean
hospitalization Range
hospitalization Year 2000 377 15.7 4-66 Year 2001 405 16.5 4-87 Year 2002 421 16.0 4-112 Year 2003 371 16.2 2-68
49
Regional report R.I.P.O. – 1st January 2000 – 31st December 2003 – Hip
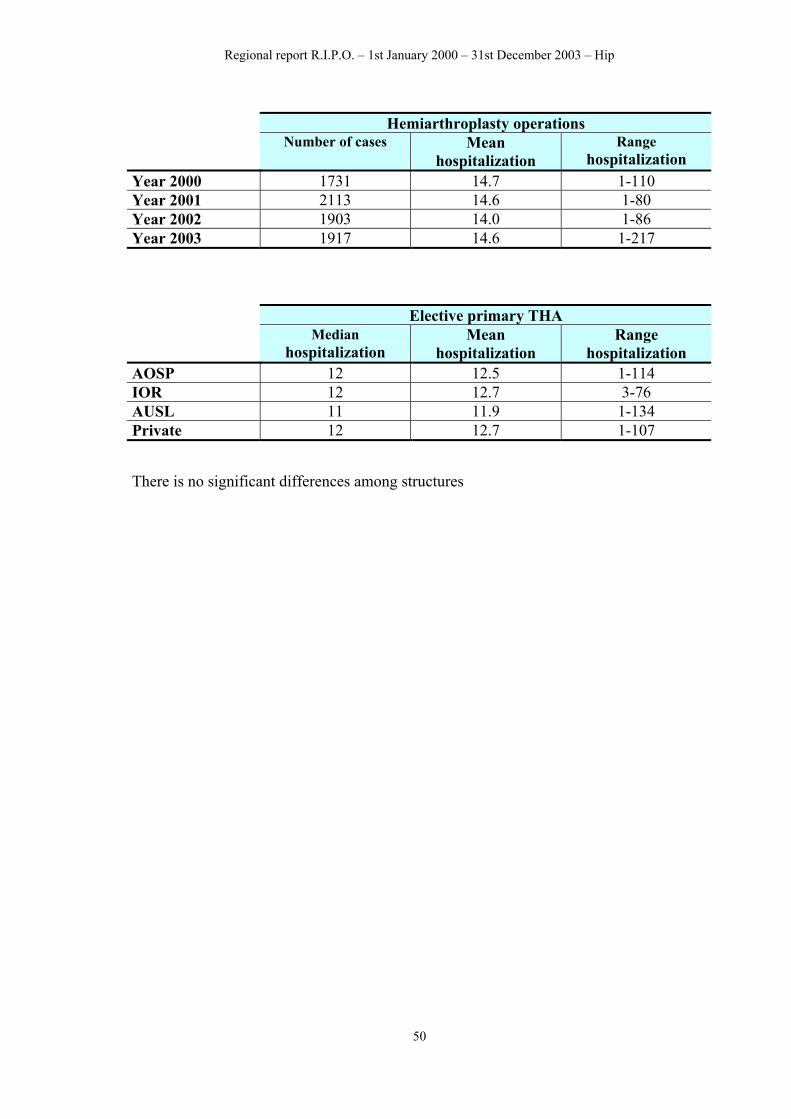
Hemiarthroplasty operations Number of cases Mean
hospitalization Range
hospitalization Year 2000 1731 14.7 1-110 Year 2001 2113 14.6 1-80 Year 2002 1903 14.0 1-86 Year 2003 1917 14.6 1-217 Elective primary THA Median
hospitalization Mean
hospitalization Range
hospitalization AOSP 12 12.5 1-114 IOR 12 12.7 3-76 AUSL 11 11.9 1-134 Private 12 12.7 1-107 There is no significant differences among structures
50
Regional report R.I.P.O. – 1st January 2000 – 31st December 2003 – Hip
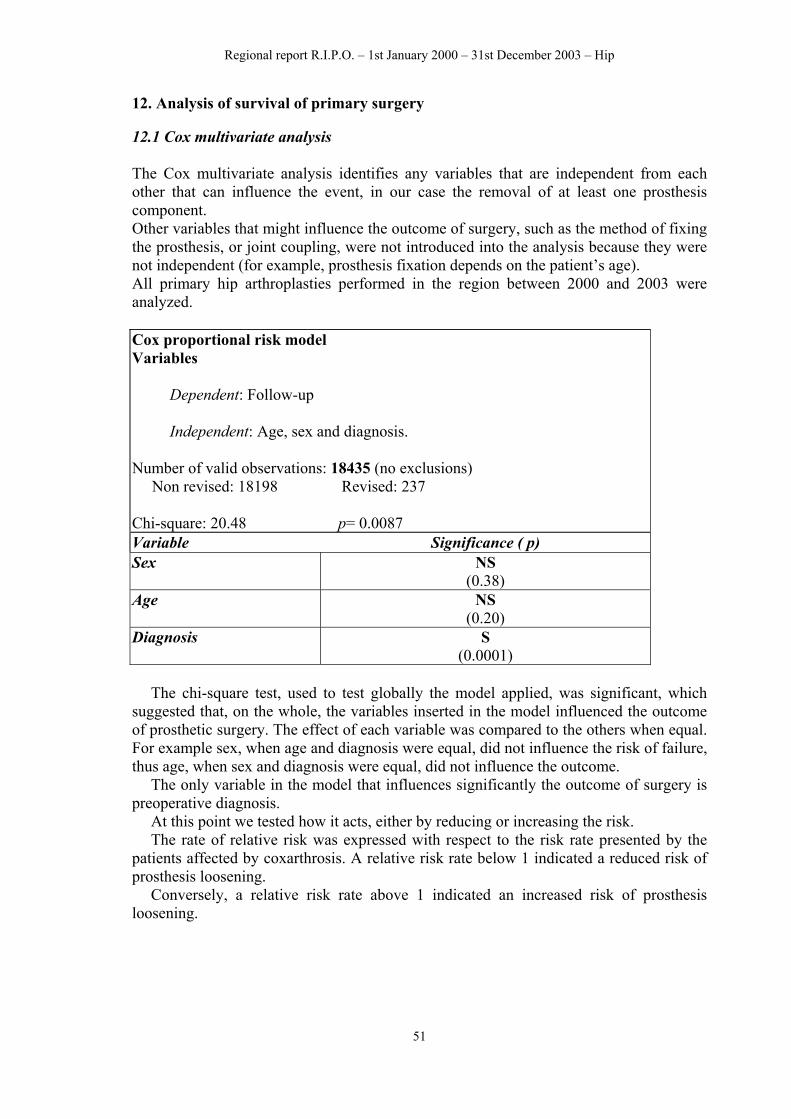
12. Analysis of survival of primary surgery 12.1 Cox multivariate analysis The Cox multivariate analysis identifies any variables that are independent from each other that can influence the event, in our case the removal of at least one prosthesis component. Other variables that might influence the outcome of surgery, such as the method of fixing the prosthesis, or joint coupling, were not introduced into the analysis because they were not independent (for example, prosthesis fixation depends on the patient’s age). All primary hip arthroplasties performed in the region between 2000 and 2003 were analyzed. Cox proportional risk model Variables
Dependent: Follow-up Independent: Age, sex and diagnosis.
Number of valid observations: 18435 (no exclusions) Non revised: 18198 Revised: 237 Chi-square: 20.48 p= 0.0087 Variable Significance ( p) Sex NS
(0.38) Age NS
(0.20) Diagnosis S
(0.0001)
The chi-square test, used to test globally the model applied, was significant, which suggested that, on the whole, the variables inserted in the model influenced the outcome of prosthetic surgery. The effect of each variable was compared to the others when equal. For example sex, when age and diagnosis were equal, did not influence the risk of failure, thus age, when sex and diagnosis were equal, did not influence the outcome.
The only variable in the model that influences significantly the outcome of surgery is preoperative diagnosis.
At this point we tested how it acts, either by reducing or increasing the risk. The rate of relative risk was expressed with respect to the risk rate presented by the
patients affected by coxarthrosis. A relative risk rate below 1 indicated a reduced risk of prosthesis loosening.
Conversely, a relative risk rate above 1 indicated an increased risk of prosthesis loosening.
51
Regional report R.I.P.O. – 1st January 2000 – 31st December 2003 – Hip
To analyze the influence of the disease, the patients were divided into 6 groups: - coxarthrosis, - rheumatic arthritis (rheumatoid arthritis, psoriasis, rhizomelic spondylitis) - femoral fractures and their consequences (necrosis and post-traumatic arthrosis) - idiopathic necrosis of the femoral head - sequelae of congenital and infantile diseases (LCA, DCA, Perthes, epiphysiolysis) - “others” that include sequelae of septic coxitis, coxitis from TBC, ankylosis, and metastases. The following table shows a significant increase in risk in the case of patients treated by arthroplasty due to femoral fracture, or after “other” diseases or rheumatic arthritis. In patients affected by rheumatic arthritis the risk was 2.58 times greater than in patients of the same sex and age treated for coxarthrosis. In patients affected by “other” diseases or treated by arthroplasty due to femoral fracture the risk was respectively 4.08 and 1.48 times greater than in patients of the same age and sex treated for coxarthrosis. Conversely, in patients treated by arthroplasty due to cephalic necrosis, or to correct sequelae of congenital and infantile diseases the risk of loosening was not significantly higher than in patients treated for coxarthrosis.
Variable Relative risk rate
Confidence Interval 95%
Significance (p)
Diagnosis
Others (sequelae of coxitis, Paget’s disease, metastasis, etc.. )
4.08
2.25
7.4
S (0.0001)
Sequelae congenital diseases 1.33 0.90 1.97 NS
(0.14) Femoral head necrosis 1.12 061 2.09 NS
(0.71) Femoral neck fracture and sequelae
1.48 1.02 2.14 S (0.039)
Rheumatic arthritis
2.58
1.20
5.55
S (0.015)
52
Regional report R.I.P.O. – 1st January 2000 – 31st December 2003 – Hip
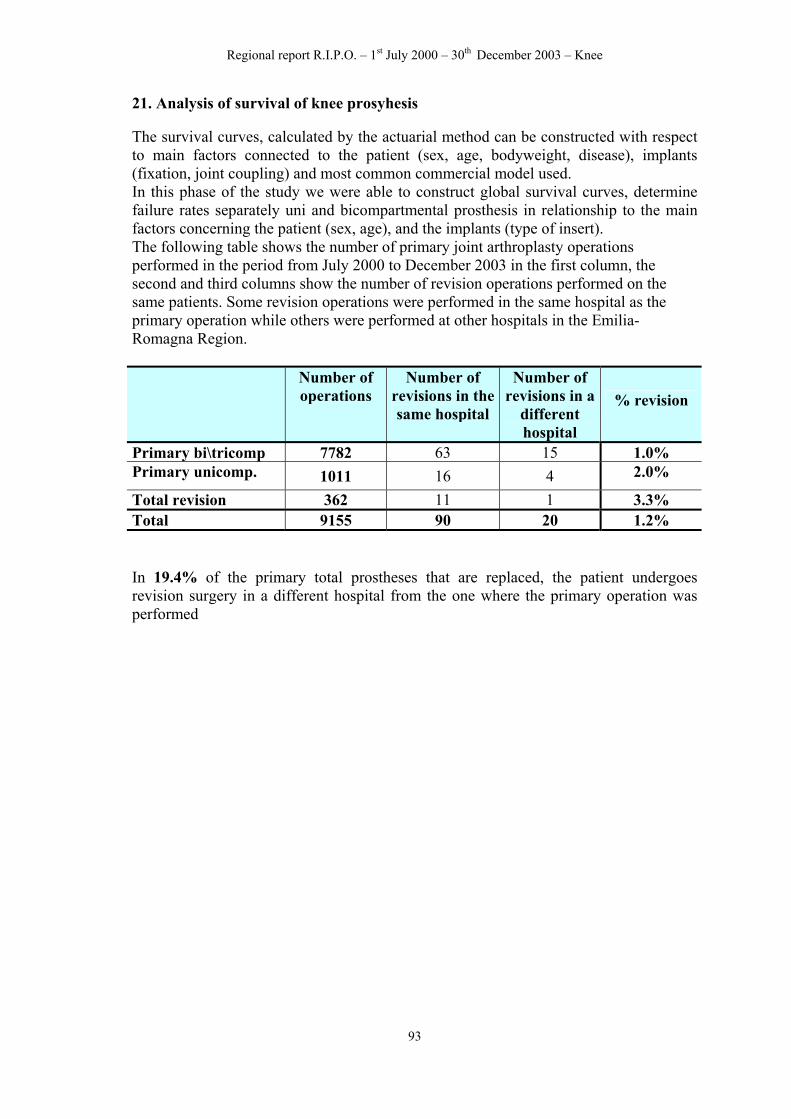
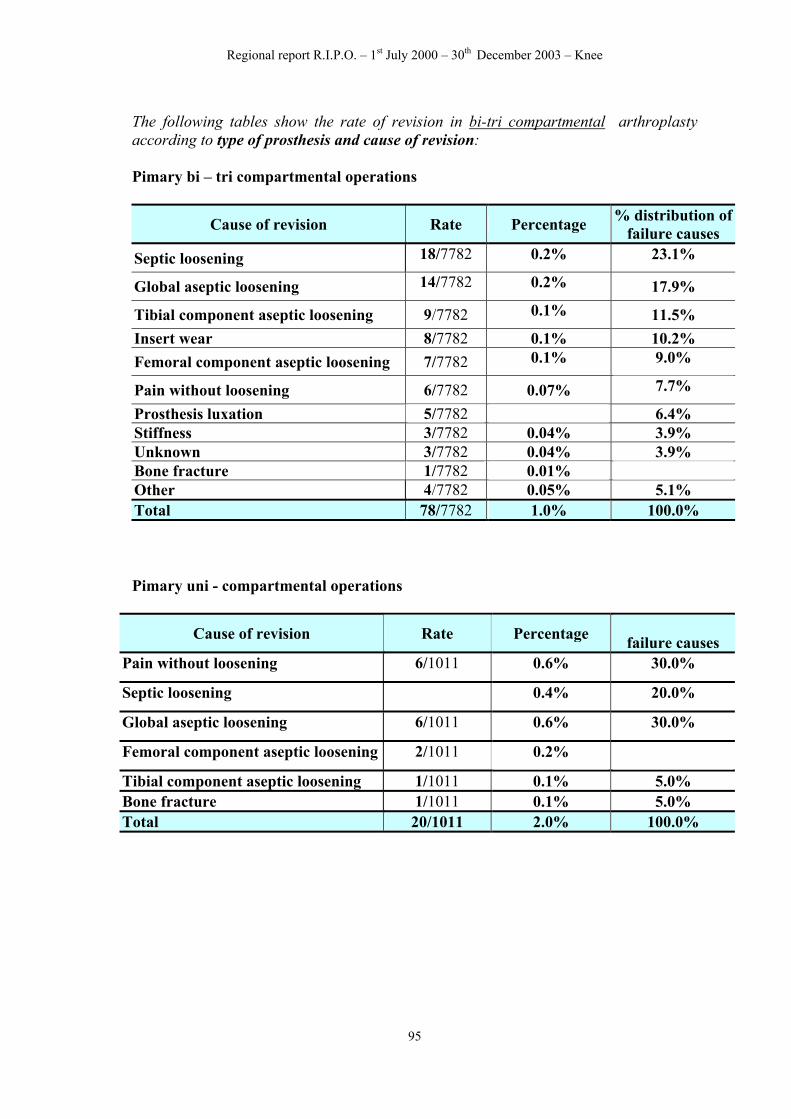
12.2 Survival curves The survival curves, calculated by the actuarial method can be constructed with respect to main factors connected to the patient (sex, age, bodyweight, disease), implants (fixation, joint coupling) and most common commercial model used. In this phase of the study we were able to construct global survival curves, determine failure rates separately for primary prostheses and hemiarthroplasty, in relationship to the main factors concerning the patient (sex, age, build, disease), the implants (fixation, joint coupling). The following table shows the number of primary joint arthroplasty operations performed in the period from January 2000 to December 2003 in the first column, the second and third columns show the number of revision operations performed on the same patients. Some revision operations were performed in the same hospital as the primary operation while others were performed at other hospitals in the Emilia-Romagna Region. As already stated in the introduction of this report, the recovery of data of operations not reported to RIPO is in progress. The uncertainty that comes from the failure to report about 10% of operations performed in the region give an unquantifiable underestimation at present. Number of
operations N. of revisions
performed in the same hospital
N. of revisions performed in a
different hospital
Primary THA 18.435 199 38 Hemiarthroplasty 7.679 62 14 Total revision 1.278 49 10 Total 27.392 310 62
In 16.0% of the primary total prostheses that are replaced, the patient undergoes revision surgery in a different hospital from the one where the primary operation was performed. With regards to hemiarthroplasty, the percentage is 18.4%. and to total revision the percentage is 16.9% The following table shows the rate of revision according to type of surgery:
Type of operation Revision rate Percentage Primary THA 237/18.435 1.3% Total revision 59/1.278 4.6% Hemiarthroplasty 76/7.679 1.0%
53
Regional report R.I.P.O. – 1st January 2000 – 31st December 2003 – Hip
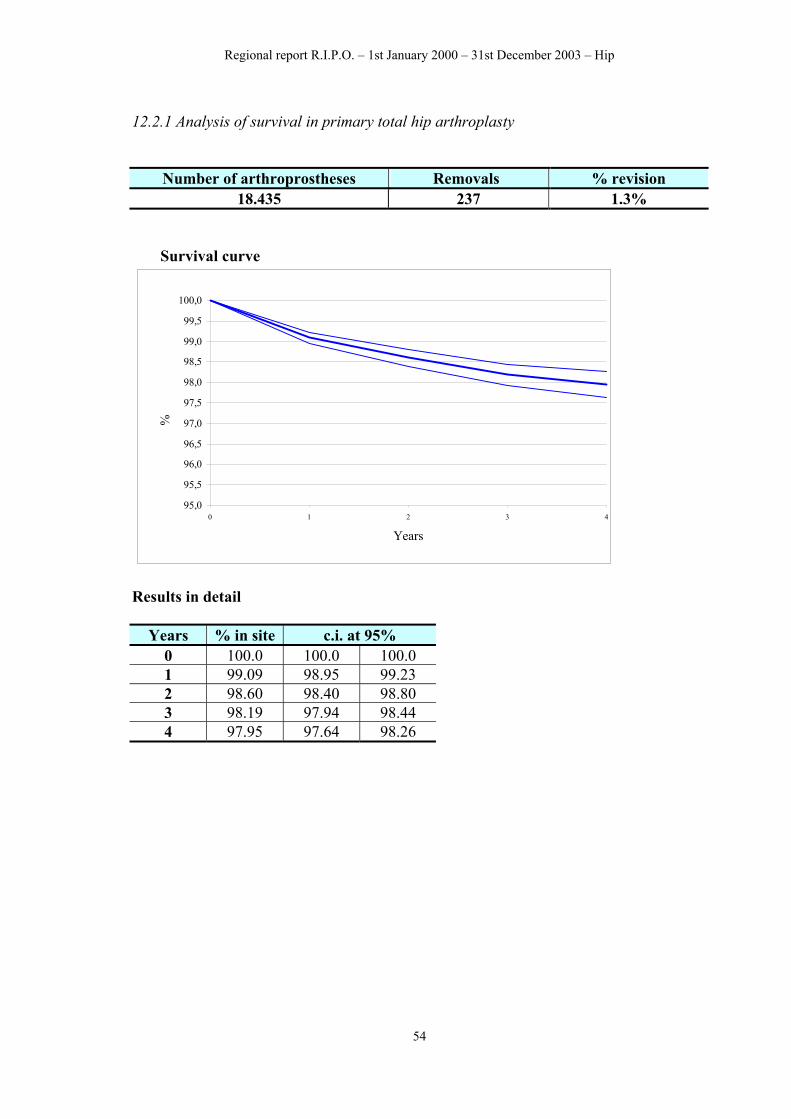
12.2.1 Analysis of survival in primary total hip arthroplasty
Number of arthroprostheses Removals % revision 18.435 237 1.3%
Survival curve
95,0
95,5
96,0
96,5
97,0
97,5
98,0
98,5
99,0
99,5
100,0
0 1 2 3 4
Years
%
Results in detail
Years % in site c.i. at 95% 0 100.0 100.0 100.0 1 99.09 98.95 99.23 2 98.60 98.40 98.80 3 98.19 97.94 98.44 4 97.95 97.64 98.26
54
Regional report R.I.P.O. – 1st January 2000 – 31st December 2003 – Hip
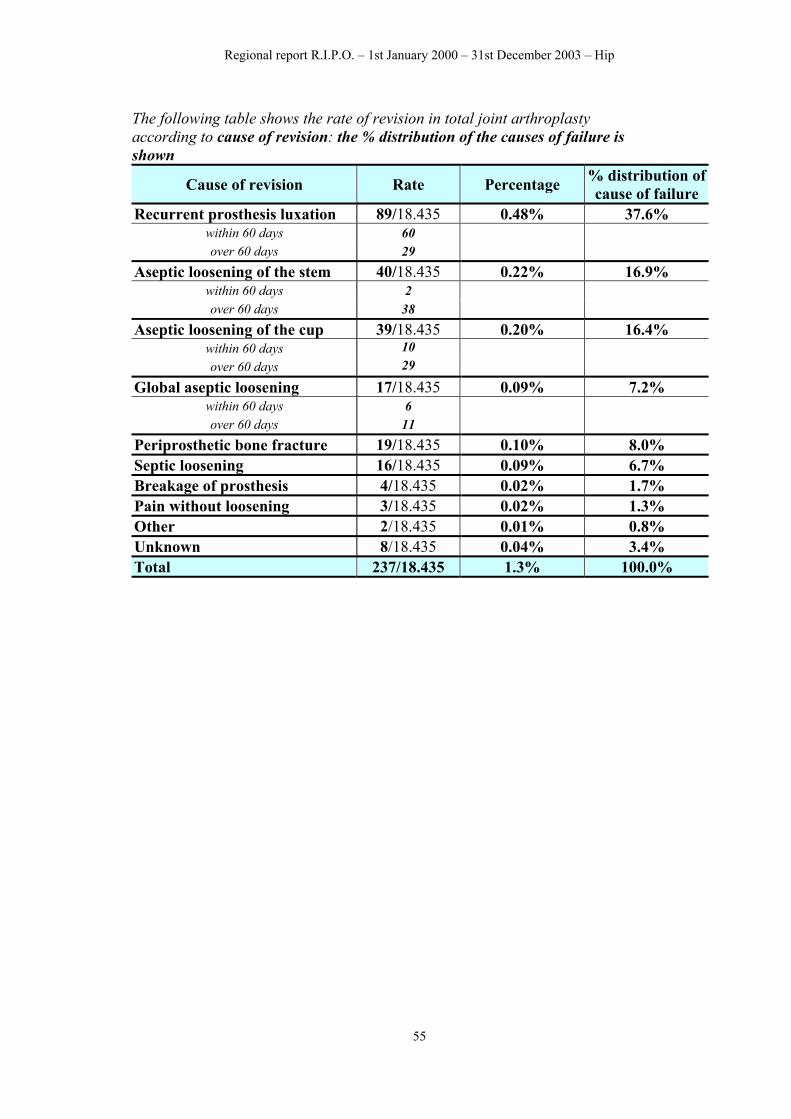
The following table shows the rate of revision in total joint arthroplasty according to cause of revision: the % distribution of the causes of failure is shown
Cause of revision Rate Percentage % distribution of cause of failure
Recurrent prosthesis luxation 89/18.435 0.48% 37.6% within 60 days 60 over 60 days 29
Aseptic loosening of the stem 40/18.435 0.22% 16.9% within 60 days 2 over 60 days 38
Aseptic loosening of the cup 39/18.435 0.20% 16.4% within 60 days 10 over 60 days 29
Global aseptic loosening 17/18.435 0.09% 7.2% within 60 days 6 over 60 days 11
Periprosthetic bone fracture 19/18.435 0.10% 8.0% Septic loosening 16/18.435 0.09% 6.7% Breakage of prosthesis 4/18.435 0.02% 1.7% Pain without loosening 3/18.435 0.02% 1.3% Other 2/18.435 0.01% 0.8% Unknown 8/18.435 0.04% 3.4% Total 237/18.435 1.3% 100.0%
55
Regional report R.I.P.O. – 1st January 2000 – 31st December 2003 – Hip
The following table shows the rate of revision in total joint arthroplasty according to patient’s age:
Age range Number of operations Removal Rate Percentage
Regional report R.I.P.O. – 1st January 2000 – 31st December 2003 – Hip
The following table shows the rate of revision in total joint arthroplasty according to joint coupling and cause of revision
METAL-POLYETHYLENE Cause Rate Percentage Prosthesis luxation 40/7.578 0.53% Aseptic loosening of the stem 21/7.578 0.28% Aseptic loosening of the cup 19/7.578 0.25% Septic loosening 5/7.578 0.07% Periprosthesic bone fracture 4/7.578 0.05% Global aseptic loosening 10/7.578 0.05% Pain without loosening 2/7.578 0.03% Breakage of prosthesis 1/7.578 0.01% Unknown 4/7.578 0.05%
CERAMIC-POLYETHYLENE Cause Rate Percentage Prosthesis luxation 26/5.346 0.49% Aseptic loosening of the cup 7/5.346 0.13% Global aseptic loosening 6/5.346 0.11% Septic loosening 5/5.346 0.09% Aseptic loosening of the stem 5/5.346 0.09% Periprosthesic bone fracture 5/5.346 0.07% Periprosthetic ossifications 1/5.346 0.02% Poly wear 1/5.346 0.02% Breakage of prosthesis 1/5.346 0.02%
58
Regional report R.I.P.O. – 1st January 2000 – 31st December 2003 – Hip
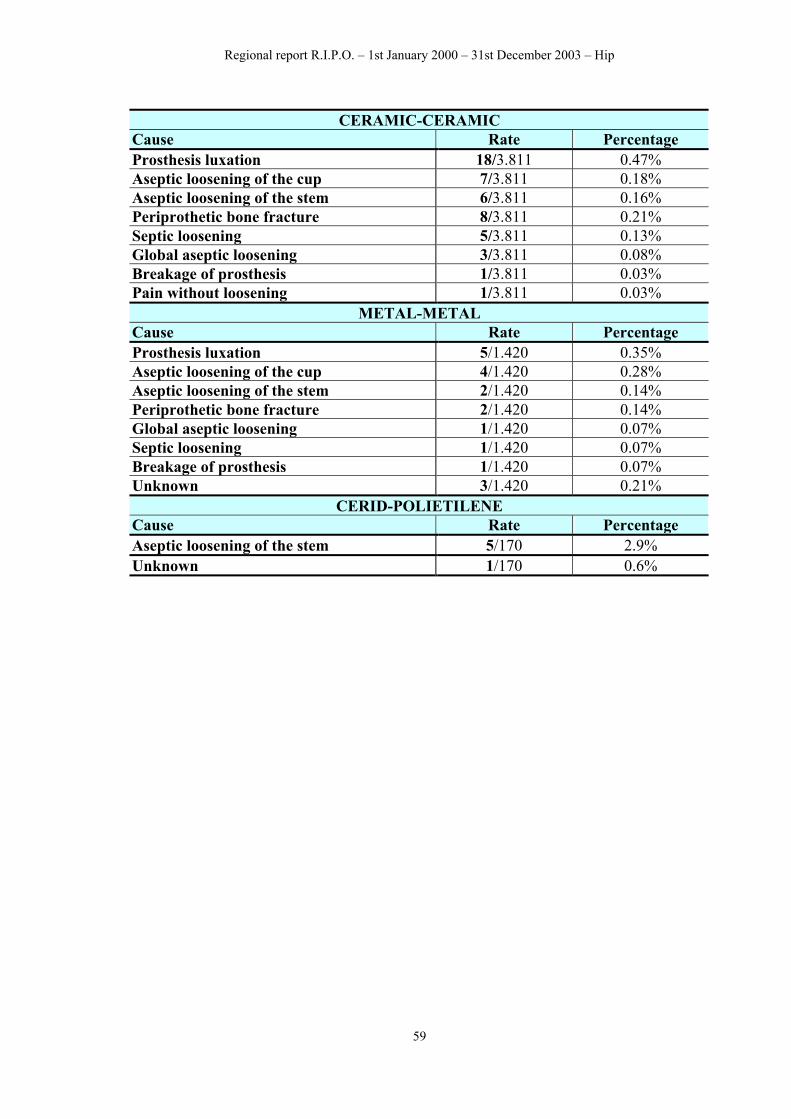
CERAMIC-CERAMIC
Cause Rate Percentage Prosthesis luxation 18/3.811 0.47% Aseptic loosening of the cup 7/3.811 0.18% Aseptic loosening of the stem 6/3.811 0.16% Periprothetic bone fracture 8/3.811 0.21% Septic loosening 5/3.811 0.13% Global aseptic loosening 3/3.811 0.08% Breakage of prosthesis 1/3.811 0.03% Pain without loosening 1/3.811 0.03%
METAL-METAL Cause Rate Percentage Prosthesis luxation 5/1.420 0.35% Aseptic loosening of the cup 4/1.420 0.28% Aseptic loosening of the stem 2/1.420 0.14% Periprothetic bone fracture 2/1.420 0.14% Global aseptic loosening 1/1.420 0.07% Septic loosening 1/1.420 0.07% Breakage of prosthesis 1/1.420 0.07% Unknown 3/1.420 0.21%
CERID-POLIETILENE Cause Rate Percentage Aseptic loosening of the stem 5/170 2.9% Unknown 1/170 0.6%
59
Regional report R.I.P.O. – 1st January 2000 – 31st December 2003 – Hip
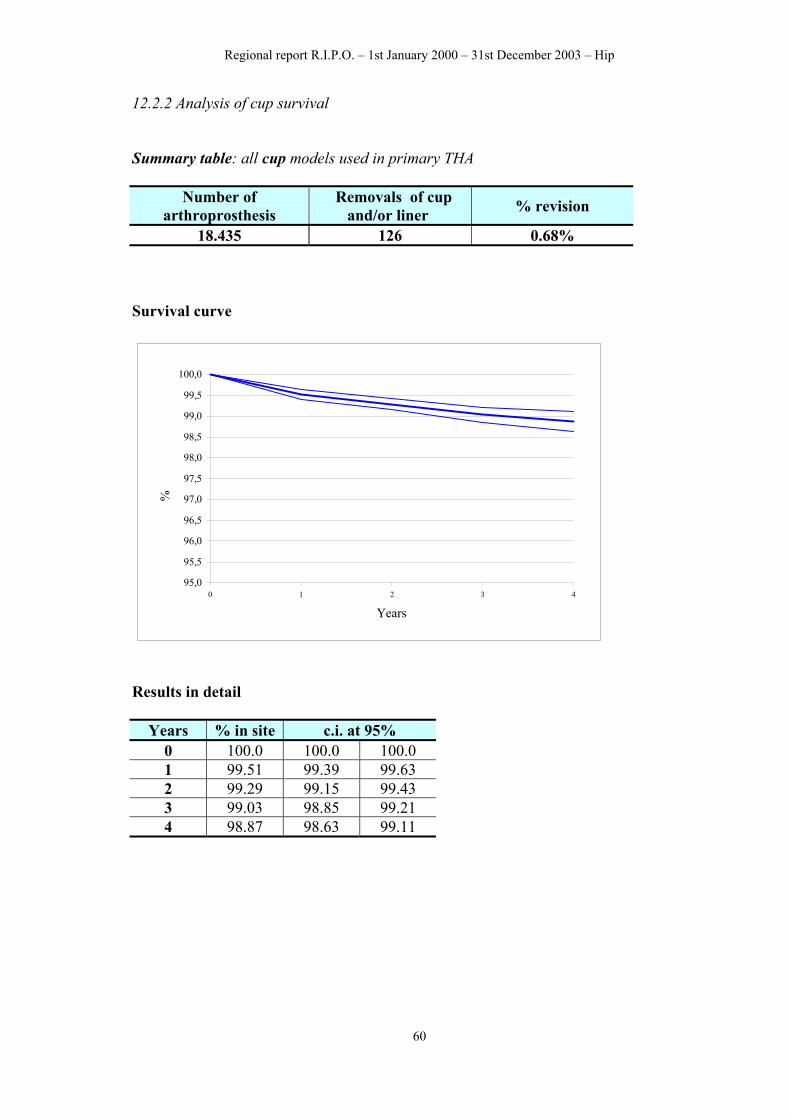
12.2.2 Analysis of cup survival Summary table: all cup models used in primary THA
Number of arthroprosthesis
Removals of cup and/or liner % revision
18.435 126 0.68% Survival curve
95,0
95,5
96,0
96,5
97,0
97,5
98,0
98,5
99,0
99,5
100,0
0 1 2 3 4
Years
%
Results in detail
Years % in site c.i. at 95% 0 100.0 100.0 100.0 1 99.51 99.39 99.63 2 99.29 99.15 99.43 3 99.03 98.85 99.21 4 98.87 98.63 99.11
60
Regional report R.I.P.O. – 1st January 2000 – 31st December 2003 – Hip
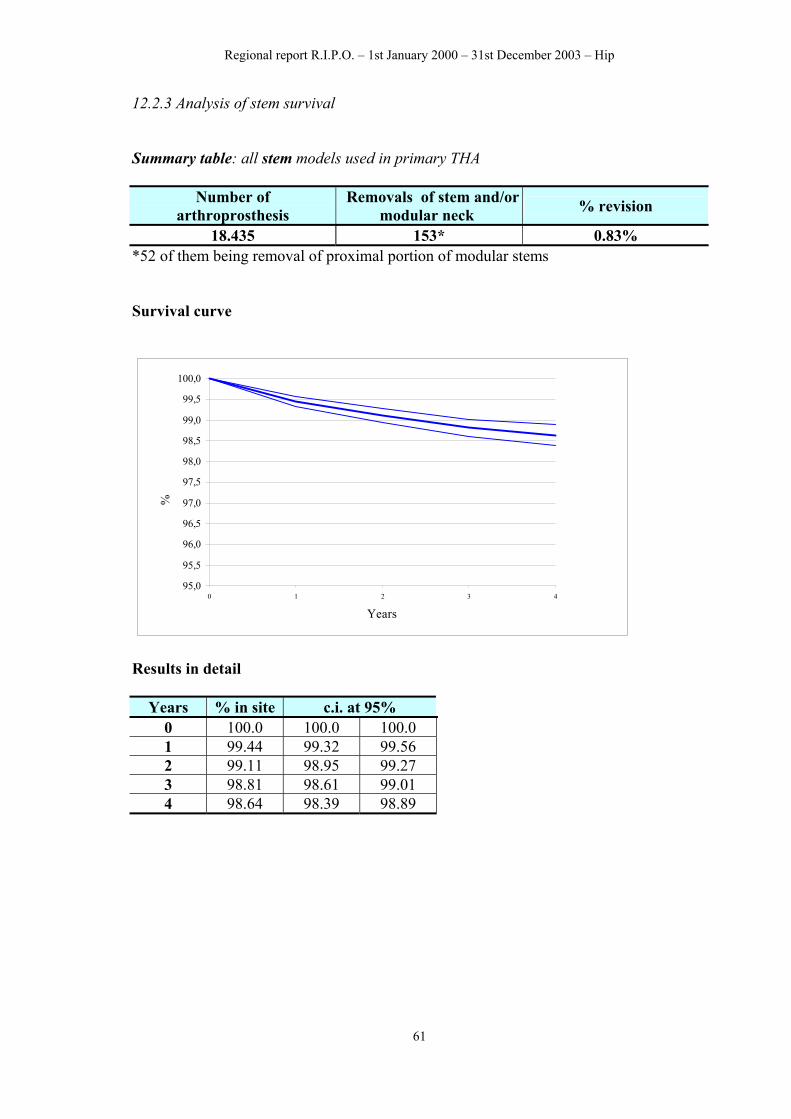
12.2.3 Analysis of stem survival Summary table: all stem models used in primary THA
Number of arthroprosthesis
Removals of stem and/or modular neck % revision
18.435 153* 0.83% *52 of them being removal of proximal portion of modular stems Survival curve
95,0
95,5
96,0
96,5
97,0
97,5
98,0
98,5
99,0
99,5
100,0
0 1 2 3 4
Years
%
Results in detail
Years % in site c.i. at 95% 0 100.0 100.0 100.0 1 99.44 99.32 99.56 2 99.11 98.95 99.27 3 98.81 98.61 99.01 4 98.64 98.39 98.89
61
Regional report R.I.P.O. – 1st January 2000 – 31st December 2003 – Hip
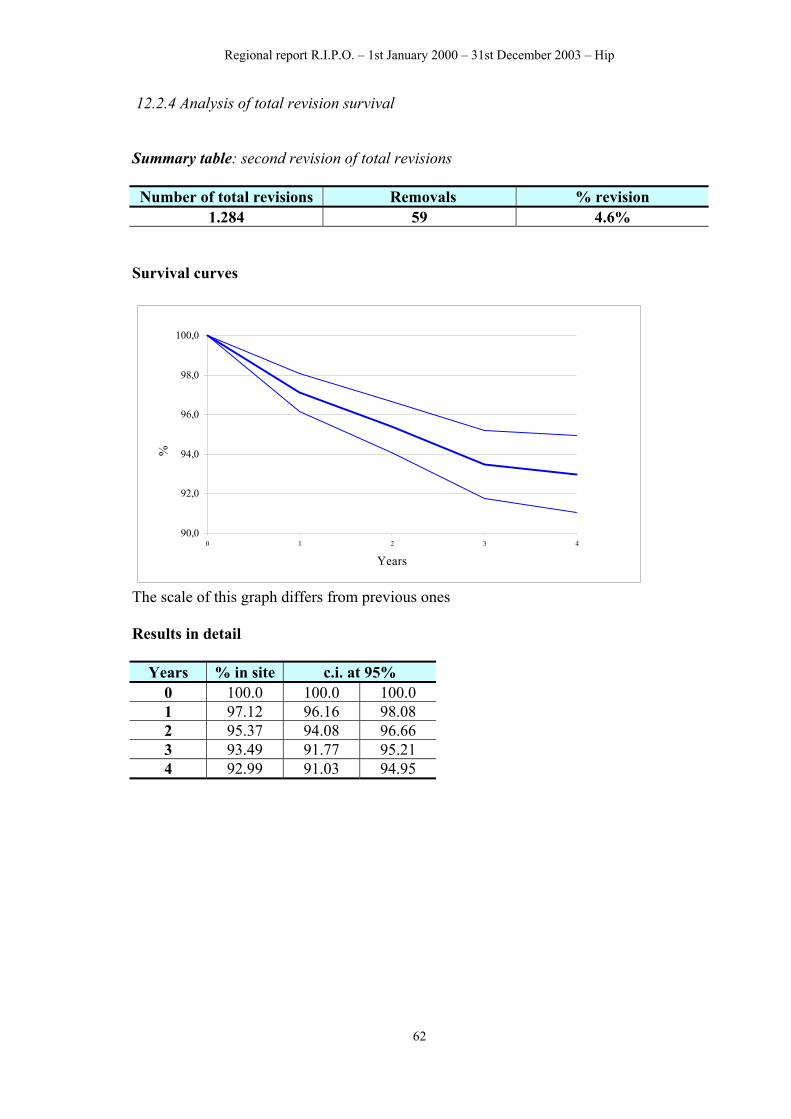
12.2.4 Analysis of total revision survival Summary table: second revision of total revisions Number of total revisions Removals % revision
1.284 59 4.6% Survival curves
90,0
92,0
94,0
96,0
98,0
100,0
0 1 2 3 4
Years
%
The scale of this graph differs from previous ones Results in detail
Years % in site c.i. at 95% 0 100.0 100.0 100.0 1 97.12 96.16 98.08 2 95.37 94.08 96.66 3 93.49 91.77 95.21 4 92.99 91.03 94.95
62
Regional report R.I.P.O. – 1st January 2000 – 31st December 2003 – Hip
The following table shows the rate of second revision in total first revision according to cause of revision
Cause of the second revision Rate Percentage % distribution
of cause of failure
Aseptic loosening of the cup 11/1.284 0.86% 18.6% Aseptic loosening of the stem 10/1.284 0.78% 16.9% Recurrent prosthesis luxation (within 60 days)
9/1.284 0.70% 15.3%
Septic loosening 8/1.284 0.62% 13.5%
Recurrent prosthesis luxation (over 60 days)
7/1.284 0.54% 11.9%
Global aseptic loosening 6/1.284 0.39% 10.2% Periprosthetic bone fracture 5/1.284 0.31% 8.5% Unknown 2/1.284 0.16% 3.4% Pain without loosening 1/1.284 0.08% 1.7% Total 59/1.284 4.6% 100.0% The following table shows the rate of revision in total revision according to patient’s age:
Age range Number of operations Removal Rate Percentage
The following table shows the rate of revision in total revision according to patient’s sex:
Sex Number of operations Removal Rate Percentage
Male 383 21 21/383 5.5% Female 901 38 38/901 4.2%
63
Regional report R.I.P.O. – 1st January 2000 – 31st December 2003 – Hip
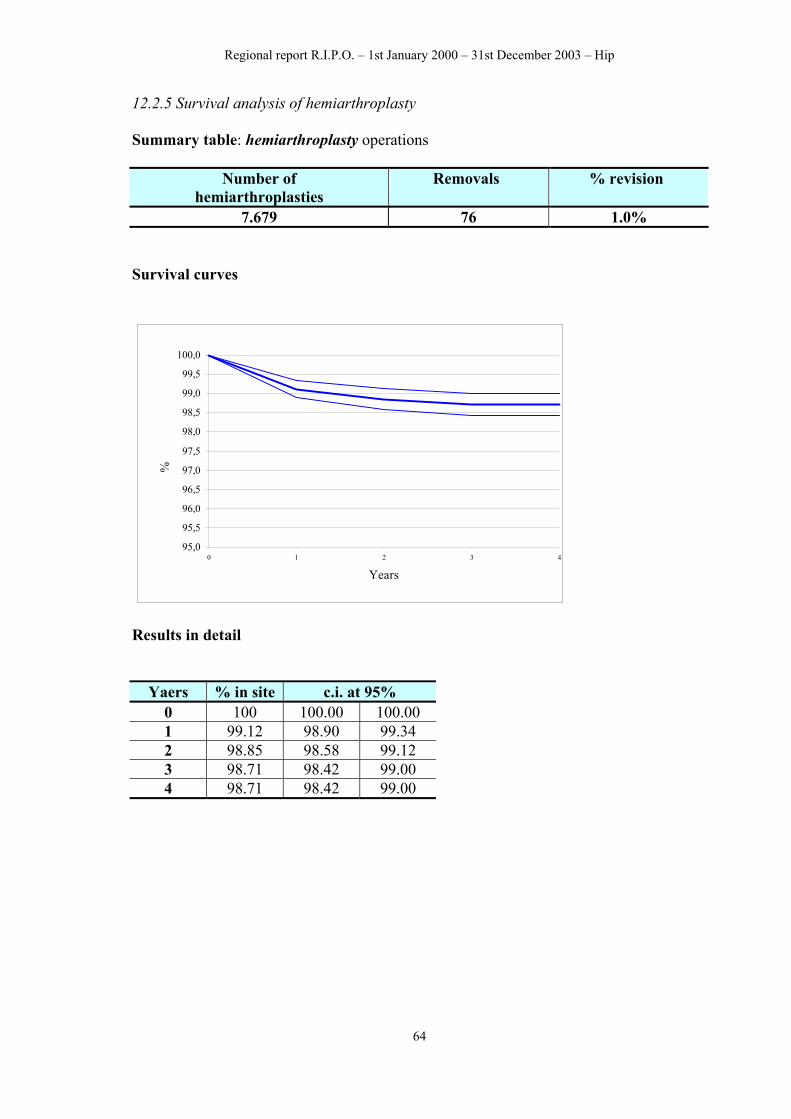
12.2.5 Survival analysis of hemiarthroplasty Summary table: hemiarthroplasty operations
Number of hemiarthroplasties
Removals % revision
7.679 76 1.0% Survival curves
95,0
95,5
96,0
96,5
97,0
97,5
98,0
98,5
99,0
99,5
100,0
0 1 2 3 4
Years
%
Results in detail
Yaers % in site c.i. at 95% 0 100 100.00 100.00 1 99.12 98.90 99.34 2 98.85 98.58 99.12 3 98.71 98.42 99.00 4 98.71 98.42 99.00
64
Regional report R.I.P.O. – 1st January 2000 – 31st December 2003 – Hip
The following table shows the rate of revision in hemiartroplasty according to cause of revision
Cause of revision Rate % %
distribution of failure causes
Prosthesis luxation (within 60 days) 35/7679 0.45% 46.1% Prosthesis luxation (over 60 days) 11/7679 0.14% 14.6% Aseptic loosening of the stem 9/7679 0.12% 11.8% Acetabular erosion 7/7679 0.09% 9.2% Pain without loosening 6/7679 0.08% 7.9% Septic loosening 3/7679 0.04% 3.9% Bone fracture 2/7679 0.03% 2.6% Breakage of cement plug 1/7679 0.01% 1.3% Protrusio acetabuli 1/7679 0.01% 1.3% Recurrence of tumor 1/7679 0.01% 1.3% Total 76/7679 1.0% 100.0% The following table shows the rate of revision in hemiarthroplasty according to patient’s age at the time of operation.
Age range Number of the hemiarthroplasty Removals Rate Percentage
The following table shows the rate of revision in hemiarthroplasty according to patient’s sex
Sex Number of the hemiarthroplasty Removals Rate Percentage
Male 1797 16 16/1797 0.89% Female 5882 60 60/5882 1.02%
65
PART TWO: KNEE PROSTHESES
July 2000 – December 2003
Regional report R.I.P.O. – 1st July 2000 – 30th December 2003 – Knee
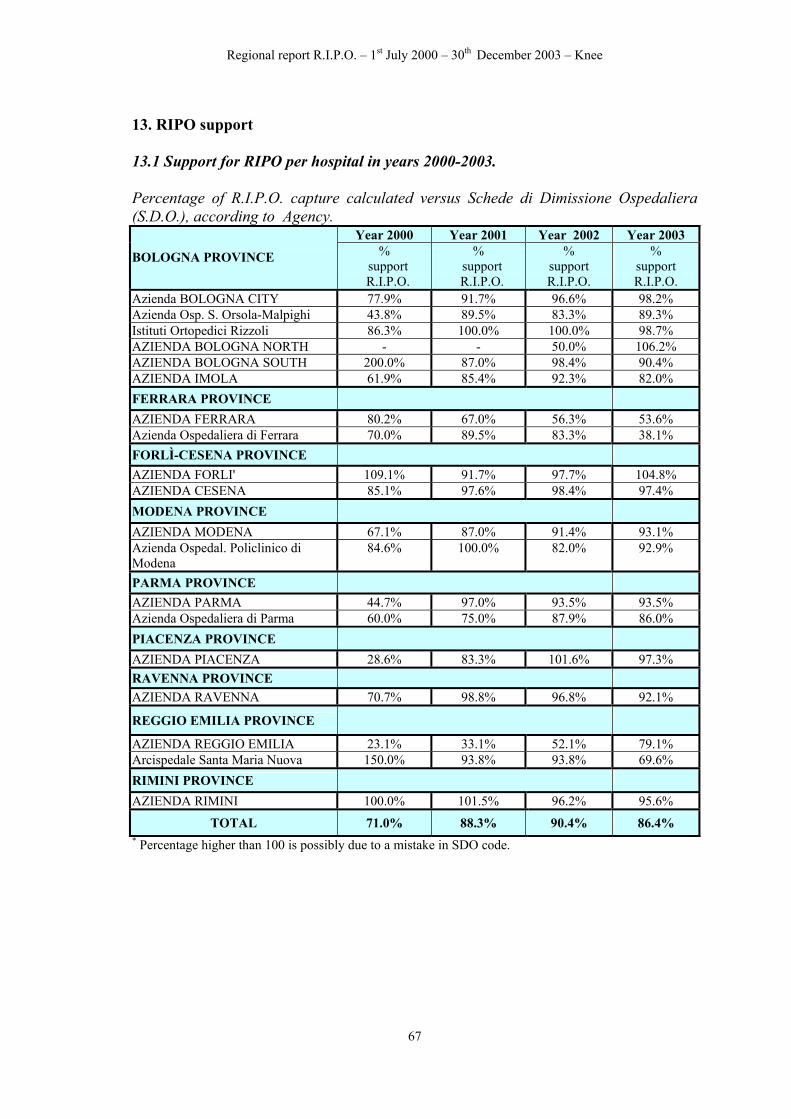
13. RIPO support 13.1 Support for RIPO per hospital in years 2000-2003. Percentage of R.I.P.O. capture calculated versus Schede di Dimissione Ospedaliera (S.D.O.), according to Agency.
Year 2000 Year 2001 Year 2002 Year 2003
BOLOGNA PROVINCE % support R.I.P.O.
% support R.I.P.O.
% support R.I.P.O.
% support R.I.P.O.
Azienda BOLOGNA CITY 77.9% 91.7% 96.6% 98.2% Azienda Osp. S. Orsola-Malpighi 43.8% 89.5% 83.3% 89.3% Istituti Ortopedici Rizzoli 86.3% 100.0% 100.0% 98.7% AZIENDA BOLOGNA NORTH - - 50.0% 106.2% AZIENDA BOLOGNA SOUTH 200.0% 87.0% 98.4% 90.4% AZIENDA IMOLA 61.9% 85.4% 92.3% 82.0% FERRARA PROVINCE
AZIENDA FERRARA 80.2% 67.0% 56.3% 53.6% Azienda Ospedaliera di Ferrara 70.0% 89.5% 83.3% 38.1% FORLÌ-CESENA PROVINCE
23.1% 33.1% 52.1% Arcispedale Santa Maria Nuova 150.0% 93.8% 93.8% 69.6% RIMINI PROVINCE
100.0% 101.5% 96.2% 95.6%
TOTAL 71.0% 88.3% 90.4% 86.4%
AZIENDA FORLI'
MODENA PROVINCE AZIENDA MODENA
AZIENDA PARMA 93.5%
PIACENZA PROVINCE
AZIENDA REGGIO EMILIA 79.1%
AZIENDA RIMINI
* Percentage higher than 100 is possibly due to a mistake in SDO code.
67
Regional report R.I.P.O. – 1st July 2000 – 30th December 2003 – Knee
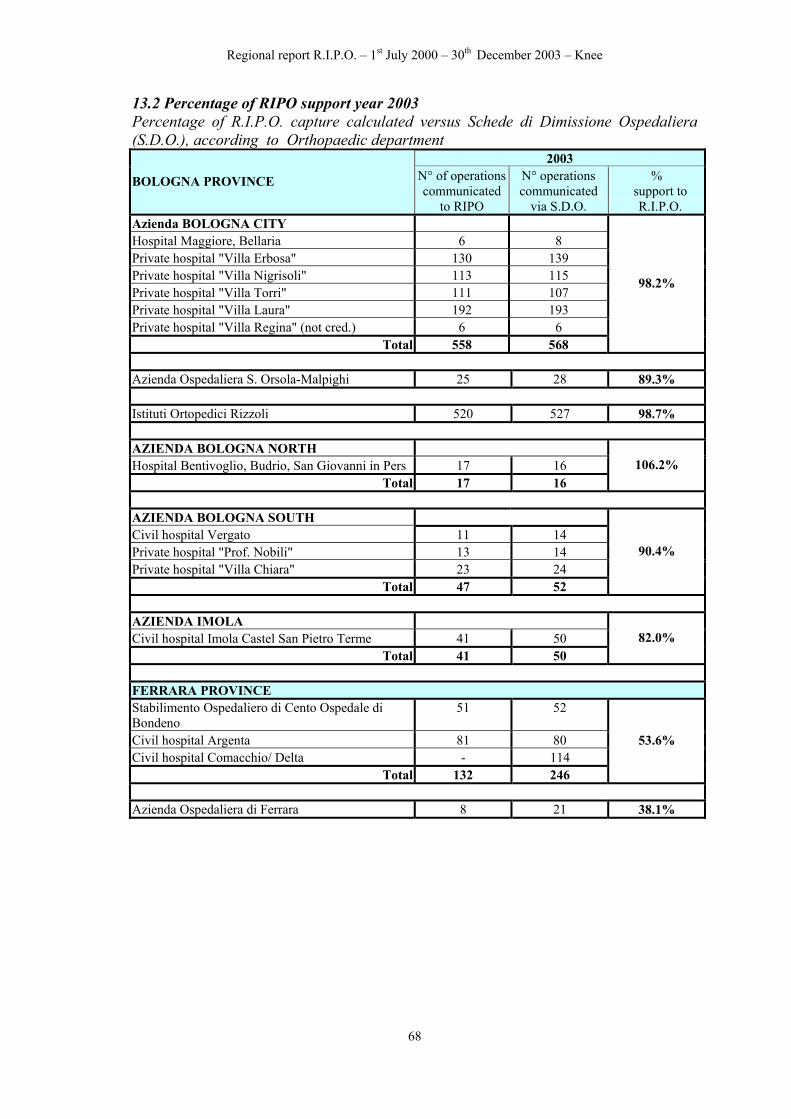
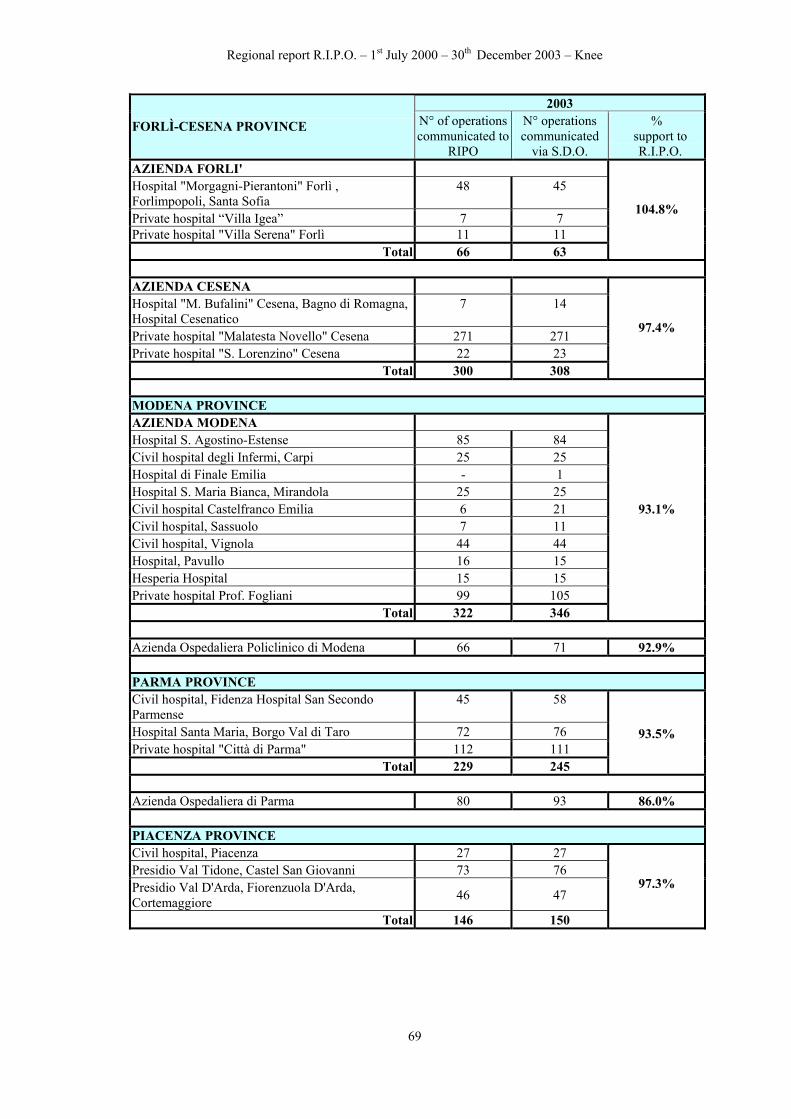
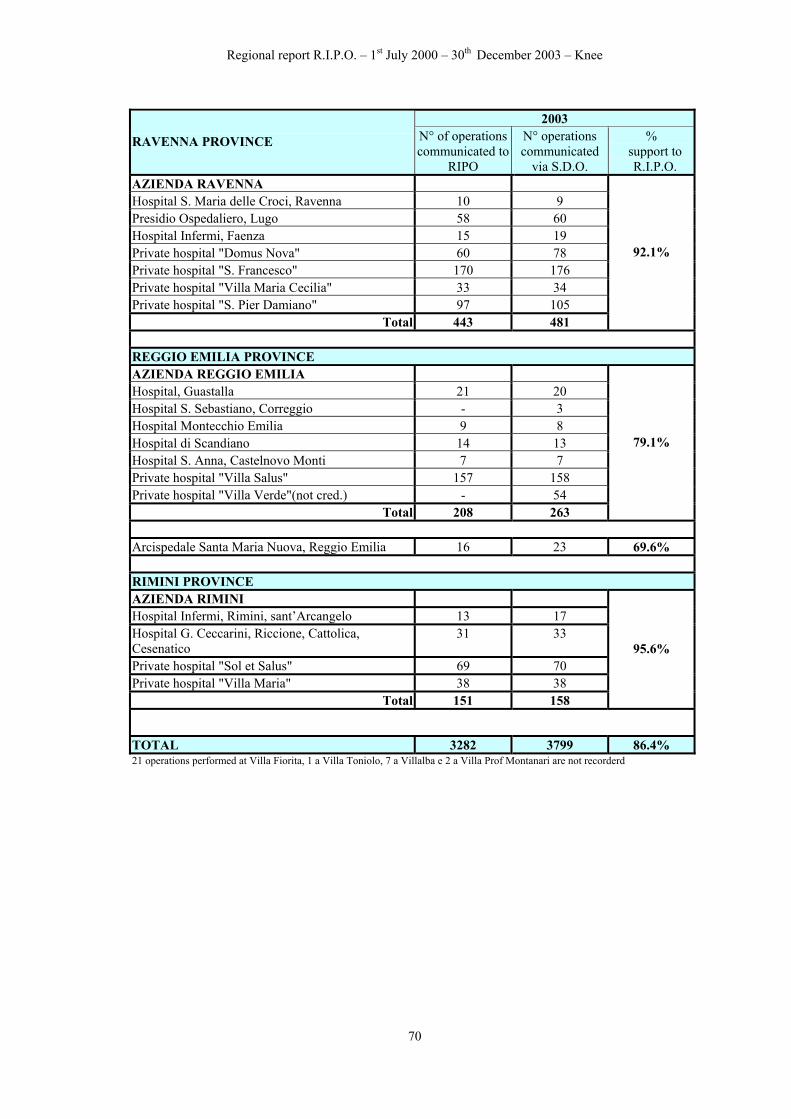
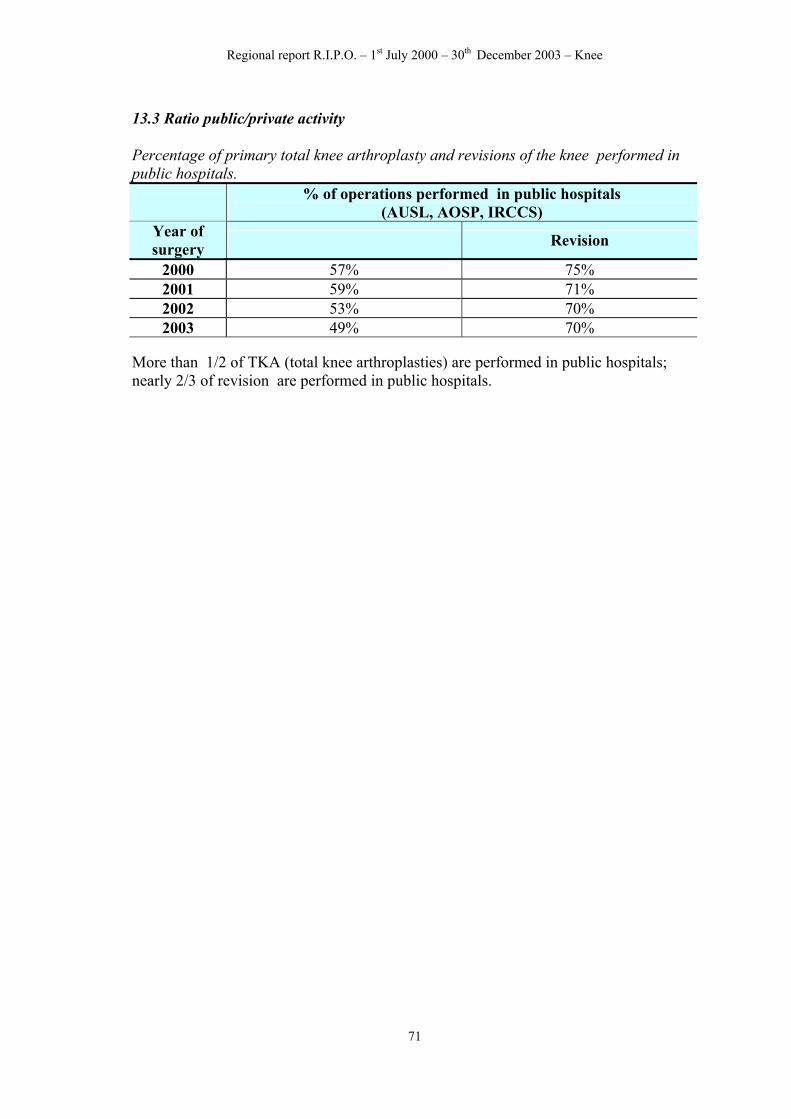
13.2 Percentage of RIPO support year 2003 Percentage of R.I.P.O. capture calculated versus Schede di Dimissione Ospedaliera (S.D.O.), according to Orthopaedic department
More than 1/2 of TKA (total knee arthroplasties) are performed in public hospitals; nearly 2/3 of revision are performed in public hospitals.
71
Regional report R.I.P.O. – 1st July 2000 – 30th December 2003 – Knee
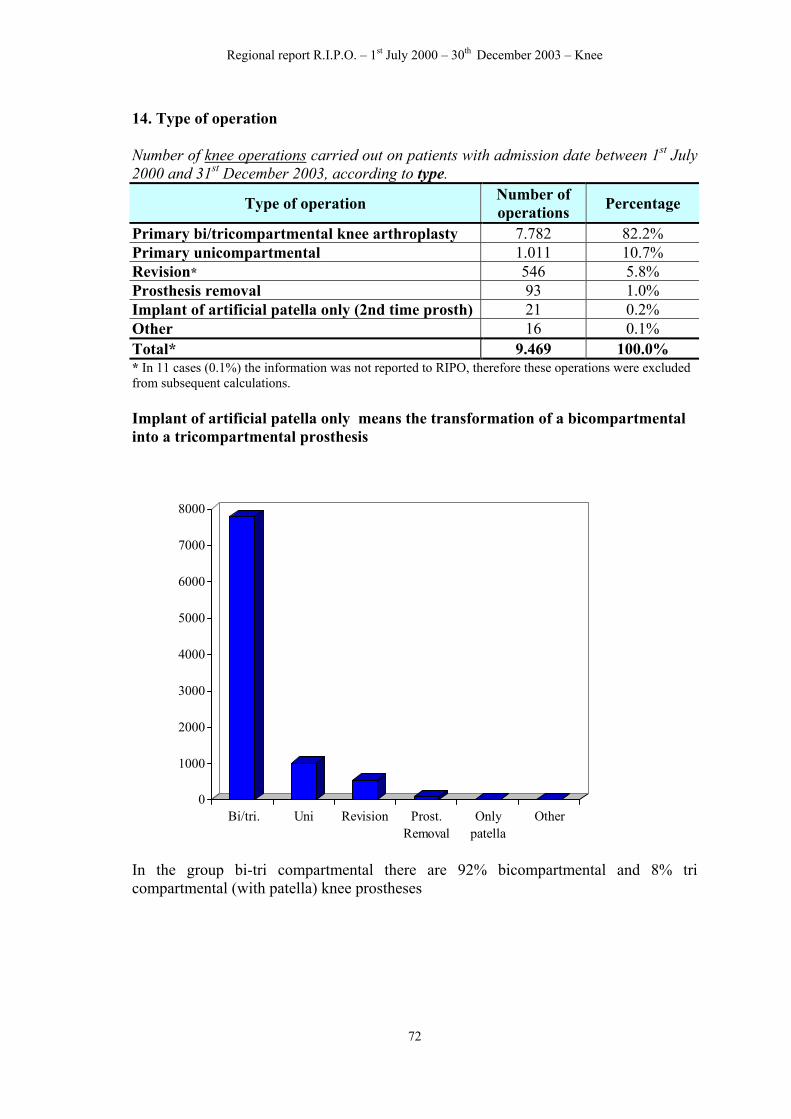
14. Type of operation Number of knee operations carried out on patients with admission date between 1st July 2000 and 31st December 2003, according to type.
Type of operation Number of operations Percentage
Primary bi/tricompartmental knee arthroplasty 7.782 82.2% Primary unicompartmental 1.011 10.7% Revision* 546 5.8% Prosthesis removal 93 1.0% Implant of artificial patella only (2nd time prosth) 21 0.2% Other 16 0.1% Total* 9.469 100.0% * In 11 cases (0.1%) the information was not reported to RIPO, therefore these operations were excluded from subsequent calculations.
Implant of artificial patella only means the transformation of a bicompartmental into a tricompartmental prosthesis
0
1000
2000
3000
4000
5000
6000
7000
8000
Bi/tri. Uni Revision Prost.Removal
Onlypatella
Other
In the group bi-tri compartmental there are 92% bicompartmental and 8% tri compartmental (with patella) knee prostheses
72
Regional report R.I.P.O. – 1st July 2000 – 30th December 2003 – Knee
15. Descriptive statistics of patients 15.1. Age Number of knee operations carried out on patients with admission date between 1st July 2000 and 31st December 2003, according to type of operation and age group of patients at the time of surgery.
<40 40-49 50-59 60-69 70-79 ≥80 Type of operation N. % N. % N. % N. % % N. %
* In 25 cases (0.26%) the data were not supplied to RIPO
0
500
1000
1500
2000
2500
3000
3500
4000
4500
<40 40-49 50-59 60-69 70-79 >80
Bi\tricomp. Unicomp.RevisionProsth removal
73
Regional report R.I.P.O. – 1st July 2000 – 30th December 2003 – Knee
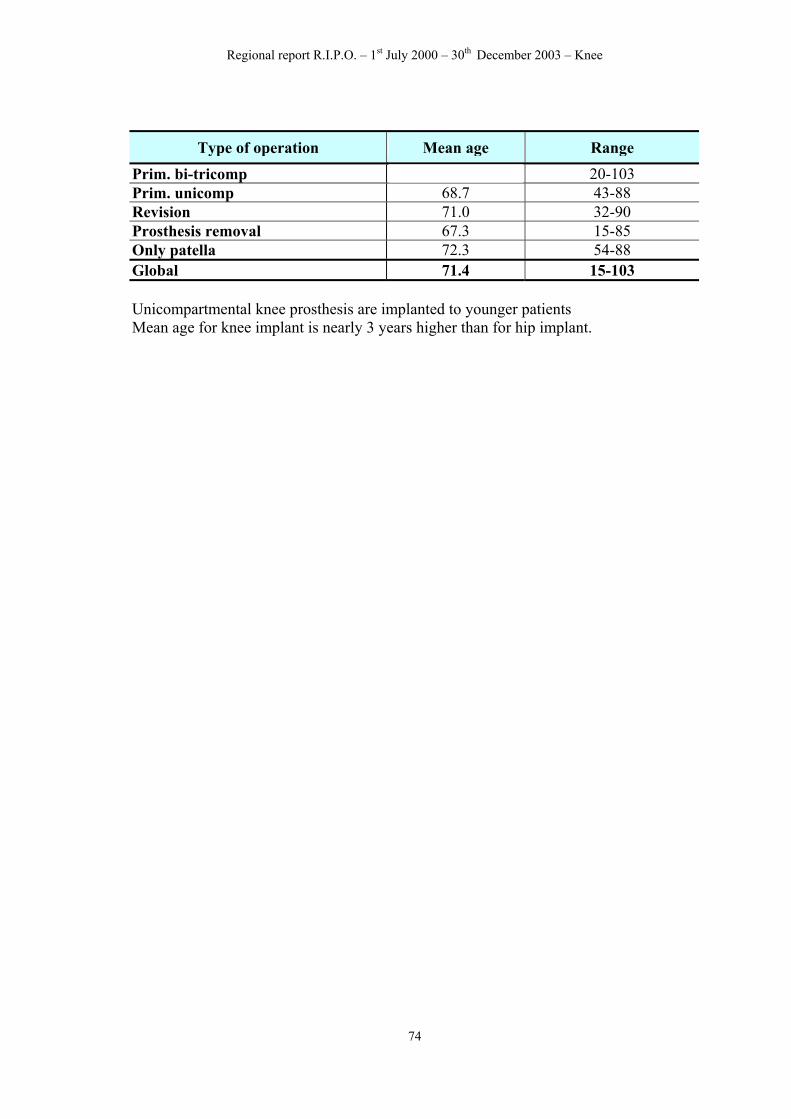
Type of operation Mean age Range 71.9 20-103
Prim. unicomp 68.7 43-88 Revision 71.0 32-90 Prosthesis removal 67.3 15-85 Only patella 72.3 54-88 Global 71.4 15-103
Prim. bi-tricomp
Unicompartmental knee prosthesis are implanted to younger patients Mean age for knee implant is nearly 3 years higher than for hip implant.
74
Regional report R.I.P.O. – 1st July 2000 – 30th December 2003 – Knee
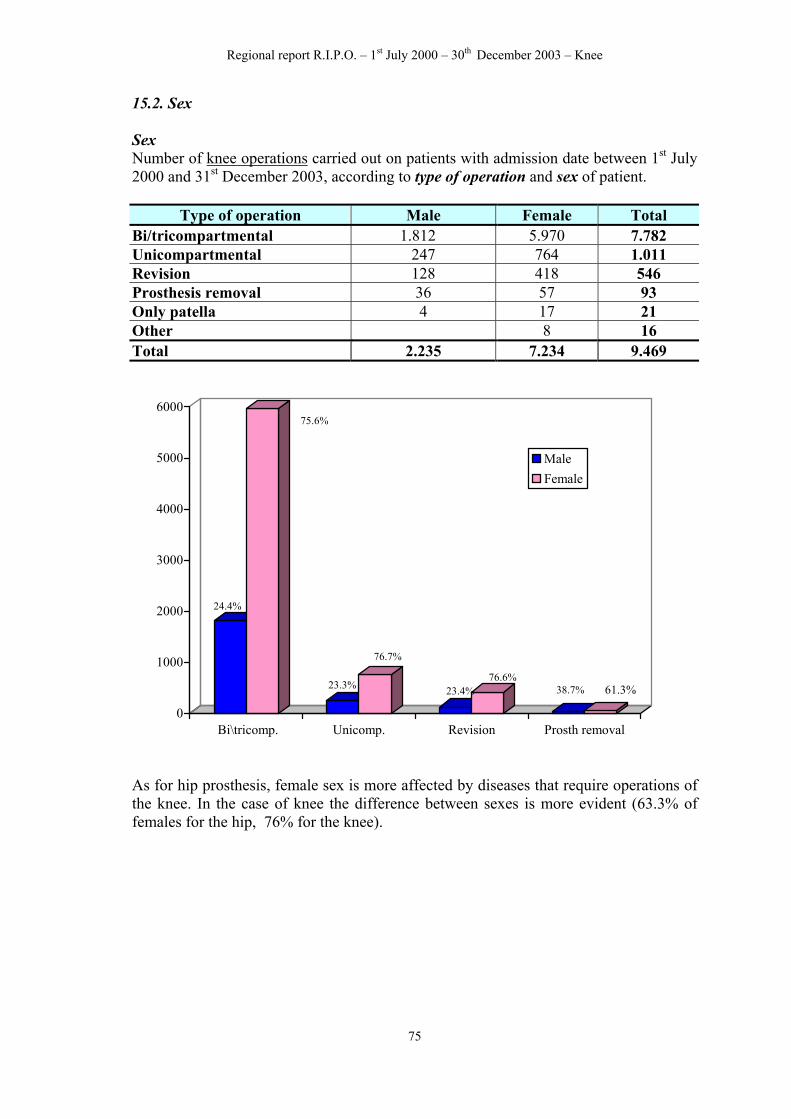
15.2. Sex Sex Number of knee operations carried out on patients with admission date between 1st July 2000 and 31st December 2003, according to type of operation and sex of patient.
Type of operation Male Female Total Bi/tricompartmental 1.812 5.970 7.782 Unicompartmental 247 764 1.011 Revision 128 418 Prosthesis removal 36 57 93 Only patella 4 17 21
8 8 16 Total 2.235 7.234 9.469
546
Other
24.4%
75.6%
23.3%
76.7%
23.4%76.6%
38.7% 61.3%
0
1000
2000
3000
4000
5000
6000
Bi\tricomp. Unicomp. Revision Prosth removal
MaleFemale
As for hip prosthesis, female sex is more affected by diseases that require operations of the knee. In the case of knee the difference between sexes is more evident (63.3% of females for the hip, 76% for the knee).
75
Regional report R.I.P.O. – 1st July 2000 – 30th December 2003 – Knee
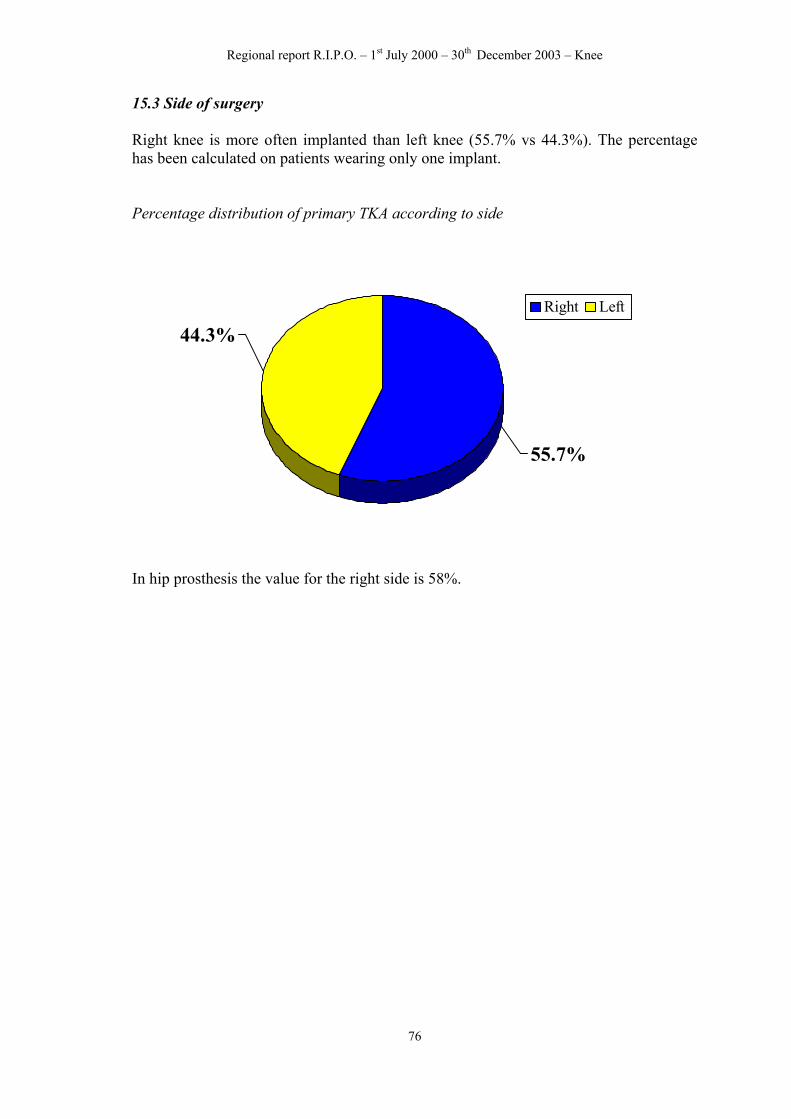
15.3 Side of surgery Right knee is more often implanted than left knee (55.7% vs 44.3%). The percentage has been calculated on patients wearing only one implant. Percentage distribution of primary TKA according to side
44.3%
55.7%
Right Left
In hip prosthesis the value for the right side is 58%.
76
Regional report R.I.P.O. – 1st July 2000 – 30th December 2003 – Knee
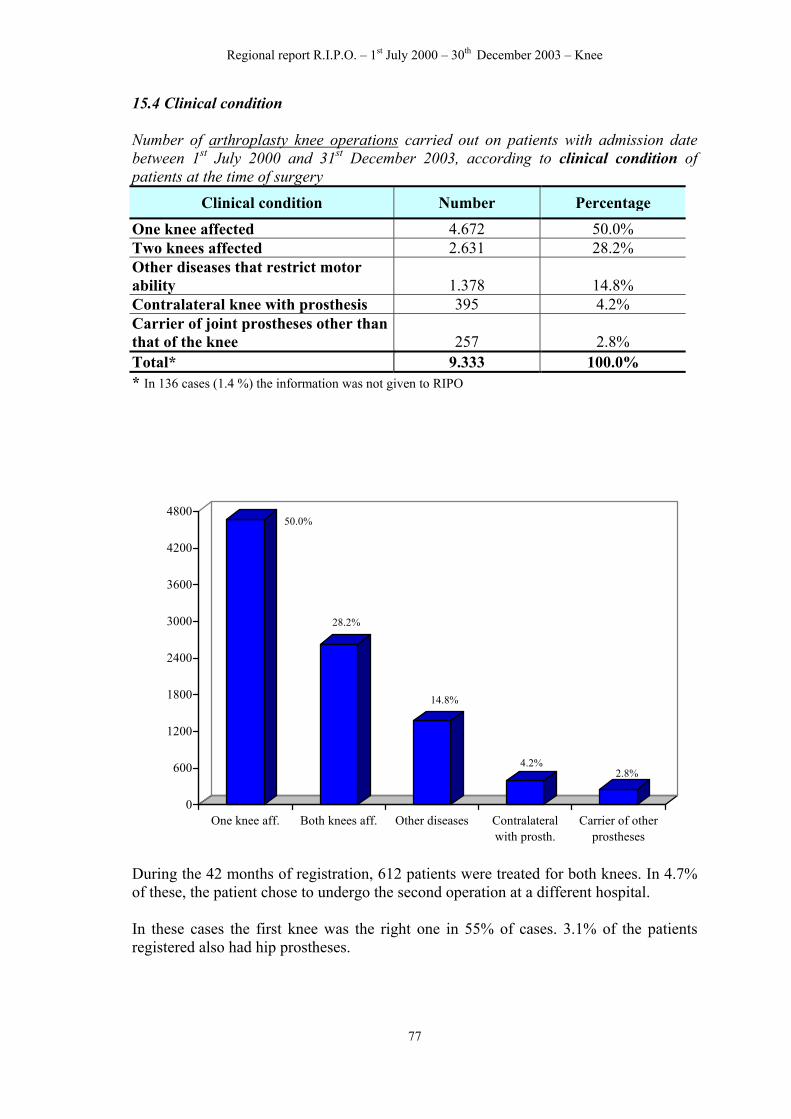
15.4 Clinical condition Number of arthroplasty knee operations carried out on patients with admission date between 1 3, according to clinical condition of patients at the time of surgery
st July 2000 and 31st December 200
Clinical condition Number Percentage
One knee affected 4.672 50.0% Two knees affected 2.631 28.2% Other diseases that restrict motor ability 1.378 14.8% Contralateral knee with prosthesis 395 4.2% Carrier of joint prostheses other than that of the knee 257 2.8% Total* 9.333 100.0% * In 136 cases (1.4 %) the information was not given to RIPO
50.0%
28.2%
14.8%
4.2%2.8%
0
600
1200
1800
2400
3000
3600
4200
4800
One knee aff. Both knees aff. Other diseases Contralateralwith prosth.
Carrier of otherprostheses
During the 42 months of registration, 612 patients were treated for both knees. In 4.7% of these, the patient chose to undergo the second operation at a different hospital. In these cases the first knee was the right one in 55% of cases. 3.1% of the patients registered also had hip prostheses.
77
Regional report R.I.P.O. – 1st July 2000 – 30th December 2003 – Knee
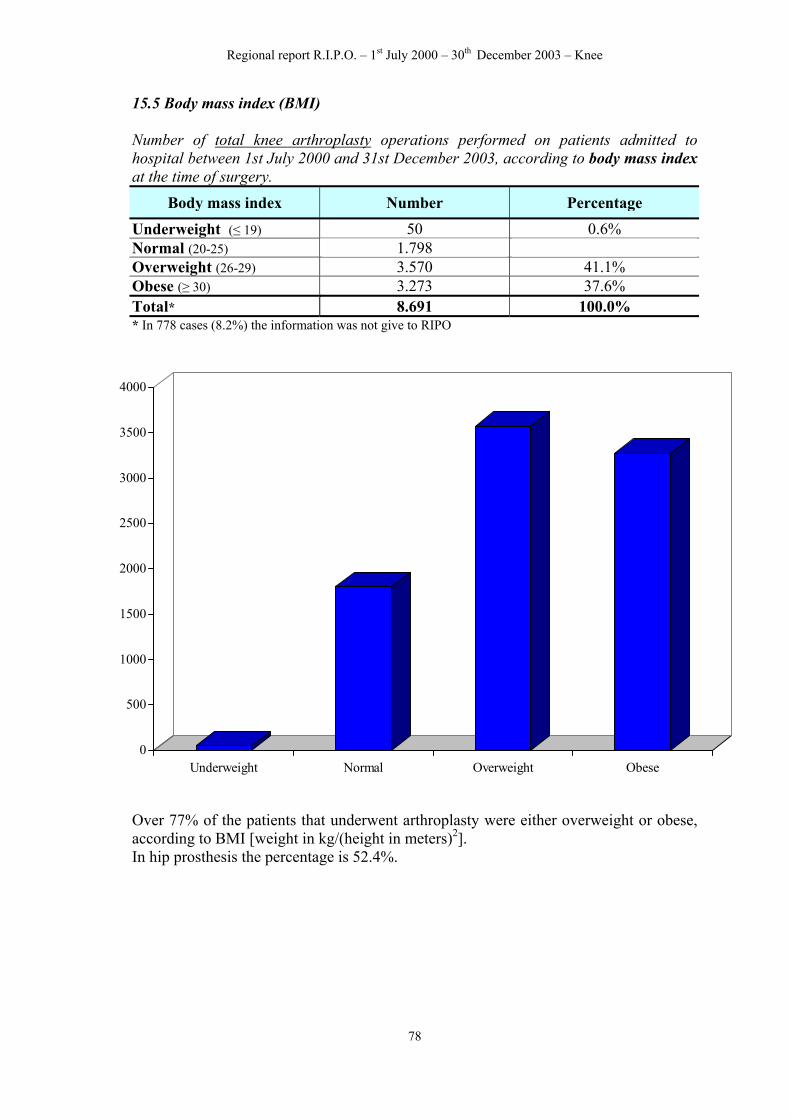
15.5 Body mass index (BMI) Number of total knee arthroplasty operations performed on patients admitted to hospital between 1st July 2000 and 31st December 2003, according to body mass index at the time of surgery.
* In 778 cases (8.2%) the information was not give to RIPO
0
500
1000
1500
2000
2500
3000
3500
4000
Underweight Normal Overweight Obese
Over 77% of the patients that underwent arthroplasty were either overweight or obese, according to BMI [weight in kg/(height in meters)2]. In hip prosthesis the percentage is 52.4%.
78
Regional report R.I.P.O. – 1st July 2000 – 30th December 2003 – Knee
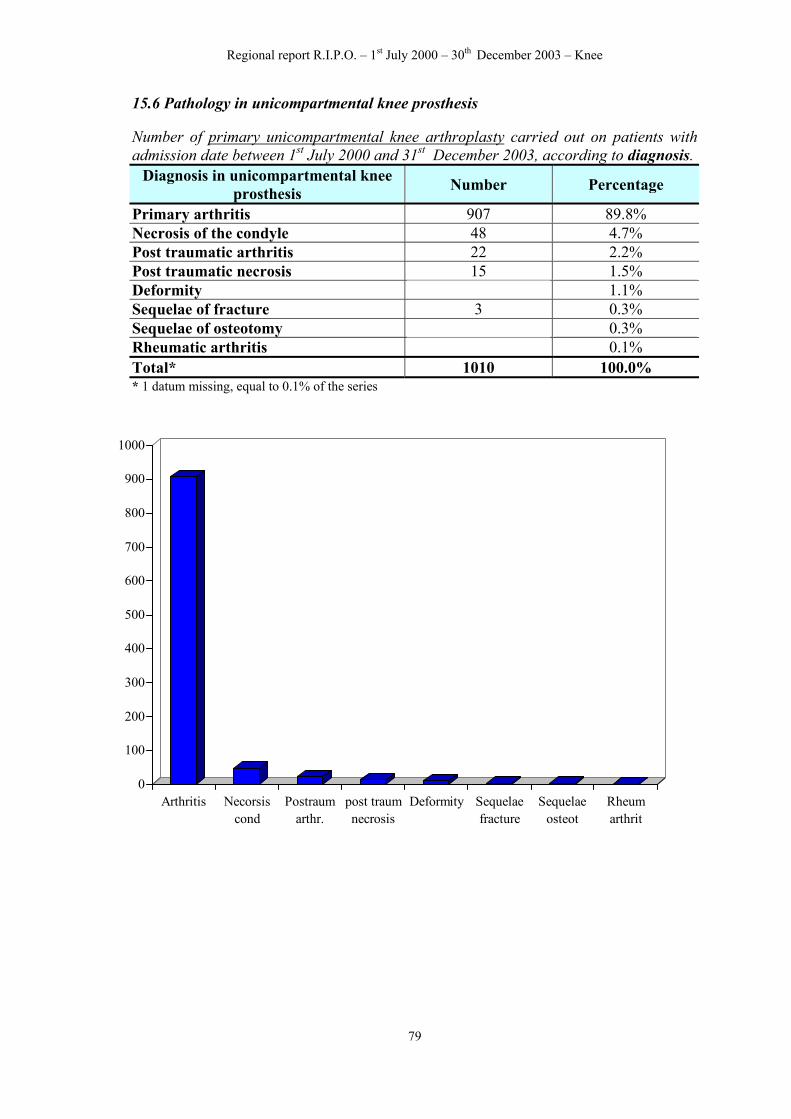
15.6 Pathology in unicompartmental knee prosthesis Number of primary unicompartmental knee arthroplasty carried out on patients with admission date between 1 to diagnosis. st July 2000 and 31st December 2003, according
Diagnosis in unicompartmental knee prosthesis Number Percentage
Primary arthritis 907 89.8% Necrosis of the condyle 48 4.7% Post traumatic arthritis 22 2.2% Post traumatic necrosis 15 1.5%
11 1.1% Sequelae of fracture 3
3 0.3% 1 0.1%
Total* 1010 100.0%
Deformity 0.3%
Sequelae of osteotomy Rheumatic arthritis
* 1 datum missing, equal to 0.1% of the series
0
100
200
300
400
500
600
700
800
900
1000
Arthritis Necorsiscond
Postraumarthr.
post traumnecrosis
Deformity Sequelaefracture
Sequelaeosteot
Rheumarthrit
79
Regional report R.I.P.O. – 1st July 2000 – 30th December 2003 – Knee
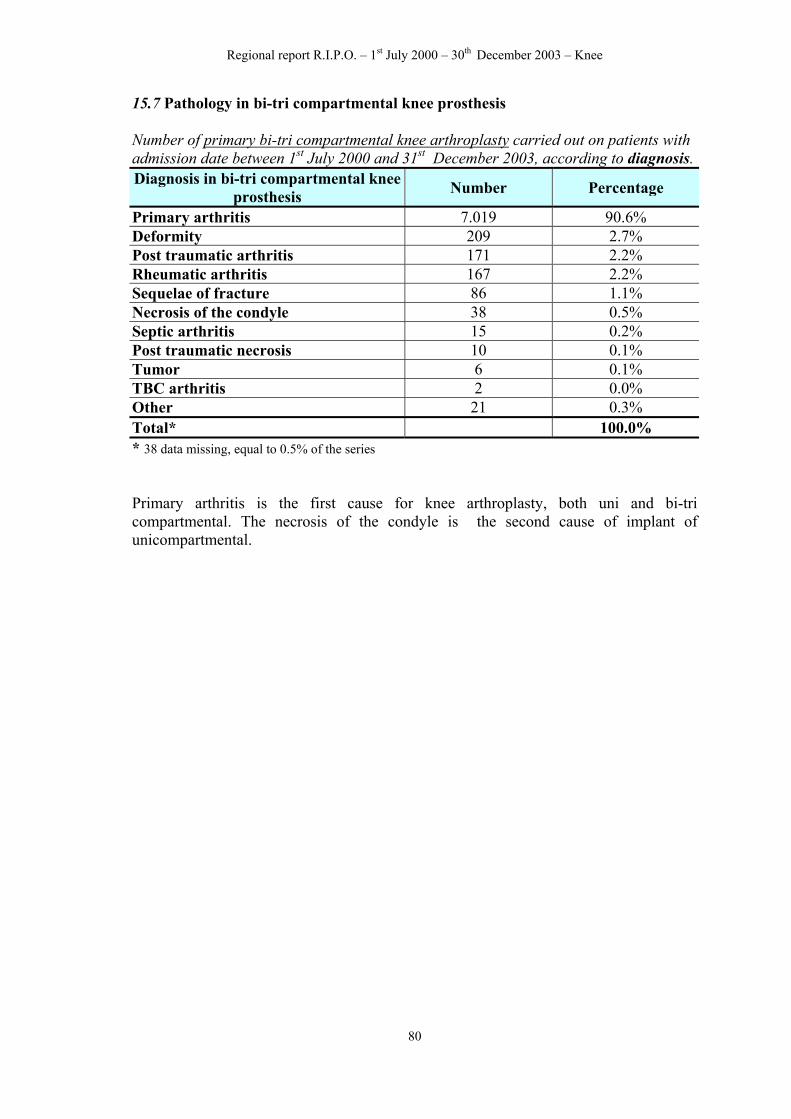
15.7 Pathology in bi-tri compartmental knee prosthesis Number of primary bi-tri compartmental knee arthroplasty carried out on patients with admission date between 1st July 2000 and 31st December 2003, according to diagnosis. Diagnosis in bi-tri compartmental knee
prosthesis Number Percentage
Primary arthritis 7.019 90.6% Deformity 209 2.7% Post traumatic arthritis 171 2.2% Rheumatic arthritis 167 2.2% Sequelae of fracture 86 Necrosis of the condyle 38 0.5% Septic arthritis 15 0.2% Post traumatic necrosis 10 0.1% Tumor 6 0.1% TBC arthritis 2 0.0% Other 21 0.3%
7.744 100.0%
1.1%
Total* * 38 data missing, equal to 0.5% of the series Primary arthritis is the first cause for knee arthroplasty, both uni and bi-tri compartmental. The necrosis of the condyle is the second cause of implant of unicompartmental.
80
Regional report R.I.P.O. – 1st July 2000 – 30th December 2003 – Knee
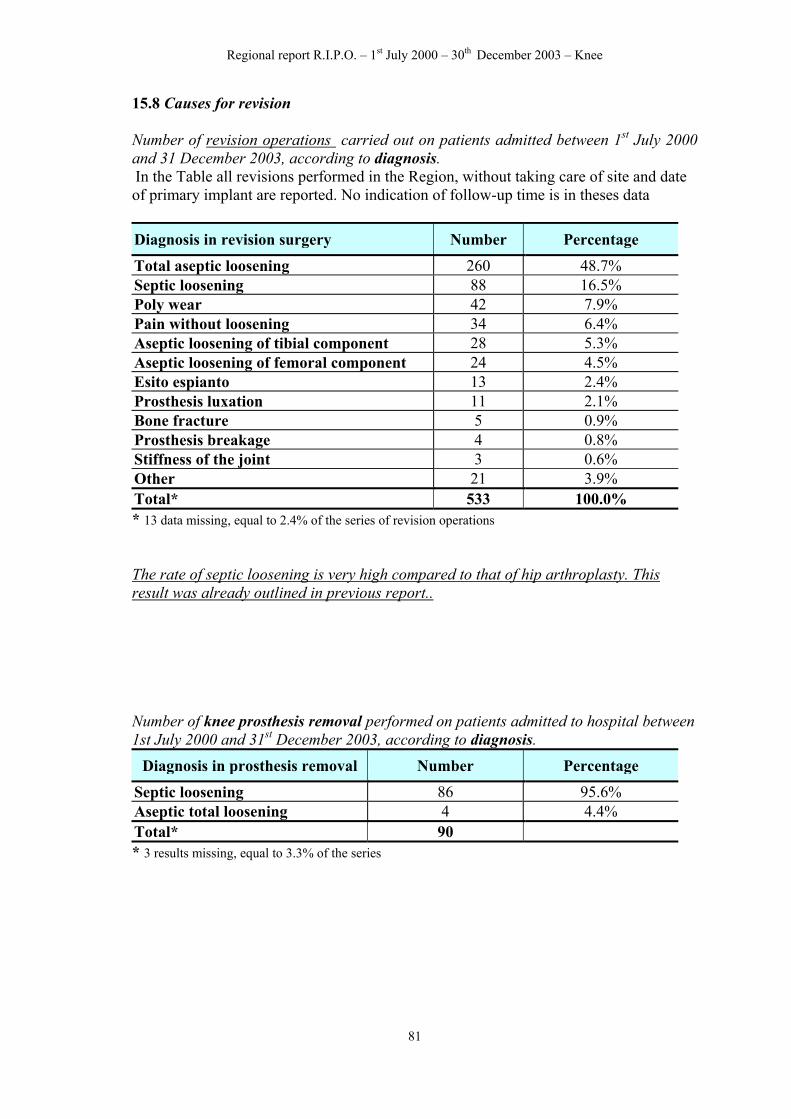
15.8 Causes for revision Number of revision operations carried out on patients admitted between 1st July 2000 and 31 December 2003, according to diagnosis. In the Table all revisions performed in the Region, without taking care of site and date of primary implant are reported. No indication of follow-up time is in theses data
Diagnosis in revision surgery Number Percentage
Total aseptic loosening 260 48.7% Septic loosening 88 16.5% Poly wear 42 7.9% Pain without loosening 34 6.4% Aseptic loosening of tibial component 28 5.3% Aseptic loosening of femoral component 24 4.5% Esito espianto 13 2.4% Prosthesis luxation 11 2.1% Bone fracture 5 0.9% Prosthesis breakage 4 0.8% Stiffness of the joint 3 0.6% Other 21 3.9% Total* 533 100.0% * 13 data missing, equal to 2.4% of the series of revision operations The rate of septic loosening is very high compared to that of hip arthroplasty. This result was already outlined in previous report.. Number of knee prosthesis removal performed on patients admitted to hospital between 1st July 2000 and 31st December 2003, according to diagnosis.
Diagnosis in prosthesis removal Number Percentage
Septic loosening 86 95.6% Aseptic total loosening 4 4.4% Total* 100.0% 90 * 3 results missing, equal to 3.3% of the series
81
Regional report R.I.P.O. – 1st July 2000 – 30th December 2003 – Knee
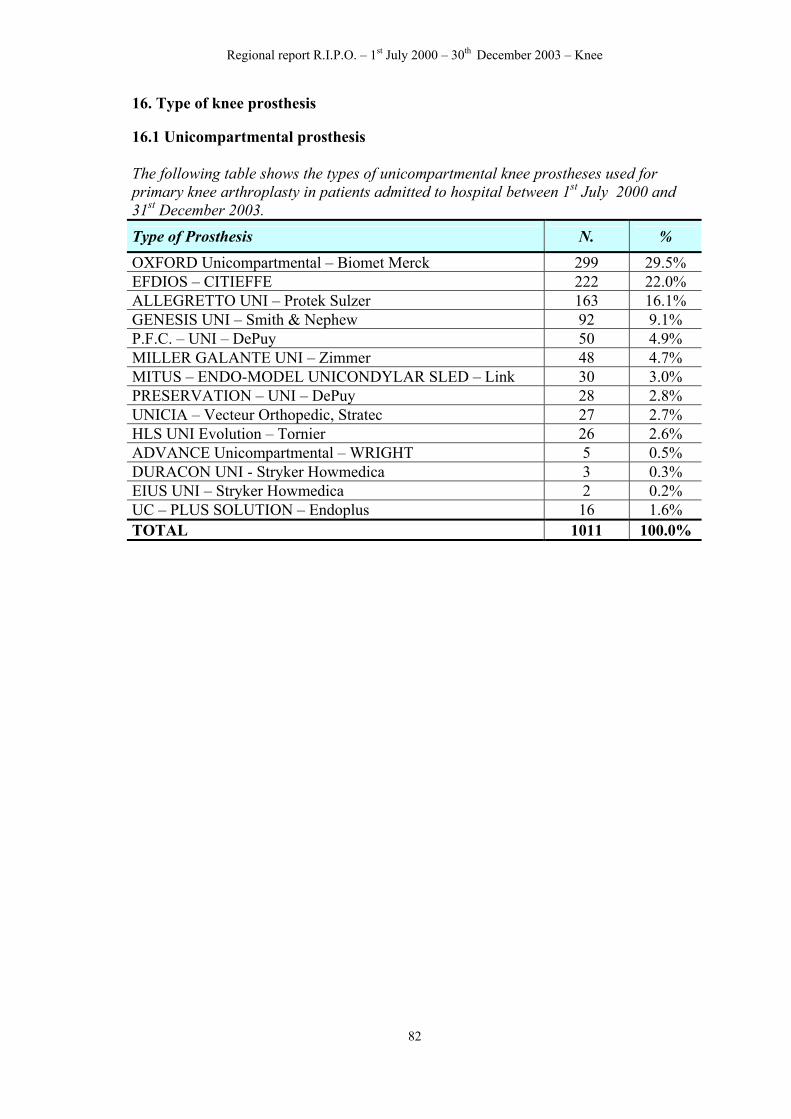
16. Type of knee prosthesis 16.1 Unicompartmental prosthesis The following table shows the types of unicompartmental knee prostheses used for primary knee arthroplasty in patients admitted to hospital between 1st July 2000 and 31st December 2003.
Type of Prosthesis N. % OXFORD Unicompartmental – Biomet Merck 299 29.5% EFDIOS – CITIEFFE 222 22.0% ALLEGRETTO UNI – Protek Sulzer 163 16.1% GENESIS UNI – Smith & Nephew 92 9.1% P.F.C. – UNI – DePuy 50 4.9% MILLER GALANTE UNI – Zimmer 48 4.7% MITUS – ENDO-MODEL UNICONDYLAR SLED – Link 30 3.0% PRESERVATION – UNI – DePuy 28 2.8% UNICIA – Vecteur Orthopedic, Stratec 27 2.7% HLS UNI Evolution – Tornier 26 2.6% ADVANCE Unicompartmental – WRIGHT 5 0.5% DURACON UNI - Stryker Howmedica 3 0.3% EIUS UNI – Stryker Howmedica 2 0.2% UC – PLUS SOLUTION – Endoplus 16 1.6% TOTAL 1011 100.0%
82
Regional report R.I.P.O. – 1st July 2000 – 30th December 2003 – Knee
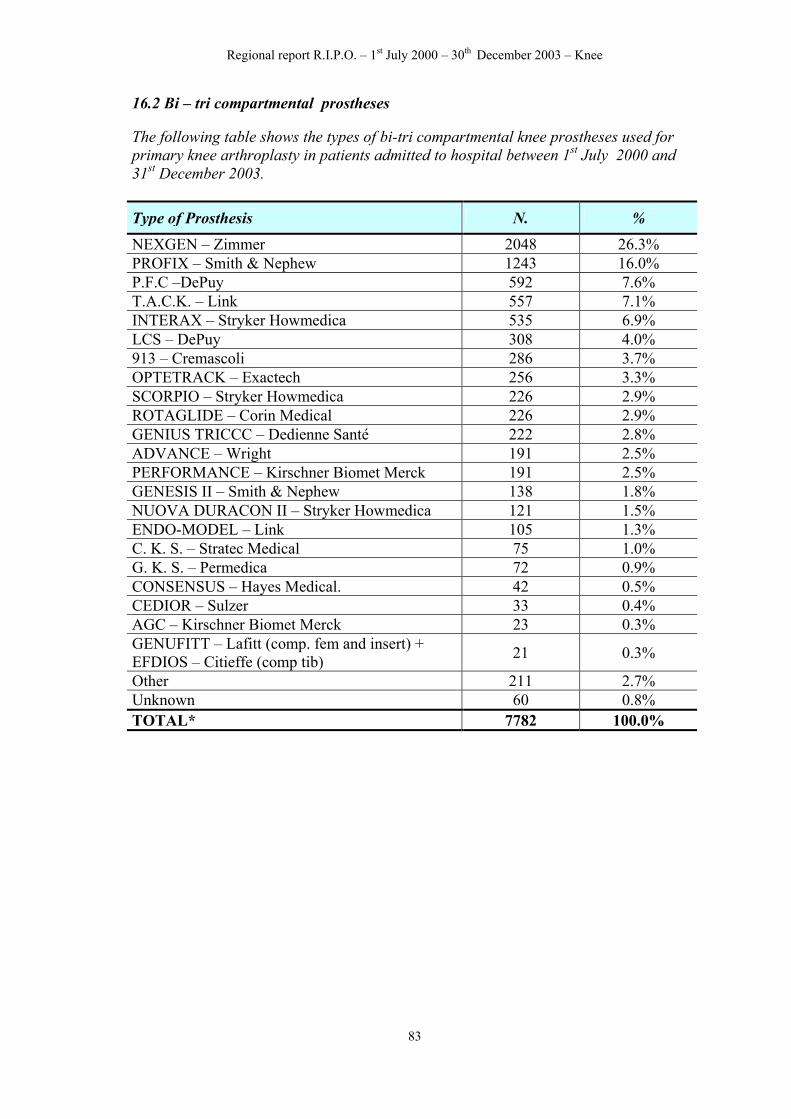
16.2 Bi – tri compartmental prostheses The following table shows the types of bi-tri compartmental knee prostheses used for primary knee arthroplasty in patients admitted to hospital between 1st July 2000 and 31st December 2003.
Type of Prosthesis N. %
NEXGEN – Zimmer 2048 26.3% PROFIX – Smith & Nephew 1243 16.0% P.F.C –DePuy 592 7.6% T.A.C.K. – Link 557 7.1% INTERAX – Stryker Howmedica 535 6.9% LCS – DePuy 308 4.0% 913 – Cremascoli 286 3.7% OPTETRACK – Exactech 256 3.3% SCORPIO – Stryker Howmedica 226 2.9% ROTAGLIDE – Corin Medical 226 2.9% GENIUS TRICCC – Dedienne Santé 222 2.8% ADVANCE – Wright 191 2.5% PERFORMANCE – Kirschner Biomet Merck 191 2.5% GENESIS II – Smith & Nephew 138 1.8% NUOVA DURACON II – Stryker Howmedica 121 1.5% ENDO-MODEL – Link 105 1.3% C. K. S. – Stratec Medical 75 1.0%
Regional report R.I.P.O. – 1st July 2000 – 30th December 2003 – Knee
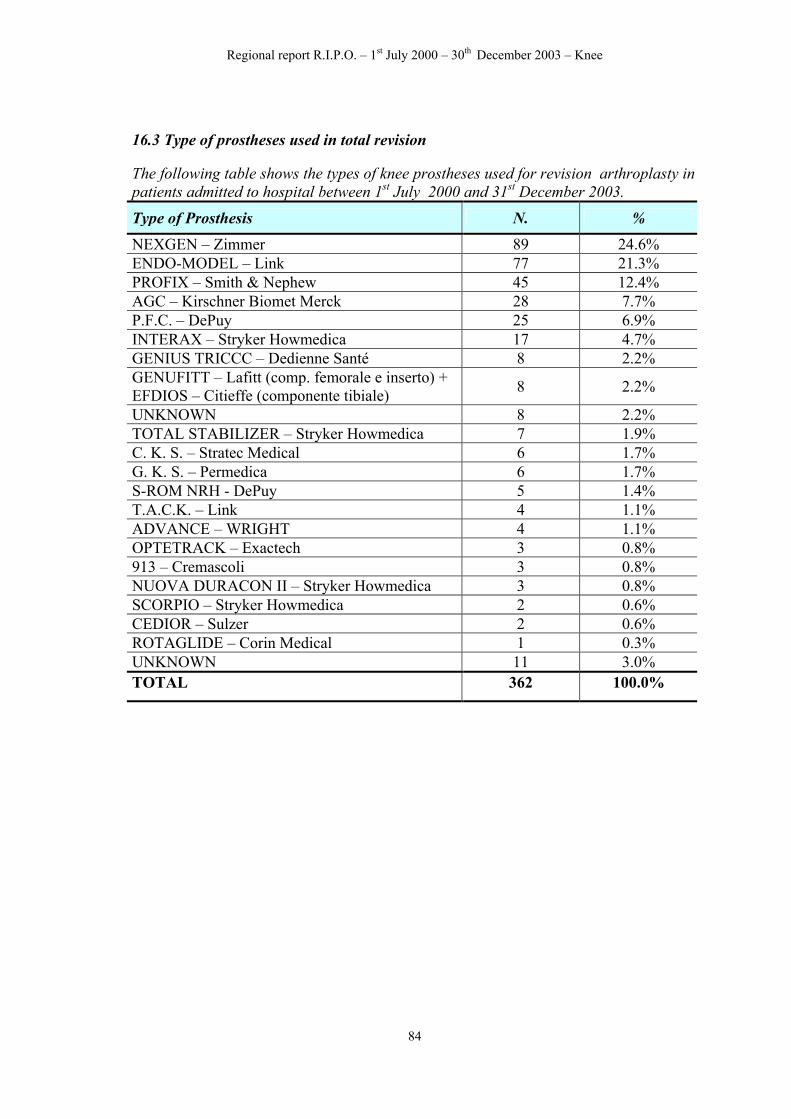
16.3 Type of prostheses used in total revision The following table shows the types of knee prostheses used for revision arthroplasty in patients admitted to hospital between 1st July 2000 and 31st December 2003.
UNKNOWN 8 2.2% TOTAL STABILIZER – Stryker Howmedica 7 1.9% C. K. S. – Stratec Medical 6 1.7% G. K. S. – Permedica 6 1.7% S-ROM NRH - DePuy 5 1.4% T.A.C.K. – Link 4 1.1% ADVANCE – WRIGHT 4 1.1% OPTETRACK – Exactech 3 0.8% 913 – Cremascoli 3 0.8% NUOVA DURACON II – Stryker Howmedica 3 0.8% SCORPIO – Stryker Howmedica 2 0.6% CEDIOR – Sulzer 2 0.6% ROTAGLIDE – Corin Medical 1 0.3% UNKNOWN 11 3.0% TOTAL 362 100.0%
84
Regional report R.I.P.O. – 1st July 2000 – 30th December 2003 – Knee
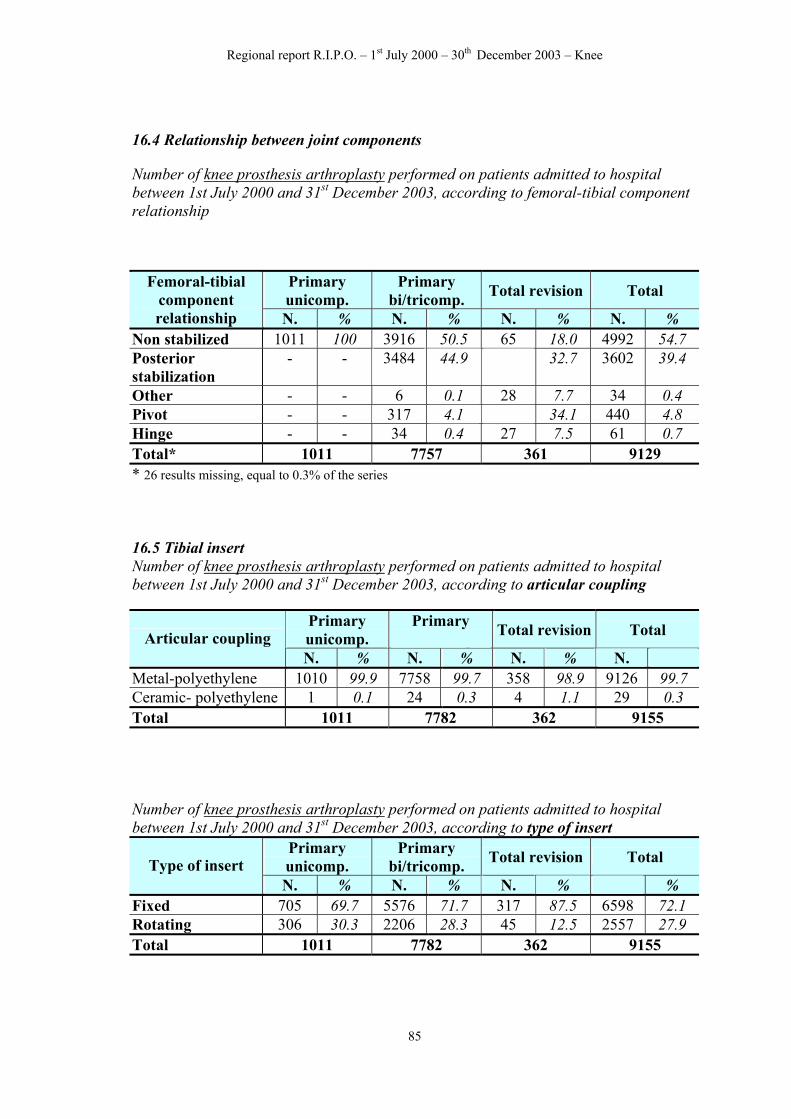
16.4 Relationship between joint components
Number of knee prosthesis arthroplasty performed on patients admitted to hospital between 1st July 2000 and 31st December 2003, according to femoral-tibial component relationship
Primary unicomp.
Primary bi/tricomp. Total revision Total Femoral-tibial
9129 * 26 results missing, equal to 0.3% of the series 16.5 Tibial insert Number of knee prosthesis arthroplasty performed on patients admitted to hospital between 1st July 2000 and 31st December 2003, according to articular coupling
Primary unicomp. bi/tricomp. Total revision Total Articular coupling N. % N. % N. % %
Number of knee prosthesis arthroplasty performed on patients admitted to hospital between 1st July 2000 and 31st December 2003, according to type of insert
Primary unicomp.
Primary bi/tricomp. Total revision Total Type of insert
N. % N. % N. N. % Fixed 705 69.7 5576 71.7 317 87.5 6598 72.1 Rotating 306 30.3 2206 28.3 45 12.5 2557 27.9 Total 1011 7782 362 9155
%
85
Regional report R.I.P.O. – 1st July 2000 – 30th December 2003 – Knee
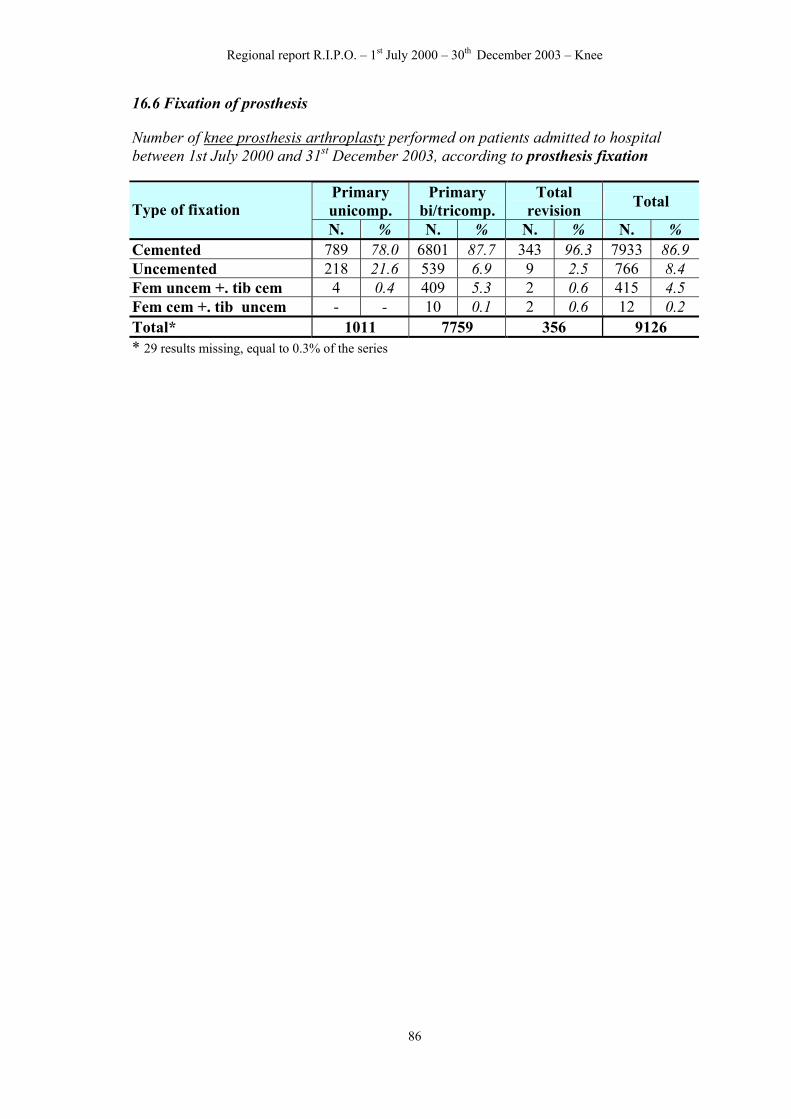
16.6 Fixation of prosthesis
Number of knee prosthesis arthroplasty performed on patients admitted to hospital between 1st July 2000 and 31st December 2003, according to prosthesis fixation
Primary unicomp.
Primary bi/tricomp.
Total revision Total Type of fixation
N. % N. % N. % N. % Cemented 789 78.0 6801 87.7 343 96.3 7933 86.9 Uncemented 218 21.6 539 6.9 9 2.5 766 8.4 Fem uncem +. tib cem 4 0.4 409 5.3 2 0.6 415 4.5 Fem cem +. tib uncem - - 10 0.1 2 0.6 12 0.2 Total* 1011 7759 356 9126 * 29 results missing, equal to 0.3% of the series
86
Regional report R.I.P.O. – 1st July 2000 – 30th December 2003 – Knee
Fixation of femoral component Number of knee prosthesis arthroplasty performed on patients admitted to hospital between 1st July 2000 and 31st December 2003, according to femoral component fixation
Primary unicomp.
Primary bi/tricomp. Total revision Total Fixation of femoral
component N. % N. % N. % N. % Cemented 788 77.9 6215 78 21.6 7081 77.6 Cemented with endomedullary stem
1 0.1 518 6.8 270 74.8 789 8.7
Uncem. without screws 222 22.0 934 12.0 11 3.0 1167 12.8 Uncemented with endomed stem
Fixation of tibial component Number of knee prosthesis arthroplasty performed on patients admitted to hospital between 1st July 2000 and 31st December 2003, according to tibial component fixation
Primary unicomp.
Primary bi/tricomp. Total revision Total Fixation of tibial
Regional report R.I.P.O. – 1st July 2000 – 30th December 2003 – Knee
16.7 Bone cement
Bone cement used for fixation of knee prosthesis is Surgical Simplex P in 52.0% of cases.
Bone cement loaded with antibiotic is used in 11.0% of cases.
16.8 Surgical technique
The most commonly used surgical approach is the antero-medial (95.4%) regardless of type of operation
Use of bone grafts Number of knee prosthesis arthroplasty performed on patients admitted to hospital between 1st July 2000 and 31st December 2003, according to type of operation and use of bone grafts
Primary unicomp.
Primary bi/tricomp. Total revision Total Bone grafts
N. % N. % N. % N. % Not used 1010 99.9 7742 349 96.4 9101 99.4 Femoral - 28 0.4 2 0.6 30 0.3 Tibial and femoral 1 0.1 1 0.0 3 0.8 5 0.1 Femoral - 11 0.1 8 19 0.2 Total 1011 7782 362 9155
99.5
2.2
Use of augmentation blocks
Number of knee prosthesis arthroplasty performed on patients admitted to hospital between 1st July 2000 and 31st December 2003, according to use of augmentation blocks
Primary bi/tricomp. Total revision Total
N. % N. % N. % N. % Non used 991 100 7712 99.1 221 61.0 8924 Tibial - - 50 0.7 43 11.9 93 1.0 Tibial and femoral - - 10 0.1 61 16.9 71 0.8 Femoral - - 8 0.1 37 10.2 45 0.5 Total* 991 7780 362 9133
Primary unicomp. Augmentation
blocks
97.7
*22 results missing, equal to 0.24% of the series
88
Regional report R.I.P.O. – 1st July 2000 – 30th December 2003 – Knee
Surgery of patella (non- prosthetic) Number of surgery on patella performed on patients admitted to hospital between 1st July 2000 and 31st December 2003, during prosthetization of the knee
Patella-plasty 1731 18.3% 1248 13.2%
Both 588 6.2% Total 9469 100.0%
Denervation of patella
Type of surgery of patella Number Percentage
None 5902 62.3%
0
1000
2000
3000
4000
5000
6000
None Denervation Plasty Both
89
Regional report R.I.P.O. – 1st July 2000 – 30th December 2003 – Knee
17. Antibiotic prophylaxis List of active principles used in preoperative antibiotic prophylaxis in cases of knee arthroplasty.(data registered since 30/09/01)
Active principle Percentage
AMPICILLIN 9.2% AMPICILLIN + GENTAMICIN 4.0% CEFAMANDOL 0.5% CEFAMANDOL + GENTAMICIN 0.3% CEFAZOLINE 18.0% CEFAZOLINE + GENTAMICIN 2.1% CEFAZOLINE + TOBRAMICIN 4.3% CEFEPIME 6.1% CEFOTAXIME 6.3% CEFOTAXIME + LEVOFLOXACINA 3.3% CEFTIZOXIMA 0.8% CEFTRIAXONE 5.6% CEFTRIAXONE + GENTAMICIN 1.4% CEFUROXIM 9.7% CIPROFLOXACINE 1.4% GENTAMICIN 0.4% TEICOPLANIN 3.3% TEICOPLANIN + NETILMICIN 1.7% VANCOMICIN 2.3% VANCOMICIN + GENTAMICIN 10.5% Other 8.8% TOTAL 100.0% Active principles used for the prophylaxis are the same as for hip, even if in different percentage.
90
Regional report R.I.P.O. – 1st July 2000 – 30th December 2003 – Knee
Way of administration
Administration N. % Single administrations 1.496 15.8% Multiple administrations 7.973 84.2% Total 9.469 100.0%
18. Blood transfusion RIPO started to collect this data only in 30/09/2002; therefore they cannot be analyzed 19. Complications and deaths occurred during hospitalization. Rate of complications in knee prosthetic surgery carried out on patients hospitalized between July 1st 2000 and December 31st 2003.
Types of complication N. % complications/ operations
Post-operative general (anemia, fever, respiratory) 76 0.8%
Post-operative local (hematoma,TVP, prosthesis luxation) 33 0.3%
Intra-operative (fem fracture, tibial fracture, lesion of tendon or ligament)
11 0.1%
Total 120 1.3% Only 3 deaths occurred during hospitalization, following bicompartmental prosthesis (0.04%).
91
Regional report R.I.P.O. – 1st July 2000 – 30th December 2003 – Knee
20. Hospitalization time
Mean hospitalization Range Mean pre-op
hospitalizationRange pre-op hospitalization
Mean post-op hospitalization
Range post-op hospit.
Primary Bi/tricom.
12.6 1-99 1.8 0-40 10.9 0-96
Prosth removal
15.7 0-73 4 0-15 11.6 0-67
Primary unicomp.
10.1 2-50 2.2 0-35 8.3 0-47
Revision 15.6 3-84 3.1 0-63 12.4 1-68 Global 12.6 0-99 1.9 0-63 10.7 0-96 Postoperative hospitalization of 0 days occurred when a patient was transferred to another ward (intensive care). Total hospitalization equal to 3 days occurred when surgery was carried out on patients admitted to non-orthopedic wards, who after surgery continued their stay in the ward of origin. No noteworthy variations were observed compared to last year. Hospitalization time is similar to the one observed for the hip.
92
Regional report R.I.P.O. – 1st July 2000 – 30th December 2003 – Knee
21. Analysis of survival of knee prosyhesis The survival curves, calculated by the actuarial method can be constructed with respect to main factors connected to the patient (sex, age, bodyweight, disease), implants (fixation, joint coupling) and most common commercial model used. In this phase of the study we were able to construct global survival curves, determine failure rates separately uni and bicompartmental prosthesis in relationship to the main factors concerning the patient (sex, age), and the implants (type of insert). The following table shows the number of primary joint arthroplasty operations performed in the period from July 2000 to December 2003 in the first column, the second and third columns show the number of revision operations performed on the same patients. Some revision operations were performed in the same hospital as the primary operation while others were performed at other hospitals in the Emilia-Romagna Region. Number of
Total revision 362 11 1 3.3% Total 9155 90 20 1.2% In 19.4% of the primary total prostheses that are replaced, the patient undergoes revision surgery in a different hospital from the one where the primary operation was performed
93
Regional report R.I.P.O. – 1st July 2000 – 30th December 2003 – Knee
21.1 Survival analysis of bi-tri and unicompartmental prostheses Number of
operations N. of revisions % revision
Primary bi\tricomp 7782 78 1.0%
Primary unicomp. 1011 20 2.0%
Survival curve
95,0
95,5
96,0
96,5
97,0
97,5
98,0
98,5
99,0
99,5
100,0
0 1 2 3 4
Years
%
The two curves are statistically different (Log Rank test) Results in detail
Years % in site c.i. at 95%0 100.00 100.00 1 98.68 97.92 2 96.99 95.60 3 96.45 94.71 4 96.45 94.71
% in site
94
Bicomp.
.
Unicomp
tal
100.00 99.61 99.01 98.52 98.52
al
100.00 99.44 98.38 98.19 98.19
Regional report R.I.P.O. – 1st July 2000 – 30th December 2003 – Knee
The following tables show the rate of revision in bi-tri compartmental arthroplasty according to type of prosthesis and cause of revision: Pimary bi – tri compartmental operations
Cause of revision Rate Percentage % distribution of failure causes
The following table shows the rate of revision in bi-tri compartmental arthroplasty according to femoral-tibial component relationship: Femoral-tibial
component
relationship
Number of operations Removal Rate Percentage
Non stabilized 3916 38 38/3916 0.97% Posterior stabilized
3484 35 35/3484 1.0%
97
Regional report R.I.P.O. – 1st July 2000 – 30th December 2003 – Knee
21.2 Second time surgery for patella prothesization In 9 patients out of 7162 with bicompartmental knee prosthesis, a re-operation was necessary to substitute natural patella with an artificial one. Here are the details:
Primary bi-compartmental prosthesis Reason for patellar prosthetisation
Time before re-operation
Rotaglide - Corin medical Patellar pain 90 days
Genius Triccc – Dedienne Sante Patellar pain 97 days
Genius Triccc – Dedienne Sante ? 238 days
Genius Triccc – Dedienne Sante ? 277 days
Profix - Conforming - Smith & Nephew Patellar pain 1.0 years
Patellar pain 1.2 years
Patellar pain 1.2 years
Profix - Conforming - Smith & Nephew Patellar pain 1.8 years
Nexgen - CR - Zimmer Patellar pain 2.0 years
Multigen PS – Lima
Rotaglide - Corin Medical
These operations are not to be considered as implant failure; they are registered to quantify the two-stage surgery.