Page 1
OvercomingChildhoodObesity:
BarrierstotheImplementationofObesityPreventionPolicies
inElementarySchools
KomalPatel
UndergraduateHonorsThesis
SanfordSchoolofPublicPolicy
DukeUniversity
Durham,NC
December2012
Advisor:ProfessorPhilipCook
Page 2
2
Abstract
ChildhoodobesityratesintheUnitedStateshavebeenincreasingatalarmingrates.Schools
mustplayanintegralroleinobesitypreventioneffortstoreversecurrenttrends.Inorder
to understand how schools can improve wellness policies, it is important to determine
what obstacles they face in implementing such policies and programs. Interviews with
stakeholders at the district‐ and school‐levels indicate four main barriers to the
implementation of wellness policies: finances, institutional support, participation, and
involvement and education at home. The study further concludes that physical activity
policies are weaker than nutrition policies. Schools are also found to have greater
discretionoverphysicalactivitypolicesthannutritionpolices.Thekeyrecommendationof
the study is that schools strengthen physical activity policies and programs in order to
improveobesitypreventionefforts.
Acknowledgements
Iwould like to thankProfessorPhilipCook forhis guidanceand support throughout the
researchprocess.Withouthismentorship anddedication, Iwouldhavenotbeenable to
produce this thesis. I would also like to give a heart‐felt thanks to Professor Kenneth
Rogerson for his enthusiasm, encouragement, and unwavering faith in my ability to
completethisprojectinmomentswhenmybackwasagainstthewall.
Page 3
3
TableofContents
I.Obesity:AGrowingConcern ......................................................................................................... 4
II.PolicyEnvironment........................................................................................................................ 7
FederalNutritionPolicies ............................................................................................................................7HistoricalBackgroundonFederalNutritionPolicies ......................................................................................7CurrentFederalNutritionPolicies...........................................................................................................................8
FederalPhysicalActivityPolicies ..............................................................................................................9NorthCarolinaNutritionPolicies ........................................................................................................... 10NorthCarolinaPhysicalActivityPolicies ............................................................................................. 10
III.ImpactofWellnessPoliciesonStudentHealthOutcomes ............................................12
IV.AdherencetoWellnessPolicies:LessonsfromthePast................................................13
V.CaseStudies:DurhamandOrangeCountyElementarySchools....................................17
DistrictWellnessPolicies .......................................................................................................................... 19DurhamCountyNutritionandPhysicalActivityPolicies ...........................................................................19OrangeCountyNutritionandPhysicalActivityPolicies .............................................................................21
InsightsfromStakeholderInterviews .................................................................................................. 22ImplementationofNutritionPolicies ..................................................................................................................23ImplementationofPhysicalActivityPolicies ...................................................................................................28
VI.Conclusions....................................................................................................................................41
BarrierstotheImplementationofObesityPreventionPolicies.................................................. 41OvercomingIdentifiedBarriers .............................................................................................................. 44LimitationsandFutureResearch ........................................................................................................... 47
Page 4
4
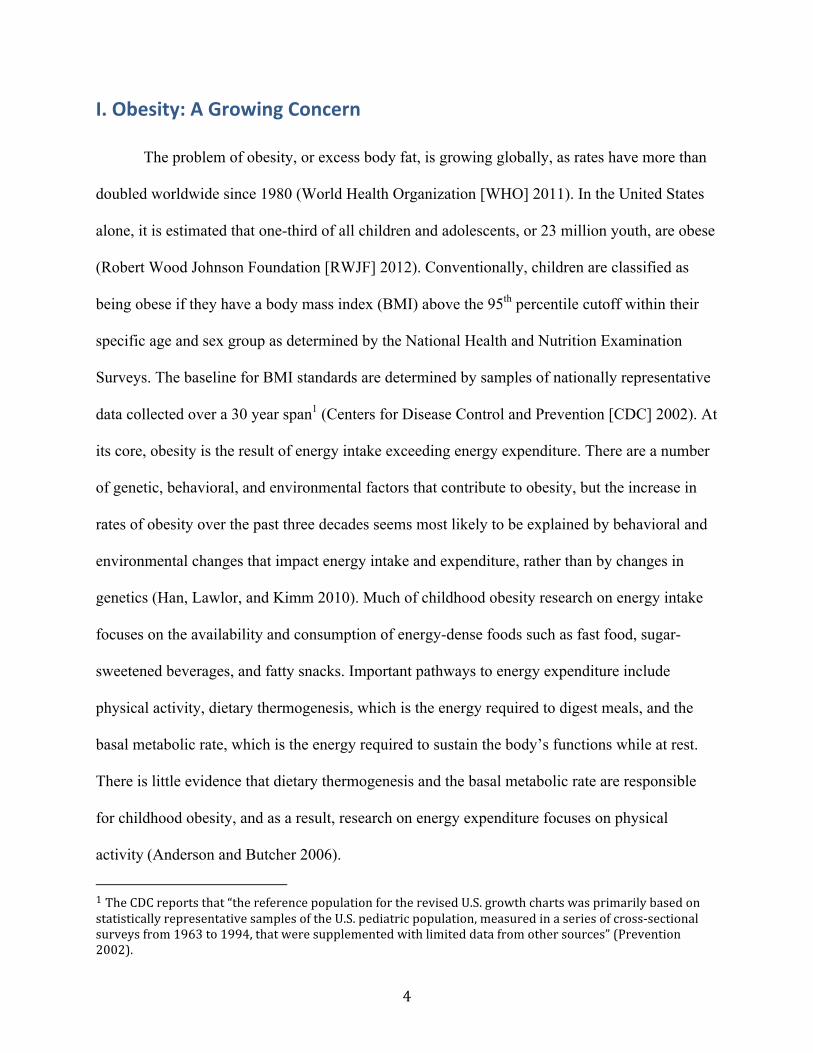
I.Obesity:AGrowingConcern
The problem of obesity, or excess body fat, is growing globally, as rates have more than
doubled worldwide since 1980 (World Health Organization [WHO] 2011). In the United States
alone, it is estimated that one-third of all children and adolescents, or 23 million youth, are obese
(Robert Wood Johnson Foundation [RWJF] 2012). Conventionally, children are classified as
being obese if they have a body mass index (BMI) above the 95th percentile cutoff within their
specific age and sex group as determined by the National Health and Nutrition Examination
Surveys. The baseline for BMI standards are determined by samples of nationally representative
data collected over a 30 year span1 (Centers for Disease Control and Prevention [CDC] 2002). At
its core, obesity is the result of energy intake exceeding energy expenditure. There are a number
of genetic, behavioral, and environmental factors that contribute to obesity, but the increase in
rates of obesity over the past three decades seems most likely to be explained by behavioral and
environmental changes that impact energy intake and expenditure, rather than by changes in
genetics (Han, Lawlor, and Kimm 2010). Much of childhood obesity research on energy intake
focuses on the availability and consumption of energy-dense foods such as fast food, sugar-
sweetened beverages, and fatty snacks. Important pathways to energy expenditure include
physical activity, dietary thermogenesis, which is the energy required to digest meals, and the
basal metabolic rate, which is the energy required to sustain the body’s functions while at rest.
There is little evidence that dietary thermogenesis and the basal metabolic rate are responsible
for childhood obesity, and as a result, research on energy expenditure focuses on physical
activity(Anderson and Butcher 2006).
1TheCDCreportsthat“thereferencepopulationfortherevisedU.S.growthchartswasprimarilybasedonstatisticallyrepresentativesamplesoftheU.S.pediatricpopulation,measuredinaseriesofcross‐sectionalsurveysfrom1963to1994,thatweresupplementedwithlimiteddatafromothersources”(Prevention2002).
Page 5
5
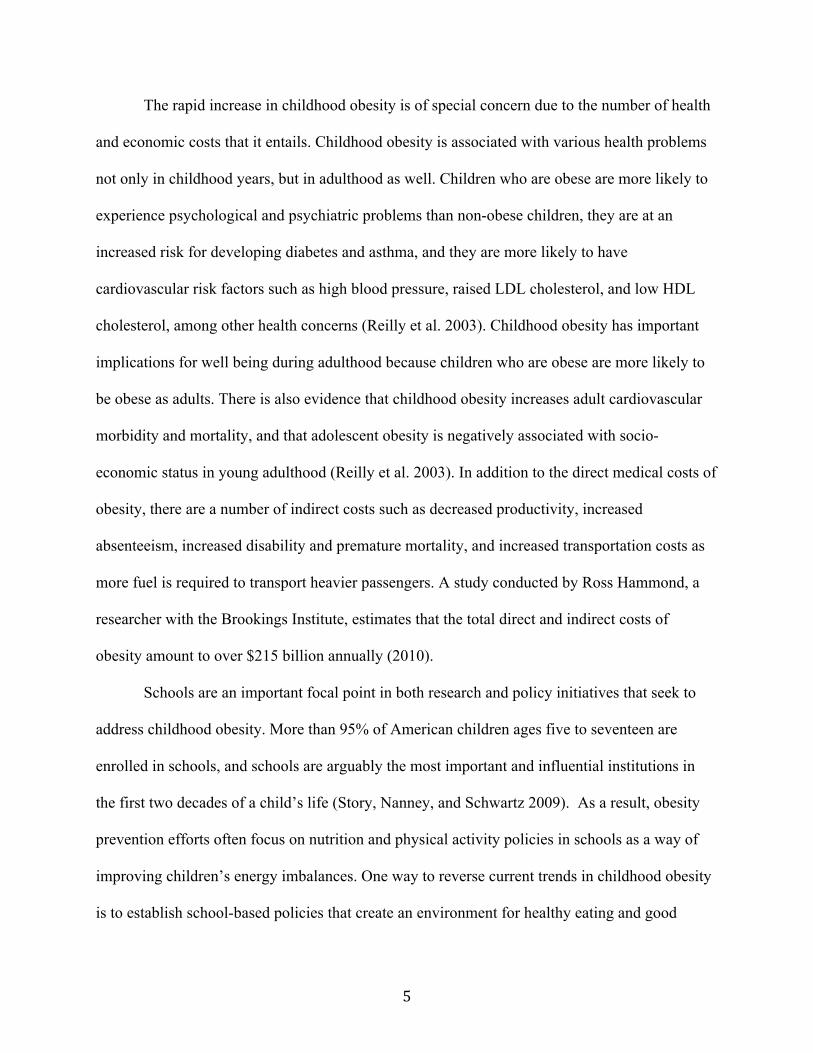
The rapid increase in childhood obesity is of special concern due to the number of health
and economic costs that it entails. Childhood obesity is associated with various health problems
not only in childhood years, but in adulthood as well. Children who are obese are more likely to
experience psychological and psychiatric problems than non-obese children, they are at an
increased risk for developing diabetes and asthma, and they are more likely to have
cardiovascular risk factors such as high blood pressure, raised LDL cholesterol, and low HDL
cholesterol, among other health concerns (Reilly et al. 2003). Childhood obesity has important
implications for well being during adulthood because children who are obese are more likely to
be obese as adults. There is also evidence that childhood obesity increases adult cardiovascular
morbidity and mortality, and that adolescent obesity is negatively associated with socio-
economic status in young adulthood (Reilly et al. 2003). In addition to the direct medical costs of
obesity, there are a number of indirect costs such as decreased productivity, increased
absenteeism, increased disability and premature mortality, and increased transportation costs as
more fuel is required to transport heavier passengers. A study conducted by Ross Hammond, a
researcher with the Brookings Institute, estimates that the total direct and indirect costs of
obesity amount to over $215 billion annually (2010).
Schools are an important focal point in both research and policy initiatives that seek to
address childhood obesity. More than 95% of American children ages five to seventeen are
enrolled in schools, and schools are arguably the most important and influential institutions in
the first two decades of a child’s life (Story, Nanney, and Schwartz 2009). As a result, obesity
prevention efforts often focus on nutrition and physical activity policies in schools as a way of
improving children’s energy imbalances. One way to reverse current trends in childhood obesity
is to establish school-based policies that create an environment for healthy eating and good
Page 6
6
exercise habits, potentially leading to decreased energy in-take and increased energy output. The
important role that school policies play in preventing childhood obesity is even reflected in First
Lady Michelle Obama’s Let’s Move! campaign. The campaign asserts that the childhood obesity
epidemic can only be overcome if schools are onboard, so it places an emphasis on working with
schools to create healthy, active environments (Obama 2010).
While schools have been a primary target for childhood obesity interventions, there
remains a great deal of uncertainty regarding how, and with what results, schools are
implementing obesity prevention policies. A particular question that remains to be answered is:
what barriers do schools face in implementing obesity prevention policies and programs? This
study seeks to understand adherence to obesity prevention policies and barriers to the
implementation of wellness initiatives in local elementary schools. Because children at younger
ages are likely to have more impressionable eating and physical activity behaviors, prevention
policies seeking to shape long-term behaviors may have the greatest potential to make an impact
in elementary schools (Sharma 2007). Furthermore, children who are obese by the age of 8 are
more likely to be obese as adults, so there is reason to believe that prevention strategies in
schools may be most effective in elementary, as opposed to middle or high, schools (Pekruhn
2009).
In order to understand what obstacles elementary schools face in implementing obesity
prevention policies, this paper first investigates federal, state, and district policies that schools
are expected to adhere to and reviews the current literature regarding the implementation and
impact of wellness policies across the nation. The empirical analysis focuses on interviews with
important stakeholders at the district- and school-levels that influence both nutrition and physical
activity policies and programs in schools. The results of these interviews indicate that schools
Page 7
7
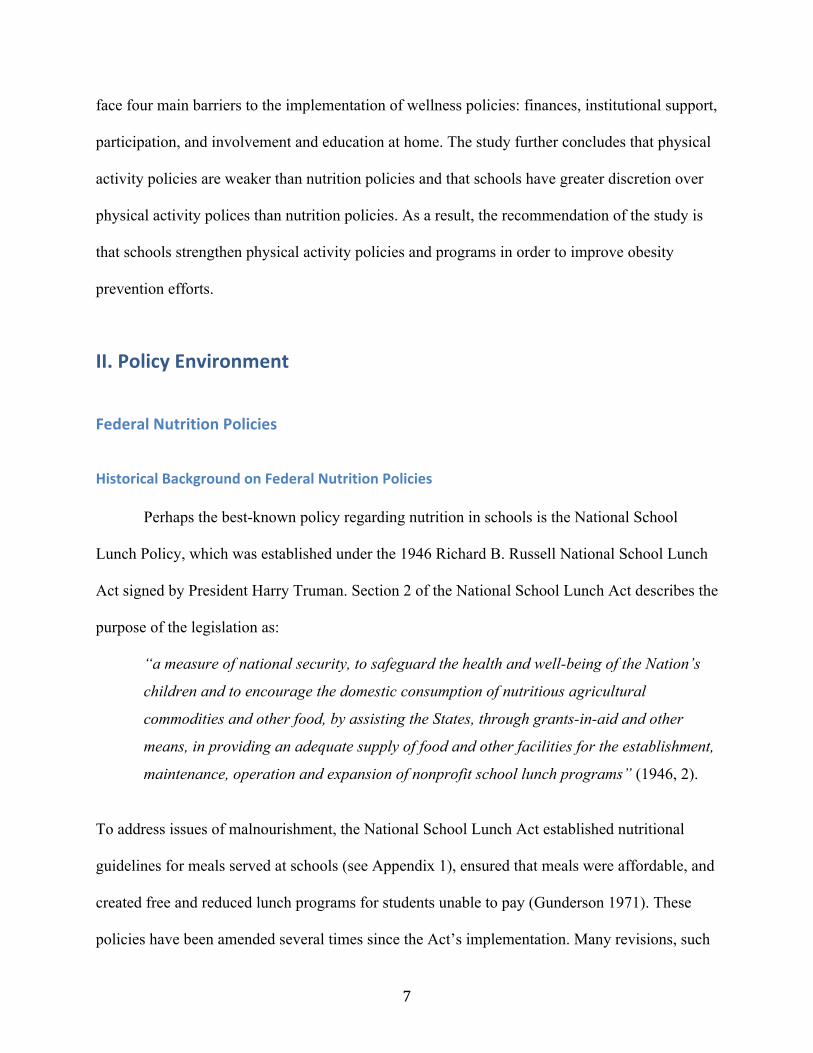
face four main barriers to the implementation of wellness policies: finances, institutional support,
participation, and involvement and education at home. The study further concludes that physical
activity policies are weaker than nutrition policies and that schools have greater discretion over
physical activity polices than nutrition policies. As a result, the recommendation of the study is
that schools strengthen physical activity policies and programs in order to improve obesity
prevention efforts.
II.PolicyEnvironment
FederalNutritionPolicies
HistoricalBackgroundonFederalNutritionPolicies
Perhaps the best-known policy regarding nutrition in schools is the National School
Lunch Policy, which was established under the 1946 Richard B. Russell National School Lunch
Act signed by President Harry Truman. Section 2 of the National School Lunch Act describes the
purpose of the legislation as:
“a measure of national security, to safeguard the health and well-being of the Nation’s
children and to encourage the domestic consumption of nutritious agricultural
commodities and other food, by assisting the States, through grants-in-aid and other
means, in providing an adequate supply of food and other facilities for the establishment,
maintenance, operation and expansion of nonprofit school lunch programs” (1946, 2).
To address issues of malnourishment, the National School Lunch Act established nutritional
guidelines for meals served at schools (see Appendix 1), ensured that meals were affordable, and
created free and reduced lunch programs for students unable to pay (Gunderson 1971). These
policies have been amended several times since the Act’s implementation. Many revisions, such
Page 8
8
as the 1952 and 1962 amendments, addressed the appropriation of federal funds for State
assistance, while later revisions made changes to services offered and nutrition standards.
In 1966, the Child Nutrition Act was passed in order to reinforce and expand upon the
efforts of the National School Lunch Act. The Child Nutrition Act recognized the “relationship
between food and good nutrition and the capacity of children to develop and learn,” and placed
the Secretary of Agriculture in charge of “safeguard[ing] the health and well-being of the
Nation’s children” (1966, 2). One notable expansion that the Child Nutrition Act made was the
establishment of a two-year pilot breakfast program. The pilot program selected a number of
schools that were designated to be high-need schools and implemented a program similar to the
National School Lunch Program that focused on serving students breakfast. The Secretary of
Agriculture provided reimbursements to schools to ensure that breakfast was affordable for
students, and in cases where students were unable to pay, breakfast was offered for free or at
reduced rates. Additionally, these breakfast meals were required to meet nutrition standards that
were set by the Secretary of Agriculture. Following the success of the pilot program, the School
Breakfast Program was implemented nation-wide (Gunderson 1971).
CurrentFederalNutritionPolicies
On December 13, 2010, President Barack Obama signed the Healthy, Hunger-Free Kids
Act into law. The Healthy, Hunger-Free Kids Act reauthorizes funding for child nutrition
programs including the National School Lunch Program and the School Breakfast Program.
Furthermore, the Healthy, Hunger-Free Kids Act authorized the U.S. Department of Agriculture
to implement new nutrition standards for meals served through federal nutrition programs. In
2012, the U.S. Department of Agriculture (USDA) established updated requirements for nutrition
standards in the National School Lunch and School Breakfast Programs Final Rule (see
Page 9
9
Appendix 2). In addition to these new nutrition standards, the Healthy, Hunger-Free Kids Act
has sought to improve the nutrition environment in schools by:
• increasing the availability of water in schools,
• setting nutrition standards for all foods served on school campuses, with certain
exemptions for fundraisers approved by schools and held infrequently, and
• increasing funding for farm to school initiatives to provide locally grown produce
during school meals (U.S. Department of Agriculture Food and Nutrition Service
[USDA] 2010).
The Act also contains more technical provisions such as requiring Local Education Agencies to
report on the school nutrition environment and establishing education, training, and certification
standards for staff and personnel involved in school food services (USDA 2010).
FederalPhysicalActivityPolicies
Policy regulations requiring physical activity in schools are not well developed at the
federal level. There is no federal law mandating that physical education be provided in schools
and there are no incentives to states or schools to offer physical education programs (National
Association for Sport and Physical Education [NASPE] & American Heart Association [AHA]
2010). The most significant federal policies regarding physical activity in schools are included in
the 2001 No Child Left Behind Act (NCLB) and the 2004 Child Nutrition and Women, Infants,
and Children (WIC) Reauthorization Act. Established under NCLB, The Carol M. White
Physical Education Program provides a select number of schools and community organizations
with grants to expand physical activity programming. The WIC Reauthorization Act directs local
education agencies participating in programs authorized by the National School Lunch Act or the
Child Nutrition Act of 1966 to set goals for physical activity (2004). The WIC Reauthorization
Page 10
10
Act, however, provides no further detail on what specific goals should be set or the timeline in
which the goals should be achieved. States are charged with the responsibility for defining
guidelines and setting policy standards because of the lack of federal guidance on setting
standards for physical activity in schools.
NorthCarolinaNutritionPolicies
The North Carolina General Assembly (NCGA) has also enacted legislation pertaining to
school nutrition standards. Chapter 115C of the NCGA General Statutes pertains to Elementary
and Secondary Education. Nutrition policies are addressed in Article 17, which encompasses
regulations for Supporting Services. General Statute 115C-264.3, in particular, provides a
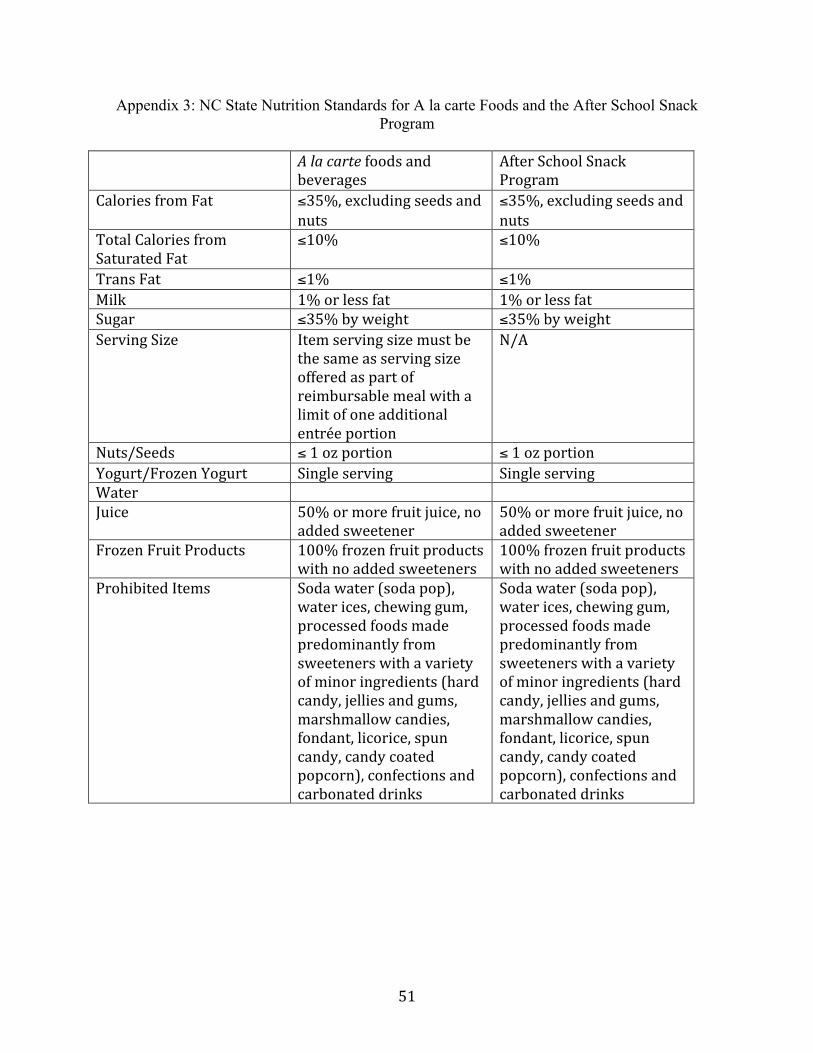
detailed description of the nutrition standards for elementary schools2. These guidelines include
the minimum standards for school meals (see Appendix 2), minimum nutrition standards for a la
carte foods and beverages (see Appendix 3), and minimum standards for After School Snack
Programs (see Appendix 3), along with guidelines on how Child Nutrition Services should
review, monitor, and report on the implementation of these policies (Nutrition Standards for
Elementary Schools 2006). Additionally, General Statute 115C-264.2 establishes the state
policies regarding vending machine sales in schools. Both the sales of soft drinks and snacks are
prohibited in elementary schools3 (Vending Machine Sales 2005).
NorthCarolinaPhysicalActivityPolicies
The North Carolina State Board of Education (NCSBE) directs guidance for physical
activity in schools at the state level through the Healthy Active Children policy. Healthy Active
2Nutritionstandardsformiddleschoolandhighschoolstudentsdifferfromelementaryschoolstandardstoreflectthechangingdietaryneedsofstudentsatdifferentstagesofdevelopment.3Vendingmachinesalesareallowedonmiddleschoolandhighschoolcampuses,althoughtherearerestrictionsonthenutritionalcontentoffoodsandbeveragesthatmaybesoldtostudents.
Page 11
11
Children addresses five main categories: local School Health Advisory Councils; physical
education; recess and physical activity; Coordinated School Health Programs; and an
implementation timeline (2005). The standards for physical education state that:
• students in kindergarten through eighth grade are to participate in physical activity as part
of the physical education curriculum,
• elementary schools should move towards having 150 minutes per week with a physical
education teacher throughout the 180-day school year,
• physical education courses should be based on the North Carolina Healthful Living
Standard Course of Study, and
• class size for physical education classes should be no different than regular class sizes
(Healthy Active Children 2005).
The standards for recess and physical activity state that:
• time for recess and physical activity cannot be revoked as a form of punishment,
• severe exercise may not be used as a form of punishment, and
• a minimum of 30 minutes of moderate to vigorous physical activity will be provided
daily for students in kindergarten through eighth grade (Healthy Active Children 2005)4.
The Healthy Active Children policy requires that local School Health Advisory Councils
complete annual reports recording the “minutes of physical education and/ or healthful living,
physical education activity received by students in each school within the district,” and
“indicators that will mark successful implementation and evidences of completion” (2005).
These reports, which are to be completed by July 15th of each year, are the mechanism through
which the State intends to track and enforce the implementation of physical activity policies. 4Thesephysicaleducationandphysicalactivitypoliciesareapplicablelargelytoelementaryschoolstudentsonly.Requirementsforphysicaleducationandactivityarediminishedasstudentsgetolder,withtheleaststringentrequirementsforhighschoolstudents.
Page 12
12
III.ImpactofWellnessPoliciesonStudentHealthOutcomes
While the federal and state policies relating to nutrition standards and physical activity
are intended as measures to increase students’ well being, research indicates that it is not clear
whether or not these outcomes are achieved. Some studies, for example, have found that schools
with policies that limit the sales of sugar-sweetened beverages and other competitive foods5 have
been associated with improvements in children’s weight status (Sanchez-Vaznaugh et al. 2010)
and reductions in consumption of sugar-sweetened beverages (Cradock et al. 2011; Jones,
Gonzalez, and Frongillo 2010). Other studies have shown that wellness policies related to food
service and nutrition have been related to reduced risks for overweight and obesity, but that
physical activity policies show limited or no impact on children’s weight status (Nanney et al.
2010; Coffield et al. 2011). However, other studies investigating the relationship between obesity
and physical activity suggest that physical activity can help improve weight status if children are
engaged in the appropriate amount of physical activity. For example, one study, which conducted
a systematic review of 850 articles, concluded that while most interventions use supervised
programs of moderate to vigorous physical activity of 30 to 45 minutes 3 to 5 days a week,
school-aged youth should be receiving 60 minutes or more of moderate to vigorous physical
activity (Strong 2005). Other research indicates that policies which target the removal of
competitive snack foods in schools may be misguided because most calories from snacking take
place at home rather than from vending machines (Nielsen, Siega-Riz, and Popkin 2002).
Additional research finds that obese and non-obese adolescents obtain the same energy intake
from snacks, suggesting that energy imbalances may not be a result of eating snack foods
(Bandini et al. 1999).
5Competitivefoodsareanyfoodsorbeveragessoldoutsideofthefederalmealprogram.
Page 13
13
Although these studies indicate mixed results for the impact of different wellness policies
on the weight status of students, the evidence and theory suggest that if the appropriate programs
are implemented, nutrition and physical activity policies can be effective means of addressing
childhood obesity. Creating nutritious and active environments at schools can help children
cultivate healthy behaviors that they can practice at home and outside of school, and therefore
are important policy initiatives.
IV.AdherencetoWellnessPolicies:LessonsfromthePast
Although policies have been developed at both the national and state levels in order to
address wellness in schools, it is unclear whether or not those policies are implemented as
intended at the local levels. Studies have been conducted across the United States to evaluate the
implementation of nutrition and physical activity policies in schools. In particular, there is a
large body of research regarding the implementation of local wellness policies (LWP) that
address the availability of foods and beverages during the school day, nutrition education,
physical activity, and other school-based activities designed to promote wellness in schools as
mandated by the WIC Reauthorization Act of 2004 (Pitt Barnes et al. 2011). For example,
researchers have conducted studies in Georgia (Lyn et al. 2011), Pennsylvania (Probart et al.
2010), Minnesota (Hoxie-Setterstrom and Hoglund 2011), Alabama (Gaines, Lonis-Shumate,
and Gropper 2011), and in 6 districts across the United States (Pitt Barnes et al. 2011) in order to
examine whether or not schools are adhering to the federal mandate. Although the criteria used
in each study were unique, compliance was generally determined by identifying key components
of the federal policy and examining individual school policies to see whether or not they
addressed or included the identified components. In general, the findings of these studies indicate
Page 14
14
that there are often significant gaps in policy implementation, as policies at the local level are
incomplete, weak, and often lacking in enforcement. The studies also indicate that, overall,
nutrition policies seem to be more widely implemented than physical activity policies.
While the studies evaluating the implementation of LWPs across the nation indicate that
there is often a disconnect between official policies and school practices, they do not indicate
why such discrepancies exist. Other researchers and scholars, however, offer insight into the
mechanisms that may prevent schools from adopting policies of best practice. Two of the most
prominent barriers that keep schools from adopting policies of best practice with regards to
nutrition and physical activity are due to budgetary and academic performance pressures.
Budget pressures often compromise schools’ initiatives to offer nutritious and healthy
foods because school food services need to be self-supporting. Often, schools generate the
revenue necessary to cover all food service costs through the sales of competitive foods (Story,
Kaphingst, and French 2006). Competitive foods are not part of the federal meal program, and
thus, are not subject to regulation by federal nutrition and dietary guidelines. Although policies
regulating the nutritional value of competitive foods may be implemented at the state and local
levels, schools often face pressure to sell popular food items that are profitable, even though they
may not be nutritious.
Furthermore, critics of the 2001 No Child Left Behind Act (NCLB) believe that the
legislation has adversely impacted initiatives to support physical activity (Story, Nanney, and
Schwartz 2009). No Child Left Behind requires that States establish a definition for “adequate
yearly progress” (AYP) in order to determine the achievement level of individual schools and
school districts. Although each State has the jurisdiction to define its own benchmarks, AYP is
based on performance on standardized tests in core academic areas such as reading and math, not
Page 15
15
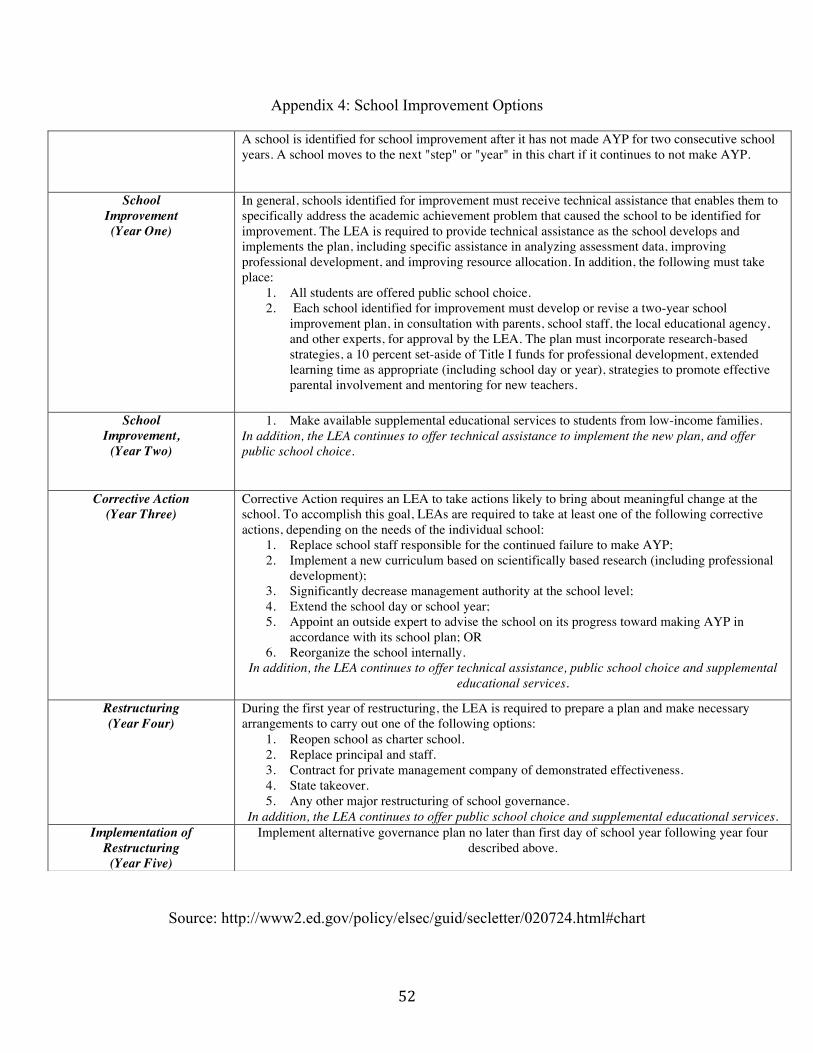
including physical education. Schools that do not meet standards for AYP on a year-to-year basis
are subject to a number of programmatic and structural changes over time (see Appendix 4),
which are coordinated by the Local Education Agency (LEA). In order to help students pass
standardized tests (and as a result, avoid the consequences for not meeting AYP goals), there has
been a trend in public schools of cutting physical education for increased study time in core
academic subjects (Ratey 2008).
Although physical activity is often compromised for the sake of improving academic
performance, research indicates that wellness policies that promote physical activity may
actually boost academic performance. Children who are physically active have been shown to
have better academic performance, and some studies show that sacrificing physical activity time
for classroom time does not actually improve academic performance (Trost 2007). Another study
indicates that academic scores and high school completion rates were higher for students in states
that had policies promoting student health as prescribed by the Coordinated School Health
Program, which is an 8-component plan recommended by the CDC (Vinciullo and Bradley
2009). The study conducted to evaluate LWP in schools across Georgia also finds a correlation
between academic performance and LWP (Lyn et al. 2011). A report by the Robert Wood
Johnson Foundation (RWJF), which summarizes the findings of a number of studies, also
concludes that physical activity helps students perform better at school. For example, some
studies report that students who performed better on fitness tests were more likely to score higher
on math and reading tests, and less likely to have trouble with drugs, alcohol, violence and
truancy. Other studies show that students had improved levels of concentration after physical
activity and that physical activity breaks help students stay on task during class and reduce
fidgeting (RWJF 2011).
Page 16
16
In the book “Spark: The Revolutionary New Science of Exercise and the Brain,” Dr. John
Ratey and Eric Hangerman also investigate the link between physical exercise and academic
performance. As Dr. Ratey explains, there is “emerging research showing that physical activity
sparks biological changes that encourage brain cells to bind to one another. [And,] for the brain
to learn, these connections must be made” (2008, 10). Dr. Ratey explains that the inspiration for
his book is a school district in Indiana, Naperville District 203, which has taken a novel approach
to physical education (PE) programs. Physical education in Naperville District 203 focuses
specifically on raising students’ heart rates, which are monitored, to set thresholds. For example,
in a voluntary before-school program called Zero Hour PE at Naperville Central High School,
freshmen enrolled in a literacy class for under-performing students engage in high intensity
workouts where they are required to stay between 80 and 90 percent of their maximum heart
rate. As Naperville Central’s PE coach states, the intention of the program is to “get [students]
prepared to learn, through rigorous exercise” (Ratey 2008, 11). Test results indicate that students
participating in Zero Hour PE showed a 17 percent improvement in reading and comprehension,
while their peers in the literacy class who did not participate in the program showed a 10.7
percent improvement (Ratey 2008). These findings support the hypothesis that physical activity
may not only have health benefits, but academic benefits, as well.
These studies illustrate that physical activity and academic performance are closely
related, and that the implementation of wellness policies can lead to improved academic
performance, as well as student health. Given that physical activity and wellness policies may
actually improve academic performance, the reduction of physical activity time in schools due to
the pressure to improve standardize test scores may be doing more harm than good in helping
schools to attain satisfactory ratings as per NCLB (RWJF 2011).
Page 17
17
V.CaseStudies:DurhamandOrangeCountyElementarySchools
The primary research question of this study is: What obstacles do elementary schools in
Durham County and Orange County face in implementing obesity prevention policies and
programs?
North Carolina ranks as the fifth worst state in the nation in terms of childhood obesity
prevalence (Eat Smart, Move More NC). Acknowledging that North Carolina faces an especially
severe burden, this study evaluates the barriers to the implementation of obesity prevention
policies within the state. Elementary schools in Durham and Orange Counties were selected for
this study as a convenience sample in order to ensure that relevant interviews could be
conducted. Additionally, data suggests that the burden of childhood obesity is high in the local
community. Student height and weight recordings collected through fitness testing in a local
school were analyzed in order to investigate the prevalence of overweight and obesity. The
CDC’s online BMI Calculator for Child and Teen was used to determine the BMI and weight
status of each of the students for whom data was available. The sex, height, and weight of each
student were entered in the calculator and the average age based on grade level was used. As
Graph 1 below illustrates, the analysis of student data show that in each class, 50% or more of
the students were either overweight or obese.
Page 18
18
Graph 1
Although these data may not be representative of all students in Durham and Orange Counties,
they clearly indicate that childhood obesity is a problem that the local community is grappling
with.
In order to understand the barriers to implementation of obesity prevention efforts at the
local level, a number of actors that influence the wellness policies and programs that schools
enact were approached for interviews. Table 1 below summarizes the various types of
stakeholders at the district- and school-levels to whom interview requests were sent:
Table 1: District and School-Level Stakeholders Solicited for Interviews
District-Level Stakeholders School-Level Stakeholders
Child Nutrition Services Directors Principals
Wellness Coordinators Physical Education Teachers
Local School Health Advisory Council Leaders Parent-Teacher Organization Presidents
Chief Operating Officers Non-Profit Partners
0
0.1
0.2
0.3
0.4
0.5
0.6
Underweight NormalWeight Overweight Obese
ProportionofStudents
StudentWeightStatus
StudentWeightCompositionbyClass
Class1
Class2
Class3
Page 19
19
A range of schools was selected based on student performance on end-of-year standardized tests.
Because standardized testing scores have been found to correlate to student fitness and obesity,
selecting a sample based on varying academic performance outcomes was used to obtain a
sample of schools facing varying health statuses (Roberts May 2010).
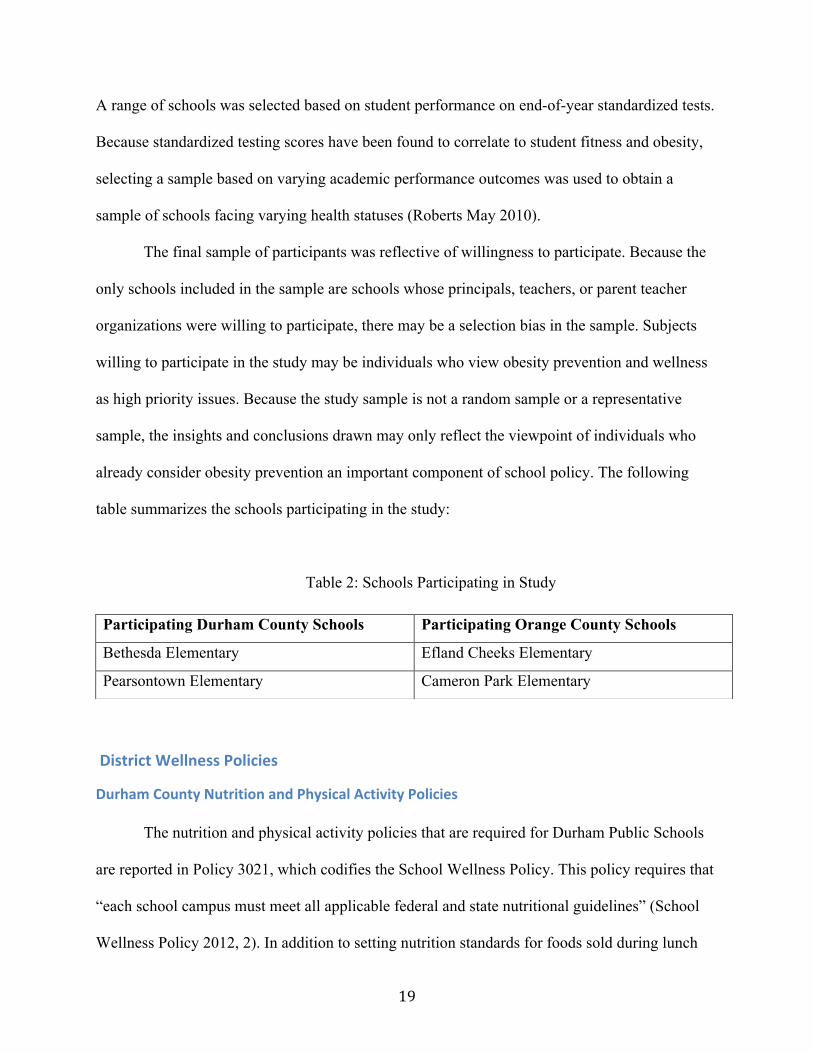
The final sample of participants was reflective of willingness to participate. Because the
only schools included in the sample are schools whose principals, teachers, or parent teacher
organizations were willing to participate, there may be a selection bias in the sample. Subjects
willing to participate in the study may be individuals who view obesity prevention and wellness
as high priority issues. Because the study sample is not a random sample or a representative
sample, the insights and conclusions drawn may only reflect the viewpoint of individuals who
already consider obesity prevention an important component of school policy. The following
table summarizes the schools participating in the study:
Table 2: Schools Participating in Study
DistrictWellnessPolicies
DurhamCountyNutritionandPhysicalActivityPolicies
The nutrition and physical activity policies that are required for Durham Public Schools
are reported in Policy 3021, which codifies the School Wellness Policy. This policy requires that
“each school campus must meet all applicable federal and state nutritional guidelines” (School
Wellness Policy 2012, 2). In addition to setting nutrition standards for foods sold during lunch
Participating Durham County Schools Participating Orange County Schools
Bethesda Elementary Efland Cheeks Elementary
Pearsontown Elementary Cameron Park Elementary
Page 20
20
and breakfast, the School Wellness Policy establishes guidelines for foods available during
classroom parties and celebrations, after school events, and vending machines. The School
Wellness Policy requires that classroom parties and celebrations be coordinated with Child
Nutrition Services to ensure compliance with state and federal laws and that low-sugar beverages
and water be offered during classroom parties. The School Wellness Policy also prohibits the use
of food as a reward or punishment for student behavior, although it allows for the incorporation
of food into celebrations of student performance. Additionally, concession stands offering food
and beverages at after-hours events are required to include healthy options as defined by the
Winner’s Circle standards6. Consistent with state regulations, the School Wellness Policy states
that vending machine sales of soft drinks are not permissible in elementary schools. There is,
however, no specified requirement that elementary schools may not engage in snack sales via
vending machines in elementary schools, as the state policies mandate.
In regards to physical activity policies, the School Wellness Policy largely aligns with the
Healthy Active Children policy. The School Wellness Policy requires that students enrolled in
kindergarten through eighth grade receive a minimum of 30 minutes of moderate to vigorous
physical activity daily. The School Wellness Policy also encourages, but does not require,
schools to give students 150 minutes per week with a certified physical education teacher
throughout the 180-day school year. The School Wellness Policy also prohibits the revoking of
recess or other physical activity time as a form of punishment and the use of severe or
inappropriate exercise as a form of punishment. The School Wellness Policy does not set a
specific requirement that schools use the North Carolina Healthful Living Course of Study to
6The Winner's Circle Dining ProgramSM is a menu labeling and social marketing initiative developed by NC Prevention Partners (NCPP) that promotes the selection and consumption of healthy foods. The program uses an easily identifiable logo: a purple star and a gold fork, in order to help consumers recognize and select healthy options. The program uses science-based nutrition criteria consistent with the Dietary Guidelines for Americans to identify healthy choices.
Page 21
21
guide physical education courses, nor does it specify that physical education classes should be
the same size as other regular classes. Going beyond what is enumerated in the Healthy Active
Children policy, however, the School Wellness Policy does state that adequate equipment will be
made available for all students to participate in physical education. The physical activity policies
of Durham County are compared against state standards in Table 3.
OrangeCountyNutritionandPhysicalActivityPolicies The Orange County Board of Education sets forth standards for nutrition and physical
activity in Policy 3541, which addresses Physical Activity and Healthy Eating. The Physical
Activity and Healthy Eating policy requires that school meals “meet, at a minimum, the nutrition
requirements set by local, state, and federal statutes and regulations, and are tasty, appealing, and
healthy” (2006, 1). The policy also states that the sales or offering of competitive foods available
via a la carte menus, vending machines, school celebrations, fundraisers, and concession stands
should be governed by the Eat Smart School Standards7 and other state and federal nutrition
standards. The Physical Activity and Healthy Eating policy does not specifically address vending
machine sales in schools as the Durham County and state regulations do.
In accordance with state regulations, the Physical Activity and Healthy Eating policy
requires that students enrolled in kindergarten through eighth grade receive at least 30 minutes of
moderate to vigorous physical activity daily, and encourages elementary schools to provide
students with 150 minutes per week with a certified physical education teacher throughout the
180-day school year. The policy also requires that physical education courses be based on the
guidelines of the North Carolina Healthful Living Standard Course of Study and that physical
7EatSmartSchoolStandardsweredevelopedbytheNorthCarolinaDivisionofPublicHealth,theNorthCarolinaDepartmentofPublicInstruction,andtheNorthCarolinaCooperativeExtensionServicetohelpcraftschoolpoliciesforfoodsavailablethroughcafeteriameals,alacarteitems,vendingmachines,afterschoolprograms,schoolfunctions,andcelebrations.
Page 22
22
education classes be the same size as other regular classes. Additionally, the policy states that
recess and physical activity cannot be revoked as punishment or used severely as a means of
punishment. The Physical Activity and Healthy Eating policy also calls for the establishment of
“opportunities and encouragement for students to voluntarily participate in before-and after-
school physical activity programs such as intramurals, clubs, and electives” (2006, 1). The
physical activity policies of Orange County are compared against state standards in Table 3.
Table 3: ComparisonofDurhamCountyandOrangeCountyPhysicalActivityPoliciesto
NorthCarolinaPoliciesforElementarySchools
StatePolicyMeasure DurhamCounty OrangeCounty150minutesperweekwithcertifiedphysicaleducationteacherthroughout180dayschoolyear
Yes Yes
PEclassessamesizeasregularclasses
Notmentioned Yes
PEcurriculumbasedonNorthCarolinaHealthfulLivingStandards
Notmentioned Yes
Recess/physicalactivitytimecannotberevokedaspunishment
Yes Yes
Severeandinappropriateexercisemaynotbeusedasformofpunishment
Yes Yes
Minimumof30minofmoderatetovigorousphysicalactivitydaily
Yes Yes
InsightsfromStakeholderInterviews
Interviews with relevant stakeholders in Durham and Orange Counties provided insights
as to how nutrition and physical activity policies and programs are currently being implemented
Page 23
23
in schools and what obstacles stand in the way of making improvements.
ImplementationofNutritionPolicies
Conversations with the presidents of Parent Teacher Associations (PTAs) or Parent
Teacher Governance Organizations (PTGOs), and district-level administrators revealed that
nutrition in schools is framed around three components: school meals, snacks, and fundraising.
School Meals
As noted previously, nutrition guidelines for school meals are set largely at the Federal
and State level. Districts are responsible for creating menus that adhere to these guidelines, and
these menus are then offered in school cafeterias. As such, individual schools do not have much
discretion over the foods that are served during school meals. A discussion with a district-level
administrator revealed that Orange County has made efforts to improve the nutritional content of
meals by no longer serving fried foods, replacing whole milk with skim milk, and increasing the
availability of fruits and vegetables in school cafeterias. It was noted that schools in Orange
County no longer use fryers to prepare fried foods to be served to students. A number of the
fryers previously used in school cafeterias have been sold, and the County is prepared to sell
those that remain. Furthermore, in an effort to expand fruit and vegetable offerings in schools,
Orange County has introduced a full service salad bar in one elementary school and one high
school. The Whole Kids Foundation sponsored by Whole Foods donated the salad bars to the
schools, but the cost of the foods offered in the salad bar is financed through Child Nutrition
Services. The salad bar has seen limited success, with an estimated 5 purchases a day out of 220
to 250 lunches sold in the high school and 20 purchases a day out of 325 to 375 lunches sold in
the elementary school. The utilization of the salad bar is also dependent on what foods are
offered on the regular cafeteria menu. For example, one administrator noted that on days when
Page 24
24
pizza is offered, there is little to no use of the salad bar. Because of the expense associated with
providing the salad bar and the low participation rates, there are no plans to introduce salad bars
to other schools in the county.
The foods that are served in school cafeterias also partially depends on the manufacturers
that contract with school systems. One district official explained that when nutrition standards
are updated, legislatures want to see immediate changes taking place in schools. These changes,
however, take time to trickle through the system, as manufactures have to change the products
they offer to ensure compliance with new standards. On the one hand, manufacturers understand
that if they don’t make the necessary changes, they will lose a significant amount of their
contracts. This is especially true when school systems form a coalition, such as the North
Carolina Procurement Alliance, and jointly bid for contracts. On the other hand, manufacturers
still have to clear old inventory, even if it does not meet updated nutrition standards. As one
administrator noted, even though new standards require that pizza contain 2 servings of whole
grain and 2 servings of meat, the old inventory of pizza might contain 2 serving of grain and 2.5
servings of meats. The manufacturers might still try to deliver the old inventory to schools, and
this increases the importance of checking and double-checking the labels of foods that are
provided by manufacturers to ensure that the right products are being supplied.
Conversations with the PTA and PTGO presidents indicated that one of the most
significant challenges that schools face is providing healthy menu options that students find
appealing. Personal experiences of many PTA and PTGO presidents indicate that students often
throw away foods that they do not find appetizing. In the opinion of some, this leads to wasteful
spending, as schools are allocating funding to provide foods that students simply do not want to
eat. Students’ reluctance to eat foods served by school cafeterias may be the result of a stigma
Page 25
25
associated with the quality of school food services. Because teachers often do not eat cafeteria
food, students may get the impression that the food is low quality and thereby be discouraged
from eating the foods that are served.
A district administrator indicated that strict nutrition standards also make it difficult to
provide foods that are appropriate and appetizing for students. For example, starting next school
year standards for the School Breakfast Program will require a certain amount and variety of
vegetables be served before any meat can be served. These vegetables cannot be starches and
must include dark green and orange vegetables. District administrators argue that these standards
are too strict and unrealistic because there are little to no breakfast foods that incorporate dark
green and orange vegetables. One official noted that other than incorporating green peppers into
omelets and serving sweet potato puffs, which are a starch, it is hard to imagine what other dark
green and orange vegetables can be served for breakfast. School systems in North Carolina are
organizing to petition the USDA to relax these standards to levels that are more realistically
feasible. Some district officials, however, expressed little confidence that the USDA will relax
the standards in response to the petition.
Students may also have different propensities to eat foods that they are familiar with
versus those that they find unfamiliar. Many of the personal experiences of PTA and PTGO
presidents indicate that students are often only willing to eat school meals when familiar foods
such as pizza, chicken nuggets, and corndogs are being sold, and prefer to bring packed lunches
on days that these familiar items are not served. Schools, however, are unable to regulate the
nutritional content of packed lunches. While some parents pack wholesome and nutritious meals
for their children to bring to school, the opportunity arises for kids to bring in foods of minimal
nutritional value such as cookies, chips, and soda when they elect to bring packed lunches rather
Page 26
26
than participating in the school meal program. Therefore, many PTA/PTGO presidents, as well
as district administrators, believe that in addition to serving nutritious meals through the school
cafeteria, it is important to encourage parents to pack nutritious and balanced meals for their
children by educating them on healthy eating behaviors.
The president of Cameron Park Elementary PTGO also noted that school food services
often have to operate under the assumption that the only meals that many students receive are
those during school hours. This increases both the importance of providing nutritious and
balanced meals in schools and meals that students find appetizing and will eat. Creating healthy
menu options that are tailored to student preferences, however, can often be a costly endeavor.
As such, many PTA and PTGO presidents indicated that a lack of funding contributes to schools’
inability to cater healthy foods to students’ tastes. One district official also cited financial
constraints as the reason scratch cooking cannot be provided in schools. In order to provide
scratch cooking, school systems would have to hire additional staff, and labor costs would
increase. Food service programs do not receive funding from schools or districts and are
responsible for recovering the costs of food, equipment, and salaries through sales. As a result,
endeavors to provide fresher and healthier options are often too big a financial burden for
schools to undertake.
One district administrator also pointed to the limited capacity of schools to ensure that
students eat well because operations are limited to the weekdays. Although students may be
eating nutritious and wholesome meals during the weekdays, they may not receive such meals on
the weekends. A district administrator noted that another county in North Carolina has attempted
to address this problem, especially for low-income families that might struggle to afford
nutritious foods. In order to do so, the district works with community partners, such as churches,
Page 27
27
to send food home with students for the weekend.
Snacks
Schools are also unable to regulate what students bring in for their daily snacks. Some
PTAs have recognized the importance of moving towards encouraging and providing healthy
snacks to students. The Wellness Committee of the Pearsontown Elementary PTA has discussed
initiating a school-wide healthy snack program and proposed the following:
• developing school-wide guidelines for healthy snacks and advocating for such
guidelines to be included in the school improvement plan;
• communicating with parents about healthy snack guidelines, snack
recommendations, items to avoid, and other wellness information and tips; and,
• engaging students by having all students eating the same healthy snack,
establishing a recommended snack of the week or theme for the month,
conducting tastes tests within classrooms, and having 4th and 5th grade AIG
students conduct research and make recommendations (Pearsontown Elementary
Wellness Committee 2012).
Additionally, the principal at Efland Cheeks Elementary recently applied for a grant to support a
program that would provide students with locally grown fruits and vegetables for snacks in lieu
of snacks brought from home. The application for the grant, however, was declined, and it
remains unclear whether the initiative to have school-sponsored healthy snacks can be financed
through alternative means.
Fundraising
The North Carolina Task Force for Preventing Childhood Obesity has recommended that
the NCGA direct the NCSBE to establish statewide nutrition standards that are applicable to
Page 28
28
school-operated fundraisers, as well as other sources of competitive foods and beverages (2009).
The specific mention of nutrition standards for fundraisers results from the popularity of using
food-based fundraisers in schools. The PTA president at Bethesda Elementary reported that the
school has hosted a number of fundraisers involving the sale of donuts, cookie dough, and
candies. The PTA at Efland Cheeks Elementary has also generally relied on fundraisers geared
towards food. The PTA has moved from partnering with McDonald’s to partnering with Moe’s
Southwestern Grill, a restaurant that offers healthier menu options; the decision to switch
restaurant partners was due to both health concerns and financial incentives. District officials in
Orange County also indicated that schools are able to sell candies and snack foods, such as
donuts, to raise money for discretionary spending. In fact, the district has no role in determining
what fundraisers can and cannot be organized, as that responsibility lies with school principals.
Although schools continue to use foods with minimal nutritional value and fast food in
fundraisers, there are efforts to move away from food-based fundraisers. For example, Bethesda
Elementary holds car washes and yard sales to raise additional funds. Efland Cheeks Elementary
has recently engaged in hosting activity based fundraisers such as bowling and laser tag nights.
The PTA at Pearsontown Elementary has replaced a catalogue fundraiser with an exercise-based
program in which students seek funding pledges for the number of laps they will run. This
program has experienced greater financial success than the catalogue fundraiser, but the decision
to switch fund-raising models has received backlash from some parents who are upset that the
catalogues selling items such as cookie dough are no longer available.
ImplementationofPhysicalActivityPolicies
Conversations with important stakeholders revealed that physical activity in schools is
promoted through three primary channels: physical education, recess, and before and after-
Page 29
29
school programming.
Physical Education
Although NC state regulations, as well as Durham and Orange County policies,
recommend that schools provide 150 minutes of PE with a certified instructor per week
throughout the 180-day school year, schools do not seem to be reaching this goal. Physical
education is incorporated into curriculums as a “special”, along with art, music, and foreign
languages, rather than a routine subject. Although district level officials in Orange County
indicated that elementary students receive 60 minutes of PE every day, conversations with other
stakeholders indicated that neither students in Orange nor Durham County have PE on a daily
basis. This discrepancy may points towards a lack of communication and understanding
regarding PE standards between the district and individual schools. For the most part, it seems
that schools employ a weekly rotational program where students attend PE class either once or
twice a week. Another model that has recently been implemented is a 3-week rotation program in
which students attend each “special” every day for 3 weeks before rotating onto the next subject.
Under the block scheduling, students attend PE for 12 weeks out of the 36-week school year.
Physical education instructors indicated that each method of scheduling has its pros and
cons. When PE is provided once or twice a week, students receive consistent instruction
throughout the year, which PE teachers believe is helpful. However, when instructors only see
their students once or twice a week, it makes it more difficult to pick up where they left off on
the last lesson because there is a lack of continuity. While the 3-week rotations provide
continuity, the continuity is only short lived. Instructors feel that it is hard to get to know their
students when they do not get to see them continuously throughout the year. Furthermore, they
face different pressures in scheduling lessons, citing that they feel like they have to cram their
Page 30
30
lessons to make sure they are covering all the material necessary and have less flexibility in
pacing their classes.
Physical education instructors also point to the discrepancy between scheduled time for
PE class and actual instructional time as a challenge. The time that it takes students to walk from
their regular classes to their PE classes and the time that physical education instructors must
spend getting the students to settle down both take away from the time that is set aside for PE
class. PE teachers at one elementary school indicated that even though the scheduled class time
for PE is 40 minutes, they realistically only have 30 to 35 minutes of instructional time each
class period. Another PE instructor explained that out of the 40 minutes that are scheduled for
PE, students are engaged in physical activity for about 20 minutes.
The amount of material that PE teachers are expected to cover in such a short amount of
time also adds to the pressures they face. PE classes in North Carolina schools are expected to
follow the curriculum outlined in the NC Essential Standards for Healthful Living Physical
Education, which cover topics such as motor skills, movement concepts, health-related fitness,
and personal and social responsibility. In addition to topics in the NC Essential Standards
curriculum for Healthful Living Physical Education, some PE instructors also attempt to teach
students lessons about health and nutrition because it is unlikely that classroom teachers cover
those topics as they are supposed to, according to the NC Essential Standards for Healthful
Living Health Education. One such instructor has plans for introducing students to healthy foods
they may not otherwise be exposed to by holding taste-testings. For example, by bringing in a
blender and different types of fruits to make smoothies, students can learn about healthy snack
options that they have not been introduced to before. In addition to incorporating lessons about
health and nutrition into the PE curriculum, this PE instructor is also teaching students about
Page 31
31
non-traditional physical activities such as zumba and yoga. The emphasis, again, is placed on
introducing students to new ways of staying healthy that they otherwise are unlikely to be
exposed to. Another PE instructor also tries to emphasize personal hygiene, healthy eating, and
healthy decision-making.
Physical education teachers are also responsible for conducting fitness testing for
students. In one school, the PE department had been receiving funding from the State for the past
few years to use Fitnessgram 9, a fitness assessment and reporting program. The school received
funding for Fitnessgram as part of the In-school Prevention of Obesity and Disease (IsPOD) pilot
initiative spearheaded by the North Carolina Alliance for Athletics, Health, Physical Education,
Recreation, and Dance (NCAAHPERD). The In-school Prevention of Obesity and Disease was a
four-year grant funded program that began in fall 2008 and ended in August 2012, and although
some parts of the IsPOD intiative were expanded state-wide, software, manuals and training for
the use of Fitnessgram were only provided in seven counties where IsPOD was first piloted
(North Carolina Alliance for Athletics, Health, Physical Education, Recreation, and Dance,
2012). Some PE teachers in schools that did not receive funding through the IsPOD initiative
also mentioned that they had used Fitnessgram in the past, albeit for a very limited time.
Fitnessgram 9 allows PE teachers to record students’ height, weight, and performance
scores for flexibility, curl-ups, push-ups, trunk lift, and an endurance activity (pacer) on a web-
based program. The Fitnessgram software calculates students’ BMI scores and allows statistics
to be tracked over time, even when students switch schools. The Fitnessgram program makes it
easy for PE instructors to work with students to set yearly goals and track their progress in
achieving those goals. However, some PE teachers noted that entering student data into the
software is often time-consuming and that it is difficult to get the required assessments done in a
Page 32
32
timely manner. One PE teacher, for example, noted that students are in PE class perhaps 40 to 45
days of the school year and that it is difficult to conduct beginning and end of year assessments
given time and resource constraints. Nevertheless, PE teachers did seem to agree that they
preferred the Fitnessgram model of assessment because it focuses on personal improvement in
fitness results rather than comparison to a standard as many other programs do. In fact, even in
schools that no longer receive funding for Fitnessgram and had limited experience with the
program, PE teachers have adopted features of the program into their fitness testing procedures.
Additionally, the electronic reports that Fitnessgram generates allow PE teachers to easily share
information about student health and fitness with parents and school nurses.
Given that funding for Fitnessgram has stopped with the conclusion of the IsPOD
initiative, continued use of the program depends on whether or not schools finance the programs
on their own accord. Without access to Fitnessgram as a result of a lack of funding, some PE
teachers have had to revert to recording the results of fitness tests on paper, and have diminished
capabilities of tracking data and reporting results to parents and school nurses. When data is
recorded manually, BMI scores cannot be automatically generated. This makes it harder to
determine what a student’s weight status and classification are.
However, as one PE instructor noted, the lack of confidentiality during these fitness tests
can pose a significant challenge, especially in terms of recording student weights. The instructor
recalled that when student weights were recorded as a part of fitness testing, one student, who
happened to be overweight, cried when she had to step on the scale in front of her classmates. As
a result of that experience, weight recordings are no longer taken as a part of fitness testing in
this particular PE department. Rather than collecting data about student weight through the PE
department, the responsibility of conducting student weighing has been given to the nurse’s
Page 33
33
office. The PE department, however, does receive a report of the results of student weight tests
from the nurse’s office, and it also remains unclear whether or not the nurse’s office sends results
home to parents.
Limited funding also impacts PE teachers’ ability to invest in equipment for their classes.
One PE teacher noted that while the PE department is supposed to receive $1.47 per student in
funds8, it does not see a single penny. The $1.47 per student that the school receives is apparently
reallocated to discretionary spending. Although no money has been received through the
discretionary school budget, the PE department had received a $2500 grant from the county
approximately 2 to 3 years ago. The grant was used to buy equipment that could be used for
individual or small group sports, such as tennis rackets and track hurdles. Apart from the
equipment bought with the grant money, much of the PE equipment has been the same for nearly
two decades. In another school, the PE department raises money through a basketball fundraising
program and accepts donations from parents. In the past, the county has also provided matching
grants for investments in projects such as building a school track.
One district-level administrator in Orange County noted that pressures emphasizing the
importance of educational performance take away from the time and resources that are dedicated
to PE. As both the Federal and State governments have moved towards evaluating and
compensating teachers based on student performance on standardize tests, PE, as well as other
specials, have become less important priorities. For example, in Orange County schools, students
who are underperforming on standardized tests sometimes receive remediation lessons during
time that is otherwise allocated for specials, including PE. Although some administrators and
teachers recognize the benefits of physical activity on learning, there are still only small pockets
8ThispolicyregardingfundsearmarkedforPEwasmentionedbytheinterviewee,buthasnotbeenverifiedwithdocumentation.
Page 34
34
within the school system that are informed about this relationship and acting upon that
knowledge. One PE teacher, for example, indicated that the PE department had a working
relationship with classroom teachers to ensure that students are not taken out of PE class for
significant amounts of time, as he believes that “fitness makes better students.” Whether PE
departments in other schools have also established such standards in their respective schools
remains unclear. However, as the district-level administrator explained, principals, teachers, and
other decision makers are not likely to take a chance on physical activity in the hopes that it will
improve academic performance, as they much rather allocate additional time and resources to
test-preparation in the core subjects.
In Orange County, PE instructors have recently received the support from school
principals to organize countywide meetings that provide the opportunity for PE teachers to share
ideas and insights. The PE instructors visit each other’s classes on early release days to observe
how PE is structured and taught in different schools. This opportunity allows instructors to
discuss activities and teaching strategies that work well, as well those that could be improved. As
one PE teacher explained, this program is especially important because it gives PE instructors the
same opportunities to develop and grow their capabilities that classroom teachers receive through
annual training workshops.
Recess
Although physical education is not a part of the daily schedule in elementary schools,
students do receive time for recess on a daily basis. In most schools, recess is unstructured,
meaning that students are given the liberty to choose what they do with their recess time. One
choice that students have, however, is to refrain from engaging in moderate to vigorous activity.
As many PTA and PTGO presidents pointed out, in unstructured recess settings, students are
Page 35
35
allowed to merely sit and watch their classmates play. Some schools, such as Bethesda
elementary have organized models of recess in which activities and games are organized for
students and coaches ensure that all students are engaged and participating. Bethesda
Elementary, along with 14 other elementary schools in Durham County, are providing organized
recess by collaborating with the national non-profit organization, Playworks.
Playworks works with schools to create organized recess activities and classroom
activities to promote physical activity and improve schools’ learning environments. Playworks
has three distinct benefits that organizers have verified through survey data:
• increasing students’ physical activity,
• crowding out bullying on the playground and improving students’ conflict resolution
skills, and
• increasing students’ readiness and ability to learn within the classroom.
The RWJF sponsored a randomized, controlled study evaluating the outcomes related to
the implementation of the Playworks programs in elementary schools across the nation. The
results of the study show that compared to schools in the control group, Playworks schools had
less bullying, better recess behavior and readiness for class, more time for teaching, and safer
schools. The increase in time for teaching was a direct result of students’ preparedness for class
and ability to focus, as teachers spent less time settling students down after recess and
experienced fewer behavior problems and interruptions during class time. Additionally, nearly
100 percent of teachers in schools where Playworks operated reported that they were satisfied
with the program and wanted it to continue on into the future (Bleeker 2012).
Playworks has established a criterion that in order to participate, schools must have a
participation rate of 50% or more in the free and reduced lunch and breakfast programs. Because
Page 36
36
most schools in Orange County do not meet this criterion, Playworks has not yet established
partnerships in Orange County elementary schools, although potential partnerships are currently
being investigated.
Playworks hires one coach per school that it serves and engages the coach in a full day of
programming. The coach is responsible for organizing recess, in-class activities, and before and
after school programs for students in participating schools. The coach works with each grade for
30 minutes every day during recess to organize various games and activities. While the coaches
do not direct students to participate in particular opportunities, they do reach out to students to
encourage that they engage in various sports and games throughout the year.
Rather than spending a portion of the allocated time for recess teaching students how to
play the games that are being organized, Playworks coaches hold in-class game time every two
to four weeks, during which they use regular class time to explain activities and games to
students. This structure allows Playworks to engage students in physical activity for the full 30
minutes each day that are allocated for recess. Playworks has also established a leadership
program within recess in which 4th and 5th grade students serve as junior coaches assisting in
running recess activities for younger classes. Selected students receive a special T-shirt, training
once a month, mid-year and end-of-year assessments, and an invitation to an end-of-the-year
junior coach conference for all participating schools.
Playworks coaches also organize interscholastic sports programs either before or after
school. Currently, coaches are organizing a co-ed soccer league, a girls’ basketball league, and a
co-ed volleyball league, and are trying to establish an ultimate Frisbee program. In each of the
sports played, no scores are kept, as the intent is not to play to win, but to build team skills and
confidence for students who are unlikely to otherwise participate in organized sports. In addition
Page 37
37
to the interscholastic sports programs, each Playworks coach also runs one other program during
the year within their school such as boys’ basketball, golf, tennis, etc.
The Playworks program charges $25,000 per school. This yearly program fee covers
approximately 40 to 45% of operations costs, which amounts to $115 per student. Durham Public
Schools (DPS) has provided $15,000 in funding per school that operates Playworks, but each
individual school must contribute $10,000 in order to bring the Playworks program to their
campus. Schools must either allocate $10,000 of their discretionary spending budget for
Playworks, or gain funding through other sources such as the PTA or PTGO.
In order for Playworks to successfully partner with schools, the principal and teachers at
each school must buy into the program’s mission and recognize and prioritize the role of play
and physical activity in students’ development. Features such as the in-class game time and
junior coaches program entail reallocating regular class time to promote activity and sometimes
result in students missing out on class time to help run recess programs. Additionally, because
the program costs entail a significant financial burden, school administrators have to be willing
to prioritize recess and activities programming enough to allocate the required resources. Such a
model is only viable if teachers and principals understand the role that recess can play in not only
improving health, but also improving behavior and academic achievement.
While the study evaluating the impact of Playworks showed positive behavioral
outcomes in terms of bullying and readiness to learn, the study did not examine outcomes related
to academic performance. A study evaluating the impact of Playworks on academic
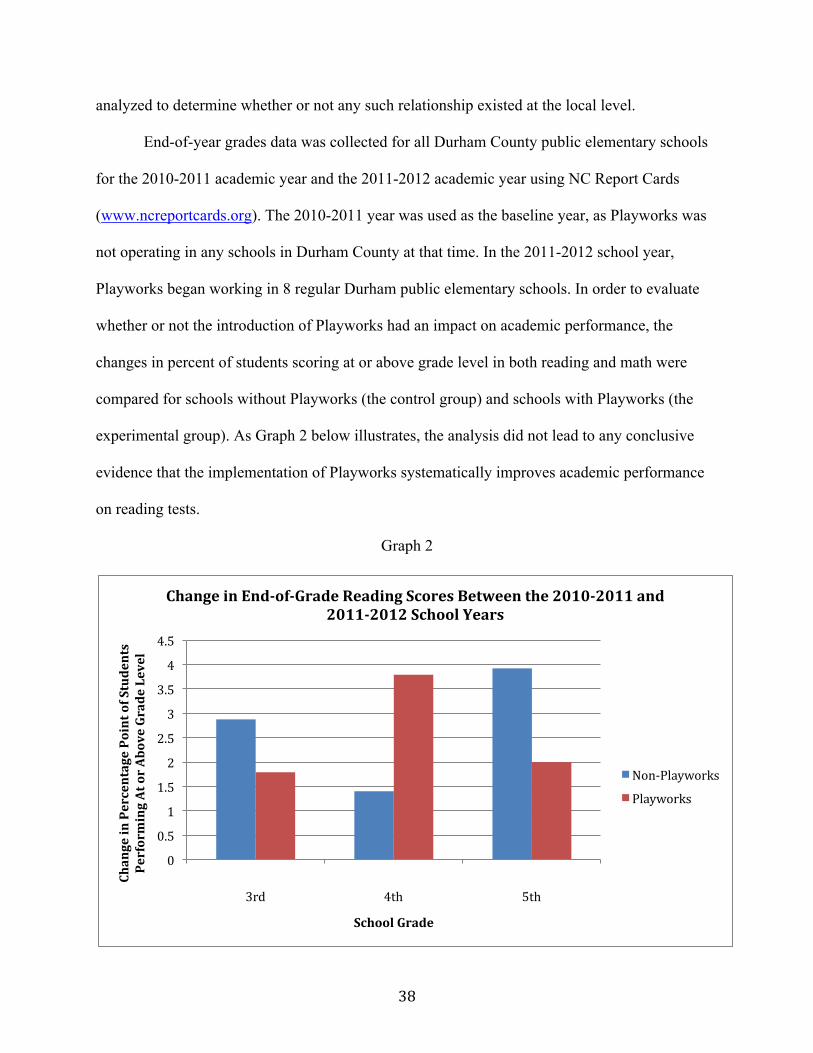
performances is underway, and the report is scheduled to be published in the Spring of 2013.
While data investigating the impact of Playworks on academic performance is not available at
the national level, end-of-year grade reports for Durham County elementary schools were
Page 38
38
analyzed to determine whether or not any such relationship existed at the local level.
End-of-year grades data was collected for all Durham County public elementary schools
for the 2010-2011 academic year and the 2011-2012 academic year using NC Report Cards
(www.ncreportcards.org). The 2010-2011 year was used as the baseline year, as Playworks was
not operating in any schools in Durham County at that time. In the 2011-2012 school year,
Playworks began working in 8 regular Durham public elementary schools. In order to evaluate
whether or not the introduction of Playworks had an impact on academic performance, the
changes in percent of students scoring at or above grade level in both reading and math were
compared for schools without Playworks (the control group) and schools with Playworks (the
experimental group). As Graph 2 below illustrates, the analysis did not lead to any conclusive
evidence that the implementation of Playworks systematically improves academic performance
on reading tests.
Graph 2
0
0.5
1
1.5
2
2.5
3
3.5
4
4.5
3rd 4th 5th
ChangeinPercentagePointofStudents
Perform
ingAtorAboveGradeLevel
SchoolGrade
ChangeinEndofGradeReadingScoresBetweenthe20102011and20112012SchoolYears
Non‐Playworks
Playworks
Page 39
39
Similarly, the data indicates that Playworks has no systematic impact on improving outcomes on
math tests, as illustrated in Graph 3 below.
Graph 3
However, it is important to note that this analysis may be premature, as Playworks has
only been operating in Durham County schools for one complete academic year to date. It is
plausible that changes in academic performance as a result of the program take longer to
manifest themselves, and may only be detectable after a few years of operation within the school
system.
Beyond the programming costs of partnering with outside organizations, schools and
0
2
4
6
8
10
12
14
3rd 4th 5th
ChangeinPercentagePointofStudents
Perform
ingAtorAboveGradeLevel
SchoolGrade
ChangeinEndofGradeMathScoresBetweenthe20102011and20112012SchoolYears
Non‐Playworks
Playworks
Page 40
40
PTA/PTGOs also often face the challenge of financing equipment and recreational facilities for
recess. For example, the PTA at Pearsontown Elementary has funded recess equipment for each
teacher’s class and is also interested in upgrading the school’s baseball field, but the current
estimated cost is beyond the budget allocation (Pearsontown Elementary Wellness Committee
2012). In previous years the Pearsontown PTA was also interested in building a track at the
school, but the estimates provided by DPS were too high and the project could not be
undertaken. At Cameron Park Elementary, a portion of the playground has been lost due to the
placement of classroom trailers that were required to accommodate a growing number of
students. The school is now seeking to invest in new recess equipment at the cost of $50,000.
Additional Programming
Many schools, PTAs, and PTGOs are engaging in additional programming to encourage
healthy behaviors among students. Cameron Park Elementary has implemented a program in
which students earn rewards for running laps during recess throughout the year. The program
culminates at the end of the year with a celebration in the school gym where students are
awarded special T-shirts according to the number of laps they ran throughout the year. Teachers
at Cameron Park Elementary also run after-school sports clubs that students in second to fifth
grade can participate in. According to one teacher, 80% of students in second through fifth grade
participate in a variety of clubs including running, tap dancing, ultimate Frisbee, cheerleading,
and yoga. Efland Cheeks Elementary has also established a running-focused initiative with its
voluntary Girls on the Run program. Pearsontown Elementary had a running club called Panda
Pacers in the past, but the program died down after it became evident that the school and PTA
could not afford to build a track. The PTA at Bethesda Elementary has expressed interest in
starting a walking club in the morning for parents and students alike, but there are doubts
Page 41
41
concerning parent participation rates in the program. The Bethesda Elementary PTA president
also hopes to establish a sports tournament within and among schools in the county. The idea is
for students in each grade to form teams and compete in sports such as volleyball and basketball.
Winners of round-robin tournaments at each school would then play each other in countywide
tournaments. This program is still in the ideation phase, and it remains to be seen whether or not
the necessary funds and interest can be garnered to start the initiative.
VI.Conclusions
BarrierstotheImplementationofObesityPreventionPolicies
Conversations with relevant stakeholders in Durham and Orange counties have revealed
that are four categories of obstacles that hinder the implementation of wellness programs and
policies in elementary schools: finances, institutional support, participation, and involvement and
at home.
Finances have long been identified as a barrier to the implementation of wellness
policies; however, they have been discussed in a different light. The literature, for example,
indicated that finances are a barrier to the implementation of wellness policies because schools
face incentives to engage in the sale of unhealthy competitive foods in order to raise additional
revenues to cover the costs of food services programs. Interviews revealed that food sales
through the food services program are highly regulated and directed at the district level. This
indicates that the sales of foods of minimal nutritional value are limited during the operation of
school meals and that individual schools have little discretion in selling competitive foods during
meals. The popularity and profitability of selling foods of minimal nutritional value through
school fundraisers do still exist, however. Although some schools are making significant efforts
Page 42
42
to move away from such practices, it appears as though many schools still engage in the use of
candies, cookie dough, donuts, and other unhealthy snacks for fundraising events. Finances are
also considered a barrier because schools do not have money to invest in additional programs
and policies they believe would be beneficial. For improving both nutrition and physical activity
programs in schools, stakeholders believe it is important to have additional funds to invest in
program costs such as planning, equipment, and labor.
The policy environment of each school is heavily dependent on the directive that school
principals and classroom teachers take. For example, various PTA and PTGO presidents pointed
to institutional support and communication as factors that can either drive or hinder the
implementation of wellness policies and programs in schools. When principals are invested in
promoting wellness initiatives and open about communicating relevant information between the
county administration and the PTA or PTGO, there is a more collaborative environment for the
implementation of wellness policies. Principals are key-decision makers in discretionary
spending and school programming. Given that physical education and recess programs are
largely funded through discretionary spending, the success of these projects is heavily dependent
on the willingness to allocate limited resources towards them. Teachers can also greatly
influence the extent to which nutrition and physical activity are promoted within the classroom.
Depending on how individual teachers prefer to run their classes, students may or may not be
encouraged to engage in moderate physical activity throughout the school day. For example,
some teachers encourage students to get up, walk around, and stretch between learning modules
throughout the day. The individual emphasis that teachers place on the importance of staying
active throughout the day can greatly influence the wellness environment that students
experience. Furthermore, teachers and principals must be willing to allocate time and resources
Page 43
43
that could otherwise be spent on traditional classroom subjects to promote physical activity.
Wellness policies and programs that are implemented in schools will only be effective if
students are engaged and participating. As noted by many stakeholders, the value of offering
meals that follow strict nutrition guidelines are limited if students are not eating the foods that
they are served. Similarly, merely providing the opportunity for physical activity is not of any
significant benefit if students are able to choose not to participate and refrain from increasing
their heart rates. Initiatives encouraging healthy eating and physical activity will only help in
preventing childhood obesity if students are invested and partaking in such programs.
The success of wellness policies and programs in schools also depends on how invested
parents are in promoting healthy behaviors. As many stakeholders noted, while schools can
control what foods are served through the cafeteria, the schools cannot monitor the nutritional
content of foods packed from home. As a result, it is important to ensure that parents as well as
schools are promoting healthy habits for students. Additionally, parental support and
involvement is integral to the success of physical activity programming conducted beyond
normal school hours. Parents must be invested enough to involve their children in before and
after school programming, and also to participate in programs intended for parents and students
alike. Getting parents to invest in healthy behaviors is also important for ensuring that students
are eating healthy foods and engaging in physical activity once they are outside of the school
environment. Even if schools are promoting healthy behaviors during the school day, the impact
of their efforts will be mitigated if parents are not also facilitating healthy choices at home.
Parents are often constrained by the time investment that is required to make healthy choices and
the financial costs of doing so, especially because healthier foods are generally more expensive.
Educating parents about the benefits of exercising and eating healthy and demonstrating ways in
Page 44
44
which they can accomplish those goals are important components of getting parents to invest in
making healthy choices for themselves and their children. As a result, some stakeholders believe
that an integral part of the solution to student wellness is to actively engage and educate their
parents.
OvercomingIdentifiedBarriers
Identifying the barriers to the successful implementation of obesity prevention policies in
elementary schools is useful for understanding what measures can be taken to overcome such
obstacles and where opportunities for improvements exist. The results of this research indicate
that while nutrition policies are heavily guided at the federal and district levels, schools have
more discretion in establishing physical activity policies and programs. The research also
indicates that there are larger gaps in the implementation of physical education policy than in
nutrition policy. For example, nutrition standards for school meals and competitive foods, along
with the availability of snacks and beverages through vending machine services, appear to be
implemented according to policy. On the other hand, physical activity policies are not adhered to
as stringently. Schools are not providing students with the recommended amount of time in PE
class, and many schools do not have mechanisms to ensure that all students are engaged in
moderate to vigorous physical activity during recess which is provided daily.
As a result, schools facing limited resource availabilities may be well advised to focus
efforts on improving physical activity policies and programs. Schools can improve physical
education policies by increasing scheduled class time for PE. Additionally, schools can
implement a number of programs to engage students in physical activity during recess and inside
the classroom. While Playworks seems like a worthwhile investment for schools which are
eligible to form a partnership, schools which are ineligible might consider creating organized
Page 45
45
models of recess on their own. One such example is the Namaste Charter School in Chicago,
which hired a playground coach on its own accord to ensure that students are engaged in recess
through a variety of different activities (Active Schools Acceleration Project). In fact, Playworks
offers training programs to all schools, regardless of participation rates in the free and reduced
lunch program, in order to help improve recess environments for all students. Another approach
to increasing activity during recess is to reward students for their participation. As noted before,
Cameron Park Elementary implements such a program by rewarding students for the number of
laps they run during recess over the year, and this model has also been used by other schools in
the nation, such as Meadowview Elementary in Farmington, Minnesota. Many schools are also
implementing programs to increase the amount of activity that students receive inside the
classroom. Conlee Elementary in Las Cruces, New Mexico has leveraged the rising popularity of
video games that involve physical activity and exercise (“exergames”) by broadcasting routines
from the Just Dance video game for the Nintendo Wii on classroom televisions at the beginning
of each day. Students and teachers alike watch the videos that are broadcast to learn and perform
choreographed routines to popular songs. One teacher at Conestoga Elementary in Gillete,
Wyoming has sought to keep students active by taking short exercise breaks every 15-20 minutes
throughout the day. The classroom is also equipped with six stationary exercise bikes outfitted
with desktops that students can use while reading, studying, and taking tests. Innovative
solutions such as these programs can drastically improve the amount of physical activity that
students receive during the school day (Active Schools Acceleration Project).
Given that institutional support is a crucial factor in the success of physical activity
programs in schools, educating principals and teachers about the benefits of physical activity on
academic performance could be an important first step in fostering change. Educators who are
Page 46
46
concerned with improving student performance on standardized testing in order to maximize
their compensation may not be easily persuaded to support physical activity programs solely on
the grounds of health benefits. However, if educators are informed about recent research that
indicates that physical activity improves students’ ability to learn and performance on
standardized tests, they may be more prone to providing the support necessary for physical
activity initiatives to succeed.
It is also important that schools continue to reach out to parents and educate them on the
importance of proper nutrition and physical activity. As many stakeholders indicated, in order to
reverse trends in childhood obesity, students’ behaviors must change beyond the classroom.
While many schools seek to inform parents by posting educational messages in newsletters and
monthly school menus that are sent home, schools could attempt to engage parents more directly.
While sending information home with students is important, it may not be the most effective way
of ensuring that parents are aware of the risks of obesity and the benefits of wellness promotion.
Although such programs would entail additional time and resource costs, schools could
experiment with holding interactive classes with parents as well as students regarding healthful
living. For example, the Namaste Charter School holds a free fitness class open to parents during
the day and after school. This class, called “Commit to be Fit”, is intended to increase the
likelihood that that healthy habits taught at school become permanent changes to the lifestyles of
students and their families (Active Schools Acceleration Project). Creating opportunities for
students and parents alike to engage in healthy behaviors could play an important role in
ensuring that students are engaging in healthy habits beyond school hours.
Increasing channels for communication among various stakeholders can facilitate the
improvement of wellness policies and programs in schools. For example, various PTA/PTGOs
Page 47
47
could benefit by sharing experiences and insights, much like PE teachers in Orange County have
recently done so. For example, PTA/PTGOs that engage in the sale of foods of minimal
nutritional value may benefit from hearing the experiences of schools such as Pearsontown
Elementary that have been more successful in raising funds through activity-based programs.
Furthermore, conversations with numerous stakeholders indicated that there is often a
misunderstanding of how programs are implemented in schools. For example, administrators at
the district level seemed to be misinformed about the amount of time that students spend in PE
class each week. Creating more avenues for communication and focusing on building working
relationships between stakeholders at different levels of the school system can also facilitate the
implementation of wellness policies in schools and identify gaps in execution of policies as they
were intended.
LimitationsandFutureResearch
While this study has exposed some of the important barriers that prevent schools from
successfully implementing wellness policies and programs, future research is necessary for a
more complete understanding. Important stakeholders that influence school policies such as
school principals, classroom teachers, district superintendents, and wellness coordinators were
unavailable for interviews during this study. It would be helpful to understand the perspectives
and concerns of such stakeholders to better understand how policy agendas and implementation
can be improved. Furthermore, given the small sample size of this study, the results may not be
generalized to elementary schools in other districts. Expanding the geographic sampling of
schools would help policy makers understand obstacles that schools face on a broader scale.
Using a larger sample of schools could also be useful in pointing to variations in policy
implementation that are not discernable with such a small sample size. For example, the
Page 48
48
particular challenges that schools face in implementing policies may be related to factors such as
the affluence of communities which schools serve, and the urban or rural environment in which
schools are located, among others. In order to observe such associations, however, a larger and
more diverse sample of schools is required.
Page 49
49
Appendix 1: Nutrition Standards for Type A and Type B Meals Established in 1946
TypeA TypeBWholeMilk ½pint 2pintRaw,cooked,orcannedvegetablesorfruits,orboth
¾cup ½cup
Bread,muffinsorhotbreadmadeofwholegraincerealorenrichedflour
1portion 1portion
ButterorFortifiedMargarine
2tsp 1tsp
Freshorprocessedmeat,poultrymeat,cheese,cookedorcannedfish*
2oz. 1oz.
Drypeasorbeansorsoybeans,cooked*
½cup ¼cup
PeanutButter* 4tbsp. 2tbsp.Eggs* 1 ½*Anycombinationofthesefoodstoprovideprotein‐richfood
Page 50
50
Appendix 2: Comparison of Current Federal and NC State Nutrition Guidelines for Reimbursable Lunches
2010FederalStandards NCStateStandards
Calories
Minimum550,Maximum650
20‐35%caloriesfromfataveragedover1week
TotalCaloriesfromSaturatedFat
<10%weeklyaverage ≤10%averageover1week
TransFat Zerogramsperportion LowaspossibleSodiumLevels ≤640mgweeklyaverage LowaspossibleCholesterol N/A 200mgaveragedover1
weekPreparationmethods N/A Baking,roasting,broiling,
boiling,steamingWholeGrain 8‐9servingsperweek Minimum1dailyserving,
graduallyincreaseto8servingsperweek
FruitsandVegetablesServings
2.5cupsoffruitand3.75cupsofvegetablesperweek
4fruitsand/orvegetablesoffereddaily
FruitsandVegetablesTypes
N/A Canned,frozen,fresh,ordried
FruitsandVegetablesPreparationMethods
N/A Baking,roasting,broiling,boiling,ansteaming
FruitsandVegetablesVariety
DarkGreen:0.5cupsweeklyOrange:0.75cupsweeklyStarchy:0.5cupsweeklyOther:0.5cupsweekly
Darkgreen,deepyellowororangevarietiesofferedatleast3timesaweek
FreshFruitsandVegetables
N/A Offeredatleast4timesaweek
Legumes 0.5cupsweekly Offeredatleast1timeaweek
Milk 5cupsweekly,fatfree 1%oflessfat
Page 51
51
Appendix 3: NC State Nutrition Standards for A la carte Foods and the After School Snack Program
Alacartefoodsand
beveragesAfterSchoolSnackProgram
CaloriesfromFat
≤35%,excludingseedsandnuts
≤35%,excludingseedsandnuts
TotalCaloriesfromSaturatedFat
≤10% ≤10%
TransFat ≤1% ≤1%Milk 1%orlessfat 1%orlessfatSugar ≤35%byweight ≤35%byweightServingSize Itemservingsizemustbe
thesameasservingsizeofferedaspartofreimbursablemealwithalimitofoneadditionalentréeportion
N/A
Nuts/Seeds ≤1ozportion ≤1ozportionYogurt/FrozenYogurt Singleserving SingleservingWater Juice 50%ormorefruitjuice,no
addedsweetener50%ormorefruitjuice,noaddedsweetener
FrozenFruitProducts 100%frozenfruitproductswithnoaddedsweeteners
100%frozenfruitproductswithnoaddedsweeteners
ProhibitedItems Sodawater(sodapop),waterices,chewinggum,processedfoodsmadepredominantlyfromsweetenerswithavarietyofminoringredients(hardcandy,jelliesandgums,marshmallowcandies,fondant,licorice,spuncandy,candycoatedpopcorn),confectionsandcarbonateddrinks
Sodawater(sodapop),waterices,chewinggum,processedfoodsmadepredominantlyfromsweetenerswithavarietyofminoringredients(hardcandy,jelliesandgums,marshmallowcandies,fondant,licorice,spuncandy,candycoatedpopcorn),confectionsandcarbonateddrinks
Page 52
52
Appendix 4: School Improvement Options
Source: http://www2.ed.gov/policy/elsec/guid/secletter/020724.html#chart
A school is identified for school improvement after it has not made AYP for two consecutive school years. A school moves to the next "step" or "year" in this chart if it continues to not make AYP.
School Improvement (Year One)
In general, schools identified for improvement must receive technical assistance that enables them to specifically address the academic achievement problem that caused the school to be identified for improvement. The LEA is required to provide technical assistance as the school develops and implements the plan, including specific assistance in analyzing assessment data, improving professional development, and improving resource allocation. In addition, the following must take place:
1. All students are offered public school choice. 2. Each school identified for improvement must develop or revise a two-year school
improvement plan, in consultation with parents, school staff, the local educational agency, and other experts, for approval by the LEA. The plan must incorporate research-based strategies, a 10 percent set-aside of Title I funds for professional development, extended learning time as appropriate (including school day or year), strategies to promote effective parental involvement and mentoring for new teachers.
School Improvement,
(Year Two)
1. Make available supplemental educational services to students from low-income families. In addition, the LEA continues to offer technical assistance to implement the new plan, and offer public school choice.
Corrective Action (Year Three)
Corrective Action requires an LEA to take actions likely to bring about meaningful change at the school. To accomplish this goal, LEAs are required to take at least one of the following corrective actions, depending on the needs of the individual school:
1. Replace school staff responsible for the continued failure to make AYP; 2. Implement a new curriculum based on scientifically based research (including professional
development); 3. Significantly decrease management authority at the school level; 4. Extend the school day or school year; 5. Appoint an outside expert to advise the school on its progress toward making AYP in
accordance with its school plan; OR 6. Reorganize the school internally.
In addition, the LEA continues to offer technical assistance, public school choice and supplemental educational services.
Restructuring (Year Four)
During the first year of restructuring, the LEA is required to prepare a plan and make necessary arrangements to carry out one of the following options:
1. Reopen school as charter school. 2. Replace principal and staff. 3. Contract for private management company of demonstrated effectiveness. 4. State takeover. 5. Any other major restructuring of school governance.
In addition, the LEA continues to offer public school choice and supplemental educational services. Implementation of
Restructuring (Year Five)
Implement alternative governance plan no later than first day of school year following year four described above.
Page 53
53
Bibliography Anderson,PatriciaM.,andKristinF.Butcher.2006."ChildhoodObesity:Trendsand
PotentialCauses."TheFutureofChildrenno.16(1):19‐45.Association,NationalAssociationforSportandPhysicalEducation&AmericanHeart.2010.
ShapeoftheNationReport2010:StatusofPhysicalEducationintheUSA.Reston,VA.
Bandini,L.G.,D.Vu,A.Must,H.Cyr,A.Goldberg,andW.H.Dietz.1999."Comparisonof
high‐calorie,low‐nutrient‐densefoodconsumptionamongobeseandnon‐obeseadolescents."Obesityresearchno.7(5):438‐43.
Bleeker,M.,James‐BurdumyS.,BeylerN.,DoddAH.,LondonRA.,WestrichL.,Stokes‐Guinan
K.,andCastrechiniS.2012.FindingsfromaRandomizedExperimentofPlayworks:SelectedResultsfromCohort1.
ChildNutritionandWICReauthorizationActof2004.2004.Coffield,J.Edward,JulieM.Metos,RebeccaL.Utz,andNormanJ.Waitzman.2011."A
multivariateanalysisoffederallymandatedschoolwellnesspoliciesonadolescentobesity."TheJournalofadolescenthealth:officialpublicationoftheSocietyforAdolescentMedicineno.49(4):363‐70.
Committee,PearsontownElementaryWellness.2012.WellnessCommitteeMeetingNotes
8‐28‐12.Cradock,AngieL.,AnneMcHugh,HelenMont‐Ferguson,LindaGrant,JessicaL.Barrett,Y.
ClaireWang,andStevenL.Gortmaker.2011."Effectofschooldistrictpolicychangeonconsumptionofsugar‐sweetenedbeveragesamonghighschoolstudents,Boston,Massachusetts,2004‐2006."Preventingchronicdiseaseno.8(4):A74.
EatSmart,MoveMoreNC.TheBurdenofObesityinNorthCarolina.Availablefrom
http://www.eatsmartmovemorenc.com/ObesityInNC/ObesityInNC.html.Foundation,RobertWoodJohnson.2011.Dostudentswhoaremoreactivedobetterin
school?:RobertWoodJohnsonFoundation———.2012.ChildhoodObesity:TheChallenge.RobertWoodJohnsonFoundation
20122012].Availablefromhttp://www.rwjf.org/childhoodobesity/challenge.jsp.Gaines,AlishaB.,StevenR.Lonis‐Shumate,andSareenS.Gropper.2011."Evaluationof
Alabamapublicschoolwellnesspoliciesandstateschoolmandateimplementation."TheJournalofschoolhealthno.81(5):281‐7.doi:10.1111/j.1746‐1561.2011.00588.x.
Page 54
54
Gunderson,GordonW.1971.NationalSchoolLunchProgramBackgroundandDevelopment.
Hammond,RossA.,Ruth,Levine..2010."TheeconomicimpactofobesityintheUnited
States."Diabetes,MetabolicSyndromeandObesity:TargetsandTherapy.Han,JoanC.,DebbieA.Lawlor,andSueY.S.Kimm.2010."Childhoodobesity."TheLancet
no.375(9727):1737‐1748.doi:10.1016/s0140‐6736(10)60171‐7.HealthyActiveChildren.2005.NCStateBoardofEducation.Hoxie‐Setterstrom,Gail,andBarbaraHoglund.2011."Schoolwellnesspolicies:
opportunitiesforchange."TheJournalofschoolnursing:theofficialpublicationoftheNationalAssociationofSchoolNursesno.27(5):330‐9.
Jones,SonyaJ.,WendyGonzalez,andEdwardA.Frongillo.2010."Policiesthatrestrict
sweetenedbeverageavailabilitymayreduceconsumptioninelementary‐schoolchildren."Publichealthnutritionno.13(4):589‐95.
Lyn,R.,S.O'Meara,V.A.Hepburn,andA.Potter.2011."StatewideEvaluationofLocal
WellnessPoliciesinGeorgia:AnExaminationofPolicyCompliance,PolicyStrength,andAssociatedFactors."JNutrEducBehav.doi:10.1016/j.jneb.2010.12.001.
Nanney,MarilynS.,TobenNelson,MelanieWall,TarekHaddad,MarthaKubik,Melissa
NelsonLaska,andMaryStory.2010."Stateschoolnutritionandphysicalactivitypolicyenvironmentsandyouthobesity."Americanjournalofpreventivemedicineno.38(1):9‐16.
Nielsen,SamaraJoy,AnnaMariaSiega‐Riz,andBarryM.Popkin.2002."TrendsinEnergy
IntakeinU.S.between1977and1996:SimilarShiftsSeenacrossAgeGroups."Obesityno.10(5):370‐378.
NorthCarolinaAllianceforAthletics,Health,PhysicalEducation,Recreation,andDance.
2012.TheIsPODInitiative.NutritionStandardsforElementarySchools.2006.NCGeneralAssemblyObama,Michelle.2010.FirstLadyColumnonHealthierSchools.Let'sMove!Obesity,NorthCarolinaTaskForceonPreventingChildhood.2009.ReportfromtheNorth
CarolinaTaskForceonPreventingChildhoodObesity:ReversingtheRisingTrendby2015.
Organization,WorldHealth.2011.ObesityandOverweight.WorldHealthOrganization
20112011].Availablefromhttp://www.who.int/mediacentre/factsheets/fs311/en/index.html.
Page 55
55
Pekruhn,Colin.2009.PreventingChildhoodObesity:ASchoolHealthPolicyGuide.PhysicalActivityandHealthyEating2006.OrangeCountyBoardofEducation.PittBarnes,Seraphine,LeahRobin,TerrenceP.O'Toole,NicolaDawkins,LauraKettelKhan,
andLauraC.Leviton.2011."Resultsofevaluabilityassessmentsoflocalwellnesspoliciesin6USschooldistricts."TheJournalofschoolhealthno.81(8):502‐11.doi:10.1111/j.1746‐1561.2011.00620.x.
Prevention,CentersforDiseaseControland.2002.2002CDCGrowthChartsfortheUnited
States:MethodsandDevelopment.InVitalandHealthStatistics.Probart,Claudia,ElaineT.McDonnell,LamisJomaa,andVondaFekete.2010."Lessonsfrom
Pennsylvania'smixedresponsetofederalschoolwellnesslaw."Healthaffairs(ProjectHope)no.29(3):447‐53.
Project,ActiveSchoolsAcceleration.Availablefromhttp://www.activeschoolsasap.org/.Ratey,JohnJ.,andEricHangerman.2008.Spark:TheRevolutionaryNewScienceofExercise
andtheBrain.NewYork,NY:Little,BrownandCompany.Reilly,JJ,EMethven,ZCMcDowell,BHacking,DAlexander,LStewart,andCJHKelnar.
2003."Healthconsequencesofobesity."ArchivesofDiseaseinChildhoodno.88(9):748‐752.doi:10.1136/adc.88.9.748.
RichardB.RussellNationalSchoolLunchAct1946.Roberts,ChristianK.;Freed,Benjamin;McCarthy,WilliamJ.May2010."LowAerobic
FitnessandObesityAreAssociatedwithLowerStandardizedTestScoresinChildren."TheJournalofPediatricsno.156(5):711‐718.
Sanchez‐Vaznaugh,EmmaV.,BrisaN.Sanchez,JonggyuBaek,andPatriciaB.Crawford.
2010."'Competitive'foodandbeveragepolicies:aretheyinfluencingchildhoodoverweighttrends?"Healthaffairs(ProjectHope)no.29(3):436‐46.
SchoolWellnessPolicy.2012.DurhamCountyBoardofEducationService,U.S.DepartmentofAgricultureFoodandNutrition.2010.SummaryoftheHealthy,
Hunger‐FreeKidsActof2010(ByProgram).Sharma,M.2007."Internationalschool‐basedinterventionsforpreventingobesityin
children."ObesityReviewsno.8(2):155‐167.doi:10.1111/j.1467‐789X.2006.00268.x.
States,United.1966.ChildNutritionAct
Page 56
56
Story,Mary,KarenM.Kaphingst,andSimoneFrench.2006."TheRoleofSchoolsinObesity
Prevention."TheFutureofChildrenno.16(1):109‐142.Story,Mary,MarilynS.Nanney,andMarleneB.Schwartz.2009."SchoolsandObesity
Prevention:CreatingSchoolEnvironmentsandPoliciestoPromoteHealthyEatingandPhysicalActivity."MilbankQuarterlyno.87(1):71‐100.doi:10.1111/j.1468‐0009.2009.00548.x.
Strong,WilliamB.,et.al..2005."Evidencebasedphysicalactivityforschool‐ageyouth."
JournalofPediatricsno.146(6):732‐7.Trost,StewartG..2007.ActiveEducation:PhysicalEducation,PhysicalActivityand
AcademicPerformance.InActiveLivingResearchVendingMachineSales.2005.NCGeneralAssembly.Vinciullo,F.M.,andB.J.Bradley.2009."Acorrelationalstudyoftherelationshipbetweena
coordinatedschoolhealthprogramandschoolachievement:acaseforschoolhealth."JSchNursno.25(6):453‐65.doi:10.1177/1059840509351987.