26
Regional Analysis: Americas OCTOBER, 2018 Overcoming disconnects on the path to digital transformation THE INDUSTRY 4.0 PARADOX

Regional Analysis: AmericasO C T O B E R , 2 0 1 8
Overcoming disconnects on the path to digital transformation
T H E I N D U S T R Y 4 . 0 P A R A D O X

2 | Copyright © 2018 Deloitte Development LLC. All rights reserved.
Industry 4.0 ParadoxA global survey of how companies are investing in Industry 4.0-driven capabilities to enable digital transformation
E X E C U T I V E S ( D I R E C T O R + ) 361
UNDERSTANDHow and where they are investing -- or planning to invest -- in digital transformation
Key challenges they face in making such investments
How they are forming their technical and organizational strategy around digital transformation.
The era known as Industry 4.0 has opened up new opportunities to drive innovation and growth in business operations, processes, and production. But how are organizations planning to invest in digital transformation? Where and how do they planto use digital technologies?
C O U N T R I E S11
I N D U S T R I E S :
A e r o s p a c e a n d D e f e n s e , A u t o m o t i v e , C h e m i c a l s a n d S p e c i a l t y M a t e r i a l s , I n d u s t r i a l M a n u f a c t u r i n g , P o w e r , O i l & G a s , a n d M i n i n g
7
R E V E N U E
$500MM+
S U R V E Y B Y T H E N U M B E R S :
3 | Copyright © 2018 Deloitte Development LLC. All rights reserved.
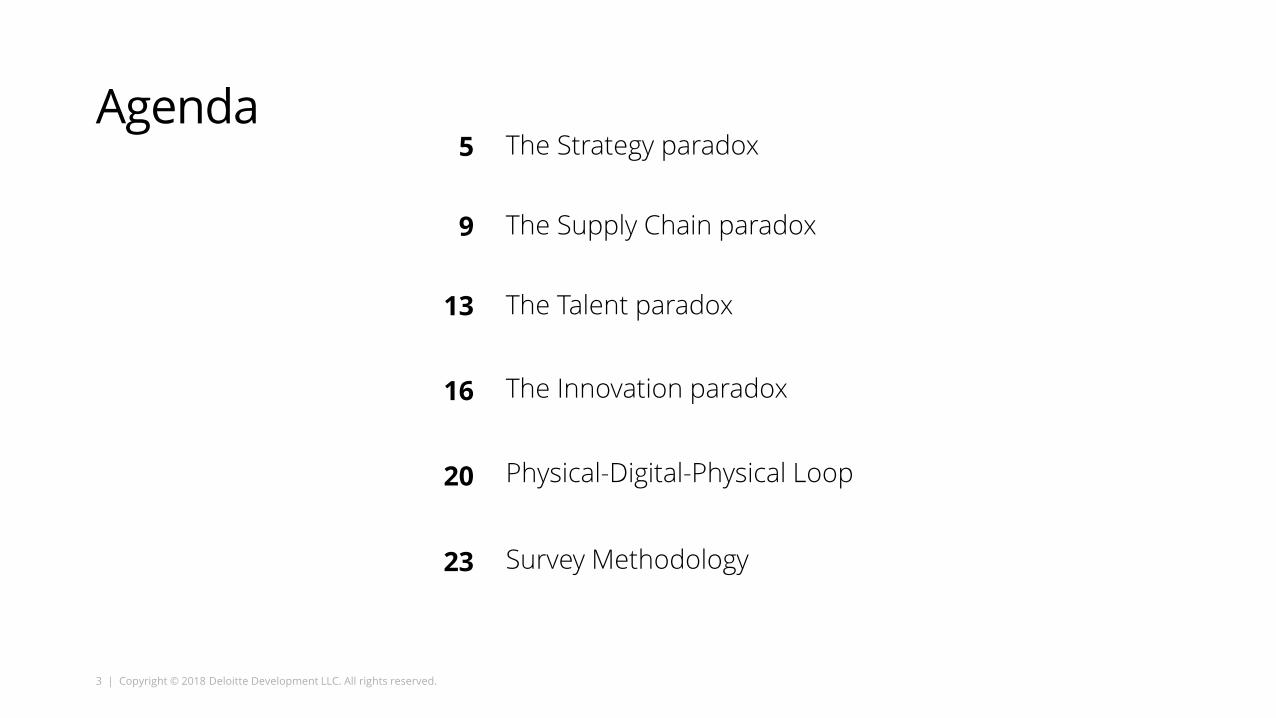
Agenda5
9
The Strategy paradox
The Supply Chain paradox
13 The Talent paradox
16 The Innovation paradox
20 Physical-Digital-Physical Loop
23 Survey Methodology
4 | Copyright © 2018 Deloitte Development LLC. All rights reserved.
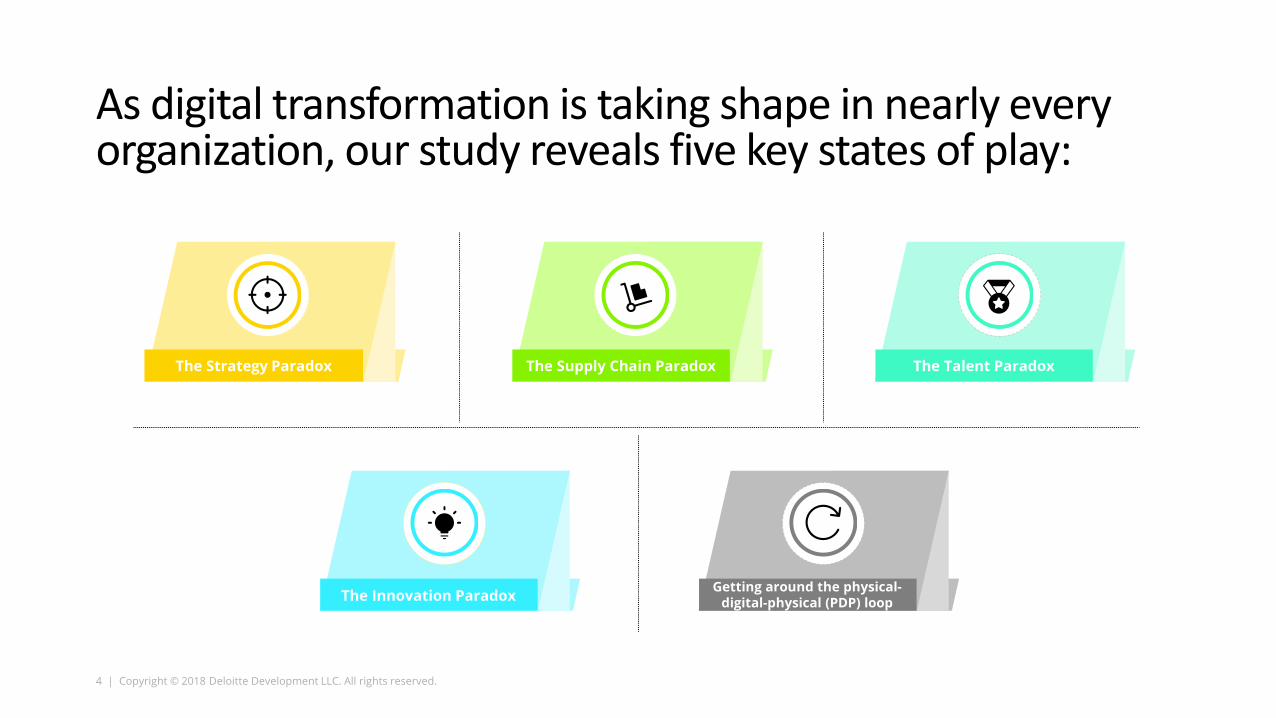
As digital transformation is taking shape in nearly every organization, our study reveals five key states of play:
The Strategy Paradox The Supply Chain Paradox The Talent Paradox
The Innovation Paradox Getting around the physical-digital-physical (PDP) loop

The Strategy paradox
6 | Copyright © 2018 Deloitte Development LLC. All rights reserved.
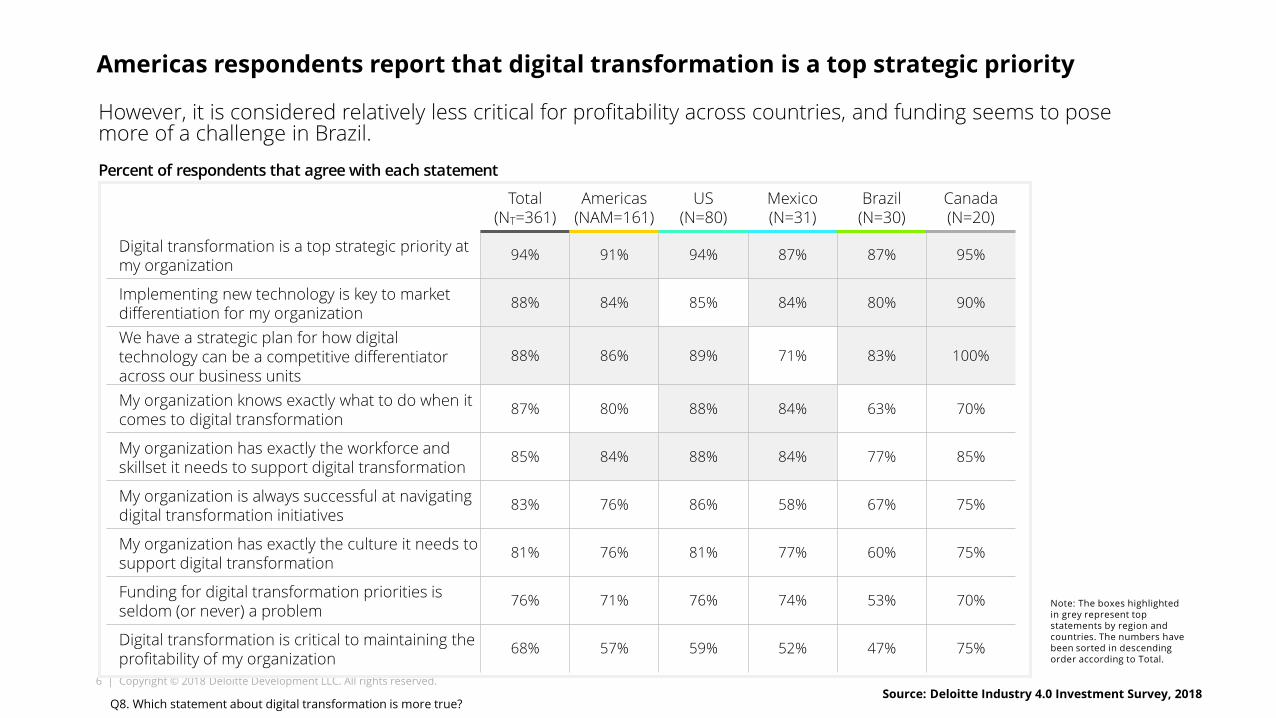
Americas respondents report that digital transformation is a top strategic priority
Total (NT=361)
Americas(NAM=161)
US(N=80)
Mexico(N=31)
Brazil(N=30)
Canada(N=20)
Digital transformation is a top strategic priority at my organization
94% 91% 94% 87% 87% 95%
Implementing new technology is key to market differentiation for my organization
88% 84% 85% 84% 80% 90%
We have a strategic plan for how digital technology can be a competitive differentiator across our business units
88% 86% 89% 71% 83% 100%
My organization knows exactly what to do when it comes to digital transformation
87% 80% 88% 84% 63% 70%
My organization has exactly the workforce and skillset it needs to support digital transformation
85% 84% 88% 84% 77% 85%
My organization is always successful at navigating digital transformation initiatives
83% 76% 86% 58% 67% 75%
My organization has exactly the culture it needs to support digital transformation
81% 76% 81% 77% 60% 75%
Funding for digital transformation priorities is seldom (or never) a problem
76% 71% 76% 74% 53% 70%
Digital transformation is critical to maintaining the profitability of my organization
68% 57% 59% 52% 47% 75%
Note: The boxes highlighted in grey represent top statements by region and countries. The numbers have been sorted in descending order according to Total.
However, it is considered relatively less critical for profitability across countries, and funding seems to pose more of a challenge in Brazil.
Source: Deloitte Industry 4.0 Investment Survey, 2018Q8. Which statement about digital transformation is more true?
Percent of respondents that agree with each statement

7 | Copyright © 2018 Deloitte Development LLC. All rights reserved.
A majority of organizations in Americas region plan to significantly increase their investments in digital transformation technologies, even more than global
Canadian respondents are most likely to report plans to increase investment significantly, followed by those in the U.S.
12%
35%
51%
11%
28%
61%
Stay the same Increase somewhat Increasesignificantly
Total Americas
NT= 361 (Total) ;NAM= 161 (Americas); NUS-80; NM-31; NB-30; NC-20
10%
21%
69%
6%
42%48%
20%
33%
43%
0%
25%
75%
Stay the same Increase somewhat Increase significantly
United States Mexico Brazil Canada
Source: Deloitte Industry 4.0 Investment Survey, 2018
Expected changes in digital transformation technologies/capabilities investments over the next year
Q11. How do you expect your investment in digital transformation and its related technologies/ capabilities to change over the next year?
8 | Copyright © 2018 Deloitte Development LLC. All rights reserved.
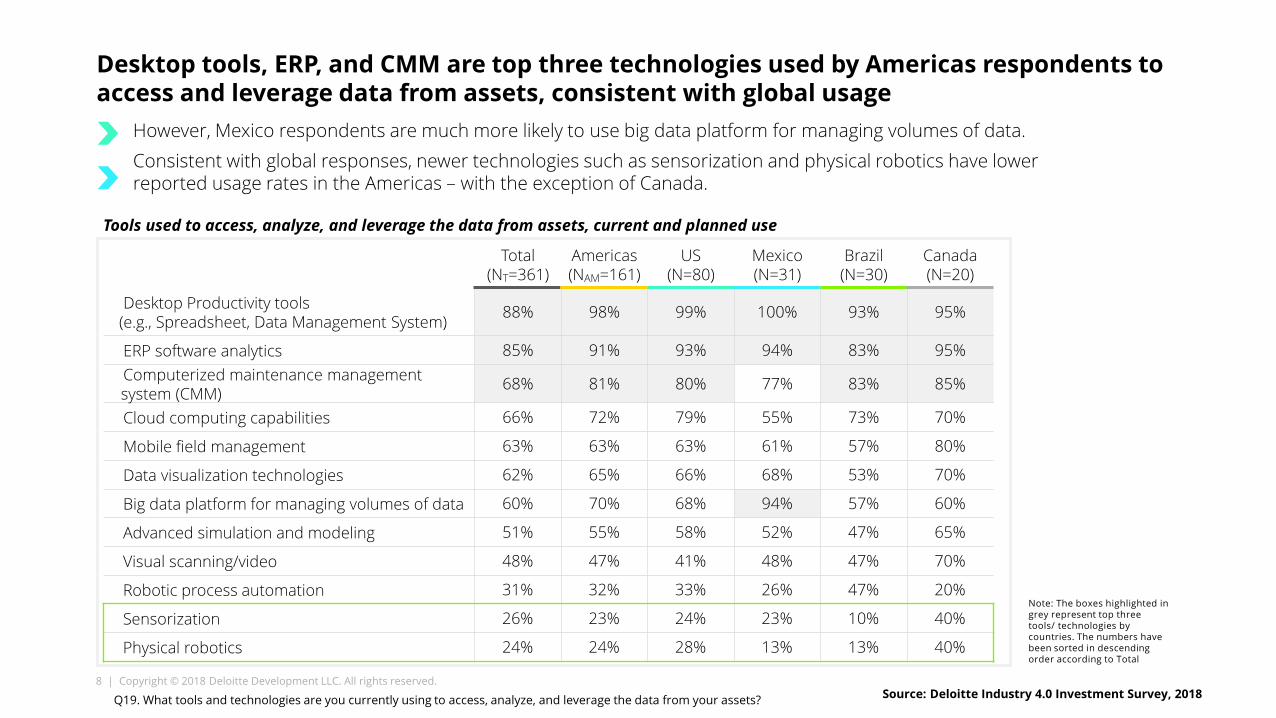
Desktop tools, ERP, and CMM are top three technologies used by Americas respondents to access and leverage data from assets, consistent with global usage
Total (NT=361)
Americas(NAM=161)
US(N=80)
Mexico(N=31)
Brazil(N=30)
Canada(N=20)
Desktop Productivity tools(e.g., Spreadsheet, Data Management System) 88% 98% 99% 100% 93% 95%
ERP software analytics 85% 91% 93% 94% 83% 95%Computerized maintenance management system (CMM) 68% 81% 80% 77% 83% 85%
Cloud computing capabilities 66% 72% 79% 55% 73% 70%
Mobile field management 63% 63% 63% 61% 57% 80%
Data visualization technologies 62% 65% 66% 68% 53% 70%
Big data platform for managing volumes of data 60% 70% 68% 94% 57% 60%
Advanced simulation and modeling 51% 55% 58% 52% 47% 65%
Visual scanning/video 48% 47% 41% 48% 47% 70%
Robotic process automation 31% 32% 33% 26% 47% 20%
Sensorization 26% 23% 24% 23% 10% 40%
Physical robotics 24% 24% 28% 13% 13% 40%
Note: The boxes highlighted in grey represent top three tools/ technologies by countries. The numbers have been sorted in descending order according to Total
Source: Deloitte Industry 4.0 Investment Survey, 2018
However, Mexico respondents are much more likely to use big data platform for managing volumes of data.Consistent with global responses, newer technologies such as sensorization and physical robotics have lower reported usage rates in the Americas – with the exception of Canada.
Tools used to access, analyze, and leverage the data from assets, current and planned use
Q19. What tools and technologies are you currently using to access, analyze, and leverage the data from your assets?

The Supply Chain paradox
10 | Copyright © 2018 Deloitte Development LLC. All rights reserved.
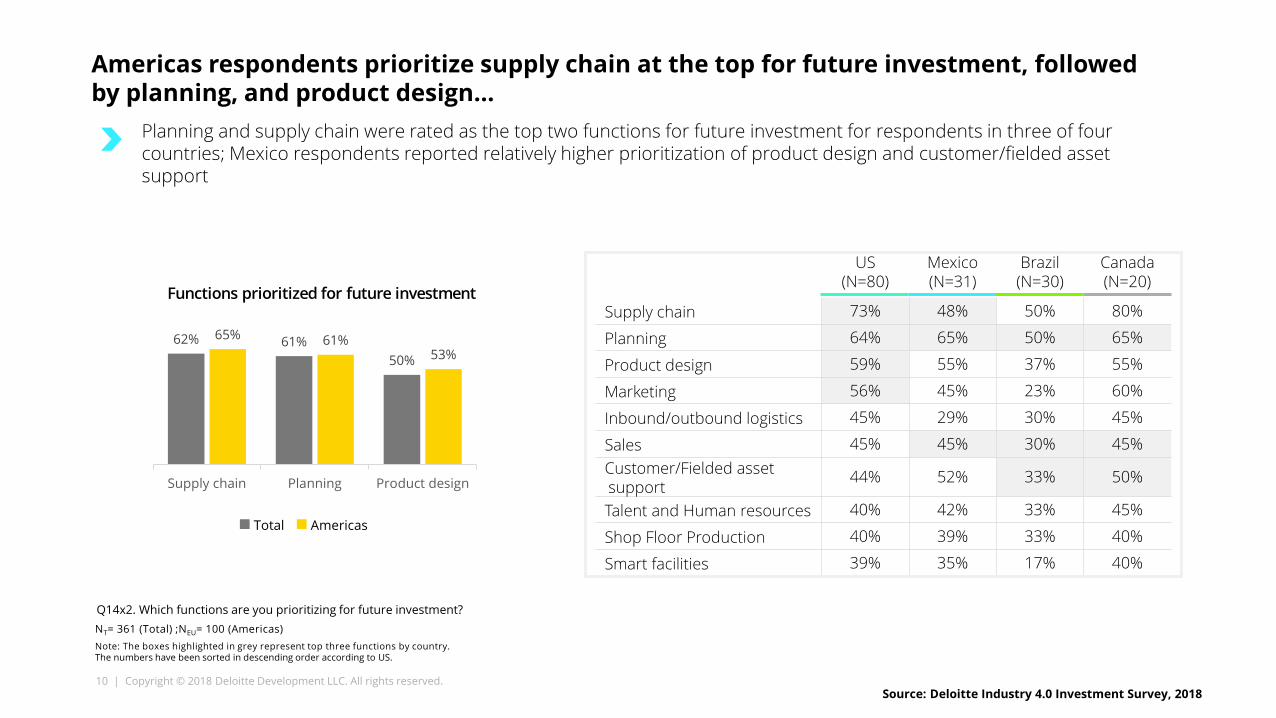
Americas respondents prioritize supply chain at the top for future investment, followed by planning, and product design…
Planning and supply chain were rated as the top two functions for future investment for respondents in three of four countries; Mexico respondents reported relatively higher prioritization of product design and customer/fielded asset support
US(N=80)
Mexico(N=31)
Brazil(N=30)
Canada(N=20)
Supply chain 73% 48% 50% 80%
Planning 64% 65% 50% 65%
Product design 59% 55% 37% 55%
Marketing 56% 45% 23% 60%
Inbound/outbound logistics 45% 29% 30% 45%
Sales 45% 45% 30% 45%Customer/Fielded asset support
44% 52% 33% 50%
Talent and Human resources 40% 42% 33% 45%
Shop Floor Production 40% 39% 33% 40%
Smart facilities 39% 35% 17% 40%
NT= 361 (Total) ;NEU= 100 (Americas)Note: The boxes highlighted in grey represent top three functions by country. The numbers have been sorted in descending order according to US.
Total Americas
62% 61%50%
65% 61%53%
Supply chain Planning Product design
Source: Deloitte Industry 4.0 Investment Survey, 2018
Q14x2. Which functions are you prioritizing for future investment?
Functions prioritized for future investment

11 | Copyright © 2018 Deloitte Development LLC. All rights reserved.
However, supply chain appears perceived as a low driver of digital innovationOperations/production and IT reported as the top two drivers of digital innovation by respondents from all countries, suggesting a push for using technology to improve current processesHowever, executives in Mexico report relatively higher focus on engineering, while Canadian companies report innovation is driven by marketing and sales.
NT= 361 (Total) ;NEU= 100 (Americas)Note: The boxes highlighted in grey represent top three functions by country. The numbers have been sorted in descending order according to Germany.
Total Americas60% 57%
35% 34% 33% 30%23% 22%
53%
66%
32%40%
32% 30%22% 19%
InformationTechnology (IT)
Operations /Production
Finance Supply chain Engineering Marketing andSales
Aftermarket /CustomerSupport
Talent / HumanResources
US(N=80)
Mexico(N=31)
Brazil(N=30)
Canada(N=20)
Operations / Production 70% 65% 50% 80%Information Technology (IT) 55% 58% 37% 65%Supply chain 39% 23% 60% 40%Finance 38% 26% 20% 35%Engineering 35% 42% 30% 10%Marketing and Sales 29% 26% 33% 40%Aftermarket / Customer Support 19% 16% 33% 25%Talent / Human Resources 14% 29% 30% 5%
Source: Deloitte Industry 4.0 Investment Survey, 2018
In my organization, I am seeing the most digital innovation driven from...
Q13. In my organization, I am seeing the most digital innovation driven from:

12 | Copyright © 2018 Deloitte Development LLC. All rights reserved.
US(N=10)
Mexico(N=5)
Brazil(N=5)
Canada(N=2)
Major decision making around investment and technology across countries
13% 16% 17% 10%
Despite a high reported prioritization of supply chain investments, CSCOs rank low on investment decision making among Americas respondents, vs. other executives globally
NT= 361 (Total) ;NEU= 100 (Americas)Major decision making includes the summation of ‘Highly involved in the decision- making process’ and ‘Key decision maker.
93% 91% 86% 81% 79%62%
31% 30% 25% 22% 21%
91% 89% 96% 94% 87%66%
9% 6% 7% 14% 4%
CDO CTO CEO CFO COO CIO EVP/SVP BUP VP CSCO Line ofbusinessindividual
Total Americas
Source: Deloitte Industry 4.0 Investment Survey, 2018
CSCO’s role in major decision making seen higher among Mexico and Brazil respondents, as compared to respondents in the US and Canada.
Q9. When it comes to investing in or acquiring new technologies or capabilities to aid in a digital transformation, who makes the decisions within your organization? (Highly involved, key decision maker)
Role in Decision Making around Investment and Technology

The Talent paradox

14 | Copyright © 2018 Deloitte Development LLC. All rights reserved.
Finding, training and retaining the right talent is seen as a top operational/ cultural challenge in the Americas region, consistent with global
However, Mexico respondents rate it as less of a challenge, pointing to other hurdles such as ‘Lack of collaboration with external partners.’
‘Fragmented decision making across the organization’ and ‘More powerful and tech-savvy customers/clients’ were also identified by Canada respondents as key challenges.
Note: The boxes highlighted in grey represent top statements by region. The numbers have been sorted in descending order according to Total.
Total (NT=361)
Americas(NAM=161)
US(N=80)
Mexico(N=31)
Brazil(N=30)
Canada(N=20)
Finding, training and retaining the right talent 35% 32% 35% 19% 33% 40%
Lack of internal alignment about which strategies to follow 32% 40% 40% 39% 37% 45%
Emergence of new business or delivery models (e.g., shift from up-front payment to usage-based pricing, autonomous driving, smart cities)
27% 39% 41% 42% 37% 30%
Lack of consistency around digital tools already in use across the organization 25% 29% 33% 23% 30% 25%
Building and organizational culture to support digital transformation 23% 20% 18% 26% 17% 25%
Lack of collaboration with external partners 23% 23% 20% 35% 23% 15%
Fragmented decision making across the organization 22% 22% 24% 16% 20% 30%
Lack of vision/buy-in by leaders 21% 19% 24% 19% 13% 5%
Lack of business strategy around digital transformation 21% 22% 20% 32% 20% 20%
More powerful and tech-savvy customers/clients 18% 14% 15% 3% 13% 30%
Lack of rank-and-file adoption 18% 17% 11% 19% 27% 20%
Blurred lines between industries 16% 13% 14% 13% 10% 15%
Source: Deloitte Industry 4.0 Investment Survey, 2018
Operational, culture-related and environmental challenges cited
Q21. Which of the following are the most common operational, culture-related and environmental challenges your organization faces as it seeks to pursue digital transformation initiatives?
15 | Copyright © 2018 Deloitte Development LLC. All rights reserved.
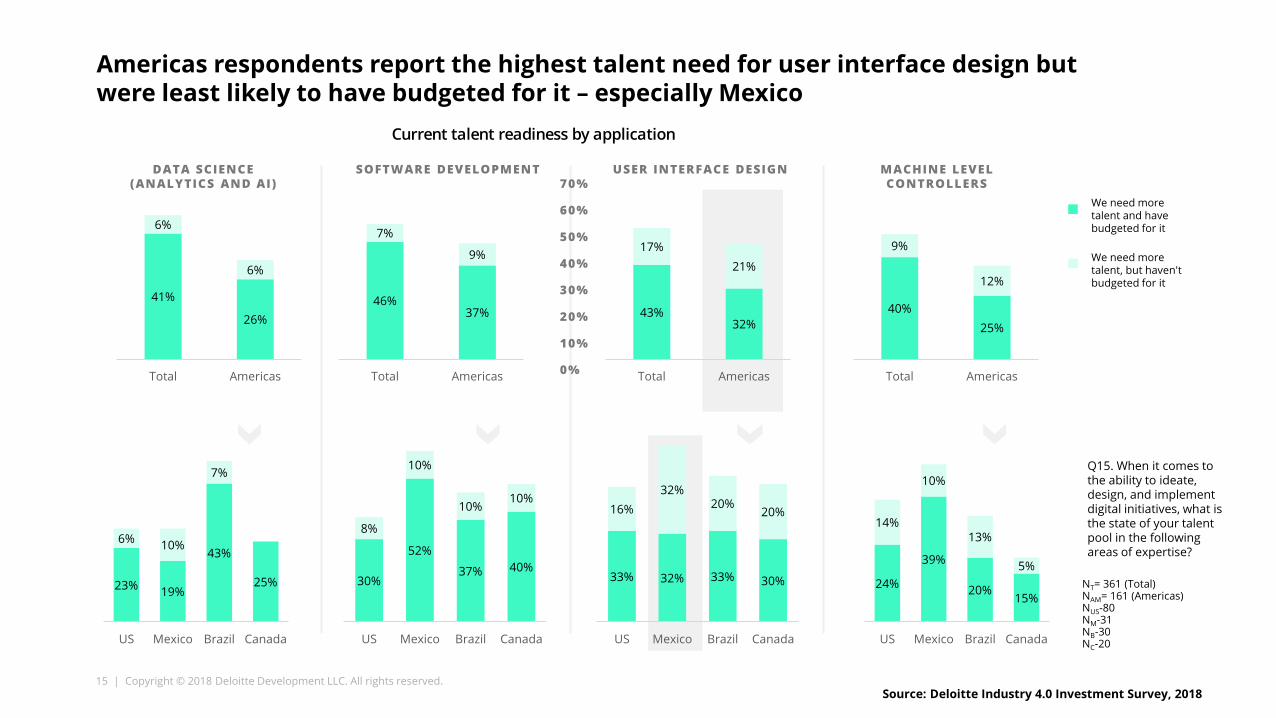
Americas respondents report the highest talent need for user interface design but were least likely to have budgeted for it – especially Mexico
We need more talent and have budgeted for it
We need more talent, but haven't budgeted for it
DATA SCIENCE (ANALYTICS AND AI)
SOFTWARE DEVELOPMENT USER INTERFACE DESIGN MACHINE LEVEL CONTROLLERS70%
60%
50%
40%
30%
20%
10%
0%
NT= 361 (Total)NAM= 161 (Americas)NUS-80NM-31NB-30NC-20
41%
26%
6%
6%
Total Americas
46%37%
7%
9%
Total Americas
43%32%
17%21%
Total Americas
40%25%
9%
12%
Total Americas
23% 19%
43%
25%
6% 10%
7%
US Mexico Brazil Canada
30%
52%
37% 40%
8%
10%
10%10%
US Mexico Brazil Canada
33% 32% 33% 30%
16%32%
20%20%
US Mexico Brazil Canada
24%
39%
20%15%
14%
10%
13%
5%
US Mexico Brazil Canada
Source: Deloitte Industry 4.0 Investment Survey, 2018
Current talent readiness by application
Q15. When it comes to the ability to ideate, design, and implement digital initiatives, what is the state of your talent pool in the following areas of expertise?

The Innovation paradox
17 | Copyright © 2018 Deloitte Development LLC. All rights reserved.
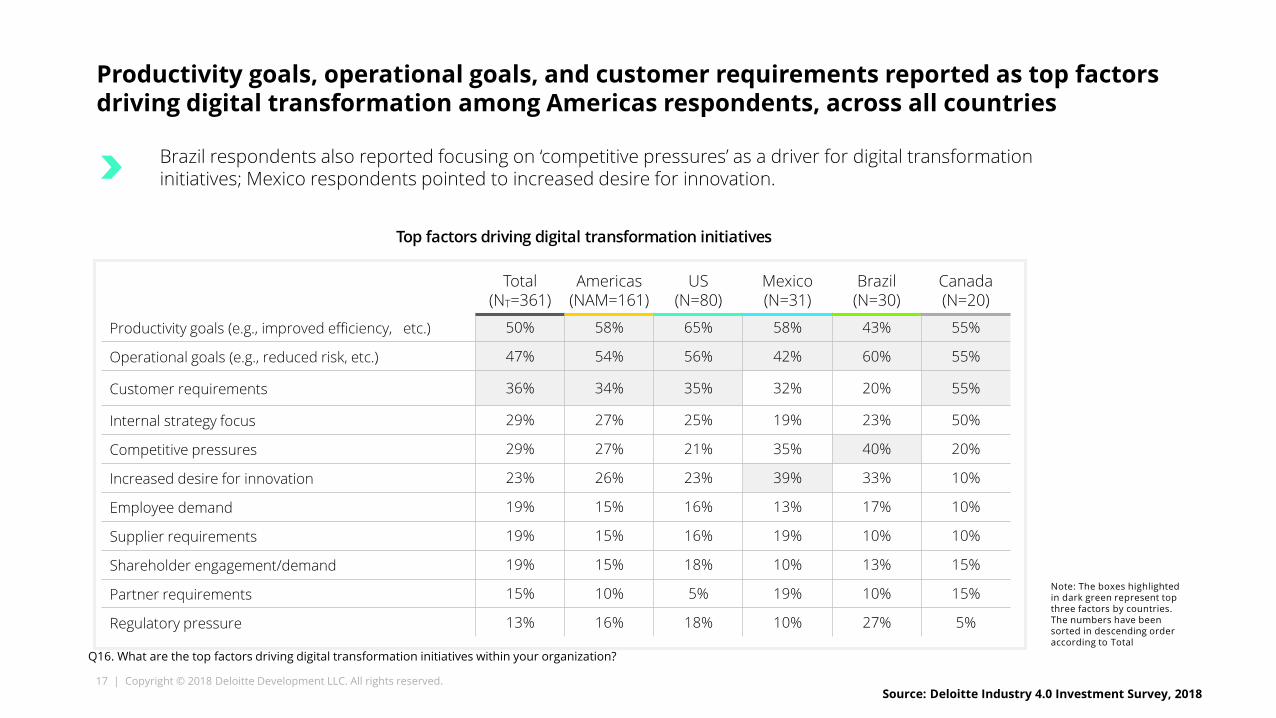
Productivity goals, operational goals, and customer requirements reported as top factors driving digital transformation among Americas respondents, across all countries
Brazil respondents also reported focusing on ‘competitive pressures’ as a driver for digital transformation initiatives; Mexico respondents pointed to increased desire for innovation.
Note: The boxes highlighted in dark green represent top three factors by countries. The numbers have been sorted in descending order according to Total
Total (NT=361)
Americas(NAM=161)
US(N=80)
Mexico(N=31)
Brazil(N=30)
Canada(N=20)
Productivity goals (e.g., improved efficiency, etc.) 50% 58% 65% 58% 43% 55%
Operational goals (e.g., reduced risk, etc.) 47% 54% 56% 42% 60% 55%
Customer requirements 36% 34% 35% 32% 20% 55%
Internal strategy focus 29% 27% 25% 19% 23% 50%
Competitive pressures 29% 27% 21% 35% 40% 20%
Increased desire for innovation 23% 26% 23% 39% 33% 10%
Employee demand 19% 15% 16% 13% 17% 10%
Supplier requirements 19% 15% 16% 19% 10% 10%
Shareholder engagement/demand 19% 15% 18% 10% 13% 15%
Partner requirements 15% 10% 5% 19% 10% 15%
Regulatory pressure 13% 16% 18% 10% 27% 5%
Source: Deloitte Industry 4.0 Investment Survey, 2018
Top factors driving digital transformation initiatives
Q16. What are the top factors driving digital transformation initiatives within your organization?

18 | Copyright © 2018 Deloitte Development LLC. All rights reserved.
Americas respondents were likelier to report significant ROI from digital transformation initiatives, compared to global respondents
49%42%
6%2%
58%
35%
6%2%
42%
50%
6%2%
42%45%
8%4%
Significant ROI Moderate ROI It's too early to tell Zero ROI
Total Americas APAC Europe
Source: Deloitte Industry 4.0 Investment Survey, 2018
Level of ROI realized from digital transformation initiatives
Q12. Generally speaking, what level of ROI have you realized from digital transformation initiatives?
19 | Copyright © 2018 Deloitte Development LLC. All rights reserved.
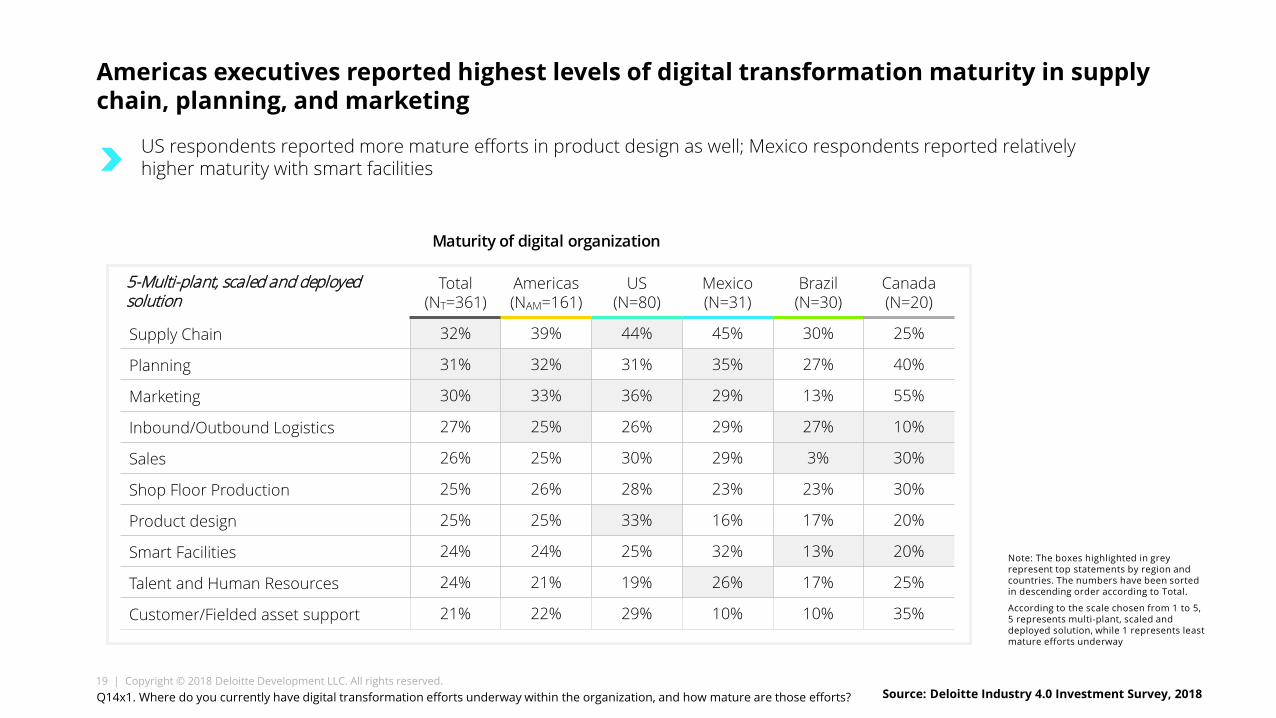
Americas executives reported highest levels of digital transformation maturity in supply chain, planning, and marketing
5-Multi-plant, scaled and deployed solution
Total (NT=361)
Americas(NAM=161)
US(N=80)
Mexico(N=31)
Brazil(N=30)
Canada(N=20)
Supply Chain 32% 39% 44% 45% 30% 25%
Planning 31% 32% 31% 35% 27% 40%
Marketing 30% 33% 36% 29% 13% 55%
Inbound/Outbound Logistics 27% 25% 26% 29% 27% 10%
Sales 26% 25% 30% 29% 3% 30%
Shop Floor Production 25% 26% 28% 23% 23% 30%
Product design 25% 25% 33% 16% 17% 20%
Smart Facilities 24% 24% 25% 32% 13% 20%
Talent and Human Resources 24% 21% 19% 26% 17% 25%
Customer/Fielded asset support 21% 22% 29% 10% 10% 35%
Note: The boxes highlighted in grey represent top statements by region and countries. The numbers have been sorted in descending order according to Total.
According to the scale chosen from 1 to 5, 5 represents multi-plant, scaled and deployed solution, while 1 represents least mature efforts underway
US respondents reported more mature efforts in product design as well; Mexico respondents reported relatively higher maturity with smart facilities
Source: Deloitte Industry 4.0 Investment Survey, 2018
Maturity of digital organization
Q14x1. Where do you currently have digital transformation efforts underway within the organization, and how mature are those efforts?

Getting around the physical-digital-physical loopA look at current Industry 4.0 capabilities

21 | Copyright © 2018 Deloitte Development LLC. All rights reserved.
Non-transactional internal systems reported as the most effectively utilized data source by respondents in the Americas, across all countries. Respondents report having access to different data sources; but report being able to utilize only a portion of them.
How effectively are you able to use each data category to make decisions?
Social media listening appears less effectively utilized by Mexico respondents.
Field-based IoT data collection appears less effectively utilized by Brazil respondents.
Extremely effectively utilized Total (NT=361)
Americas(NAM=161)
US(N=80)
Mexico(N=31)
Brazil(N=30)
Canada(N=20)
Non-transactional internal systems (e.g., email, document/content management) 70% 84% 92% 79% 62% 90%
ERP and other transaction systems (e.g., CRM, PLM) 50% 51% 53% 52% 48% 44%
Social media listening 47% 49% 61% 19% 39% 50%
Facility-based IoT data collection 41% 45% 44% 35% 56% 50%
Field-based IoT data collection 39% 36% 38% 36% 24% 44%
Predictive model outputs 39% 46% 44% 40% 56% 47%
Source: Deloitte Industry 4.0 Investment Survey, 2018
Q18b. How effectively are you able to use each data category to make decisions?, Extremely effectively utilized
22 | Copyright © 2018 Deloitte Development LLC. All rights reserved.
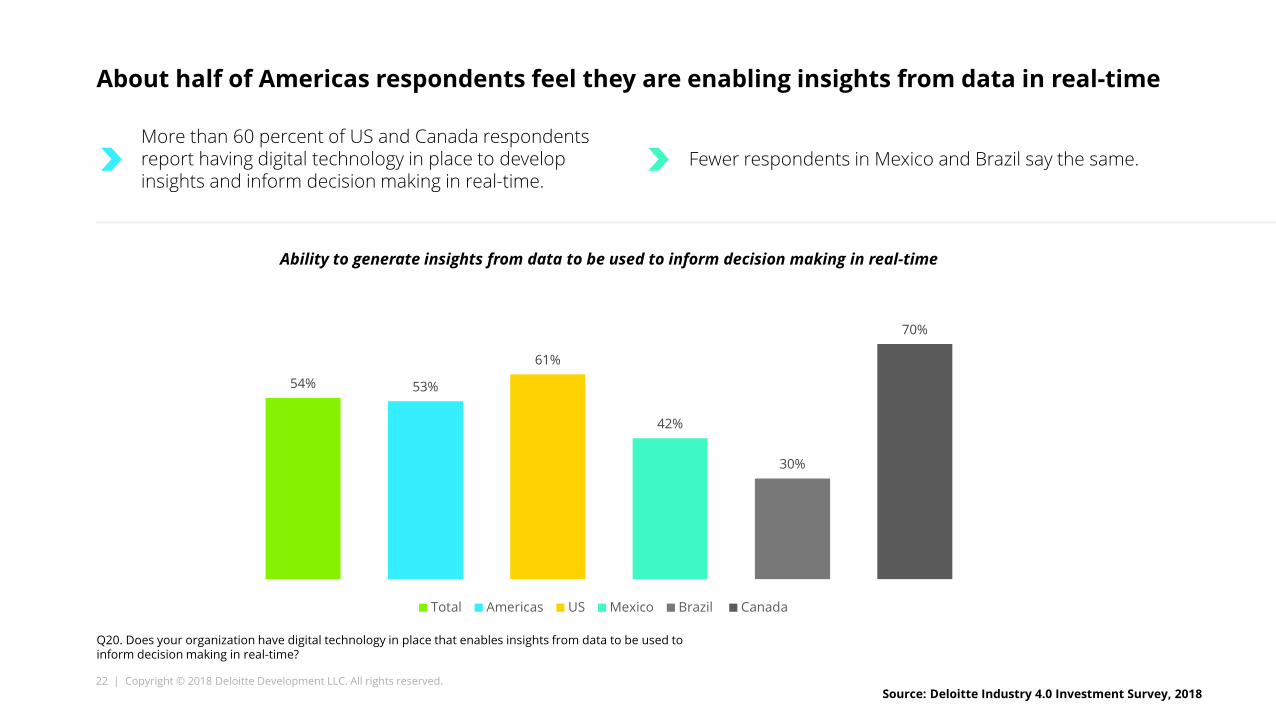
About half of Americas respondents feel they are enabling insights from data in real-time
More than 60 percent of US and Canada respondents report having digital technology in place to develop insights and inform decision making in real-time.
Fewer respondents in Mexico and Brazil say the same.
54% 53%
61%
42%
30%
70%
Total Americas US Mexico Brazil Canada
Source: Deloitte Industry 4.0 Investment Survey, 2018
Ability to generate insights from data to be used to inform decision making in real-time
Q20. Does your organization have digital technology in place that enables insights from data to be used to inform decision making in real-time?

Survey Methodology
24 | Copyright © 2018 Deloitte Development LLC. All rights reserved.
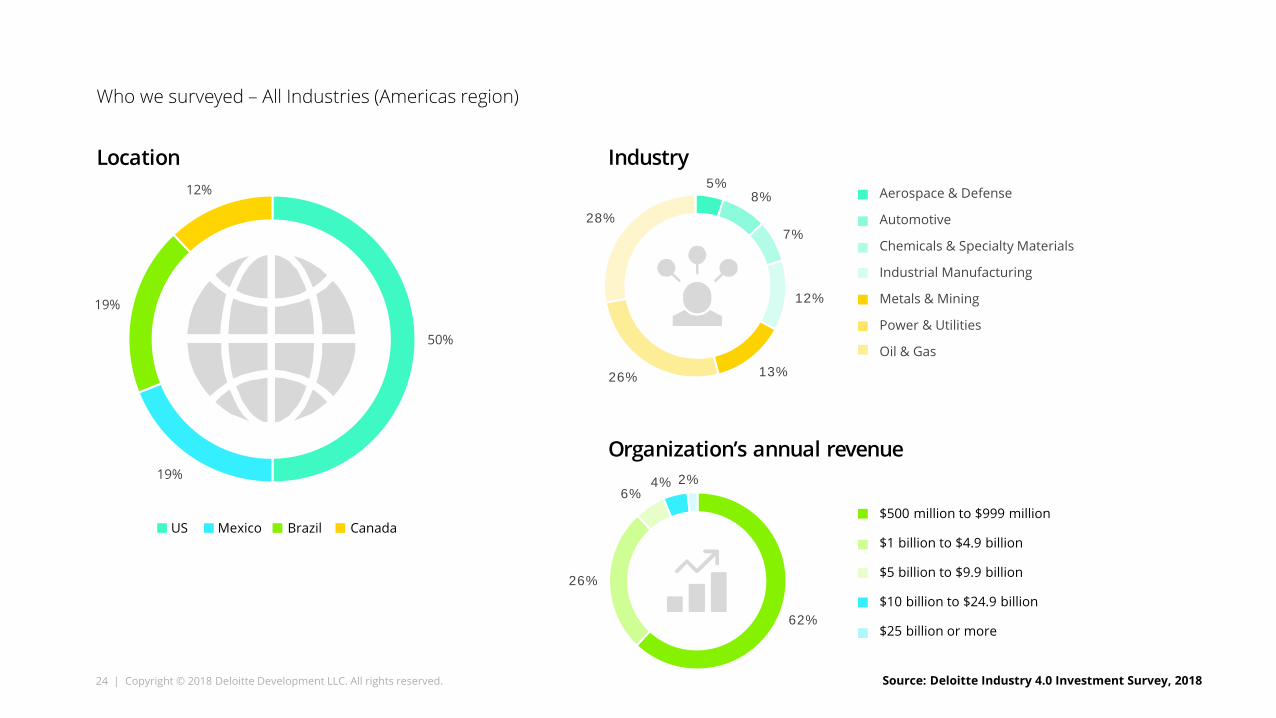
62%
26%
6%4% 2%
5%8%
7%
12%
13%26%
28%
Who we surveyed – All Industries (Americas region)
Location Industry
Organization’s annual revenue
50%
19%
19%
12% Aerospace & Defense
Automotive
Chemicals & Specialty Materials
Industrial Manufacturing
Metals & Mining
Power & Utilities
Oil & Gas
$500 million to $999 million
$1 billion to $4.9 billion
$5 billion to $9.9 billion
$10 billion to $24.9 billion
$25 billion or more
US Mexico Brazil Canada
Source: Deloitte Industry 4.0 Investment Survey, 2018

25 | Copyright © 2018 Deloitte Development LLC. All rights reserved.
Who we surveyed – All Industries (Americas region) (cont’d)
27%
22%
20%
5%
3%
4%
11%
4%5%
6%
10%
8%
7%
8%
5%9%
24%
9%
12%
CEO/President
CFO
COO
CDO
CIO
CTO
CSCO
President, EVP, SVP, VP
Executive director/Senior director
Director
Job Title Job Function
Finance
Information Technology (IT)
Operations
Planning
Design/Engineering
Cyber security
Digital Technology
Production
Management
Source: Deloitte Industry 4.0 Investment Survey, 2018

This publication contains general information only, and none of the member firms of Deloitte Touche Tohmatsu Limited, its member firms, or their related entities (collective, the “Deloitte Network”) is, by means of this publication, rendering professional advice or services. Before making any decision or taking any action that may affect your business, you should consult a qualified professional adviser. No entity in the Deloitte Network shall be responsible for any loss whatsoever sustained by any person who relies on this publication.
As used in this document, “Deloitte” means Deloitte Consulting LLP, a subsidiary of Deloitte LLP. Please see www.deloitte.com/us/about for a detailed description of the legal structure of Deloitte USA LLP, Deloitte LLP and their respective subsidiaries. Certain services may not be available to attest clients under the rules and regulations of public accounting.
Copyright © 2018 Deloitte Development LLC. All rights reserved. Member of Deloitte Touche Tohmatsu Limited
Thank you.
About DeloitteDeloitte refers to one or more of Deloitte Touche Tohmatsu Limited, a UK private company limited by guarantee (“DTTL”), its network of member firms, and their related entities. DTTL and each of its member firms are legally separate and independent entities. DTTL (also referred to as “Deloitte Global”) does not provide services to clients. In the United States, Deloitte refers to one or more of the US member firms of DTTL, their related entities that operate using the “Deloitte” name in the United States and their respective affiliates. Certain services may not be available to attest clients under the rules and regulations of public accounting. Please see www.deloitte.com/about to learn more about our global network of member firms..
Copyright © 2018 Deloitte Development LLC. All rights reserved. Member of Deloitte Touche Tohmatsu Limited36 USC 220506


