Overconfidence and Early-life Experiences: The Effect of Managerial Traits on Corporate Financial Policies ULRIKE MALMENDIER, GEOFFREY TATE, and JON YAN * ABSTRACT We show that measurable managerial characteristics have significant explanatory power for corporate financing decisions. First, managers who believe that their firm is undervalued view external financing as overpriced, especially equity financing. Such overconfident managers use less external finance and, conditional on accessing external capital, issue less equity than their peers. Second, CEOs who grew up during the Great Depression are averse to debt and lean excessively on internal finance. Third, CEOs with military experience pursue more aggressive policies, including heightened leverage. Complementary measures of CEO traits based on press portrayals confirm the results. * University of California - Berkeley and NBER, University of California at Los Angeles, and no affiliation. Earlier versions of this paper were titled “Corporate Financial Policies with Overconfident Managers” and “Managerial Beliefs and Corporate Financial Policies.” We are indebted to Brian Hall, David Yermack, and John Graham for providing us with the data. We thank Malcolm Baker, Rudi Fahlenbrach, Michael Faulkender, Murray Frank, Dirk Hackbarth, Dirk Jenter, Jeremy Stein, Ilya Strebulaev, Avanidhar Subrahmanyam, Jeffrey Wurgler, and seminar participants at Berkeley, Calgary, Columbia, Helsinki School of Economics, Insead, MIT, Rotterdam, Stanford, UCLA, USC, Wharton, Zurich, and at the AEA, AFA, FEA, Frontiers in Finance (Banff), IZA Behavioral Economics of Organizations, and Olin Corporate Governance conferences for helpful comments. Nishanth Rajan provided excellent research assistance. Ulrike Malmendier would like to thank the Alfred P. Sloan Foundation and the Coleman Fung Risk Management Research Center for financial support.
Transcript
Overconfidence and Early-life Experiences: The Effect of Managerial Traits on Corporate Financial Policies
ULRIKE MALMENDIER, GEOFFREY TATE, and JON YAN*
ABSTRACT
We show that measurable managerial characteristics have significant explanatory power
for corporate financing decisions. First, managers who believe that their firm is
undervalued view external financing as overpriced, especially equity financing. Such
overconfident managers use less external finance and, conditional on accessing external
capital, issue less equity than their peers. Second, CEOs who grew up during the Great
Depression are averse to debt and lean excessively on internal finance. Third, CEOs with
military experience pursue more aggressive policies, including heightened leverage.
Complementary measures of CEO traits based on press portrayals confirm the results.
* University of California - Berkeley and NBER, University of California at Los Angeles, and no affiliation. Earlier versions of this paper were titled “Corporate Financial Policies with Overconfident Managers” and “Managerial Beliefs and Corporate Financial Policies.” We are indebted to Brian Hall, David Yermack, and John Graham for providing us with the data. We thank Malcolm Baker, Rudi Fahlenbrach, Michael Faulkender, Murray Frank, Dirk Hackbarth, Dirk Jenter, Jeremy Stein, Ilya Strebulaev, Avanidhar Subrahmanyam, Jeffrey Wurgler, and seminar participants at Berkeley, Calgary, Columbia, Helsinki School of Economics, Insead, MIT, Rotterdam, Stanford, UCLA, USC, Wharton, Zurich, and at the AEA, AFA, FEA, Frontiers in Finance (Banff), IZA Behavioral Economics of Organizations, and Olin Corporate Governance conferences for helpful comments. Nishanth Rajan provided excellent research assistance. Ulrike Malmendier would like to thank the Alfred P. Sloan Foundation and the Coleman Fung Risk Management Research Center for financial support.
1
What are the primary determinants of firms' financing decisions? Traditional theories emphasize firm-,
industry-, and market-level explanations, such as the trade-off between the tax deductibility of interest
payments and bankruptcy costs, or asymmetric information between firms and the capital market (Miller
(1977), Myers (1984), Myers and Majluf (1984)). These theories explain a significant portion of the
observed variation in capital structure. Yet, recent research identifies firm-specific stickiness in capital
structure that is not a clear prediction of the traditional theories (Lemmon, Roberts, and Zender (2008)).
Moreover, while modern dynamic theories of optimal capital structure allow room for firms with similar
fundamentals to operate away from a common target, the factors that predict these differences are less
clear.
In this paper, we study the role of managerial traits in explaining the remaining variation. We consider
both capital structure-relevant beliefs (overconfidence) and formative early-life experiences (Great
Depression, military service). In contrast to prior literature on managerial fixed effects (Weisbach (1995),
Chevalier and Ellison (1999), Bertrand and Schoar (2003), Frank and Goyal (2007)), we identify specific
managerial characteristics, derive their implications for financial decisions, and measure their effects
empirically. To avoid confounds with firm characteristics (e.g., due to the endogenous matching of CEOs
to firms (Graham, Harvey, and Puri (2009))) we use a fixed effects estimation strategy where possible to
compare CEOs with different traits operating the same firm.
First, we consider managers who overestimate their firms' future cash flows and hence believe that
their firms are undervalued by the market. We show that such overconfident managers view external
financing to be unduly costly and prefer to use cash or riskless debt. Conditional on having to raise risky
external capital, they prefer debt to equity, since equity prices are more sensitive to differences in
opinions about future cash flows. Unconditionally, however, their reluctance to access external financing
may result in low levels of risky debt relative to available interest tax deductions (and even lower levels
of equity).
2
Second, we consider variation in managers' personal histories that is likely to generate differences in
their financial decision-making. Existing evidence suggests that individuals are most affected by seismic
events early in life (see, for example, Elder (1998)). We identify two shocks that are likely to be
formative experiences and that affect a significant portion of our sample CEOs early in life: growing up
during the Great Depression and serving in the military. Experiencing the Great Depression induces less
faith in external capital markets (Graham and Narasimhan (2004), Schoar (2007), Malmendier and Nagel
(2011)). Depression CEOs therefore lean excessively on internal financing. Military service, and
particularly combat exposure, during early adulthood have a lasting effect on veterans' life-choices and
decision making (Elder (1986), Elder and Clipp (1989), Elder, Gimbel, and Ivie (1991)) and induce
agressiveness or risk-taking. These traits may later manifest themselves in more aggressive capital
structure choices.
We measure overconfidence using data on CEO option holdings. First, we use detailed data from large
U.S. companies between 1980 and 1994 to identify CEOs who systematically maintain high personal
exposure to company-specific risk. The CEOs in our data have a strong incentive to diversify their
personal portfolios since they receive substantial equity-based compensation and the value of their human
capital depends on firm performance. Yet, some CEOs hold nontradeable in-the-money executive stock
options until expiration rather than exercise them after the vesting period. This delay in exercise, captured
by the measure Longholder from Malmendier and Tate (2005, 2008), is not explained by insider
knowledge, as it does not yield abnormal returns over a simple strategy of exercising and diversifying. A
plausible interpretation is that these CEOs overestimate the means of their firms' future cash flows.1 We
address several alternative interpretations, including signaling and risk tolerance, and we separate years
before and after a CEO first displays Longholder behavior (Pre- and Post-Longholder). As an alternative
measure, we identify CEOs who do not exercise options that are highly in the money (67%) five years
prior to expiration (Holder 67).2 As a robustness check, we also construct analogous portfolio measures
using CEO compensation and insider trading data from Execucomp and Thomson Financial from 1992 to
2007. Though data limitations preclude us from classifying CEOs with the same precision as in the earlier
3
sample, these measures confirm the generalizability of our key results to more recent data. Finally, as an
alternative to our portfolio-based measures, we identify CEOs' beliefs based on their portrayal as
“confident” or “optimistic” in the business press.
We measure Depression experience using birth years in the decade leading up to the Great Depression.
We measure military experience based on hand-collected information from Dun and Bradstreet and
Who's Who in Finance and Industry; we use information on service years to identify veterans of World
War II, the Korean War, and the Vietnam War. As with overconfidence, we use press coverage to sharpen
the interpretation of our measures. Here, we use press coverage as “cautious” or “conservative” (or in
similar terms), which is positively correlated with membership in the Depression cohort but negatively
correlated with military experience.
We relate our measures of overconfidence and formative past experiences to corporate financial
policies. Using SDC data on security issuance, we find that overconfident CEOs are significantly less
likely to issue equity conditional on accessing public markets. For example, Longholder CEOs issue
equity in only 31% of the years in which they access public markets, compared to 42% among their peers.
We find the same pattern using accounting data from Compustat, which includes private financing, and
the financing deficit methodology of Shyam-Sunder and Myers (1999): Longholder CEOs raise roughly
35 cents more debt than rational predecessors or successors in the same firm to meet an additional dollar
of external financing needs. The aversion of overconfident CEOs to equity is strong enough to have a
cumulative effect on firm leverage, controlling for firm and year fixed effects: firms have significantly
higher leverage ratios in years in which they employ overconfident CEOs.
We also test whether overconfident CEOs are generally more reluctant to access external capital
markets, preferring instead to rely on internal sources of finance. While not a necessary implication,
overconfidence offers a possible explanation for prior findings that, in general, firms do not issue enough
debt. Using the kink methodology of Graham (2000), we find that overconfident CEOs are significantly
more likely to underutilize debt relative to available tax benefits. At the same time, they do not abstain
from issuing riskless debt, that is, debt with high S&P long-term credit ratings, for which there is no
4
disagreement about the appropriate interest rate. Moreover, the most debt-conservative overconfident
CEOs are also equity-conservative: they are least likely to issue equity.
Turning to the role of formative past experiences, we find that Depression CEOs are also more prone to
underutilize debt relative to its tax benefits than the average CEO. Further, they do not substitute equity
for debt, confirming their preference to avoid public markets. CEOs with prior military service, instead,
choose more aggressive capital structures, particularly those who served in World War II. Under their
leadership, market leverage ratios are significantly higher than under their predecessors or successors in
the same firm. The results on World War II veterans are particularly important since, due to the draft, they
alleviate concerns about self-selection into service.
Our findings demonstrate the importance of managerial traits for financing decisions, both within and
between firms. To the extent that managerial beliefs and the effect of past experiences are sticky, they can
help to explain the strong firm fixed effects identified in the recent capital structure literature (Lemmon,
Roberts, and Zender (2008)). Moreover, if unanticipated by the firm, the effect of CEO traits on financing
decisions implies limitations in the ability of existing compensation contracts and governance
mechanisms to perfectly align managerial preferences with those of diversified shareholders.
Our analysis uses identifiable traits of CEOs, but not of CFOs, for whom we do not have data on
personal characteristics and portfolio choices.3 As a result, our findings allow for two interpretations: (1)
CEOs directly determine financing, or (2) CFOs determine financing, but their decisions are positively
correlated with CEO traits (assortative matching). For the decisions considered in our analysis, it is likely
that CEOs have the ultimate say. While CFOs first design financing decisions, the CEO alone can
withdraw (or approve) a stock offering at the last moment or overrule the CFO and treasurer.4
Our findings relate to several strands of literature. Our analysis of overconfidence contributes to the
literature linking biased managerial beliefs to corporate decisions, initiated by Roll (1986). In the context
of financing, Heaton (2002) models a bias in the perceived probability of high cash flow, which affects
both the first and the second moments of the perceived cash flow distribution. Similarly, Hackbarth
(2008) models distortions to both the mean and the variance. Our approach differs by focusing on the
5
overestimation of mean future cash flows. Malmendier and Tate (2005) consider a similar model and
show that investment by overconfident CEOs is more sensitive to cash flow, particularly in firms with
low debt capacity.
Empirically, Graham and Harvey's (2001) CFO Outlook Survey suggests a direct role for biased
managerial beliefs in financing choices. For example, in the second quarter of 1999, prior to the end of
the technology bubble, roughly 70% of respondents state that their company stock is undervalued, and
67% say that misvaluation is an important factor in the decision to issue stock. Ben-David, Graham, and
Harvey (2007) relate the miscalibration bias of CFOs revealed in such surveys to a wide range of
corporate decisions, including corporate financing.
The psychology literature suggests that executives are particularly prone to exhibit overconfidence.5
Possible reasons include sorting of high-confidence individuals into top positions (Goel and Thakor
(2008)); self-attribution bias induced by past successes, such as those necessary to become CEO (Miller
and Ross (1975), Billett and Qian (2008)); and illusion of control.6
Our results fill a critical gap in the overconfidence literature by directly linking CEO overconfidence to
financing choices in large U.S. firms. Though preferences among different financing instruments are an
implicit prediction in much of the literature,7 to our knowledge this prediction remains untested using
field data from corporations.
Our results on past experiences of CEOs (Great Depression, military service) build on research
exploring the long-term effects of prior life experiences. Donaldson (1990) argues that corporate leaders
who were young adults in the 1930s were “profoundly affected by the collapse of the capital markets
during the Great Depression,” leading them to be “deeply skeptical of the public capital markets as a
reliable source of personal or corporate funding,” and “to have an instinctive affinity for a strategy of self-
sufficiency” (p. 125). Consistent with this view, Graham and Narasimhan (2004) find that Depression-era
CEOs chose lower leverage in the 1940s than other CEOs. More broadly, Schoar (2007) shows that CEOs
who start their career in a recession make more conservative capital structure choices, for example,
choosing lower leverage and internal over external growth. Malmendier and Nagel (2011) find related
6
evidence that past economic shocks have a long-lasting effect on individual risk aversion and deter risky
financial investment decisions such as stock market participation. A large medical and psychology
literature examines the effect of military exposure on post-war behavior. Berkowitz and Lepage (1967)
find that weapons are “aggression-eliciting stimuli,” and Killgore et al. (2008) show that combat exposure
increases risky behavior upon returning from deployment. Wansink, Payne, and van Ittersum (2008)
provide evidence of higher risk-taking propensity among World War II veterans. Elder (1986), Elder and
Clipp (1989), and Elder, Gimbel, and Ivie (1991) argue that the skills learned from combat make
individuals more convinced that they can handle stressful and risky situations, resulting in less risk
aversion and higher assertiveness.
We also provide a new angle on the older literature testing pecking-order and trade-off theories.
Shyam-Sunder and Myers (1999), for example, argue that the tendency of firms to fill financing deficits
with new debt rather than equity issues supports the pecking-order theory over a static trade-off model.
Frank and Goyal (2003) use the same empirical methodology on an extended sample to argue in favor of
the trade-off model. The analysis of managerial beliefs helps explain residual variation that is difficult to
reconcile with either theory. For example, one important puzzle highlighted by Frank and Goyal (2003) is
that “pecking-order behavior” best describes the capital structure choices of large firms. However,
standard pecking-order theory relates such behavior to information asymmetries, from which large firms
should suffer the least. Our analysis offers one explanation: biased beliefs of managers in large firms,
whose past successes make them prone to overconfidence.
The remainder of the paper is organized as follows. In Section I, we derive empirical predictions
linking managerial beliefs and past experiences to capital structure choices. Section II describes the data
and the construction of our key variables. Section III describes our measures of overconfidence and early-
life experiences. Section IV relates our measures to financing choices. Section V discusses alternative
interpretations of our evidence and Section VI tests the robustness of our main results out-of-sample.
Finally, Section VII concludes.
7
I. Testable Hypotheses
In this section we derive the capital structure implications of a specific set of empirically identifiable
beliefs (overconfidence) and formative past experiences (Great Depression, military service); a formal
model, which focuses on overconfidence, is presented in the Internet Appendix. To simplify the analysis,
we allow for only two market imperfections: tax deductibility of interest payments and financial distress
costs. In allowing for these two frictions, we do not take a stand on the relative merits of pecking-order
versus trade-off theories, which are both complementary to the managerial effects studied here. The
assumed frictions simply serve the purpose of fixing a unique optimal capital structure for a rational,
value-maximizing CEO: the debt level that exactly trades off the marginal tax benefit of an additional
dollar of debt against the marginal cost of financial distress (Miller (1977)). We then compare the
decisions of CEOs with biased beliefs to this rational benchmark.
We define overconfidence as the overestimation of mean returns to investment. This overestimation
implies that overconfident CEOs overinvest if they have sufficient internal funds or access to riskless debt
financing. However, an overconfident CEO does not necessarily overinvest, and may even underinvest, if
internal or riskless financing is insufficient for the desired investment. The reason is that overconfidence
also implies a misperception of the cost of external financing: rational shareholders demand higher
compensation for providing equity financing than the CEO deems appropriate. Likewise, rational
creditors demand higher interest rates than the CEO believes are warranted as long as the CEO
overestimates the cash flows in default states. Thus, overconfident CEOs tap risky external finance only if
the overestimated investment returns are larger than the perceived financing costs.
When they do access external financing, overconfident CEOs generally perceive equity financing to be
more mispriced than risky debt. In the case of equity financing, the difference in opinions between
shareholders and the CEO about future cash flows matters for all states of the world. However, in the case
of risky debt, the difference in opinions matters only for default states; the extent to which the CEO
overestimates cash flows in the good states, above and beyond his debt obligations, is irrelevant to the
8
interest rate.8 Thus, the equilibrium financing plan of an overconfident CEO will contain more risky debt
than the trade-off equilibrium of a rational CEO with equal financing needs.
HYPOTHESIS 1. Conditional on accessing external financing and for given financing needs,
overconfident CEOs choose more debt financing, relative to equity, than rational CEOs.
If, however, the (overestimated) cost of external finance exceeds (overestimated) investment returns,
overconfident CEOs do not access external financing and invest only up to the limit of riskless debt
finance, potentially underinvesting relative to a rational CEO. In a dynamic setting, an overconfident
manager may accumulate spare riskless debt capacity in anticipation of future investments and maintain
lower levels of outstanding debt than a rational CEO. Absent other frictions, a rational CEO does not
retain cash inside the firm since external finance is fairly priced and cash holdings carry a tax
disadvantage.9 Thus, overconfidence can lead to debt levels that are too low relative to available tax
benefits.
HYPOTHESIS 2. Overconfident CEOs are more likely than other CEOs to issue debt conservatively
relative to available tax benefits.
In Table I, we summarize the empirical predictions of our analysis for four key capital structure
outcomes: (1) the choice between public debt and equity issuance, (2) the choice to cover financing
deficits using debt or equity, (3) outstanding debt relative to available interest tax deductions, and (4)
market leverage. Note that the first two variables measure changes to the firm's capital structure from
raising new capital while the latter two provide measures of the firm's aggregate indebtedness relative to
different benchmarks.
Insert Table I here.
As summarized in Columns 1 and 2, the preference for debt over equity is a necessary implication of
overconfidence under our baseline assumptions (Hypothesis 1). “Debt conservatism,” on the other hand,
9
is only a possible implication of overconfidence (Hypothesis 2; Column 3). Prior empirical work,
however, finds that CEOs in large profitable firms appear to leave money on the table by choosing low
debt levels (for example, Graham (2000)). Thus, overconfidence offers an explanation for an important
empirical puzzle, and the range of parameters leading to debt conservatism may be empirically relevant.
Debt conservatism relative to available interest tax deductions can, but need not, imply low leverage,
that is, low levels of debt relative to the sum of debt and equity. The reason is that overconfident CEOs
are even more reluctant to issue equity than to raise debt. Figure 1 illustrates incremental financing
choices for a rational CEO and an overconfident CEO that are consistent with this aggregate pattern.
Insert Figure 1 here.
In the example, the rational and overconfident CEOs have the same investment opportunities and
financing needs, but the rational CEO uses less cash financing. In the context of our reduced-form model
(in the Internet Appendix), this is consistent with both the rational CEO and the overconfident CEO
implementing a fixed investment project of scale I but the overconfident CEO depleting more of his
(higher) initial cash holdings. Alternatively, if the initial cash holdings (and cash financing) are equal, the
overconfident CEO may still choose lower debt financing if she underinvests, that is, if the perceived
costs of external finance exceed overestimated investment returns. Even in this case, the increment to
leverage can be higher for the overconfident CEO since she is even more averse to equity issuance.
Indeed, if Hypothesis 1 holds, then equity aversion will aggregate into higher market leverage over time
for most of the parameter range (Column 4 of Table I).
We also consider predictable variation in CEOs' financing choices due to formative past experiences.
Past experiences may affect behavior via two channels: changing beliefs or changing preferences. We do
not formally model these effects and hence allow for both possibilities. Moreover, preferences or beliefs
may be specific to the context of financing choices or may reflect more general attitudes about the self or
world. To narrow the scope of our analysis and generate clear testable predictions, we require past
experiences to satisfy three criteria: (1) they must be major events, (2) they must affect a significant
10
fraction of our sample CEOs, and (3) there must be clear existing evidence linking them to later-life
preferences or beliefs.
We focus on two such experiences: the Great Depression and military service. Existing evidence
suggests that Depression experience discourages individuals from participating in capital markets. We
therefore expect to observe more debt conservatism (and equity conservatism) among Depression CEOs
than among their peers. Unlike overconfident CEOs, who might also display debt conservatism,
Depression CEOs do not overestimate the returns arising from hand-picked investment projects; they
simply have a preference for self-sufficiency. Thus, while both Depression CEOs and overconfident
CEOs may display debt conservatism, the mechanism is different. Depression CEOs underinvest to avoid
risky capital, but do not overinvest in bad projects when cash rich.
HYPOTHESIS 3. CEOs who experienced the Great Depression in early adulthood access risky capital
markets more conservatively than other CEOs.
Evidence from the psychology literature suggests that CEOs with a military background, especially
those with battlefield experience, are likely to have a preference for more aggressive policies, or less risk
aversion. Service in the U.S. armed forces during World War II in particular is likely to reinforce the
connection between aggressiveness and success. Unlike overconfident CEOs, military CEOs do not
necessarily overestimate returns from investment. They may invest and access external capital markets
optimally, but choose to lever up their companies more aggressively than other CEOs.
HYPOTHESIS 4. CEOs with a military background maintain higher leverage than other CEOs.
The lower half of Table I summarizes the capital structure predictions for Depression CEOs and
military CEOs that arise from Hypotheses 3 and 4.
11
II. Data
To measure CEO beliefs about future stock performance, we use several data sets with different
sample periods. Our primary sample is the data on CEOs' personal investments from Hall and Liebman
(1998) and Yermack (1995). The data detail the stock ownership and set of option packages – including
exercise price, remaining duration, and number of underlying shares – for the CEOs of 477 publicly
traded U.S. firms between 1980 and 1994, year by year. To be included in the sample, firms must appear
at least four times on one of the Forbes magazine lists of largest U.S. companies between 1984 and 1994.
The sample selection is important since Frank and Goyal (2003) find systematic differences between the
financing choices of small and large companies. In Section VI, we extend our analysis to smaller firms
and to more recent years using data from Execucomp and Thomson Financial.
We use data on CEO age to identify birth cohort; in particular, we identify CEOs born between 1920
and 1929 as Depression babies. We also supplement the portfolio data with hand-collected information on
CEO military service from Dun and Bradstreet (D&B) and Who's Who in Finance and Industry. We
classify CEOs as World War II veterans if the Who's Who or D&B entry specifically references World
War II or if the term of service includes any years between 1941 and 1945. Similarly, we identify veterans
of the Korean (1950 to 1953) and Vietnam (1965 to 1973) Wars.
As an alternative way to measure CEO characteristics, we use portrayals in the business press. We
hand-collect annual data on the press coverage of sample CEOs in The Wall Street Journal, The New York
Times, Business Week, Financial Times, and The Economist. We count the total number of articles
referring to the CEOs using the words “confident” or “confidence;” “optimistic” or “optimism;” and
“reliable,” “cautious,” “practical,” “frugal,” “conservative,” or “steady.” We hand-check each article to
ensure that the adjectives are used to describe the CEO and to determine whether they are negated. We
also collect detailed information on the context of each reference. For example, we record whether the
article is about the CEO, the firm, or the market or industry as a whole and, if the article is about the firm,
the specific policies it references (earnings, products, mergers, culture).
12
We merge these CEO-level data with Thomson's SDC Platinum data on U.S. new issues of common
stock and convertible and nonconvertible debt and preferred stock, including U.S. Rule 144A issues.
Alternatively, we use Compustat cash flow statement data to measure debt and equity issuance, including
loans and other forms of private debt. Net debt issuance is the difference between long-term debt issuance
(dltis) and long-term debt reduction (dltr). Net equity issuance is the difference between sales of common
stock (sstk) and stock repurchases (prstkc). Long-term debt reduction and stock repurchases are set to zero
if they are missing or combined with other data items. We exclude financial firms and regulated utilities
(SIC codes 6000 to 6999 and 4900 to 4999).
To measure financing needs, we construct the net financing deficit, that is, the amount the CEO has to
raise through debt or equity issues in a given firm-year to cover expenditures:
∆ ,
where DIV is cash dividends; I is net investment (capital expenditures + increase in investments +
acquisitions + other uses of funds - sale of property, plants and equipment (PPE) - sale of investment);10
W is the change in working capital (change in operating working capital + change in cash and cash
equivalents + change in current debt);11 and C is cash flow after interest and taxes (income before
extraordinary items + depreciation and amortization + extraordinary items and discontinued operations +
deferred taxes + equity in net loss (earnings) + other funds from operations + gain (loss) from sales of
PPE and other investments).12 All definitions follow Frank and Goyal (2003). We use the value of book
assets (at) taken at the beginning of the fiscal year to normalize debt and equity issuance and the
financing deficit.
We also use Compustat to construct several firm-level control variables. We measure Q as the ratio of
market value of assets to book value of assets. Market value of assets is defined as book value of total
assets (at) plus market equity minus book equity. Market equity is defined as common shares outstanding
(csho) times fiscal year closing price (prcc_f). Book equity is calculated as stockholders' equity (seq) (or
the first available of common equity (ceq) plus preferred stock par value (pstk) or total assets (at) minus
13
total liabilities (lt)) minus preferred stock liquidating value (pstkl) (or the first available of redemption
value (pstkrv) or par value (pstk)) plus balance sheet deferred taxes and investment tax credit (txditc)
when available minus post-retirement assets (prba) when available. Book value of assets is total assets
(at).13 We measure profitability as operating income before depreciation (oibdp) and asset tangibility as
PPE (ppent). We normalize both variables using the book value of assets at the beginning of the fiscal
year. Book leverage is the quantity debt in current liabilities (dlc) plus long-term debt (dltt) divided by the
quantity debt in current liabilities (dlc) plus long-term debt (dltt) plus common equity (ceq). We measure
market leverage by replacing common equity with market equity in the definition of book leverage.
Finally, we use the variable kink, provided by John Graham. The construction of this variable and the
associated control variables are described in Graham (2000).14 For each firm, kink is defined as the ratio
of the hypothetical level of interest at which the expected marginal tax-shield benefits of debt start to fall
(numerator) to the actual amount of interest paid (denominator). It captures the amount of additional debt
the firm could issue before the marginal benefit of interest deductions begins to decline: when a firm is
committed to low future interest payments, all of the interest payments are likely to be deducted from
future profits, and the tax benefits are equal to the interest payment times the marginal corporate tax rate.
As debt levels and future interest payments increase, it becomes increasingly likely that the company
cannot generate enough profits to fully realize the interest tax shield. Consequently, the expected marginal
tax benefit is decreasing when an additional dollar of interest payment is committed. Assuming that the
marginal cost of debt intersects the downward-sloping portion of the marginal benefit curve, kink greater
than one indicates that the firm has “left money on the table.” The potential gain from adding debt
increases with kink. In this sense, high-kink firms use debt more conservatively. Thus, kink provides a
measure of the aggressiveness with which firms access debt markets that is comparable across firms and
over time.
The left columns of Table II present summary statistics for our sample firms after excluding financial
firms and utilities (263 firms).
14
Insert Table II here.
Panel A shows the Compustat data and the distribution across the 12 Fama and French industries.15 Panel
B summarizes the variable kink and the control variables used in the kink regressions. In the latter
analysis, the sample is reduced to 189 firms due to missing values for the controls required in the kink
analysis. Panel C summarizes CEO characteristics. CEOs' age, tenure, and ownership of stock and options
generally serve as control variables; Depression Baby and Military Experience are our proxies for past
formative experiences. In the baseline sample, the Depression indicator is equal to one for 40% of the
firm-year observations. The subsample we use for our analysis of Depression effects requires the kink
controls and consists of 343 CEOs, 132 of whom are Depression babies. In the baseline sample, CEOs are
coded as having military experience in 22% of firm-years. Note that we limit the sample to CEOs for
whom we were able to locate a Who's Who or D&B entry, resulting in a lower number of observations
(1,617). The subsample consists of 285 CEOs, 64 of whom have served in the armed forces. This
restriction should minimize measurement error, though selective reporting remains a possible source of
bias.
III. Measuring Overconfidence and Formative Experiences
Our main approach to identify CEO overconfidence is to infer CEOs' beliefs about future stock
performance from their decisions to hold nontradeable company stock options. This approach exploits
CEOs' high exposure to the idiosyncratic risk of their companies: CEO compensation typically includes
large grants of company stock and options. In addition, CEOs' human capital is invested in their firms, so
that bad firm performance also reduces their outside options. In order to diversify, optimizing CEOs
exercise their executive options early. The exact threshold for rational exercise depends on individual
wealth, risk aversion, and diversification (Hall and Murphy (2002)). CEOs who overestimate future
returns of their firms, however, may hold in-the-money options beyond the rational threshold in order to
personally benefit from expected stock price appreciation. Malmendier and Tate (2008) translate this
15
logic into three measures of overconfidence using the Hall-Liebman-Yermack portfolio data. To begin,
we construct the same measures, which allows us to interpret our results within the context of previous
findings.
Longholder. The measure Longholder is an indicator for all CEOs who, at any point during the sample
period, hold an option until the year of expiration even though the option is at least 40% in the money
entering its final year. The exercise threshold of 40% corresponds to constant relative risk aversion of
three and 67% of wealth in company stock in the rational option exercise model of Hall and Murphy
(2002). Note that Longholder is a managerial fixed effect. The remaining measures allow for within-CEO
variation.
Pre- and Post-Longholder. The measure Post-Longholder is an indicator equal to one only after the
CEO for the first time holds an option until expiration, provided it exceeds the 40% threshold. This
measure allows us to isolate financing decisions after the CEO has revealed his confidence level. The
measure Pre-Longholder is equal to one for the other years in which Longholder is equal to one.
Holder 67. We consider option holdings with five years remaining duration. Maintaining our prior
assumptions on risk aversion and diversification, the new exercise threshold in the Hall-Murphy
framework is 67% in the money. The measure Holder 67 is binary and is set equal to one once a CEO
fails to exercise options with five years remaining duration despite a stock price increase of at least 67%
since the grant date. We restrict the comparison group to CEOs who face this exercise decision but choose
to exercise rather than hold. A CEO enters the sample once he has an option with five years remaining
duration that is at least 67% in the money.
Our second approach to measure CEO overconfidence uses the perception of outsiders, as captured by
CEO characterizations in the business press, instead of beliefs revealed by direct CEO choices. Our press
data, described in Section II, provides the year-by-year number of articles that refer to each sample CEO.
We construct an indicator of CEO confidence that compares the number of past articles using the terms
16
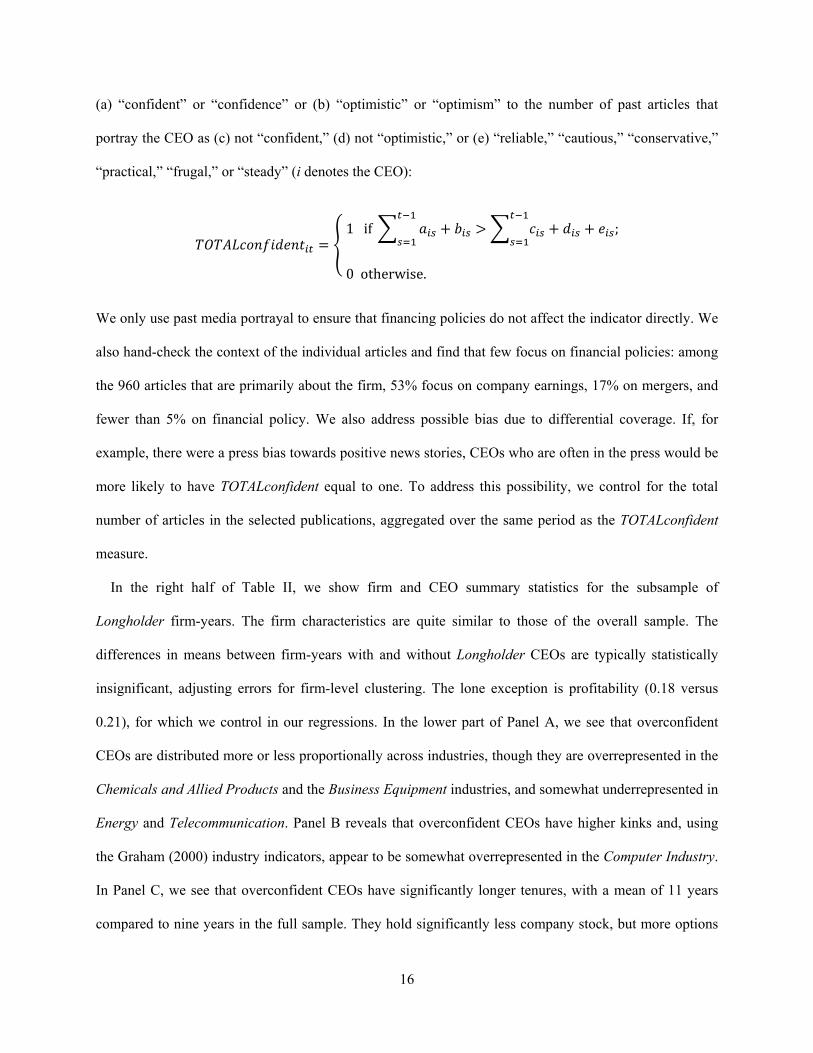
(a) “confident” or “confidence” or (b) “optimistic” or “optimism” to the number of past articles that
portray the CEO as (c) not “confident,” (d) not “optimistic,” or (e) “reliable,” “cautious,” “conservative,”
“practical,” “frugal,” or “steady” (i denotes the CEO):
1 if ;
0 otherwise.
We only use past media portrayal to ensure that financing policies do not affect the indicator directly. We
also hand-check the context of the individual articles and find that few focus on financial policies: among
the 960 articles that are primarily about the firm, 53% focus on company earnings, 17% on mergers, and
fewer than 5% on financial policy. We also address possible bias due to differential coverage. If, for
example, there were a press bias towards positive news stories, CEOs who are often in the press would be
more likely to have TOTALconfident equal to one. To address this possibility, we control for the total
number of articles in the selected publications, aggregated over the same period as the TOTALconfident
measure.
In the right half of Table II, we show firm and CEO summary statistics for the subsample of
Longholder firm-years. The firm characteristics are quite similar to those of the overall sample. The
differences in means between firm-years with and without Longholder CEOs are typically statistically
insignificant, adjusting errors for firm-level clustering. The lone exception is profitability (0.18 versus
0.21), for which we control in our regressions. In the lower part of Panel A, we see that overconfident
CEOs are distributed more or less proportionally across industries, though they are overrepresented in the
Chemicals and Allied Products and the Business Equipment industries, and somewhat underrepresented in
Energy and Telecommunication. Panel B reveals that overconfident CEOs have higher kinks and, using
the Graham (2000) industry indicators, appear to be somewhat overrepresented in the Computer Industry.
In Panel C, we see that overconfident CEOs have significantly longer tenures, with a mean of 11 years
compared to nine years in the full sample. They hold significantly less company stock, but more options
17
than other CEOs. They are also more likely both to have served in the military and to be members of the
Great Depression cohort. The sample characteristics are similar using the other measures of
overconfidence. Moreover, the overconfidence measures are all positively and significantly correlated
with each other: the pairwise correlations between Longholder and Holder 67, Pre-Longholder, Post-
Longholder, and TOTALconfident, respectively, are 0.42, 0.76, 0.58, and 0.09. In our regression analyses,
we focus on the Longholder measure. However, we report differences in our results across measures in
the text.
In Table III, we report the pairwise correlations between several firm and CEO characteristics and our
two measures of formative past experiences, Depression Baby and Military Experience.
Insert Table III here.
Depression Baby CEOs have significantly higher levels of Graham's kink, indicating that they access debt
markets conservatively. They are also significantly less likely than other CEOs to issue equity,
conditional on accessing public securities markets. Military CEOs, on the other hand, do not show any
aversion to debt markets and are significantly more likely to issue equity, conditional on accessing public
markets. They also appear to have higher leverage, though the correlation is not statistically significant.
The directions of the effects are consistent with military experience as a proxy for (overly) aggressive
beliefs and early-life experience during the Great Depression as a proxy for conservatism. It is also
interesting, in light of our hypotheses, that military CEOs are significantly more likely to make
acquisitions (and have worse operating performance).16 However, there is no correlation between the
Depression cohort and merger frequency and a positive relation with ROA.
As a final step, we check whether our findings on Depression and military CEOs are consistent with
outsiders' perceptions of these CEOs. Mirroring our analysis of overconfidence, we use CEOs' portrayal
in the business press and the press data described in Section II. Individuals who experienced the Great
Depression early in life have a preference for self-sufficiency and conservative financing choices. These
preferences are likely to manifest themselves more generally in a conservative leadership style. Consistent
18
with this story, we find a positive and significant correlation between coverage in the business press as
“cautious,” “practical,” “reliable,” “conservative,” “frugal,” or “steady” (variable TOTALcautious) and
membership in the Depression cohort. Military exposure instead induces aggressiveness and risk
tolerance. Indeed, we find that military service has a significant negative correlation with TOTALcautious.
We also test these correlations in a regression framework, controlling for differential press coverage and
CEO age. Despite the imprecision of the measures, the direction of the effects remains the same, though
only the negative correlation between TOTALcautious and military service remains statistically
significant.
Finally, we compare our two press measures: TOTALcautious and TOTALconfident. Because both
measures require coverage of the CEO in the press, they have a significant positive pairwise correlation.
However, regressing TOTALcautious on TOTALconfident controlling for total mentions in the press
reveals the expected negative relation.
IV. Managerial Traits and Capital Structure Choices
A. Debt vs. Equity
Next, we test the capital structure predictions of differences in CEO traits. We begin with the choice
between debt and equity. Here, only the overconfidence model makes a prediction (see Table I).
Overconfident managers are reluctant to issue equity because they believe that it dilutes the claims of
existing shareholders. They are also reluctant to issue risky debt because they believe that the interest rate
creditors demand is too high given the distribution of future returns. On the other hand, they overestimate
their financing needs because they overestimate returns to investment. Thus, overconfident CEOs may
access public markets with higher or lower baseline frequencies. Conditional on accessing external
financing, however, overconfident CEOs generally prefer debt to equity since debt allows current
shareholders to remain the residual claimant on the firm's future cash flows. Thus, we test whether,
conditional on accessing public securities markets, overconfident CEOs are less likely to issue equity.
19
Specification 1: Public Issues. Panel A of Table IV presents the frequencies of equity and debt issues,
conditional on conducting a public issue.17 Equity issues are issues of common or preferred stock, and
debt issues are issues of nonconvertible debt. Years with both a debt and an equity issue count in both
categories.
Insert Table IV here.
We find that equity issues are less frequent for overconfident CEOs under all measures. For Longholder
CEOs, 31% of firm-years with public issues contain at least one equity issue. This percentage is virtually
constant across Pre- and Post-Longholder years. When Longholder is zero, 42% of issue years contain an
equity issue. The difference is statistically significant at the 5% level, where standard errors are adjusted
for firm-level clustering. The results are stronger economically and statistically using the Holder 67 and
TOTALconfident measures: Holder 67 CEOs issue equity 23% of the time, but CEOs in the comparison
group issue equity 39% of the time, and TOTALconfident CEOs issue equity 25% of the time, but CEOs
for whom TOTALconfident is zero issue equity 48% of the time. For both measures, the differences are
significant at the 1% level, again adjusted for firm-level clustering. Overconfident CEOs also issue debt at
a higher frequency than other CEOs under all measures. However, the difference is statistically significant
only using the TOTALconfident measure. There are no significant differences for hybrid securities.
We test whether these cross-sectional patterns are robust to the inclusion of CEO- and firm-level
controls. Panel B of Table IV presents a logit model, which uses an indicator for “at least one equity issue
during the fiscal year” as the dependent variable. We first run a baseline logit with Longholder as the only
explanatory variable (Column 1). We then add portfolio controls for the incentive effects of performance-
based compensation: the percentage of company stock and the number of vested options held by the CEO
(Column 2). Options are scaled by shares outstanding and multiplied by 10 so that the mean is
comparable to the mean of stock holdings. In Column 3, we add the standard firm controls from the
capital structure literature – the natural logarithm of sales, profitability, tangibility, and Q – to capture the
effects of known cross-sectional determinants of changes in leverage (Rajan and Zingales (1995)). In
20
Column 4, we add book leverage to capture systematic differences in the ability to access debt markets,
due, for example, to covenants on existing debt contracts.18 We then add year effects to control for the
possibility that overconfident CEO-years are disproportionately clustered in cold markets for equity
issuance (Column 5). Finally, in Column 6 we include the full set of firm-level controls and industry
dummies from Graham (2000) as an alternative way to capture traditional capital structure determinants.
These controls (described in Panel B of Table II) include the binary indicators No Dividend, Negative
Owners' Equity, and Net-Operating-Loss Carryforwards and five industry groupings, as well as
continuous measures for firm size, expected cost of financial distress (ECOST), cyclicality of operating
earnings, return on assets, z-score, current and quick ratios, R&D and advertising expenditures, and Q.
All controls are measured at the beginning of the fiscal year. All standard errors are adjusted for firm-
level clustering.
The results confirm the pattern in the raw data. Across all specifications, Longholder CEOs are 37% to
49% less likely than their peers to issue equity. The estimated effects are significant at the 5% or 10%
levels. Among the CEO controls, vested option holdings increase the odds of issuing equity, though the
large coefficient estimate is driven by five outlier observations in the upper tail of the distribution.
Eliminating those observations substantially decreases the coefficient without affecting the Longholder
coefficient. Among the standard firm controls, only sales are consistently significant. Smaller firms are
more likely to issue equity. Surprisingly, Q does not seem to positively predict equity issues. As a
robustness check, we control for stock returns over the prior year. We verify that past returns predict
significantly higher equity issuance without materially affecting the Longholder estimate. In the
specification with kink controls, firms that do not pay dividends and have more cyclical earnings appear
to issue more equity, while firms with higher R&D expenditures issue less.
We also consider the robustness of the results to alternative sets of controls. For example, we re-
estimate the regression using the available controls from Gomes and Phillips (2007).19 Missing I/B/E/S
data requires that we drop observations prior to 1984. However, even in the roughly 40% smaller sample,
we find qualitatively similar, though statistically insignificant, results (Longholder coefficient = -0.395; p-
21
value = 0.188). Likewise, including changes in sales, Q, profitability, or tangibility either in addition to or
in lieu of the levels has little effect on the results. We also find similar results using the Holder 67 and
TOTALconfident measures. The measured effect on equity issuance is statistically and economically
stronger than the Longholder results in all cases but one. The one exception is the estimation including all
controls and year effects with TOTALconfident as the overconfidence measure (odds ratio = 72%; p-value
= 0.18). There are also no significant differences between the Pre- and Post-Longholder portions of the
Longholder effect. Finally, as in Panel A, we do not find consistently significant results when we use
either debt or hybrid issuance as the dependent variable.
Overall, CEOs that we classify as overconfident are less likely to issue equity conditional on accessing
public securities markets, controlling for standard determinants of issuance decisions.
Specification 2: Financing Deficit. We repeat the test in the standard “financing deficit framework” of
Shyam-Sunder and Myers (1999). The financing deficit measures the amount of expenditures requiring
external finance. We test whether overconfident CEOs cover more of their financing deficits using debt
than other CEOs. This approach is analogous to testing for fewer equity issues conditional on issuing any
public security in Specification 1 above, but adds bank loans and other private sources of financing to the
analysis and focuses on the amount of finance raised rather than the frequency with which it is raised. It
also uses data from cash flow statements and hence allows us to use the full sample of firm-years rather
than only years with a public security issuance. One immediate advantage of the larger sample is that we
can include firm fixed effects, that is, identify the effect of overconfidence separately from time-invariant
firm effects.
Note that overconfident CEOs may raise more funds than rational CEOs (since they overestimate the
returns to investment) or less funds (since they perceive external financing to be overpriced). Thus, rather
than asking whether overconfident CEOs raise more dollars of debt or fewer dollars of equity than their
peers, the appropriate test is whether the mix of external finance depends on overconfidence: whatever the
determinants of the baseline relation between debt financing and the financing deficit, do overconfident
22
CEOs demonstrate a heightened preference for debt? As a result, our findings are unaffected by
controversy over trade-off versus pecking-order explanations of financing deficit regressions.
We estimate the following regression specification:
∆ ∙ ∙ ∆ , (1)
where Debt is long-term debt issues minus long-term debt reduction (Net Debt Issues), normalized by
beginning-of-year assets, FD denotes the financing deficit, as defined in Section II, is the
overconfidence proxy, and X includes CEO- and firm-level controls. At the CEO level, we control for
stock ownership and vested options. At the firm level, we use the controls from Frank and Goyal (2003):
book leverage and changes in profitability, tangibility, the natural logarithm of sales, and Q. All controls
are included as level effects and interacted with FD. We also include firm fixed effects and their
interactions with FD. The fixed effects allow us to separate effects that we attribute to the CEO from
time-invariant firm effects. In the case of Holder 67 and TOTALconfident, we also exploit variation
between a CEO's overconfident and non-overconfident years. Finally, we include year effects to control
for the effects of hot equity issuance markets. All standard errors account for firm-level clustering.
Table V presents the results using Longholder as the overconfidence proxy.
Insert Table V here.
For comparison to prior literature, Column 1 presents a baseline regression without fixed effects or
controls. The coefficient of 0.729 on the financing deficit is very close to the effect estimated in Shyam-
Sunder and Myers (1999), reflecting that our sample of large firms is more similar to their sample than to
the Frank and Goyal (2003) sample.20 In Column 2, we add Longholder, its interaction with the financing
deficit, firm fixed effects, and the interactions of firm fixed effects with the financing deficit. We drop the
level effect of the financing deficit when including interactions of the financing deficit with firm fixed
effects to avoid collinearity. Including fixed effects and their interactions with the financing deficit means
that we estimate separate intercepts and slopes for each individual firm. Our test identifies the effect of
23
overconfidence on the proportion of the financing deficit covered with debt using only variation that is
not confounded by firm-specific effects. In our data, there are 35 firms in which we observe a change
from an overconfident to a rational CEO, accounting for 371 of the 2,385 sample years. While a small
portion of the overall variation in the data (consistent with the high value of R² in these regressions), this
variation is also the cleanest to interpret. In Column 3, we add controls for CEO stock and option
ownership, and in Column 4 year fixed effects. Finally, in Column 5 we add controls for changes in sales,
Q, profitability, and tangibility and in Column 6 we add the lag of book leverage.21
Among the controls, deviations from (within-firm) average book leverage are negatively related to debt
issues, consistent with leverage targeting. Above-average changes in Q predict less financing deficit
covered with debt, consistent, for example, with market timing. More debt is used when CEOs have
above average stock holdings, consistent with either incentive effects in the presence of positive
information or overconfidence. Surprisingly, CEOs use significantly less debt when their option holdings
are above average, though the economic magnitude is small (one to two cents less debt per $1 of
financing deficit for a one-standard deviation increase in option holdings). In all specifications,
Longholders use more debt than non-Longholder successors or predecessors in the same firm. The effect
is significant at the 10% level and economically large, ranging from 32 to 35 cents more debt per $1 of
financing deficit. At the mean of the annual financing deficit ($43m), the estimates imply $15m more in
debt issuance.
The results using the TOTALconfident proxy are qualitatively similar, though weaker economically and
statistically. We find no significant difference between the Pre- and Post-Longholder portions of the
Longholder estimate and very little effect of Holder 67, perhaps due to reduced sample size. Overall, we
confirm the findings from Specification 1 using the financing deficit framework with firm fixed effects.
B. Internal vs. External Finance
Overconfidence predicts not only a preference for debt over equity, but also for internal over external
finance. A possible consequence is debt conservatism: even though overconfident CEOs choose debt over
24
equity when they access external capital markets, their preference is to forgo external markets altogether.
If perceived financing costs dominate overestimated investment returns or if cash is abundant, they may
not access those markets frequently enough to take full advantage of the tax benefits of debt. In other
words, even if overconfident CEOs choose more debt relative to equity than rational CEOs, the level of
debt chosen may still be conservative relative to available tax benefits.
Early-life experience during the Great Depression also predicts an aversion to external capital.
However, unlike overconfidence, it does not predict misassessment of investment returns. Thus, debt
conservatism is a necessary, not just possible, consequence.
To test these hypotheses, we use the kink variable of Graham (2000) to measure debt conservatism. The
kink captures how much a firm could increase debt before the expected tax benefit begins to decline.
Graham shows that, on average, firms leave money on the table by following excessively conservative
debt policies. We test whether managerial traits explain a portion of the effect. We use the following
regression specification:
∆ , (2)
where is the managerial trait of interest and X are firm- and CEO-level controls. We include the firm
controls from Graham's original analysis, to ease comparison. We estimate tobit regressions because kink
is artificially bounded between zero and eight. All standard errors are clustered at the firm level. The null
hypothesis is that β2 is zero; overconfidence and Depression experience predict β2 > 0. Though these
hypotheses are one-tailed, we report the results of two-tailed tests, resulting in a higher threshold for
rejecting the null of no effect. We also test whether CEOs with high kinks simultaneously raise equity as
a substitute for debt, which would falsify the overconfidence and Depression baby hypotheses: CEOs
should be both debt- and equity-conservative.
In Table VI, Panel A, we present tobit estimates of model (2).
Insert Table VI here.
25
Column 1 shows a baseline regression of kink on Longholder without controls. Column 2 adds CEO-level
controls and Column 3 adds the full set of firm-level controls and industry dummies from Graham
(2000).22 The large number of kink controls reduces the sample to only 189 firms. Among the controls, we
find some evidence that more vested option holdings are associated with lower kinks. Of Graham's 19
firm-level and industry controls, 16 have qualitatively similar effects in his and our estimations. The
exceptions are negative owners' equity, the natural log of sales, and advertising expense over sales, which
have opposite signs.23
We find that Longholder CEOs have higher kinks across all three specifications. The coefficient
estimates are significant at the 10% level and range from 0.647 to 1.256, representing a 16% to 32%
increase in kink from its mean and an increase of 0.24 to 0.46 standard deviations.
In Columns 4 and 5, we provide parallel estimates substituting Depression Baby for Longholder.
Column 4 presents the baseline regression without controls. Column 5 adds CEO age, CEO tenure, and
the Graham (2000) controls. The CEO age control is particularly important in separating the effect of the
Depression cohort from the effect of higher age.24 We find that Depression babies have significantly
higher levels of the kink variable. Economically, the 0.5053 increase in kink in Column 5 represents a
13% increase from the sample mean. Hence, the Depression effect is similar in magnitude to the
overconfidence effect.
Finally, Column 6 shows a specification that includes both the Longholder overconfidence measure
(and portfolio controls) and Depression Baby. This specification is important given the evidence in Table
II that Longholder CEOs are more often Depression babies. We find nearly identical point estimates on
both Depression Baby and Longholder, though the Longholder coefficient becomes marginally
insignificant. Thus, Depression experience appears to induce a preference for self-sufficiency that is
distinct from the effect of overconfidence.25
In Panel B, we test whether debt-conservative Longholder and Depression Baby CEOs are also equity-
conservative – that is, issue less equity as their firms' kinks increase – consistent with a general aversion
to external finance. We tabulate the distribution of net equity issues among Longholder CEOs and among
26
Depression Baby CEOs separately for four different levels of kink: (i) kink ≤1, (ii) 1< kink ≤3, (iii) 3<
kink ≤7, and (iv) kink >7. We find that higher levels of kink are associated with less equity issuance. Both
the mean and the median of net equity issuance decline monotonically in kink. For Longholder CEOs, the
differences in mean equity issues between groups (i) and (ii) and groups (i) and (iii) have p-values of
0.016 and 0.052, respectively, with errors clustered at the firm level. The remaining cross-group
differences are not statistically significant. For Depression CEOs, those with the highest values of the kink
variable are actually net repurchasers of company equity, on average.26 Thus, both Longholder and
Depression CEOs who display debt conservatism also issue equity more conservatively, implying that
they rely more on internal finance.27
We perform a number of robustness checks on this evidence. One shortcoming of the tobit analysis is
that we cannot include firm fixed effects without biasing the coefficient estimates due to the incidental
parameters problem. To address (uncontrolled) cross-sectional differences between firms with and
without Longholder (or Depression Baby) CEOs, we replicate our findings in a conditional logit
framework that uses only within-firm variation for identification and an indicator for kink > 1 as the
dependent variable. Though we lose much of the information in the kink variable, our results are
qualitatively similar. In the specification mirroring Column 3, we find an odds ratio of 2.23, meaning that
Longholder CEOs have more than double the odds of having kinks exceeding one, though the estimate is
not statistically significant. The Depression Baby estimate is less robust to the fixed effects specification.
A possible explanation is a greater ease in matching CEO to firm preferences based on observable cohort
effects than (ex ante) unobservable cognitive biases.
Unlike Depression babies, overconfident CEOs overestimate investment returns. They do not have a
general aversion to external capital, but avoid risky capital only if (1) cash is abundant or (2) perceived
costs exceed (overestimated) returns to investment. We take two additional steps to ensure that the
measured aversion to debt among Longholder CEOs conforms to the full overconfidence hypothesis.
First, we explore the effect of cash holdings on our estimates of the Longholder effect. We add the
indicator Low Cash Status and its interaction with Longholder to the regression specification in Panel A,
27
Column 3, where Low Cash Status is equal to one if the firm's cash stock at the beginning of the year,
divided by mean industry investment, is at or below the 40th percentile in our sample.28 Mean industry
investment is calculated separately for each year and each Fama-French industry shown in Panel A of
Table II. We find no evidence of higher kinks among Longholder CEOs with low internal funds. Only
Longholder CEOs with abundant cash have significantly higher kinks than rational CEOs. The statistical
significance of the effect increases (p-value = 0.025). While the difference in kinks between Longholders
with and without low cash is insignificant (p-value = 0.214), the result confirms that high kinks are not
driven by CEOs who cannot use internal funds.
Second, we analyze the relation between kink and creditworthiness. The overconfidence hypothesis
implies that debt aversion should not be found among firms with access to riskless debt financing, for
which there is no disagreement about the appropriate interest rate. We use the S&P Long-Term Domestic
Issuer Credit Rating to split the sample into thirds: firm-years with A+ ratings or better are in the highest
third, and firm-years with BBB ratings or worse are in the lowest third. We drop firms with missing credit
ratings. Repeating the tobit analysis of Table VI, Panel A, on each subsample, we find that the effect is
concentrated in the middle third: the coefficients and p-values for Longholder in the Column 3
specification are 0.489 (0.32), 0.823 (0.018), and 0.412 (0.178) for low, middle, and high credit ratings.
The lack of an effect among the highest-rated firms confirms that Longholder CEOs are not reluctant to
raise (nearly) riskless debt. Moreover, the weak effect among the lowest-rated firms suggests that high
kinks among Longholder CEOs are not an artifact of systematically worse credit ratings.
Finally, we re-estimate our regressions using the alternative proxies for overconfidence. We find
similar results using Holder 67 and little difference across the Pre- and Post-Longholder portions of the
Longholder measure. However, TOTALconfident CEOs have lower kinks than other CEOs, though the
result is not robust to the fixed effects logit specification. Given our earlier finding in Table III that only
TOTALconfident CEOs are associated with a significantly higher probability of public debt issuance, one
possible interpretation for the difference in results is that, among overconfident CEOs, the press is most
28
likely to identify those who demonstrate their beliefs by overinvesting, thereby requiring higher external
finance.
C. Leverage
Recent research argues that there are large unexplained time-invariant effects in leverage (Lemmon,
Roberts, and Zender (2008)). One interesting question is whether managerial traits, such as
overconfidence, can explain these differences across firms: do differences in financing (or changes in
leverage) accumulate into differences in capital structures (levels of leverage)? In the context of
overconfidence, this is an empirical question since the theoretical prediction could go either way,
depending on the relation between overestimated investment returns, cash holdings, and perceived
financing costs. In the context of military experience, however, we have a clear prediction of higher
leverage.
Unfortunately, it is difficult to assess causality in cross-sectional leverage regressions and, specifically,
to determine whether the effect is due to the manager or to the firm. For example, firms that leverage
more aggressively may also be attractive places for overconfident CEOs to work. Alternatively,
overconfident CEOs may be attracted by the spare debt capacity in low leverage firms. In other words,
selection effects might obscure the true effect of individual CEOs. In order to obtain identification, we
follow an approach similar to Bertrand and Schoar (2003) and compare leverage under different CEOs
operating the same firm. We estimate the following regression:
∆ , (3)
where Leverage is end-of-fiscal-year market leverage, X is a vector of firm and CEO control variables,
and is the managerial trait of interest.
We begin by estimating two baseline regressions for comparison with existing literature. In Column 1
of Table VII, we estimate a pooled regression, including our standard set of firm-level controls:
profitability, tangibility, size, Q, and the financing deficit. Standard errors are clustered at the firm level.
29
Insert Table VII here.
The controls explain 34% of the variation in leverage and have the typical directional effects: size (+),
profitability (-), tangibility (+), Q (-), and financing deficit (+).29 In Column 2, we add firm fixed effects.
Consistent with Lemmon, Roberts, and Zender (2008), we find that adding firm effects more than doubles
the R² of the regression. Among the controls, only tangibility loses explanatory power when estimated
using within-firm variation.
Next, we test whether differences in managerial confidence levels can explain remaining within-firm
variation in leverage. Adding Longholder (Column 3), we find that overconfident CEOs maintain
significantly higher leverage than their predecessors or successors. The percentage of explained within-
firm variation increases from 11% to 12%. The effect is robust to the inclusion of several important
controls: In Column 4, we add five lags of stock returns to capture the effect of changes in stock prices on
leverage ratios (Welch (2004))30 and on option exercise. As expected, stock returns have a significantly
negative effect on leverage. The effect decays in the length of the lag, with the fifth lag being
insignificant. Including stock returns also eliminates the predictive power of Q while improving the R² of
the regression. In Column 5, we add our standard CEO controls for stock and option holdings. If CEOs
have private information, then these controls capture variation in CEOs' concern over diluting their
personal equity stakes through new issues. We also add year effects and both CEO tenure and its
interaction with Longholder to the regression. We find a negative coefficient on the interaction of tenure
with Longholder, which may reflect learning – Longholder CEOs learn to issue risky capital more
appropriately as their tenures increase – but may also reflect a tendency of Longholder CEOs to exhaust
their firms' debt capacities early in their tenures and subsequently finance desired (over-)investment using
equity.
The effect of Longholder on leverage is large. In the Column 4 specification, for example, replacing a
rational CEO with an overconfident one increases firm leverage by 20% of a standard deviation or,
alternatively, by 15% from its mean level. The true CEO effect may be even larger since we are
30
conservative in separating out time-invariant firm effects: some of the effects we attribute to the firm may
actually reflect the influence of past and current CEOs. In particular, our estimates of β₃ do not exploit
any information from firms with only a single (overconfident) CEO during our sample period; however,
such long-tenured CEOs may have the largest effects on their firms' capital structures.
Next, we test whether CEOs with a military background pursue more aggressive financial policies. In
Column 6, we find that military CEOs choose higher leverage than their predecessors or successors.
Economically, the effect is smaller than the effect of overconfidence, increasing leverage by 17% of a
standard deviation or, alternatively, by 13% from its mean. Statistically, the baseline effect of military
experience is significant at the 10% level after clustering at the firm level. In Column 7, we add our
standard set of firm-level controls – profitability, tangibility, firm size, Q, and the financing deficit – and
the relevant CEO-level controls – age and tenure. The coefficient of past military service is virtually
unaffected. In Column 8, we refine our measure of military experience by separating World War II
veterans, who are more likely to have had combat exposure, from other military CEOs.31 We find that the
effect of military service on leverage choices comes primarily from World War II veterans. Among this
group, the chosen leverage is 25% higher than the sample mean, and the difference relative to other
military experience is significant at the 5% level. This result also helps to address the self-selection
explanation, under which aggressive or risk-tolerant individuals choose to serve in the military (and later
take more aggressive managerial decisions), as involuntary service was common during World War II.
Finally, in Column 9, we include Military Experience and World War II Veteran with the Longholder
overconfidence measure and the union of relevant controls. Despite the reduced sample size, both the
Longholder and World War II Veteran variables remain positive and significant, suggesting that they
capture different subsets of CEOs or traits.32
We perform a number of additional robustness checks, using alternative variable definitions, regression
specifications, and methodology. First, we consider book rather than market leverage as the dependent
variable. The results are qualitatively similar though statistically weaker. For example, the coefficient
estimate on Longholder is 0.042 with a t-statistic of 1.51 in the Column 5 specification. One potential
31
reason for the discrepancy is that book equity – as a historical accounting measure – has only a noisy
relation to the economic quantity of interest, the value of shareholders' cash flow claims. We also find
similar results using an alternative methodology inspired by Baker and Wurgler (2002), whereby we
measure the relation between the change in leverage and the number of overconfident sample CEO-years
(or, alternatively, “external finance weighted” overconfidence). Finally, we find similar results using the
TOTALconfident proxy, with a few notable differences. First, the relation with the overconfidence proxy
is stronger in the cross-section than within firms. Second, the relation is stronger when we remove within-
CEO variation. Finally, the effect is typically strongest using book, rather than market, leverage as the
dependent variable.
Overall, our results support the hypothesis that managerial traits help to explain variation in capital
structure that cannot be explained by time-invariant firm differences or variation in traditional capital
structure determinants. Though we cannot identify the effect econometrically (due to joint determination),
the evidence suggests that managerial factors account at least partially for the time-invariant, firm-specific
component of leverage uncovered in recent empirical studies. The results are also consistent with
predictions of the overconfidence hypothesis: overconfident CEOs view equity financing as a last resort,
resulting in measurable differences in firm leverage ratios compared to their rational predecessors or
successors.
V. Alternative Interpretations
We consider several alternative interpretations of our main measure of overconfidence, late option
exercise. We exclude several explanations that have no link to capital structure decisions or have little or
no bearing on the press measure. For example, personal taxes, board pressure, and procrastination are
potential explanations for late option exercise, but have no plausible effect on CEOs' portrayal in the
business press.
32
Dilution. CEOs with extensive holdings of company stock and options may want to avoid diluting
those holdings with additional equity issues. Graham and Harvey (2001), for example, report that
earnings-per-share dilution is a primary consideration in stock issuance decisions. This interpretation is
unlikely to affect our press measure. It is also unlikely to affect our portfolio-based overconfidence
measures, since they capture the timing of option exercise, not the level of holdings. Nevertheless, we
address the concern by controlling directly for the level of CEO stock and option holdings in all of our
estimations. These variables control for the CEOs’ incentives to avoid stock dilution because of their own
portfolio holdings. In addition, we control for leverage and credit rating since CEOs of firms near
financial distress may rationally worry more about dilution due to debt overhang. However, perceived
dilution is exactly the mechanism that causes overconfident CEOs to avoid issuing equity. Thus, it is
important to distinguish overconfidence from real information.
Inside Information. A CEO may choose not to exercise in-the-money options because of positive
private information about future earnings. In this case, holding company stock options is a profitable
investment until outsiders learn the information. Moreover, CEOs with such information may justifiably
exude “confidence” and “optimism” to the business press. In this case, our results would support the
traditional information-based pecking-order theory. The key difference from overconfidence is whether
CEOs' beliefs are correct.
We check whether CEOs earn positive abnormal returns from holding options. We find that
Longholder CEOs would earn greater profits on average by exercising one, two, three, or four years
earlier and investing in the S&P 500 for the remainder of the options' durations.33 We find similar
evidence for the Holder 67 measure. This evidence suggests that the average Longholder or Holder 67
CEO does not have positive inside information.
Signaling. The apparent absence of inside information casts doubt on rational signaling as an
interpretation of our measures. If late option exercise and bold statements to the press are meant to signal
strong future stock price performance, those signals seem ineffective: CEOs who send them are the least
33
likely to issue equity and their stock does not display positive abnormal performance. It is possible,
though, that investors would expect even worse future performance in the absence of option-holding and
strong statements in the press, leading to even less equity issuance. Our findings using the Post-
Longholder measure cast doubt on this interpretation. If private information drives managerial financing
preferences for debt over equity and delayed option exercise (and press coverage) signals that information
to the market, we would expect a weaker effect of past “signals.” Instead, we find little difference
between the relation of past and contemporaneous late exercise to financing choices.
Risk Tolerance. CEOs may hold options longer due to a higher willingness to take risk. Risk-tolerant
CEOs may also appear more “confident” and “optimistic” and less “cautious,” “conservative,”
“practical,” “reliable,” or “steady” to business reporters. In addition, bankruptcy is less of a deterrent to
debt issuance for risk-seeking CEOs. However, risk tolerance does not predict aversion to external
financing. Thus, our debt conservatism results in Section IV.B are difficult to reconcile with this story.
In sum, each of the interpretations above is difficult to reconcile with some of the evidence, whereas
overestimation of future performance is consistent with all of our findings. The main insight of the paper,
however, is independent of this interpretation: systematic and measurable differences in CEO beliefs and
traits predict systematic differences in financial policies.
VI. Robustness: Extension to 2007
As a final step, we extend our analysis beyond the 1980 to 1994 Hall-Liebman data. We gather insider
trading data from Thomson Financial and personal portfolio data from Compustat's Execucomp database.
The Thomson data contain detailed information on CEO option exercise. Execucomp includes annual
snapshots of aggregate CEO stock and option holdings, which are needed as controls in the
overconfidence analysis. The merged data cover S&P 1500 firms from 1992 to 2007 and include smaller
firms than our main sample. Generally, the sample characteristics differ in the expected direction: asset
34
tangibility is smaller, Q is higher, and the fraction of nondividend payers is higher (See the Internet
Appendix.).
One immediate observation is that the extended data are not suitable to analyze early-life shocks from
the Great Depression or service in World War II. Due to age and retirement, the fraction of Depression
CEOs declines precipitously after 1995. Overall, only 3% of firm-years have a Depression CEO. The
fraction of World War II veterans declines similarly. After supplementing the data with hand-collected
information on military service through 2003, we find that less than 1% of firm-years have a World War
II veteran as CEO.34
We use the data to construct four alternative overconfidence measures that correspond as closely as
possible to our core measures based on late option exercise (Section III). (1) We use the package-level
data on CEO option holdings available in Execucomp beginning in 2006 to replicate exactly our
Longholder measure (Longholder_Exec). (2) We use the year-by-year aggregate data on CEO vested
option holdings available in Execucomp over the entire 1992 to 2007 sample period to construct a
Longholder-type measure following the approach of Campbell et al. (2009) and Hirshleifer, Teoh, and
Low (2010). The measure classifies as overconfident those CEOs who at least twice hold vested options
with average moneyness of at least 67% at the end of a fiscal year (Longholder_CJRS). (3) We use option
exercise data from Thomson to classify as overconfident those CEOs who exercise options within a year
of expiration that are at least 40% in the money one year prior to expiration. We consider all CEOs for
whom we observe at least one option exercise (but who do not meet the criteria for overconfidence) in the
comparison group (Longholder_Thomson). (4) We replicate the overconfidence classification of
Longholder_Thomson, but include all Execucomp CEOs who do not qualify as overconfident in the
comparison group (Longholder_Thomson_Fill). We provide additional details on the measures and
discussion of the key differences from the Longholder and Holder 67 variables in the Internet Appendix.
To begin, we assess how well these variables replicate our main portfolio-based overconfidence
measures (See the Internet Appendix.). The measure Longholder_Exec, which is identical in definition to
the original Longholder measure, classifies roughly 20% of CEOs as overconfident, similar to
35
Longholder. For the other measures, we see wide variation, ranging from 32% to 54%. We also calculate
the pairwise correlations between the different measures. In all cases, we find positive and significant
correlations. The measure Longholder_Thomson (_Fill) should exactly match Longholder_Exec in CEO-
years for which both are defined; however, we find a correlation of only 0.44 (0.48). The correlation of
Longholder_CJRS with Longholder_Exec is even lower (0.22). The latter is less surprising since
Longholder_CJRS differs from the other measures in relying on option moneyness to determine CEO
beliefs, rather than remaining option duration at exercise.
The lower correlation and difference in definition raise the concern that Longholder_CJRS may mix
information about CEO beliefs with information about firm performance: rather than capture a CEO's
overestimation of future performance, it might (also) capture good past performance. Avoiding such a
confound is crucially important in our context since overconfidence makes opposite predictions for
financing choices to strong stock performance. To quantify this concern, we calculate the pairwise
correlations of Longholder_CJRS with five lags of annual stock returns (excluding dividends). We find
that Longholder_CJRS is indeed significantly positively correlated with each lag of returns. The
correlations between Longholder_Exec and lags of returns, on the other hand, are smaller by an order of
magnitude and insignificant for three of the five horizons.
Overall, our analysis suggests that (1) Longholder_Exec is the best candidate to replicate the
Malmendier and Tate (2008) overconfident measures with more recent data, but its implementability
suffers from the very short sample period, and (2) the other measures capture information about CEO
beliefs, but are noisier and influenced by other systematic factors (performance).
The key (unambiguous) prediction of the overconfidence theory is that overconfident CEOs prefer
risky debt to equity, conditional on accessing external capital (Hypothesis 1). Our analysis of public
security issuance tests this prediction using (in part) cross-sectional variation across CEOs. Since such
variation is required to employ the Longholder_Exec measure, we focus on this test to determine the
robustness of our key results in later firm-years and among the broader cross-section of firms.
36
We report the results in Table VIII. In a univariate specification (Panel A, Column 1),
Longholder_Exec CEOs are roughly 45% less likely to issue equity, significant at the 10% level. The
result is stronger both economically and statistically using the various sets of controls from Section IV.A.
Insert Table VIII here.
We also re-estimate our regressions using the Longholder_CJRS and Longholder_Thomson (_Fill)
measures. Using either Thomson-based measure, we confirm our basic results (though the estimates are
typically smaller economically). Using the Longholder_CJRS measure, the results depend crucially on the
set of controls. In the univariate setting, the estimate is positive and significant. However, once we add
the controls for past stock performance, the estimate becomes negative and significant. Strong past stock
performance predicts heightened equity issuance. Since Longholder_CJRS is positively correlated with
past performance, it picks up this effect. The negative overconfidence effect emerges only with careful
performance controls.
Our results suggest that the effect of overconfidence on financing choices is likely to generalize over
time and across firms. The results demonstrate both the promise and potential pitfalls of using common
data sources to measure late option exercise over the 1995 to 2005 time period.
VII. Conclusion
We provide evidence that managers' beliefs and early-life experiences significantly affect financial
policies, above and beyond traditional market-, industry-, and firm-level determinants of capital structure.
We begin by using personal portfolio choices of CEOs to measure their beliefs about the future
performance of their own companies. We focus on CEOs who persistently exercise their executive stock
options late relative to a rational diversification benchmark. We consider several interpretations of such
behavior – including positive inside information – and show that it is most consistent with CEO
overconfidence. We also verify our measure of revealed beliefs by confirming that such CEOs are
37
disproportionately characterized by the business press as “confident” or “optimistic,” rather than
“reliable,” “cautious,” “practical,” “conservative,” “frugal,” or “steady.”
This form of belief makes specific capital structure predictions: overconfident CEOs overestimate
future cash flows and therefore perceive external financing – and particularly equity – to be unduly costly.
Thus, they prefer internal financing over external capital markets and, conditional on raising risky capital,
debt over equity. We find strong evidence that, conditional on accessing public securities markets,
overconfident CEOs are less likely to issue equity than other CEOs. We also find that, to cover an
additional dollar of external financing deficit, overconfident CEOs issue about 33 cents more debt than
their peers. Managerial overconfidence is also positively related to debt conservatism, measured using the
kink variable of Graham (2000). This debt conservatism is not driven by an increased propensity to issue
equity. Instead, overconfident CEOs who are debt-conservative are also equity conservative and rely
excessively on internal funds. Finally, overconfident managers choose higher leverage ratios than
predecessors or successors in their firms.
We also consider early-life experiences that are likely to shape beliefs and choices later in life. Guided
by prior psychology and management literature, we focus on two major formative experiences that affect
our sample CEOs: growing up during the Great Depression and serving in the military. We find that
CEOs who experience the Great Depression early in life display a heightened reluctance to access
external capital markets. World War II CEOs, on the other hand, choose more aggressive corporate
policies, including higher leverage ratios. The effects are distinct from the effect of overconfidence on
financial decisions. Though the specific shocks that guide belief formation may differ in other samples of
CEOs, our methodology for identifying those shocks is easily generalized.
Our results have several implications. First, our findings help to explain the strong time-invariant
component of firm capital structure identified in recent studies. Though our identification strategy
requires us to establish the effect of managerial beliefs using within-firm variation, the significance of our
measures suggests that variation in managerial beliefs may account for a significant portion of the (co-
38
determined) between-firm variation. Managerial beliefs may be particularly important in firms with long-
serving managers, family ownership, or a preference for hiring managers with a particular “style.”
Second, our results have distinct implications for contracting practices and organizational design. To
the degree that boards do not anticipate or desire bias-driven policies, standard incentives, such as stock-
and option-based compensation, are unlikely to offset fully the effects of managerial overconfidence on
investment and financing decisions. Biased managers believe they are choosing value-maximizing
policies, and boards may need to use different tools, such as cash dividend payment and debt overhang, to
constrain overconfident CEOs. Similarly, financial incentives will be miscalibrated if they do not account
for financial conservatism or financial aggressiveness arising from a CEO's past experiences.
Third, our findings on the financial decision-making of Depression and military CEOs provide
evidence that major personal events can have a life-long effect on risk attitudes and choices.
Macroeconomic shocks, such as the current financial crisis, are likely not only to have an immediate
impact on corporate financial policies (e.g., through de-leveraging and a shift toward self-sufficiency), but
also to affect future policies as today's young investors, who are being introduced to financial markets
during a time of crisis, become the next generation of corporate leaders. The Depression Baby results thus
not only document a pattern of historical interest, but also suggest how financial choices may play out
over the coming decades.
Finally, exposure to a military environment may affect corporate decision-making more broadly than
just financial policy. For example, military CEOs may implement a more command-based corporate
culture. An interesting topic for future research is to test whether CEOs with military experience create a
more hierarchical structure in their firms and, conversely, to test for an effect of private-sector experience
on the decisions of government, military, or nonprofit leaders.
39
REFERENCES
Alicke, Mark D., M.L. Klotz, David L. Breitenbecher, Tricia J. Yurak, and Debbie S. Vredenburg, 1995, Personal contact, individuation, and the better-than-average effect, Journal of Personality and Social Psychology 68, 804-825.
Baker, Malcolm, and Jeffrey Wurgler, 2002, Market timing and capital structure, Journal of Finance 57, 1-32.
Baker, Malcolm, Richard Ruback, and Jeffrey Wurgler, 2007. Behavioral Corporate Finance, in Espen Eckbo, ed.: Handbook of Corporate Finance: Empirical Corporate Finance (Elsevier/North-Holland).
Baker, Malcolm, Jeremy C. Stein, and Jeffrey Wurgler, 2003, When does the market matter? Stock prices and the investment of equity-dependent firms, Quarterly Journal of Economics 118, 969-1005.
Ben-David, Itzak, John Graham, and Campbell Harvey, 2007, Managerial overconfidence and corporate policies, Working paper, Duke University.
Berkowitz, Leonard, and Anthony Lepage, 1967, Weapons as aggression-eliciting stimuli, Journal of Personality and Social Psychology 7, 202-207.
Bertrand, Marianne, and Antoinette Schoar, 2003, Managing with style: The effect of managers on firm policies, Quarterly Journal of Economics 118, 1169-1208.
Billett, Matthew T., and Yiming Qian, 2008, Evidence of self-attribution bias from frequent acquirers, Management Science 54, 1037-1051.
Campbell, T. Colin, Shane A. Johnson, Jessica Rutherford, and Brooke Stanley, 2009, CEO confidence and forced turnover, Working paper, Texas A&M.
Chevalier, Judith, and Glenn Ellison, 1999, Are some mutual fund managers better than others? Cross-sectional patterns in behavior and performance, Journal of Finance 54, 875-899.
Donaldson, Gordon, 1990, Voluntary restructuring: The case of General Mills, Journal of Financial Economics 27, 117-141.
Elder, Glen, 1986, Military times and turning points in men's lives, Developmental Psychology 22, 233-245.
Elder, Glen, 1998, Children of the Great Depression, 25th Anniversary Edition (Westview Press, Boulder, CO).
Elder, Glen, and Elisabeth Clipp, 1989, Combat experience and emotional health: Impairment and resilience in later life, Journal of Personality 57, 311-341.
Elder, Glen, Cynthia Gimbel, and Rachel Ivie, 1991, Turning points in life: The case of military service and war, Military Psychology 3, 215-231.
Fama, Eugene, and Kenneth French, 2002, Testing trade-off and pecking order predictions about dividends and debt, Review of Financial Studies 15, 1-33.
Frank, Murray Z., and Vidham K. Goyal, 2003, Testing the pecking order theory of capital structure, Journal of Financial Economics 67, 217-248.
40
Frank, Murray Z., and Vidham K. Goyal, 2007, Corporate leverage: How much do managers really matter? Working paper, University of Minnesota.
Goel, Anand, and Anjan V. Thakor, 2008, Overconfidence, CEO selection, and corporate governance, Journal of Finance 63, 2737-2784.
Gomes, Armando, and Gordon Phillips, 2007, Why do public firms issue private and public securities? Working paper, University of Maryland.
Graham, John R., 2000, How big are the tax benefits of debt? Journal of Finance 5, 1901-1942.
Graham, John R., and Campbell R. Harvey, 2001, The theory and practice of corporate finance: Evidence from the field, Journal of Financial Economics, 60, 187-243.
Graham, John R., Campbell R. Harvey, and Manju Puri, 2009, Managerial attitudes and corporate actions, Working paper, Duke University.
Graham, John, and Krishna Narasimhan, 2004, Corporate survival and managerial experiences during the Great Depression, Working paper, Duke University.
Hackbarth, Dirk, 2008, Managerial traits and capital structure decisions, Journal of Financial and Quantitative Analysis 43, 843-882.
Hall, Brian J., and Jeffrey B. Liebman, 1998, Are CEOs really paid like bureaucrats? Quarterly Journal of Economics 113, 653-691.
Hall, Brian J., and Kevin J. Murphy, 2002, Stock options for undiversified executives, Journal of Accounting and Economics 33, 3-42.
Hietala, Pekka, Steven Kaplan, and David Robinson, 2003, What is the price of hubris? Using takeover battles to infer overpayments and synergies, Financial Management 32, 1-32.
Hirshleifer, David, Siew Hong Teoh, and Angie Low, 2010, Are overconfident CEOs better innovators? Working paper, University of California - Irvine.
Kidd, John B., 1970, The utilization of subjective probabilities in production planning, Acta Psychologica 34, 338-347.
Killgore, William D.S., Dave I. Cotting, Jeffrey L. Thomas, Anthony L. Cox, Dennis McGurk, Alexander H. Vo, Carl A. Castro, and Charles W. Hoge, 2008, Combat invincibility: Violent combat experiences are associated with increased risk-taking propensity following deployment, Journal of Psychiatric Research 42, 1112-1121.
Landier, Augustin, and David Thesmar, 2009, Financial contracting with optimistic entrepreneurs, Review of Financial Studies 22, 117-150.
Langer, Ellen J., 1975, The illusion of control, Journal of Personality and Social Psychology 32, 311-328.
Larwood, Laurie, and William Whittaker, 1977, Managerial myopia: Self-serving biases in organizational planning, Journal of Applied Psychology 62, 94-198.
41
Lemmon, Michael, Michael Roberts, and Jaime Zender, 2008, Back to the beginning: Persistence and the cross-sectional distribution of capital structure, Journal of Finance 63, 1575-1608.
Lowe, Robert A., and Arvids A. Ziedonis, 2006, Overoptimism and the performance of entrepreneurial firms, Management Science 52, 173-186.
Malmendier, Ulrike, and Stefan Nagel, 2011, Depression babies: Do macroeconomic experiences affect risk-taking? Quarterly Journal of Economics 126, 373-416.
Malmendier, Ulrike, and Geoffrey A. Tate, 2004, Who makes acquisitions? CEO overconfidence and the market's reaction, NBER Working Paper 10813.
Malmendier, Ulrike, and Geoffrey A. Tate, 2005, CEO overconfidence and corporate investment, Journal of Finance 60, 2660-2700.
Malmendier, Ulrike, and Geoffrey A. Tate, 2008, Who makes acquisitions? CEO overconfidence and the market's reaction, Journal of Financial Economics 89, 20-43.
March, James G., and Zur Shapira, 1987, Managerial perspectives on risk and risk taking, Management Science 33, 1404-1418.
Miller, Merton H., 1977, Debt and taxes, Journal of Finance 32, 261-275.
Miller, Dale T., and M. Ross, 1975, Self-serving biases in the attribution of causality: Fact or fiction? Psychological Bulletin 82, 213-225.
Moore, P.G., 1977, The manager's struggle with uncertainty, Journal of The Royal Statistical Society Series A 149, 129-165.
Myers, Stewart C., 1984, The capital structure puzzle, Journal of Finance 39, 575-592.
Myers, Stewart C., and Nicholas S. Majluf, 1984, Corporate financing and investment decisions when firms have information that investors do not have, Journal of Financial Economics 13, 187-221.
Ofek, Eli, and David Yermack, 2000, Taking stock: Equity-based compensation and the evolution of managerial ownership, Journal of Finance 55, 1367-1384.
Rajan, Raghuram G., and Luigi Zingales, 1995, What do we know about capital structure? Some evidence from international data, Journal of Finance 50, 1421-1460.
Roll, Richard, 1986, The hubris hypothesis of corporate takeovers, Journal of Business 59, 197-216.
Schoar, Antoinette, 2007, CEO careers and style, Working paper, MIT.
Shyam-Sunder, Lakshmi, and Stewart C. Myers, 1999, Testing static trade-off against pecking order models of capital structure, Journal of Financial Economics 51, 219-244.
Wansink, Brian, Collin R. Payne, and Koert van Ittersum, 2008, Profiling the heroic leader: Empirical lessons from combat-decorated veterans of World War II, Leadership Quarterly 19, 547-555.
Weinstein, Neil, 1980, Unrealistic optimism about future life events, Journal of Personality and Social Psychology 39, 806-820.
Weisbach, Michael, 1995, CEO turnover and the firm's investment decisions, Journal of Financial Economics 37, 159-188.
42
Welch, Ivo, 2004, Capital structure and stock returns, Journal of Political Economy 112, 106-131.
Yermack, David, 1995, Do corporations award CEO stock options effectively? Journal of Financial Economics 39, 237-269.
43
1 A different behavioral bias sometimes referred to as “overconfidence” is the underestimation of variance
(e.g., in Ben-David, Graham, and Harvey (2007)). This bias does not have a clear implication for the
timing of option exercise. It implies an underestimation rather than overestimation of option value,
predicting expedited option exercise. But, assuming that CEOs exercise executive options for the purpose
of selling the stock (consistent, for example, with the evidence in Ofek and Yermack (2000)), it also
implies lower perceived benefits of diversification and hence delayed exercise. Delayed option exercise is
unambiguously predicted only by the type of overconfidence analyzed in this paper, that is, the
overestimation of mean future cash flows. Moreover, the capital structure implications of underestimation
of the variance run in the opposite direction (Hackbarth (2008)), which allows us to empirically
distinguish which bias dominates.
2 The 67% threshold comes from the rational option exercise model of Hall and Murphy (2002) with
constant relative risk aversion of three and 67% of wealth in company stock.
3 The Execucomp data on the top five executives in S&P 1500 firms are not as detailed, often missing for
CFOs, and available for a shorter time frame. These data overlap with our main sample period for only
two years.
4 See Hechinger, J., 1998, Heard in New England: SLI's chief blasts analyst as firm puts off a big stock
offering, Wall Street Journal, Jun 3, p. NE2 and Whitford, D., 1999, Jesse shakes the money tree, Fortune
139, Iss. 12, 102-108. It is also not unusual for CEOs to reject the CFO's financing plan, especially when
asset sales are involved (Millman, Gregory J., 2001, Managing up the CFO and the board, Financial
Executive 17, 24-26.). Recent jury verdicts against CEOs of firms with financial scandals imply the same
view.
5 See Larwood and Whittaker (1977), Kidd (1970), and Moore (1977).
44
6 Langer (1975), Weinstein (1980), Alicke et al. (1995), and March and Shapira (1987) argue, more
generally, that individuals overestimate their ability to control outcomes and underestimate the likelihood
of failure.
7 See the survey by Baker, Ruback, and Wurgler (2007). Recent work also includes Hietala, Kaplan, and
Robinson (2003), Landier and Thesmar (2009), and Lowe and Ziedonis (2006).
8 For a restricted range of parameters, an overconfident CEO may perceive debt to be more costly than
equity. This case requires the CEO to (mistakenly) believe the bad state will not result in default. In
addition, the probability of default must be large and overconfidence sufficiently small. (See the Internet
Appendix for more details.) Intuitively, under a debt contract, the overconfident CEO expects to pay too
much in the bad state (the full interest rate), and since the bad state is very likely the overpayment looms
large. Under an equity contract, in contrast, the perceived overpayment is spread over both the good and
the bad states, allowing the CEO to retain more in the bad state. If the value of the (overestimated)
residual claim in the good state under the debt contract and the perceived extra tax benefit from paying an
unduly high interest rate are sufficiently low, the preference for debt over equity can be reversed. The
range of parameters that satisfy these conditions is small and unlikely to be empirically relevant for our
sample of large U.S. firms.
9 Other frictions that cause capital rationing (asymmetric information, agency costs) may distort even
rational CEOs towards retaining cash. In these settings, overconfidence pushes a CEO even further
toward self-sufficiency.
10 For firms reporting format codes 1 to 3, net investment is capx + ivch + aqc + fuseo - sppe - siv; for
firms reporting format code 7, it is capx + ivch + aqc - sppe - siv - ivstch - ivaco. When items are missing
or combined with other items, we code them as 0.
11 For format code 1, this is wcapc + chech + dlcch; for codes 2 and 3, - wcapc + chech - dlcch; for code
12 For codes 1 to 3, this is ibc + xidoc + dpc + txdc + esubc + sppiv + fopo + fsrco. For code 7, this is items
ibc + xidoc + dpc + txdc + esubc + sppiv + fopo + exre. Items are coded as 0 when missing or combined
with other items.
13 Definitions of Q and its components are as in Fama and French (2002).
14 See Table II for more details. Following Graham (2000), all continuous controls in the kink regressions
are winsorized at the 1% level.
15 For definitions, see http://mba.tuck.dartmouth.edu/pages/faculty/ken.french/data_library.html.
16 The merger effect is robust to controlling for standard merger determinants like Q and cash flow in a
logit regression.
17 An alternative to conditioning on issuance is to explicitly model both the decision to issue and the
choice between debt and equity. We perform such an analysis using a Heckman probit selection model
(with the net financing deficit and cash stock as identifying variables for the public issuance choice). Our
conclusions are unaffected.
18 When controlling for book leverage, we drop the few cases with book leverage greater than one.
19 Since IRRC data are unavailable for our sample period, we use the natural log of board size as an
alternative governance measure. We also do not have the marginal tax rate control.
20 Shyam-Sunder and Myers (1999) analyze large firms, with mean assets of $953m for the period 1971 to
1989. (Our firms are even larger, with mean assets of $5,477m for the period 1980 to 1994.) When Frank
and Goyal (2003) analyze, separately, the quartile of largest firms, they find similar coefficients of 0.753
for the period 1971 to 1989 and 0.675 for the period 1990 to 1998.
21 The results are nearly identical using lagged levels of the sales, tangibility, profitability, and Q controls
(as in Specification (1)) rather than changes.
22 Graham (2000) also includes squares of all continuous controls. Including the squares has little impact
on the results: the estimated Longholder coefficient in Column 3 changes from 0.605 to 0.611 (p = 0.051).
46
23 The control variables are statistically significant with the exception of Negative Owners' Equity,
CYCLICAL, Quick Ratio, and PPE-to-Assets.
24 The results are robust to adding a quadratic term in age.
25 We also re-run the specification in Column 6 including Military Experience as an independent variable.
Though the estimates are less powerful due to the smaller sample size, our conclusions are qualitatively
unchanged. There is no significant relation between military service and kink.
26 Here the cross-group difference between (i) and (iv) is significant (p =0.051); however, the differences
between groups (i) and (ii) and groups (i) and (iii) are not (p =0.122 and p =0.194, respectively).
27 It is possible that Longholder CEOs store debt capacity in anticipation of large investments or
acquisitions (thereby inducing high kinks). This explanation is consistent with the evidence in
Malmendier and Tate (2008) that overconfident CEOs do more acquisitions and prefer to finance them
with cash and debt.
28 The results are robust to using other cutoffs, such as the 25th or the 30th percentile, and alternative
proxies for “expected volume of investment,” such as prior-year averages.
29 We include the financing deficit for consistency with our earlier specifications. It is indeed significant.
However, the Longholder effect does not depend upon its inclusion.
30 We do not include contemporaneous returns due to endogeneity concerns. However, the results are
robust to this additional control.
31 Alternatively, we code “combat exposure” as including World War II, the Korean War, and the
Vietnam War. The results are the same: we find a positive and significant effect on leverage, controlling
for Military Experience. However, the coefficient appears to be driven by World War II. If we include
separate dummies for the 12 Korean War veterans and eight Vietnam War veterans in our sample, we find
insignificant coefficients.
32 For completeness, we also re-run the Column 9 specification including Depression Baby, even though
we do not have a theoretical prediction. We find no significant relation with leverage.
47
33 See Malmendier and Tate (2004) for detailed tables.
34 We re-analyze the link between military experience and leverage in the later sample for veterans of the
Korean or Vietnam Wars and for all veterans. The results confirm our earlier finding that the link between
military experience and leverage is specific to World War II veterans. One interpretation is that success or
failure of the military experience matters for later-life attitudes. Though these experiences vary at the
individual level, World War II veterans are more likely to have had a victorious personal experience and
may be more likely to interpret individual failures as nevertheless contributing to a major collective
victory.
Figure 1. Model Predictions (Stylized Example). The hypothetical example illustrates how overconfidentCEOs may deviate from a hypothetical rational benchmark in their average financing of investment projectsholding constant investment opportunities and financing needs. The example assumes a (hypothetical) rationalbenchmark of 33% cash, 33% debt, and 33% equity financing. Overconfident CEOs choose a lower absoluteamount of debt financing (22% < 33%), but more debt financing relative to total new capital (22%/[22%+11%]> 33%/[33%+33%] ↔ 2/3 > 1/2) due to even lower absolute amounts of equity financing (11% < 33%).
0%
10%
20%
30%
40%
50%
60%
70%
80%
90%
100%
Rational CEO Overconfident CEO
33%
67%
33%
22%33%
11%
Equity Financing
Debt Financing
Cash Financing
Preference for Public Debt vs. Equity Issues
Preference for Debt vs. Equity to Fill
External Financing Needs ("Financing
Deficit")
Debt Level Relative to Maximum
Available Tax Benefit ("Kink")
Market Leverage
Overconfidence Debt Debt Low* High*,**
Depression Baby No prediction No prediction Low No prediction
Military Service No prediction No prediction No prediction High
Table IEmpirical Predictions
The table summarizes the empirical capital structure predictions of managerial traits as described in Section I and formalized in theInternet Appendix. * indicates the prediction holds for a range of parameter values (See the model in the Internet Appendix.). **indicates a cumulative effect.
Variable Obs. Mean SD Min. Max. Obs. Mean Median SD Min. Max.Assets ($m) 2,385 5,476.92 13,389.44 39.64 198,598.70 463 4,820.30 2,111.78 8,763.07 48.79 79,262.00Net Financing Deficit ($m) 2,385 42.67 538.56 -6,800.30 8,845.50 463 10.41 -1.05 287.07 -845.00 1,698.00
Full Sample Longholder Sample(Number of Firms = 263) (Number of Firms = 56)
In Panel A, Net Financing Deficit is Cash Dividends plus Net Investment plus Change in Working Capital minus Cash Flow after Interest and Taxes. Net Investment is capital expenditures plus increase in investments plusacquisitions plus other uses of funds minus sale of PPE minus sale of investment. Change in Working Capital is change in operating working capital plus change in cash and cash equivalents plus change in current debt. Cash Flowafter Interest and Taxes is income before extraordinary items plus depreciation and amortization plus extraordinary items and discontinued operations plus deferred taxes plus equity in net loss (earnings) plus other funds fromoperations plus gain (loss) from sales of PPE and other investments. Net Debt Issues are long term debt issuance minus long term debt reduction. Net Equity Issues are sales of common stock minus stock repurchases. Profitability isoperating income before depreciation, normalized by assets at the beginning of the year. Tangibility is PPE, normalized by assets at the beginning of the year. Q is market value of assets over book value of assets, where market valueof assets is book value of assets plus market equity minus book equity. ∆ denotes one-year changes. Longholder is a binary variable where one signifies that the CEO at some point during his tenure held an option package until the lastyear before expiration, provided that the package was at least 40% in the money entering its last year. The Fama-French Industry Groups are defined on French's website. In Panel B, Kink is the amount of interest at the point wherethe marginal benefit function becomes downward-sloping, as a proportion of actual interest expense. ECOST is the standard deviation of the first difference in taxable earnings divided by assets, the quotient times the sum ofadvertising and R&D expenses divided by sales. CYCLICAL is the standard deviation of operating earnings divided by mean assets first calculated for each firm, then averaged across firms within two-digit SIC codes. Return onAssets is income before extraordinary items plus interest expense plus depreciation, divided by assets. Z-score is 3.3 times the difference of operating income before depreciation and depreciation plus sales plus 1.4 times retainedearnings plus 1.2 times working capital (balance sheet), the quantity divided by assets. Quick Ratio is the sum of cash and short-term investments and total receivables divided by total current liabilities. Current Ratio is total currentassets divided by total current liabilities. Q-ratio is preferred stock plus market value of common equity plus net short-term liabilities, the quantity divided by assets. R&D-to-sales and Advertising-to-sales are set to zero when thenumerator is missing. Computer Industry is all firms with SIC code 357, Semiconductor Industry is all firms with SIC code 367, Chemicals and Allied Products comprises SIC codes 280-289, Aircraft and Guided Space Vehicles SICcodes 372 and 376, and Other Sensitive Industries SIC codes 340-400, excluding 357, 367, 372, and 376. Longholder is a binary variable where one signifies that the CEO at some point during his tenure held an option package untilthe last year before expiration, provided that the package was at least 40% in the money entering its last year. In Panel C, CEO Vested Options are the CEO's holdings of options that are exercisable within six months of the beginningof the year (as a percent of shares outstanding), multiplied by 10 so that the means of vested options and CEO Stock Ownership are the same order of magnitude. Depression Baby is an indicator variable for CEOs born in the 1920s.Military Experience indicates CEOs with prior military service.
172.7016.02
228.560.00
1.30
0.00
0.000.170.00
0.01
Other Other
Energy Health Shops
Consumer Durables
Money Business Equipment
Chemicals and Allied Products
Manufacturing Manufacturing Energy
ChemicalsBusiness Equipment
Health Money
Distribution across Fama French 12 Industry Groups
Depression Baby indicates CEOs born between 1920 and 1929. Military Experience is an indicator variable for CEOs who served in the military. TOTALcautious is the number of articles from LexisNexis and Wall Street Journal searches that describe the CEO as "reliable,” “cautious,” “practical,” “conservative,” “steady,” or “frugal.” Return on Assets is income before extraordinary items plus interest expense plus depreciation,divided by assets. Market Leverage is debt in current liabilities plus long-term debt, divided by the sum of the numerator and market equity. Merger Activity is an indicator for at least one merger in a given firm-year.Kink is the amount of interest at which the marginal benefit function starts to slope down, as a proportion of actual interest expense. Equity Issuance indicates at least one stock issue, conditional on accessing publicsecurities markets. p -values and number of observations are in parentheses.
Correlations of Depression Baby and Military Experience with Firm and CEO Characteristics
Standard Firm Controls X X XBook Leverage X XKink Controls XIndustry Fixed Effects XYear Fixed Effects X XObservations 762 644 627 617 617 442Number of Firms 330 174 171 171 171 135
Panel B. Logit Regressions
Table IV
% of Issue Years with
14191
Longholder is a binary variable equal to one if the CEO, at some point during his tenure, held an option package until the last year before expiration,provided that the package was at least 40% in the money entering its last year. Post-Longholder is equal to 1 for all CEO-years after the CEO for the firsttime holds options to expiration. Pre-Longholder is Longholder minus Post-Longholder. Holder 67 is a binary variable equal to one for all CEO-years afterthe CEO for the first time fails to exercise a 67% in-the-money option with five years remaining duration. For Holder 67, the sample is limited to CEO-yearsafter the CEO for the first time had a 67% in-the-money option with five years remaining duration. TOTALconfident is a binary variable equal to one whenthe number of "confident" and "optimistic" mentions for a CEO in the LexisNexis and Wall Street Journal searches exceeds the number of "not confident,""not optimistic," and "reliable," "cautious," "practical," "conservative," "steady," and "frugal" mentions. TOTALmentions is the total number of articlesmentioning the CEO in those searches. Both TOTAL variables include all articles over the sample period up to the previous year. Data on public issues arefrom SDC . There are 330 firms. Equity issues are issues of common stock or nonconvertible preferred stock. Debt issues are issues of nonconvertible debt.Hybrid issues are issues of convertible debt or convertible preferred stock. U.S. Rule 144A issues are included. Standard errors are adjusted for clustering atthe firm level. In Panel B, the sample consists of all firm years in which the firm did at least one public security issue. The dependent variable is a binaryvariable equal to one if the firm issued equity during the fiscal year. Coefficients are reported as log odds ratios. CEO Vested Options are the CEO's holdingsof options that are exercisable within six months of the beginning of the year (as a percent of shares outstanding), multiplied by 10 so that the means ofvested options and CEO Stock Ownership are the same order of magnitude. The standard firm controls are ln(Sales), Q (market value of assets over bookvalue of assets, where market value of assets is book value of total assets plus market equity minus book equity), Profitability (operating income beforedepreciation normalized by beginning-of-year assets), Tangibility (PPE, normalized by beginning-of-year assets). Book leverage is the sum of debt in currentliabilities and long-term debt, divided by the sum of the numerator and common equity. We exclude observations in which book leverage is negative orgreater than one. CEO Stock Ownership, ln(Sales), Q, Profitability, Tangibility, and Book Leverage are measured at the beginning of the fiscal year. Kinkcontrols are defined as in Graham (2000) and listed in Table II. Industry fixed effects are the kink-regression industry dummies of Graham (2000). Standarderrors are adjusted for clustering at the firm level. * indicates significance at 10%; ** significance at 5%; *** significance at 1%.
OLS regressions with Net Debt Issues normalized by beginning-of-year assets as the dependent variable, where Net Debt Issues are long-term debt issues minus long-termdebt reduction. Net Financing Deficit (FD) is cash dividends plus net investment plus change in working capital minus cash flow after interest and taxes, normalized bybeginning-of-year assets. Net investment, change in working capital, and cash flow after interest and taxes are defined in Table II. Longholder is a binary variable equal toone if the CEO at some point during his tenure held an option package until the last year before expiration, provided that the package was at least 40% in the moneyentering its last year. CEO Vested Options are the CEO's holdings of options that are exercisable within six months of the beginning of the year (as a percent of sharesoutstanding), multiplied by 10 so that the means of vested options and CEO Stock Ownership are the same order of magnitude. The FD control variables are identical tothose in Frank and Goyal (2003): changes in profitability (operating income before depreciation normalized by beginning-of-year assets), in tangibility (PPE, normalized bybeginning-of-year assets), in the logarithm of sales, and in Q (market value of assets over book value of assets, where market value of assets is book value of total assetsplus market equity minus book equity). Book leverage is the sum of debt in current liabilities and long-term debt, divided by the sum of the numerator and common equity.CEO Stock Ownership and Book Leverage are measured at the beginning of the fiscal year. All standard errors are adjusted for clustering at the firm level. * indicatessignificance at 10%; ** significance at 5%; *** significance at 1%.
In Panel A, the dependent variable is the kink variable of Graham (2000), that is, the amount of hypothetical interest at which the marginal taxbenefit function starts to slope down, as a proportion of actual interest expense. The tobit regressions account for two-sided censoring of the kinkvariable at zero and eight. Longholder is a binary variable equal to one if the CEO, at some point during his tenure, held an option package until thelast year before expiration, provided that the package was at least 40% in the money entering its last year. Depression Baby indicates CEOs bornbetween 1920 and 1929. CEO Stock Ownership is the percentage of company stock owned by the CEO and his immediate family at the beginningof the year. CEO Vested Options are the CEO's holdings of options that are exercisable within six months of the beginning of the year (as a percentof shares outstanding), multiplied by 10 so that the means of vested options and CEO Stock Ownership are the same order of magnitude. Kinkcontrols and industry fixed effects are defined as in Graham (2002) and listed in Panel B of Table II. Low Cash Status is an indicator, equal to one ifthe firm's cash stock at the beginning of the year, divided by mean industry investment, is at or below the 40th percentile in our sample. Meanindustry investment is calculated separately for each year and each of the 12 Fama-French industry groups. (See Table II, Panel A.) All standarderrors are adjusted for clustering at the firm level. * indicates significance at 10%; ** significance at 5%; *** significance at 1%. In Panel B, netequity issues are sales of common stock minus stock repurchases and are normalized by beginning-of-year assets.
Internal vs. External Financing
Panel A. Debt Conservatism: Kink Tobits
Panel B. Equity Conservatism: Distribution of Longholder Net Equity Issues by Kink
(-1.45)Firm Effects X X X X X X X XYear Effects X X X X XObservations 2,184 2,184 2,184 2,184 2,184 1,626 1,626 1,626 1,521Number of Firms 241 241 241 241 241 210 210 210 194
OLS regressions with end-of-fiscal-year market leverage as dependent variable, measured as debt in current liabilities plus long-term debt divided by the sum ofthe numerator and market equity. Longholder is a binary variable equal to 1 if the CEO at some point during his tenure held an option package until the last yearbefore expiration, provided that the package was at least 40% in the money entering its last year. Military Experience is an indicator variable for CEOs with priormilitary service; World War II Veteran indicates service during World War II. Profitability is operating income before depreciation normalized by beginning-of-year assets; Tangibility is PPE, normalized by beginning-of-year assets. Q is market value of assets over book value of assets, where market value of assets is bookvalue of total assets plus market equity minus book equity. Net Financing Deficit is cash dividends plus net investment plus change in working capital minus cashflow after interest and taxes, normalized by beginning-of-year assets. Net investment, change in working capital, and cash flow after interest and taxes are definedin Table II. Returnsx are the natural logarithm of one plus stock returns (excluding dividends) from year x-1 to x. CEO Vested Options are the CEO's holdings of
options that are exercisable within six months of the beginning of the year (as a percent of shares outstanding), multiplied by 10 so that the means of vestedoptions and CEO Stock Ownership are the same order of magnitude. Profitability, Tangibility, ln(Sales), Q, Net Financing Deficit, and CEO Stock Ownership aremeasured at the beginning of the fiscal year. All standard errors are adjusted for clustering at the firm level. * indicates significance at 10%; ** significance at5%; *** significance at 1%.
Standard firm controls X X XBook leverage X XKink controls XReturn controls X XIndustry fixed effects XYear fixed effects X X X
Panel D. Longholder_Thomson_Fill
Table VIII
Logit regressions with coefficients reported as log odds ratios. The dependent variable is a binary variable equal to 1 if the firm issued equity during thefiscal year. The sample consists of all firm years in which the firm did at least one public security issue for S&P 1500 firms included in Compustat'sExecucomp database between 1992 and 2007 excluding financial firms (SIC 6000-6999) and regulated utilities (SIC 4900-4999). CEO Stock Ownership isthe number of shares owned by the CEO excluding options. CEO Vested Options is the CEO's holdings of unexercised exercisable stock options, multipliedby 10 (so that the mean is roughly comparable to CEO Stock Ownership). CEO Stock Ownership and CEO Vested Options are scaled by common sharesoutstanding and are measured at the beginning of the fiscal year. Longholder_Exec is is a binary variable where one signifies that the CEO at some pointduring his tenure held an option package until the last year before expiration, provided that the package was at least 40% in the money entering its last year.Longholder_Thomson is a binary indicator defined as Longholder_Exec, but using Thomson Financial data to identify option exercises that occur in thefinal year of the option's duration. Longholder_Thomson is zero for CEOs for whom we observe at least one option exercise in the Thomson databaseduring the sample period. Longholder_Thomson_Fill is defined as Longholder_Thomson, but includes all CEOs who do not satisfy the Longholder criteriain the control group. Longholder_CJRS is a binary indicator set to one if the CEO at least twice during his tenure in the sample was holding options withaverage moneyness greater than 67% at the end of a fiscal year, starting in the first year the CEO displays the behavior. Return controls are the naturallogarithms of one plus annual stock returns (excluding dividends) over the five prior fiscal years. Standard firm controls, book leverage, kink controls, andindustry fixed effects are as defined in Table IV. All standard errors are adjusted for clustering at the firm level. * indicates significance at 10%; **significance at 5%; *** significance at 1%.