Page 1
Electronic copy of this paper is available at: http://ssrn.com/abstract=953273
1
Overconfidence, Managerial Optimism and the
Determinants of Capital Structure
Lucas Ayres B. de C. Barrosa
Mackenzie Presbyterian University
Alexandre Di Miceli da Silveirab
University of Sao Paulo, Sao Paulo, Brazil
February, 2007
a Professor of Finance at Mackenzie Presbyterian University – Center of Applied Social
Sciences. Tel (+55) 11 3871-2689 email: [email protected] (contact author).
b Professor of Finance and Accounting at School of Economics, Management and Accounting
of University of São Paulo (FEA/USP). Tel (+55) 11 5054-1888 email: [email protected] .
Page 2
Electronic copy of this paper is available at: http://ssrn.com/abstract=953273
2
Overconfidence, Managerial Optimism and the Determinants of
Capital Structure
ABSTRACT
This research examines the determinants of the capital structure of firms introducing a behavioral perspective
that has received little attention in the empirical corporate finance literature. Specifically, we investigate a central
hypothesis that emerges from a set of recently developed theories: firms managed by optimistic and/or
overconfident people will choose more levered financing structures than others, ceteris paribus. We propose
different proxies for managerial optimism/overconfidence, mainly based on the manager’s status as an
entrepreneur or non-entrepreneur (for example, if the manager is the founder of the firm or a hired executive).
This proposition is supported by theories and solid empirical evidence showing that entrepreneurs tend to display
these cognitive biases more frequently than employees. We also define alternative proxies based on the pattern
of ownership of the firm’s shares by its managers. The study includes, in addition, potential determinants of
capital structure used in earlier research, as suggested by the traditional pecking order and trade-off approaches.
We use a sample of Brazilian firms listed in the Sao Paulo Stock Exchange (Bovespa) in the years 1998 to 2003
and employ robust panel-data estimation procedures to account for endogeneity and spurious correlation issues.
The empirical analysis strongly suggests that the proxies for the referred cognitive biases are important
determinants of capital structure. Specifically, we report a strong positive association between these proxies and
leverage ratios, in line with our behavioral hypothesis. We also found as relevant explanatory variables:
profitability, size, dividend payment and tangibility, as well as some indicators that capture firms’ corporate
governance standards. Our results suggest that behavioral approaches based on human psychology research can
offer relevant contributions to the understanding of corporate decision making.
Key-words: Capital Structure, Behavioral Finance, Cognitive Bias, Overconfidence, Optimism, Corporate
Finance.
JEL classification: G30, G31, G32.
Page 3
3
1 INTRODUCTION
Studies focusing the determinants of firms’ financing decisions address the problem from a wide range of
perspectives. In many cases, the distinct theoretical approaches are complementary. For instance, the tax benefits
of debt and the potential effects of greater financial leverage in mitigating conflicts of interest among outside
shareholders and managers in a given firm could be simultaneously weighted in a decision concerning its ideal
capital structure. Nonetheless, some of the determinants suggested in this literature are likely to be more relevant
than others for explaining observed financing patterns. This empirical question has motivated an increasing
number of studies about the actual drivers of firms’ capital structure.
Literature about this subject has been schematically divided in two theoretical streams (see, for example,
FAMA; FRENCH, 2002; SHYAM-SUNDER; MYERS, 1999). The first focuses on the different costs and
benefits associated with leverage, such as the expected costs of bankruptcy, agency costs of debt (related to
conflicts of interest between bondholders and shareholders), tax shields deriving from the deductibility of
interest payments and the disciplinary effects of leverage on managerial behavior. This set of arguments is called
“trade-off theory” (TOT), although, in fact, it subsumes various distinct theories. The main alternative to the
trade-off approach is the “pecking order theory” (POT), introduced by Myers (1984) and Myers and Majluf
(1984). This approach sustains that companies will tend to follow a hierarchy of preference for alternative
financing sources motivated by the informational asymmetries between their managers and outside investors.
Specifically, because firms will tend to seek financing sources that are less subject to the costs of informational
asymmetries, they will prefer to fund their business with internally generated resources. They will only turn to
external sources when necessary, preferably contracting bank loans or issuing debt securities. Selling new stock
is the last option. Thus, contrary to the TOT, in the context of POT there is no optimal debt ratio for the firm to
look for.
All of the above mentioned approaches hold in common one important point, namely, the implicit
assumption that financial market participants as well as company managers always act rationally. However, an
extensive and growing literature on human psychology and behavior shows that most people, including investors
and managers, are subject to important limits in their cognitive processes and tend to develop behavioral biases
that can significantly influence their decisions.
This study examines the possible influence of two closely related cognitive biases that are extensively
documented in behavioral research, optimism and overconfidence, on a firm’s capital structure decisions. Recent
theoretical Behavioral Corporate Finance literature suggests that these biases can substantially influence the
investment and financing decisions made by business managers. In fact, one strong prediction emerges from this
body of theories: optimistic and/or overconfident (or, for short, “biased”) managers will choose higher leverage
ratios for their firms than they would if they were “rational” (or not biased). Therefore, these biases could rank
among the determinants of capital structure. This study offers one of the first empirical tests of this hypothesis
and, at the same time, presents new evidence about the factors that better explain observed leverage levels, using
a sample of Brazilian public companies.
The article is structured as follows: Section 2 presents the related literature and the theories which motivate
the empirical work and Section 3 discusses the empirical strategies that were adopted. Section 4 discusses the
main results and Section 5 presents the concluding remarks.
Page 4
4
2 THEORY AND RELATED LITERATURE
2.1 Optimism and overconfidence
According to De Bondt and Thaler (1995, p. 389): “Perhaps the most robust finding in the psychology of
judgment is that people are overconfident.” Even Mark Rubinstein (2001, p. 17), an eminent researcher who
defends the rationality paradigm in Finance, admits: “[…] I have for a long time believed investors are
overconfident. Surely, the average investor believes he is smarter than the average investor.” To this date, there
are hundreds of studies by psychologists and other human behavior researchers about this cognitive phenomenon
and about another closely related one: unrealistic optimism.
Overconfidence has been identified in different behavioral contexts. Alpert and Raiffa (1969) and Fischhoff
et al. (1977) conducted two seminal experimental studies. They verified that participants in their experiments
showed excessive confidence in the precision of their subjective estimates of uncertain quantities, believing that
they were correct much more frequently than they actually were. This kind of study nourished other research,
which demonstrated the general tendency of people towards overconfidence in the form of errors in the
calibration of probabilities (see LICHTENSTEIN et al., 1982; BRENNER et al., 1996).
More generally, overconfidence can also be associated with people’s tendency to overestimate their own
skills and knowledge and/or the quality and precision of the information they can obtain. Research on “positive
illusions” shows that most people tend to consider themselves better than others or above average on different
attributes, whether these are social, moral (they consider themselves more honest than others) or related to
specific skills, like most drivers’ belief in their superior driving skills (SVENSON, 1981; TAYLOR; BROWN,
1988; ALICKE et al., 1995).
Another stream of research focused on the bias of optimism, which is closely related to overconfidence.
Some pioneering studies are attributed to Weinstein (1980; 1982). Participants in his experiments consistently
judged that their probability of going through positive experiences during life were above average, that is, were
higher than the probability of success they associated with their peers. Likewise, in general, participants
considered their chances of going through negative experiences as below average and, in particular, they tended
to underestimate their susceptibility to health problems. Kunda (1987) offers further evidence of optimism in the
general population.
There are good reasons to believe that company managers and businessmen are particularly susceptible to
the biases of overconfidence and optimism. In the first place, as individuals in general tend to overestimate their
own abilities, they will tend to show higher overconfidence and optimism about uncertain results they think they
can control (WEINSTEIN, 1980). March and Shapira (1987), in turn, argue that managers, after selecting the
investment projects they will undertake, become frequent victims of what is known as the “illusion of control”,
underestimating the probabilities of failure. Moreover, Fischhoff et al. (1977) and Lichtenstein et al. (1982),
among others, report that the level of overconfidence found in experiments is generally higher when participants
are answering moderately to highly difficult questions. In fact, overconfidence tends to disappear when the
questions are very easy and the tasks involved are quite predictable and repetitive, associated with quick and
precise feedback about their results. The main corporate decisions (selecting investment projects, for example)
certainly fit into the category of highly complex tasks with slow and frequently ambiguous feedback.
Page 5
5
People who are overconfident about their skills and the precision of their judgments minimize the risks
inherent in the tasks they undertake and, therefore, tend to show remarkably positive or negative performances.
Those who succeed as employees inside firms or with their own businesses end up in high managerial positions.
Following a similar reasoning, Goel and Thakor (2002) model the process of choosing leaders inside
organizations. One conclusion of their analysis is that competition for leadership positions induces candidates to
make riskier decisions. In this context, overconfident candidates have an advantage in comparison with their
rational peers, with greater probability of reaching top positions in the company. Hence, overconfident managers
can not only survive in the corporate environment, but also prosper and take the place of rational and less bold
managers.
Moreover, another well-documented bias in the psychological literature, known as the self-serving
attribution bias (MILLER; ROSS, 1975; NISBETT; ROSS, 1980), induces people to take too much credit for
successes in their undertakings and to assume too little responsibility for occasional failures. This learning bias
was used as a key assumption in a model by Gervais and Odean (2001) which suggests that successful stock
market traders tend to become overconfident in their own skills and knowledge. This reasoning can be applied in
the corporate case to support the hypothesis that managers who ascended to high managerial positions possibly
became overconfident in the process by exaggeratedly attributing their success to their own competence
(GERVAIS et al., 2003).
Gervais et al. (2003) also argue that managers may be more overconfident than the general population due to
a selection bias. According to the authors, people who are overconfident and optimistic about their professional
perspectives have a greater chance of applying for competitive high management jobs. Firms may also select
people with these characteristics if they are perceived as signs of greater ability. It is even possible that
candidates with such biases are rationally preferred, as suggested by Gervais et al.’s (2003) model.
2.1.1 Optimism, overconfidence and capital structure
The implications of optimism and overconfidence for corporate decisions have only recently begun to be
explored by Behavioral Finance researchers. Some studies address the issue from the perspective of rational
managers interacting with overconfident outside investors. Only recently has a smaller number of analyses
emerged focusing the cognitive biases of the managers themselves and trying to understand how they can affect
their investment and financing decisions. Baker et al. (2004) offer an extensive literature review on this subject.
As mentioned above, in the psychological and behavioral literature, optimism is generally associated with an
exaggeratedly positive perception about the probability that favorable events will occur and, simultaneously,
with the underestimation of the probability that unfavorable events will occur. Overconfidence, on the other
hand, can be associated with the overestimation of the quality and precision of information (signals about future
possibilities) available to the individual or, in the same line, with the underestimation of the volatility of
processes involving uncertainty. Analogously, overconfidence can make one think that he is more competent and
skilled than others or, generically speaking, that he is “above average”.
In the model offered by Heaton (2002), optimistic managers believe that the projects available to their firms
are better (in terms of expected return) than they actually are. Therefore, they think that the securities issued by
the firm, whether bonds or stocks, are systematically undervalued by outside investors (the model assumes
efficient capital markets). By nature, stocks are the securities most subject to the perceived undervaluation.
Page 6
6
Consequently, the firm will prefer to fund its investment projects with internally generated resources and,
secondly, by issuing debt securities, choosing to issue new stocks only as a last resort.
These results are compatible with the pecking order theory. Differently from the original proposition by
Myers (1984) and Myers and Majluf (1984), though, Heaton (2002) predicts that this pecking order type of
behavior will be more pronounced the more optimistic is the manager, ceteris paribus. A similar prediction is
offered by Malmendier and Tate (2002; 2003) and Fairchild (2005), both of which model optimism similarly to
Heaton (2002).
However, when overconfidence is added to the analysis, reflected in a biased perception of the volatility of
future firm’s profits, the pecking order behavior can disappear, as shown by Hackbarth’s (2004) analytically
more complete theory. In fact, in certain circumstances, stock issues can become the preferential financing
source. In other words, firms managed by optimistic and also overconfident individuals will not necessarily
follow a standard pecking order, although this may happen as a special case, depending on the prevalence of one
or other bias. Therefore, considering the set of available theories, the ranking of preference for financing sources
is not implied by managers’ cognitive biasing.
On the other hand, one theoretical result related to capital structure decisions is compatible with all models
available and emerges as the central prediction in this body of theoretical work. It establishes that managers who
are cognitively biased towards optimism and/or overconfidence will choose to issue more debt than their rational
peers. Intuitively, in Hackbarth’s (2004) model this occurs because the biased manager believes that the firm is
less likely to experience financial distress than it actually is. Thus, he will underestimate the expected cost of
bankruptcy and will take on more debt to exploit its tax benefits (or any other type of benefit originated from
higher leverage). Considering only the bias of optimism, Fairchild (2004) reaches the same conclusion in models
that also include informational asymmetries and conflicts of interest between managers and outside shareholders.
The positive association between the degree of optimism and overconfidence of managers and their firms’
leverage ratio is, in fact, the main non-ambiguous prediction in the set of theories considered here. This justifies
specific attention to its empirical verification.
2.2 Determinants of capital structure
The main traditional theories and a large part of the empirical studies about capital structure have been
reviewed by Harris e Raviv (1991) and, more recently, by Myers (2003). The wide range of arguments available
in this literature motivated the rise of an extensive field of research dedicated to the empirical investigation of
the “determinants” of capital structure, meaning the factors that are actually relevant to explain observed
financing patterns. These studies help to discard or confirm the relevance of different theoretical approaches and
also guide the development of new theories. Some examples are Titman and Wessels (1988), Rajan and Zingales
(1995), Fama and French (2002) and Frank and Goyal (2004).
None of these works considers any argument based on possible cognitive biases of managers. Nonetheless,
the behavioral theories described in the previous section strongly suggest that the degree of optimism and
overconfidence of managers can significantly influence their debt/equity choice. Therefore, as this research
proposes, these biases should be ranked among the potential determinants of capital structure.
Next, we list the potential determinants of capital structure that have been more often used in previous
studies and will also be considered in this work.
Page 7
7
2.2.1 Future investment opportunities
It is argued that future profitable investment opportunities can influence corporate financing decisions in
different ways. In the context of the pecking order theory, firms that have many investment opportunities and
believe that their stocks (and risky bonds) are undervalued by the market, may choose a capital structure with
less debt. If they maintained high debt ratios, they would be forced to distribute precious cash flows generated by
their business and could face the need to issue undervalued securities to fund new projects. This could, in turn,
induce underinvestment. A more static version of the pecking order model, on the other hand, predicts that firms
with more future opportunities will be more levered, ceteris paribus, because they need more external financing
and issuing debt is preferable to issuing new stock (FAMA; FRENCH, 2002, p. 4-5). Arguments based on
conflicts of interest between managers and stockholders also justify lower leverage of companies with more
expected profitable opportunities. According to Jensen (1986), one benefit of leverage is the imposition of a
commitment on the part of managers to regular cash flow distribution, thus mitigating the overinvestment
problem motivated by managerial desires to “build empires”, for example. However, for companies with many
good opportunities, this benefit would be smaller and leverage could even induce, again, underinvestment.
Hence, for these companies, the ideal capital structure includes relatively less debt (STULZ, 1990).
2.2.2 Profitability
More profitable firms have, ceteris paribus, more internally generated resources to fund new investments. If
their managers follow a pecking order, they will be less likely to seek external financing. Thus, on average, these
firms’ leverage ratios will be lower (FAMA; FRENCH, 2002). In trade-off models, on the other hand, this
relationship is inverted. More profitable firms are less subject to bankruptcy risks, ceteris paribus. Hence, their
expected bankruptcy costs are reduced and they can make more use of the tax shields provided by debt, thus
choosing a position of greater leverage.
2.2.3 Tangibility and collateral value of assets
Tangible assets, such as inventories, machinery and equipment, can be used as a collateral in loans, making
these operations less risky from the creditors’ perspective. Informational asymmetry models predict that
managers prefer issuing less risky securities when seeking external financing. Hence, firms with relatively more
tangible assets to be offered as collateral should be more levered.
Models based on conflicts of interest between managers and stockholders, on the other hand, suggest an
opposite relation between these variables. Titman and Wessels (1988) argue that it is more difficult for external
investors to monitor intangible assets, which increases the probability of expropriation by managers. One of the
mechanisms to mitigate this agency problem is to issue new debt, imposing a commitment to distribute free cash
flows that could otherwise be used inefficiently. Thus, firms with relatively more intangible assets could choose
higher debt levels as a way of reducing the probability of managerial expropriation.
2.2.4 Size
Studies suggest that the probability of bankruptcy is lower in larger firms and that, therefore, their debt
capacity is higher than that of smaller ones, all else equal. On the other hand, fixed transaction costs can make
Page 8
8
new stock issues unattractive to small corporations, stimulating them to issue debt (TITMAN; WESSELS, 1988,
p. 5-6).
2.2.5 Other potential determinants
Various other potential determinants of capital structure have been proposed in the literature and will be
used in this research. It has been argued, for example, that leverage should be inversely related to the degree of
volatility of the firm’s cash flows; to its available non-debt tax shields (volume of depreciable assets, for
example); and to the degree of uniqueness of its products and services. In other cases, there is controversy about
the expected direction of the relation between the variable and leverage measures. Simple pecking order models,
for example, predict that higher payout ratios will be associated with higher leverage. Trade-off arguments, on
the other hand, lead to the opposite conclusion.
Two other sets of potentially relevant factors include macroeconomic and corporate governance variables.
Frank and Goyal (2004) report, for example, a significant relationship between firms’ leverage ratios and
expected inflation in the USA. It is also likely that, ceteris paribus, firms with better governance practices face
more advantageous conditions when seeking external financing, independently of their institutional environment.
In Brazil, Brito and Lima (2005) offer evidence compatible with that hypothesis.
3 RESEARCH METHOD
3.1 Proxies for optimism/overconfidence – theoretical discussion
Although some models treat optimism and overconfidence separately for analytical purposes, psychological
and behavioral research reveals that these biases are closely related and are likely to appear jointly (TAYLOR;
BROWN, 1988). In other words, an optimistic person will tend to be overconfident and vice-versa. Hence,
proxies for optimism and overconfidence do not need, ordinarily, to capture each bias separately. Moreover, the
behavioral predictions tested in this research are the same, independently of which bias is considered.
Naturally, the cognitive biases of interest are not directly observable. Therefore, we need to identify
substitute variables with which they are correlated. In this study, we propose an operational definition for these
biases that is novel in the finance literature and is based on sound theories and empirical evidence, according to
which managers who are also entrepreneurs (that is, they manage their own business) tend to be distinctly more
optimistic and overconfident than the average person and than their “non-entrepreneur” peers.
There is evidence, to begin with, that people leading their own business display greater tendency to show the
illusion of control. In particular, Evans and Leighton (1989) document, in a panel sample with almost 4,000
North American men, that entrepreneurs believe more intensely, in comparison with other sample components,
that their performance largely depends on their own acts. Symmetrically, these authors record that the probability
of starting business activities is higher among individuals exhibiting this belief. In turn, experimental research,
such as the one conducted by McKenna (1993), suggests that unrealistic optimism is strongly associated with the
illusion of control.
In a seminal study, Busenitz and Barney (1997) directly compared psychological characteristics of
entrepreneurs with those of hired managers of large US firms. In their careful empirical investigation, the authors
used a sample of 124 entrepreneurs, that is, individuals who started and managed their own business, and 95
Page 9
9
professional managers from large firms, with middle to upper level responsibilities. Two cognitive biases,
including overconfidence, were measured through the application of questionnaires. The questionnaire related to
the overconfidence bias is similar to the one used by Fischhoff et al. (1977) and captures systematic errors in the
calibration of probabilities. Even after controlling for psychological traits, such as the degree of risk propensity;
and personal-demographic characteristics such as age and education, Busenitz and Barney (1997) found that the
entrepreneurs in their sample were substantially more overconfident than professional managers, obtaining
highly statistically significant results. Similarly, Baron (2000a) shows evidence that entrepreneurs (or individuals
wanting to become entrepreneurs) are especially optimistic and overconfident, in a sample comprised of
established entrepreneurs, potential entrepreneurs and non-entrepreneurs. More evidence is offered by Baron
(1998), and some related studies are reviewed by the same author in Baron (2000b).
Arabsheibani et al. (2000) used questionnaires applied to a large sample, including entrepreneurs (self-
employed) and employees, obtained from the British Household Panel Study, covering the years 1990 to 1996.
Across this time span, they recorded individuals’ forecasting errors about their income (or financial condition)
perspectives for the subsequent year. The authors found evidence of unrealistic optimism in all sub-samples, but
this bias was clearly and substantially more pronounced among the self-employed, even after controlling for
possible sources of heterogeneity among these groups, such as gender, civil status and education.
In another empirical study, Palich and Bagby (1995) show that entrepreneurs generally perceive a greater
potential for gain than non-entrepreneurs in situations involving high uncertainty. They also revealed greater bias
in their perceptions of the risks involved. Pinfold (2001) found that the entrepreneurs in his New Zealand sample
usually overestimated their projects’ chances of success. Using a sample of almost 3,000 US entrepreneurs,
Cooper et al. (1988) offer similar evidence. Zacharakis and Shepherd (2001) focused on venture capitalists and
argued that their decision process was similar to that of entrepreneurs, strongly based on decision heuristics. The
authors reported that 96% of the 51 components of their venture capitalists sample exhibited overconfidence in
their judgments about the potential success or failure of new businesses they evaluated.
Different theoretical analyses generate predictions in line with this empirical evidence. In the model
developed by De Meza and Southey (1996), the authors concluded that the true expected return of new ventures
(that is, evaluated at unbiased probabilities of success) must be negative in equilibrium (Ibid., p. 383-4).
Consequently, at this stage, all new entrants are necessarily people who overestimate the probability of success
of new businesses (optimists), although some of them may choose not to become entrepreneurs due to
insufficient wealth. The more simplified model by Landier and Thesmar (2004) offers a similar conclusion.
Also, the experimental study developed by Camerer and Lovallo (1999) suggests that overconfidence about
one’s own skills may be responsible for many people’s frequently precipitated decision to become entrepreneurs.
Bernardo and Welch (2001) offer an evolutionary model in which they justify the survival of agents with these
types of cognitive bias (which the authors define as “entrepreneurs”) in the economic environment.
The arguments and evidence listed in this section suggest that managers who are also entrepreneurs display
the biases of optimism and overconfidence more frequently or more pronouncedly than other managers.
Assuming that this is the case, we use the distinction between firms managed by “entrepreneurs” and those
managed by “non-entrepreneurs” (or professional managers) as the main strategy to empirically identify the
presence of these biases. Nevertheless, for assessing the robustness of results, alternative proxies will also be
used, based on the patterns of ownership of the firm’s stock by its own manager, as explained below.
Page 10
10
From the perspective of traditional Finance theory, in an efficient market a rational agent should not
downplay the benefits of correctly diversifying his personal investments. In contrast, many investors hold clearly
insufficiently diversified portfolios (FRENCH; POTERBA, 1991; HUBERMAN, 2001). In particular, many tend
to invest excessively in stocks from the company they work for (BENARTZI, 2001). Considering that managers
are naturally exposed to the idiosyncratic risks of their firms because of the link between their careers and the
success of the business (TREYNOR; BLACK, 1976; GERVAIS et al., 2003), it seems even more anomalous that
these individuals hold an insufficiently diversified portfolio by investing too heavily in their own firm’s stocks.
Although alternative explanations can account for this behavior, it is plausible that it is motivated, at least
partially, by cognitive biases.
Specifically, many managers experience the illusion of control, overestimating their capacity to influence
business performance and, at the same time, are overconfident in their own managerial abilities, which make
them unjustifiably optimistic about their firm’ perspectives. People with this profile tend to underestimate the
risks and overestimate the potential return of their firm’s stocks. This bias, then, could explain their high and
apparently suboptimal investment in stocks from the company to which their career is tied.
Alternatively, such insufficient diversification could sometimes be motivated by some privileged inside
information of the manager about the real perspectives of the business that have not yet been incorporated into
stock prices. In this case, however, managers would be expected to liquidate their excessive investments after
their information becomes public and is incorporated into the security’s market value. In contrast, in many cases,
managers keep constantly high levels of investment in their firm’s stocks across several years. Moreover, betting
on profits arising from inside information can be quite risky. One cannot know for sure, for example, that the
market will react favorably to an official announcement of a merger or acquisition that seems advantageous form
the manager’s point of view. Thus, gambling on this information can, again, be a sign of overconfidence and
optimism, especially if the stock returns obtained ex post are not all that rewarding.
Holding many stocks from one’s own firm may also be justified by the private benefits of control, in cases
when the manager is the controlling shareholder or integrates the company’s controlling group. This question is
extensively explored in the literature about corporate governance and about conflicts of interest between
managers and outside investors. Nevertheless, these studies do not explain why many controlling managers hold
stocks from their own company to a much larger extent than what is needed to assure their rights to control the
business.
Finally, it may be argued that managers could rationally purchase their firm’s stocks as a means of
conveying signals to the market about (supposedly) positive perspectives for that business (MALMENDIER;
TATE, 2002; 2003). However, just like in the inside information case, this signaling initiative would be expected
to be episodic and is incompatible with large holdings that extend indefinitely in time. Moreover, the repurchase
of outstanding shares is probably a less costly way of achieving the same signaling goals.
In sum, managers’ insufficient portfolio diversification, reflected in excessive personal holdings of their
firm’s shares, could be interpreted as a consequence of their optimism and overconfidence, at least in certain
cases. Specifically, in our sample, managers who constantly held the largest proportions of their firm’s stocks or
the highest monetary values (number of stocks multiplied by their price) were operationally defined as biased.
3.2 Data
Page 11
11
We use a sample of 153 non-financial Brazilian firms listed in the Sao Paulo Stock Exchange (Bovespa)
with data from 1998 to 2003, although not all firms had available data for all variables across all years,
characterizing the sample as an unbalanced panel.
Because we use public stock prices to calculate the market value of firms, a liquidity threshold was imposed,
using an annual stock liquidity index computed by the ECONOMATICA database (the biggest available in
Brazil). This procedure resulted in the selection for our final sample of those (153) non-financial firms with
acceptable liquidity and data availability. This sample is obviously biased towards bigger firms but is actually
representative of this subpopulation for Brazil, because it spans 17 different industries of 20 possible and it
includes almost half of all Bovespa listed firms.
Personal information about the top managers (CEO and chairman of the board) was collected from the
Brazilian Securities Commission’ (CVM) Annual Information (IAN) forms filled out by all firms authorized to
publicly trade their stocks from 1998 onwards. IAN includes different types of information about the firm and
about its executive directors and board members. Most of these personal data was extracted from a part of IAN
called Professional Experience and Academic Formation of Each Board Member and Executive Director. This
document contains a short biography for each manager, based on which we could infer, for example, whether he
or she is a professional executive or also an entrepreneur, company founder or heir of the business.
We collected personal data from each company’s CEO and chairman for each of the six years considered in
this study. This information comprised: manager’s name, year of birth, year when he or she took up the job,
gender, education (financial, general or technical), status (company founder, heir and/or controlling shareholder)
and number of preferred or common stock of the firm owned by its manager. Various other data types about each
firm were collected from ECONOMATICA and CVM.
3.3 Empirical methods and methodological discussion
Most capital structure theories suggest that firms set a “target” or “optimal” leverage ratio that is a function
of one or more determinants of their financing decisions. If we group in a vector x the potential determinants of
capital structure available in this study, our empirical model can be formulated as
*
1
T
it it i itLEV u η= + +xβ (1)
In the above equation, the year is represented by t ( 1,2,...,6t = years), the firm by i ( 1,2,...,153i = firms)
and *
itLEV is firm i ’s target or optimal leverage ratio in year t . The term
iu captures possible unobserved firm
characteristics that do not vary over time and influence *
itLEV , while the error component
1itη groups variables
that were omitted from the model and/or measurement errors of the regressors. Tβ is the transpose of the
parameter vector β .
If there were no transaction and adjustment costs, firms would immediately respond to any variation in their
target leverage, migrating to a higher or lower leverage level. In this case, with it
LEV representing company i ’s
actual leverage in year t , we would always have *
it itLEV LEV= (except for some random shock that could
Page 12
12
contemporaneously affect it
LEV ). However, significant transaction costs and other frictions can hinder the firm
from reaching its optimal leverage. This process can be represented by a partial adjustment model in the form
*
1 1 2( )
it it it it itLEV LEV LEV LEVλ η
− −− = − + (2)
in which 2it
η is a random shock with zero expectation that may influence the variations of leverage over the
years and λ is the partial adjustment coefficient, with 0 1λ< < . If λ was equal to 1, we would always expect
the firm’s observed leverage to correspond to its target. The λ parameter can also be seen as an adjustment
speed coefficient, so that values closer to 1 suggest a faster adjustment pace towards the target. After substituting
(1) in (2) and rearranging the terms, we obtain
1 1 2
(1 ) T
it it it i it itLEV LEV uλ λ λ λη η
−= − + + + +xβ (3)
The above expression can be simplified in the form of the following dynamic model
1
T
it it it i itLEV LEV cα η
−= + + +xθ (4)
where (1 )α λ≡ − , 1 2it it it
η λη η≡ + , i ic uλ≡ and ≡ λθ β . The time-invariant unobserved heterogeneity is
now represented by ic and
itη represents the model’s error component, with [ ] [ ]
it iE E cη = = 0 ( [.]E is the
expectation operator). Hence, if a partial adjustment process towards a target capital structure adequately
described firms’ behavior, the first lag of the response variable needs to be added to the set of regressors. The
omission of 1it
LEV− will lead to inconsistent estimation of the parameters contained in the vector θ to the extent
that there is correlation between this variable and one or more components of itx . Different versions of the
above argument were used (for distinct purposes) in recent studies about financing structure, such as Fama and
French (2002), Frank and Goyal (2003) and Gaud et al. (2005).
Other arguments could justify the preference for specifications of the type shown in (4) in comparison with
the static formulations more frequently used in this literature. Independently of the existence of a target capital
structure, we commonly observe some mean-reverting behavior in many corporate variables, inducing a negative
correlation between their current values and their subsequent variations. A dynamic model like the one
formulated above could adequately capture this kind of behavior. It is also argued that lags of the dependent
variable can isolate spurious influences caused by potentially omitted variables from the original model. See, for
example, Finkel (1995, p. 7-11).
In equation (4), the parameter vector θ contains the coefficients to be estimated (except for α ) and may
include an intercept term. All control variables are included in the vector x , as well as the proxy for the
manager’s degree of overconfidence/optimism, represented by it
OVER . The ic term can isolate, depending on
the estimation method, all firm i ’s unobserved time-invariant characteristics, mitigating problems originated
from the omission of relevant variables from the model. Although dynamic formulations are probably more
Page 13
13
adequate, static versions of the models (that is, excluding 1it
LEV− from the set of regressors) will also be
estimated to check the stability of results and make them more comparable to those obtained by most previous
studies about the determinants of capital structure.
In estimating the empirical models based on (4) or their static counterparts one should explicitly take into
account the sources of endogeneity that are potentially most relevant to the problem at hand and may hinder the
correct identification of the causal relationships among variables1. The theoretical and empirical corporate
finance literature particularly suggests the existence of a two-way causal relationship (or simultaneous
determination) between firms’ leverage and some corporate variables. For example, different theoretical
arguments sustain that observed market value, as a proxy of future investment opportunities, can
contemporaneously influence the firm’ financing policy (see Section 2.2.1). At the same time, other theories
suggest that leverage can influence organizational performance, for example, by reducing the firm’s free cash-
flow, which could be used inefficiently by self-interested managers, thus partially contributing to the
determination of the company’s market value (STULZ, 1990; MCCONNELL; SERVAES, 1995). Recent studies
also suggest that capital structure can influence the firm’s payout policy, at the same time as it is influenced by
payout policy (FAMA; FRENCH, 2002). Analogous reasoning can be applied to some other variables, often
introducing some ambiguity about the direction of the expected causal relationships. Ignoring the likely
simultaneous determination of leverage and some of the regressors contained in vector x can render the
estimator of the model’s parameters inconsistent.
To address the issue of simultaneous determination and other sources of endogeneity, we use a robust
estimation procedure based on the Generalized Method of Moments - GMM, proposed by Blundell and Bond
(1998) and known in econometric literature as system GMM (GMM-Sys). GMM-Sys is appropriate for dynamic
models with unobserved heterogeneity, like the one described by equation (4), and frequently uses lags of the
possibly endogenous regressors as their own instrumental variables. The conditions that assure the validity of
this estimation strategy are discussed by Blundell and Bond (1998), and their statistical plausibility can be
formally tested with the available data.
Blundell et al. (2000) use simulated as well as real corporate data with similar characteristics to those
available in corporate finance research to compare the performances of different estimation methods applied to
models specified similarly to what was shown in (4). Their results clearly show the superiority of GMM-Sys
over more traditional estimators2 when there is significant unobserved heterogeneity and some degree of
endogeneity (motivated, for example, by measurement errors or by the simultaneous determination of some
regressors and the dependent variable). Blundell et al. (2000) also show that the GMM first-differenced estimator
(GMM-Dif), developed by Arellano and Bond (1991), which is usually applied to dynamic models with panel
data, can be substantially biased3. The GMM-Dif was used in recent studies about the determinants of capital
1 For the purposes of this research, we define endogeneity as the correlation between one or more regressors and the model’s error
term. This problem can be motivated, mainly, by omitted variables, by the simultaneous determination of some regressors and the response
variable or by measurement errors in explanatory variables.
2 Including the well-known Fixed Effects (FE) and Ordinary Least Squares (OLS) estimators.
3 The finite sample bias of the Arellano and Bond (1991) estimator occurs when the time series of the explanatory variables are
highly persistent (highly autoregressive behavior), an attribute shared by several corporate variables, such as leverage indicators and other
measures based on accounting data. Moreover, Blundell et al. (2000) show that, in these circumstances, the GMM-Dif method is relatively
inefficient in comparison with GMM-Sys.
Page 14
14
structure, such as Gaud et al. (2005). The system estimator by Blundell and Bond (1998), on the other hand, has
not yet been used in this type of research, to the best of our knowledge.
Although the GMM-Sys method is probably more appropriate, other estimation strategies, discussed in
Section 4.3 below, will be used to check the stability of results.
3.4 Book and market leverage
Capital structure theories do not offer immediate guidance about what precise leverage measures on should
use in empirical studies. In particular, it could be more appropriate to use “book” leverage measures in some
cases and “market” measures in others, although this choice is often unclear.
Consider the following possibility, discussed by Titman and Wessels (1988, p. 7-8). If financing decisions
were irrelevant to firms, managers could randomly set a target leverage ratio. If this target is established in terms
of book values (for example, total debt divided by the book value of assets), none of the regressors would
contribute to explain the (random) behavior of book leverage. However, some regressors that are correlated with
firms’ market value could significantly influence leverage measures such as total debt divided by the market
value of assets, inducing a spurious correlation among these variables. Analogously, other spurious correlations
could emerge if managers established the random target in terms of market instead of book leverage.
Fortunately, as the authors argue, in this context, book and market leverage measures induce spurious
correlations in opposite directions. Hence, the alternate use of both types of proxies helps to avoid inappropriate
inferences. Also, Fama and French (2002, p. 8-9) argue that some theoretical predictions imply a clear relation
between some variables and book leverage measures, but not necessarily between the same indicators and
market leverage (or vice-versa), while other predictions suggest exactly the same relation, independently of how
leverage is measured. Again, such arguments suggest the use of book as well as market leverage measures to
assure consistent results.
3.5 Operational definition of variables
3.5.1 Overconfidence/optimism
The theoretical discussion in Section 3.1 above and the available empirical evidence indicate that the
classification of the manager as an entrepreneur or non-entrepreneur may capture their degree of overconfidence
and optimism. We define a dummy variable, coded it
OVER , with 1it
OVER = if the manager of the i th firm in
the t th year was classified as an entrepreneur (overconfident/optimistic individual) and 0it
OVER = if he was
classified as a non-entrepreneur (“rational” or less overconfident/optimistic person).
In principle, we could pick the CEO alone as the firm’s “relevant manager”. However, this is probably not
the best strategy to build this variable because of the ambiguity found in some Brazilian firms about who is
actually responsible for the main corporate decisions. Although the CEO is surely responsible for the most
immediate decisions, in many firms, especially family controlled ones, the organization reflects more the profile
of its chairman of the board, who often is the founder and/or controlling shareholder of the business. Ignoring
him as a relevant decision maker, thus, could lead to incorrect classifications. Of course, when both positions are
occupied by the same person, there is no such ambiguity (this is the case with approximately 40% of our firms).
In fact, when the relevant manager is defined as the CEO or the chairman, in contrast with the more restrictive
Page 15
15
definition that only considers the former, classification discrepancies are restricted to a relatively small part of
the sample (less than 10% of all observations).
Based on the above arguments, we define 1it
OVER = if the CEO or chairman of firm i in year t is the
founder or heir of the business and 0it
OVER = if none of them fits into these categories (thus characterizing
them as ‘professional managers’). Analogous operational definitions that consider solely the firms’ CEO or its
chairman as the manager are also used to check the robustness of results and are presented in Section 4.3 below.
Classifying only the company founder as an entrepreneur is not the most adequate procedure for the sample
under analysis because it may induce classification errors, considering that virtually all firms’ heirs in this study
have a clear entrepreneurial profile, decisively influencing the directions of their business and in many cases
starting new ventures. One alternative operational definition that addresses this problem considers only company
founders as entrepreneurs, but excludes all heirs from the sample. This alternative is explored in Section 4.3.
Another set of operational definitions for the cognitive biases of interest explores their possible connection
with managers’ holdings of their firms’ shares. One of the definitions proposed considers that 1it
OVER = if the
CEO or chairman of firm i in year t holds more than 50% of its common shares and 0it
OVER = otherwise.
Other analogous alternative definitions are described in Section 4.3.
3.5.2 Leverage
Four proxies were built, using total or long-term debt and book or market value of assets. Specifically, in the
numerator we have firm’s total debt (it
D ), including short and long-term loans and bonds or, alternatively, only
its long-term debt (it
LTD ). In the denominator we have firm’s total assets at book value (itA ) or its “market
value” version, defined as it it itA E MVS− + , where
itE is the book value of equity and
itMVS the total market
value of its shares. Again, i and t refer, respectively, to firm and year.
3.5.3 Other variables
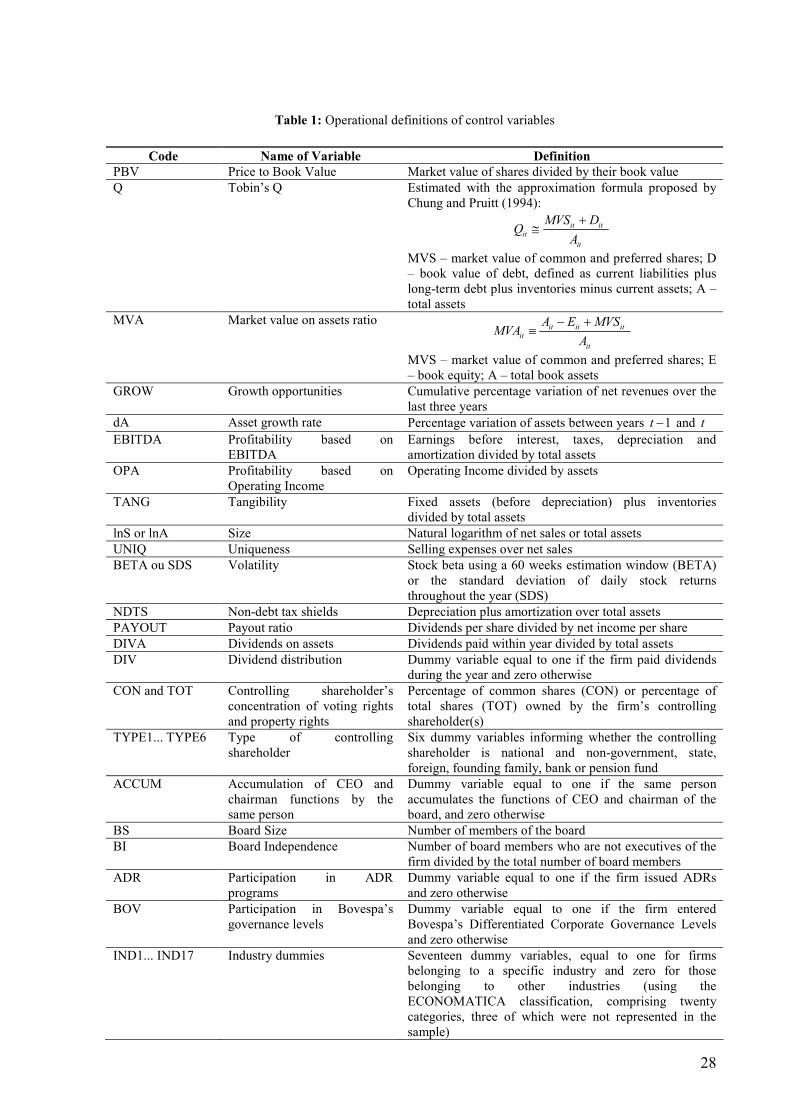
Operational definitions for the other variables used in this research are described in Table 1.
Different indicators (it
PBV , it
Q , it
MVA , it
GROW e it
dA ) attempt to capture firms’ market value and
differences in their growth opportunities. Other sets of variables, related to the structure of the board, ownership
concentration, type of controlling shareholder, participation in ADR (American Depositary Receipts) programs
or in Bovespa’s differentiated levels of governance try to capture the differences in their corporate governance
standards and ownership structure. Analogously, proxies are defined for each of the remaining potential
determinants of capital structure presented in Section 2.2, based on definitions used in earlier works, such as
Titman and Wessels (1988) and Fama and French (2002).
Time indicator variables (year dummies) are used to isolate the macroeconomic shocks and aggregate
effects in general that influenced firm’s leverage within the time span under study. Finally, industry dummy
variables were used in some regressions to control for idiosyncrasies of the different types of business that were
not captured by the other regressors.
4 EMPIRICAL RESULTS
Page 16
16
4.1 Some descriptive statistics
A preliminary inspection of the data shows that the distribution of firms among the different industries
(according to the ECONOMATICA classification system, which has 20 categories) is relatively homogeneous,
with stronger representation of the Electric Energy (13.73% of all firms) and Telecommunications (11.11%)
sectors. Family owned firms are more frequent in the sample in comparison with other types of controlling
shareholder, comprising, on average (across the period under study) about 47% of all companies. Moreover,
none of our sampled firms is controlled by banks, and the proportions per type of controlling shareholder
remained relatively constant between 1998 and 2003.
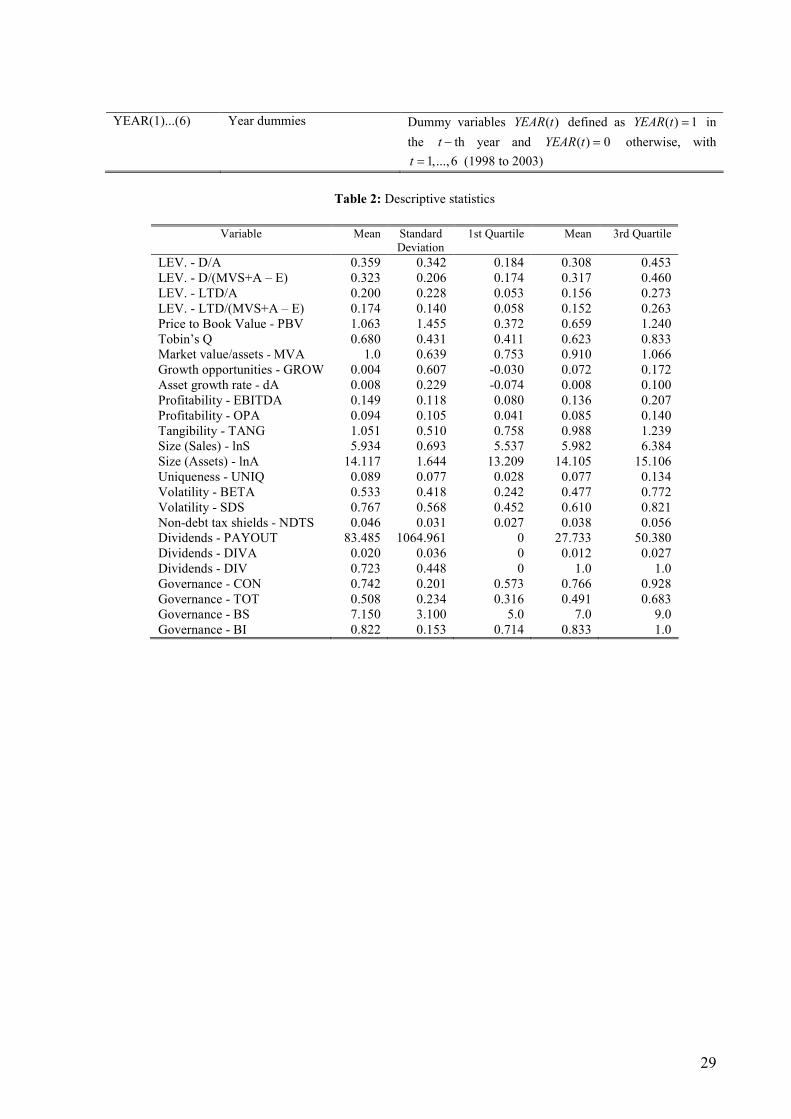
Means, standard deviations, medians, first and third quartiles for most the variables are shown in Table 2.
We observe, for example, that the mean leverage ratio is relatively low. Although not shown in the table, we
found no clear growth or reduction tendency of mean leverage ratios over time. Comparing the years 1998 and
2003, book leverage measures showed a 12% positive variation, while market measures showed a 7% negative
variation. Table 2 also shows a high concentration of voting rights in the hands of controlling shareholders
(74.2% mean), associated with a substantially lower concentration of total shares (50.8% mean). Moreover, the
mean number of board members is approximately 7, and companies obtained a mean profitability ratio (EBITDA
divided by assets) of 0.149 across the period under consideration.
Besides the information in Table 2, we also point out that approximately 17% of the firms issued ADRs and
that, in 2003, approximately 21% of them had entered one of Bovespa’s Differentiated Corporate Governance
Levels, including its Novo Mercado (New Market). In about 38% of the firms, the CEO accumulated the position
of chairman. Approximately 43% of the firms were managed by entrepreneurs, according to the criterion
described in Section 3.5.1, third paragraph. If only the CEO is considered as the relevant manager, this
proportion decreases to about 37%. When considering only the chairman, the average proportion is close to 42%.
Descriptive statistics for the variables were also calculated separately for two sub-samples, defined as
‘Group 1’ (firms managed by entrepreneurs) and ‘Group 2’ (firms managed by non-entrepreneurs), using the
classification criterion described in Section 3.5.1, third paragraph. These preliminary comparisons, not reported,
show relatively homogeneous characteristics between both groups. We observe, for example, that leverage ratios
were only slightly higher, and profitability levels slightly lower for Group 1, and also that ownership
concentration in the hands of the controlling group was virtually identical in both groups. One clearer difference
is firm size: Group 1 firms are smaller, on average, than Group 2 firms. Furthermore, Group 1 firms issued less
ADRs and distributed less dividends. Conventional tests for equality of means show statistically significant
differences in usual levels for leverage, profitability, size and asset tangibility indicators. Excluding state-
controlled firms from the sample does not change these results substantially.
4.2 Regressions
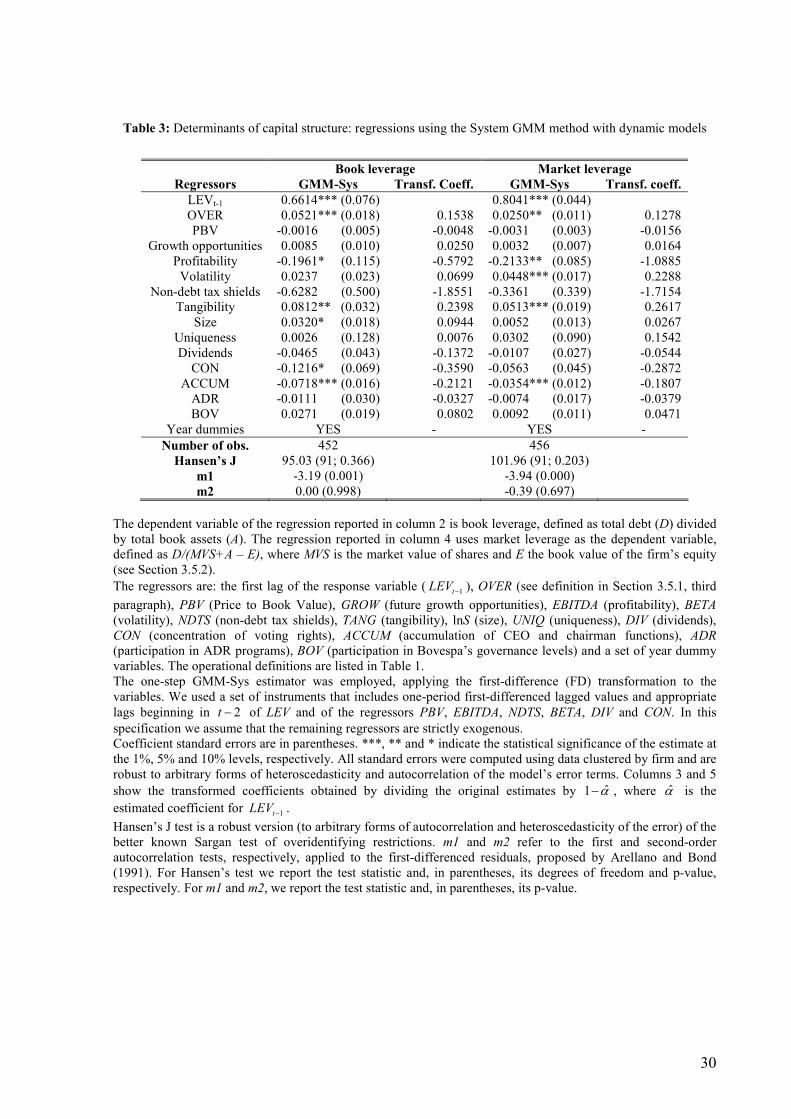
Dynamic specifications similar to the one shown in equation (4) were estimated using the System GMM
procedure (GMM-Sys) described by Blundell and Bond (1988) and the results of two such regressions are
reported in Table 3. In the second column of Table 3, the dependent variable is a leverage measure constructed
as the firm’s total debt outstanding divided by the book value of its assets. In the fourth column, leverage is
defined as the ratio of total debt and the market value of assets (as defined in Section 3.5.2). The control
Page 17
17
variables and potential determinants of capital structure included in the regressions are described in the table’s
foot note, as well as the technical details of how the estimator was implemented. Specifically, we assume in
these models that the proxies for the firms’ market value (PBV), profitability (EBITDA), non-debt tax shields
(NDTS), volatility (BETA), dividend policy (DIV) and ownership structure (OWN) are potentially endogenous
(possibly due to their simultaneous determination with the dependent variable) and use their lagged values as
instrumental variables. Finally, the dummy variables related to industry classification and type of controlling
shareholder did not vary over the sample period and, hence, were excluded from the regressions.
Table 3 shows expressive and significant coefficients at the 1% level for the lagged dependent variable
(1t
LEV−), confirming the strong persistency of leverage ratios over time. The estimate associated with one of the
corporate governance indicators (ACCUM) is also consistently significant across specifications, and its sign
suggests that leverage tends to be lower in firms where the same person accumulates the jobs of CEO and
chairman. Moreover, depending on the model’s specification, the coefficients for profitability, tangibility, size,
volatility and controlling shareholder’s ownership concentration show some significance, at least at the 10%
level. Nevertheless, what is more important for this research is the result reported in the second line of the table.
After controlling for observable and non-observable firm characteristics, the coefficient for OVER is positive and
statistically significant at the 5% or 1% levels, suggesting that leverage tends to be significantly higher in firms
managed by “entrepreneurs” than in those managed by “professionals”, a result compatible with the behavioral
theories discussed in Section 2.1.1.
Assuming that a partial adjustment process adequately describes the dynamic behavior of leverage, as
discussed in Section 3.3, we can recover the coefficients (contained in vector β ) of the model which describes
the firm’ target leverage ratio, represented by equation (1). Expression (4) shows that = λθ β and, therefore,
= λ−1β θ . As discussed in Section 3.3, λ can be viewed as a parameter that captures the speed of the
adjustment process of leverage towards its target value and, as defined before, 1λ α= − , where α is the
coefficient of the lagged dependent variable. Considering the estimates from Table 3, the value of λ̂ is
approximately 0.34 (1 – 0.66) when the response variable is book leverage, and 0.2 (1 – 0.80) when the response
variable is market leverage. Columns 3 and 5 in this table show the values for β̂ obtained by dividing the
estimated coefficients by λ̂ . These transformed estimates are, of course, higher (though some of them are not
statistically different from zero, even if their absolute values are high) and may be interpreted as measures of the
regressor’s long-term effect on target or “equilibrium” leverage, while non-transformed estimates could capture
short-term impacts (for a general discussion about this interpretation, see FINKEL, 1995, p. 11).
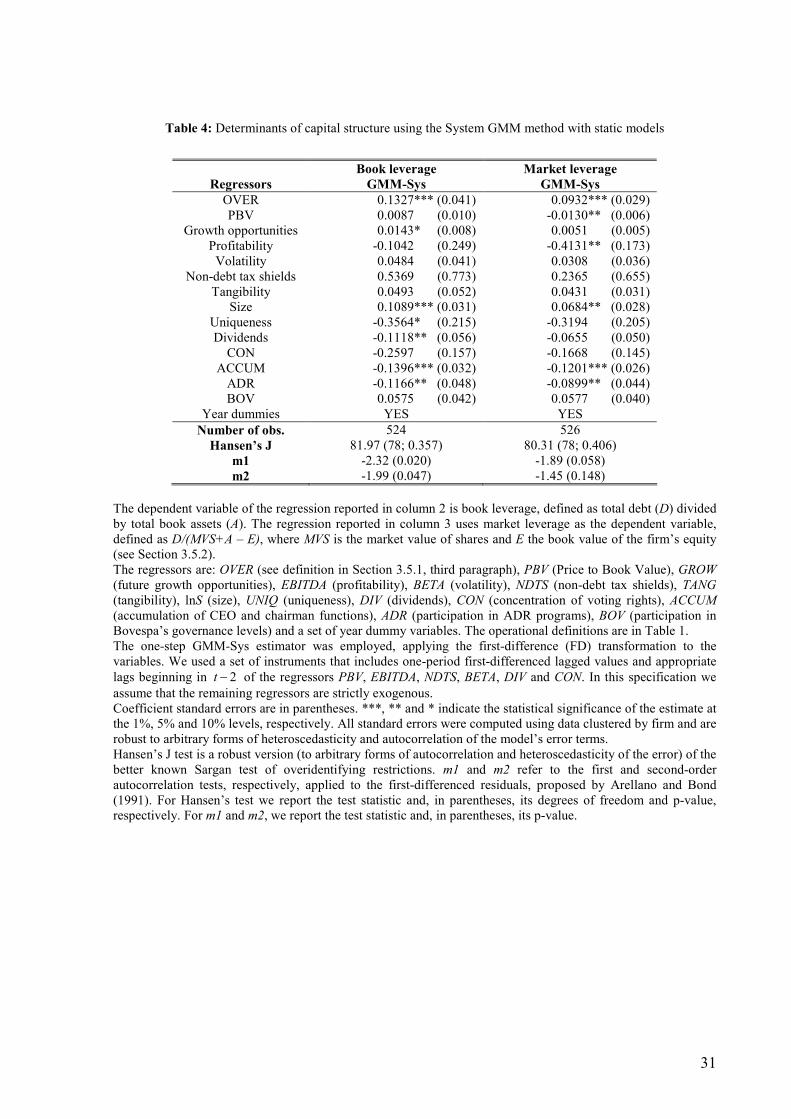
In order to check the stability of results and make them more comparable with those reported in earlier
research, we also estimated regressions excluding 1t
LEV− from the set of explanatory variables. Table 4 presents
the estimates from two static specifications that are identical to those reported in Table 3 (except for the
exclusion of 1t
LEV−). Results are qualitatively different from those discussed above for some of the regressors.
In particular, the coefficient of the dummy variable ADR becomes significant at the 5% level, as well as the
proxy for firm size. Nevertheless, for other indicators, such as ACCUM, the results are qualitatively very similar.
Of particular importance, we note that the coefficient associated with our proxy for managerial
overconfidence/optimism (OVER) remains significant (at the 1% level in the two regressions) and positive. The
estimates, ranging approximately from 0.09 to 0.13, are higher than those reported in Table 3, but they are quite
Page 18
18
similar in magnitude to the coefficients transformed by the method described in the previous paragraph (with
values ranging from 0.13 to 0.15). In general, these results show that the influence of OVER on expected
leverage seems to be relevant also from an economic point of view, reflecting substantial differences in capital
structure (or target leverage ratios) between the groups of firm defined by this variable.
After estimating the models, different diagnostic tests were implemented to check the statistical plausibility
of the assumptions adopted. We compute the Sargan-Hansen test of overidentifying restrictions, whose null
hypothesis is correct linear specification and orthogonality (non-correlation) between the set of instruments used
and the model’s error term (see, for example, ARELLANO, 2003, p. 192-7). As observed in tables 3 and 4, we
cannot reject the null hypothesis at the usual significance levels. This result suggests that the fundamental
assumption of non-correlation between the instruments and the error term is statistically plausible. Bowsher’s
simulation study (2002) shows, however, that the power of these tests (probability of rejecting a false null
hypothesis) tends to be low when the number of instruments is high and the sample size is moderate, which is the
case in this research. To overcome this deficiency, the author suggests computing the same tests using
appropriate sub-sets, instead of the complete set of instruments. A procedure similar to Bowsher’s (2002) was
applied, significantly reducing the degrees of freedom of the tests. The results were qualitatively similar in these
cases, again suggesting the non-rejection of the null hypothesis. Also, the validity of our estimation strategy
critically relies on restrictions to the autocorrelation behavior of the error terms. In the specifications reported in
tables 3 and 4, we assume that the errors are not autocorrelated. This hypothesis is generally corroborated by the
autocorrelation tests proposed by Arellano and Bond (1991)4. Other test procedures, not reported here, confirm
the adequacy of our empirical strategy, especially for the dynamic specifications, like the ones reported in Table
3.
With respect to the estimation of the coefficients’ standard errors, the diagnostic analyses suggest the use of
robust estimators, due to suspected heteroscedasticity of the error terms. It is also possible, as Fama and French
(2002) argue, that inferences in corporate finance studies are harmed by the presence of contemporaneous error
correlation, caused by macroeconomic shocks or effects of business cycles that affect the response variable. In
order to simultaneously deal with these difficulties, all regressions were estimated with year dummies, capable of
isolating such aggregate shocks, and all standard errors were calculated using data clustered by firm, making
them asymptotically robust to arbitrary forms of heteroscedasticity and autocorrelation of the error terms. See
Petersen (2005) for a more detailed discussion on the effectiveness of this strategy.
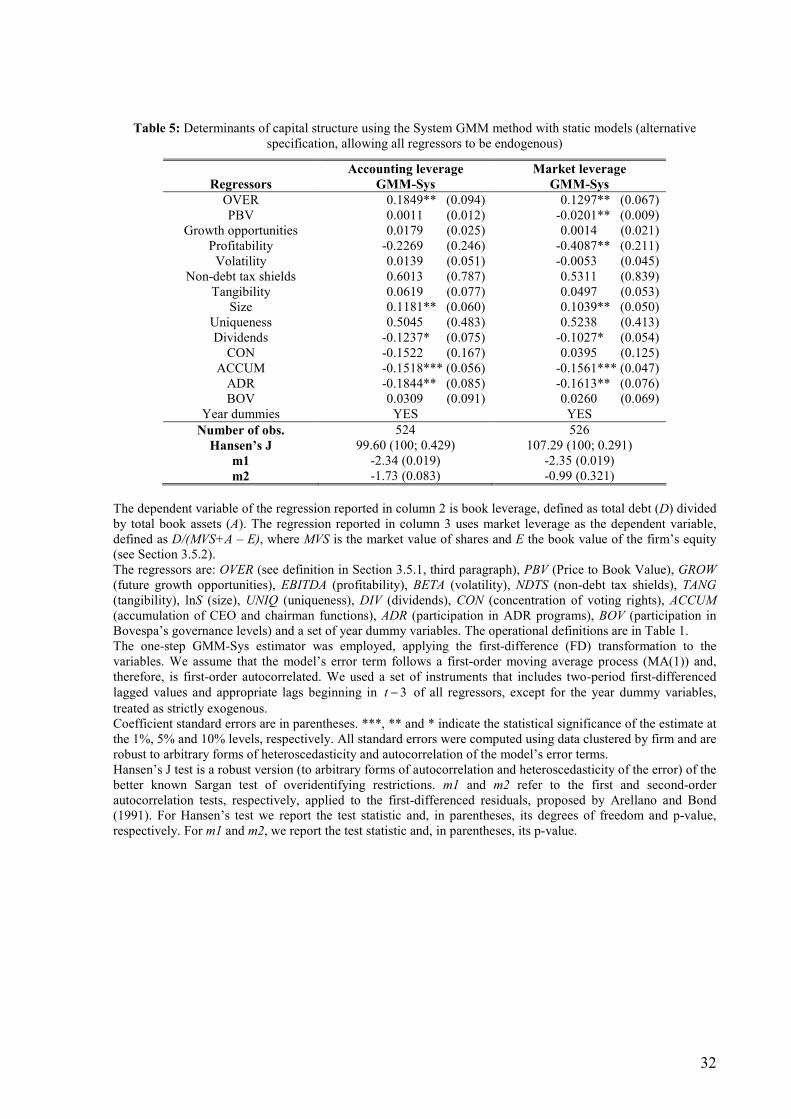
4.3 Robustness of results
In order to check the stability of results and the reliability of our inferences, especially concerning the
influence of our proxy for managerial overconfidence/optimism on firms’ leverage ratios, a number of variations
of the empirical research strategy were employed. First, we examined the results’ sensitivity to variations in the
assumptions adopted for the regressions reported in tables 3 and 4. Specifically, the dynamic and static models
discussed in the previous section were re-estimated assuming that all regressors, except for the year dummies,
are potentially endogenous (including the variable of interest OVER). Moreover, different assumptions about the
autocorrelation behavior of the error terms were used. As an illustration, the results obtained with two of these
4 Except for a static regression in which the dependent variable is book leverage. Variants of these specifications, allowing errors
to be first-order autocorrelated, for example, were also estimated and their results are discussed in the next section.
Page 19
19
alternative specifications are reported in Table 5, treating all regressors as potentially endogenous and allowing
errors to be first-order autocorrelated (this possibility was suggested by the autocorrelation test results reported
in the second column of Table 4). The results in Table 5 are qualitatively similar to those discussed above. In
particular, the estimated coefficients for OVER are higher than those reported in Table 4. The same occurs when
dynamic models are similarly specified (in this case, not reported, coefficients for OVER range between 0.05 and
0.057 and remain significant at the 5% level).
In other specifications, we used different proxies for the constructs of interest. For example, long-term
leverage measures were used instead of total leverage in some regressions. Alternative indicators for some of the
potential determinants of capital structure were also considered, when available. In some models, for example,
we replaced the proxies for growth opportunities (GROW by dA), profitability (EBITDA by OPA), size (lnS by
lnA) and dividend policy (DIV by PAYOUT). The descriptions of these variables are shown in Table 1. In
general, the positive sign and the statistical significance of the proxy for managerial overconfidence/optimism
remained unchanged in these regressions. The results are also robust to variations in the functional form of the
models (we added, for example, squared terms of some regressors when we suspected there were nonlinearities
in their relation with the response variable).
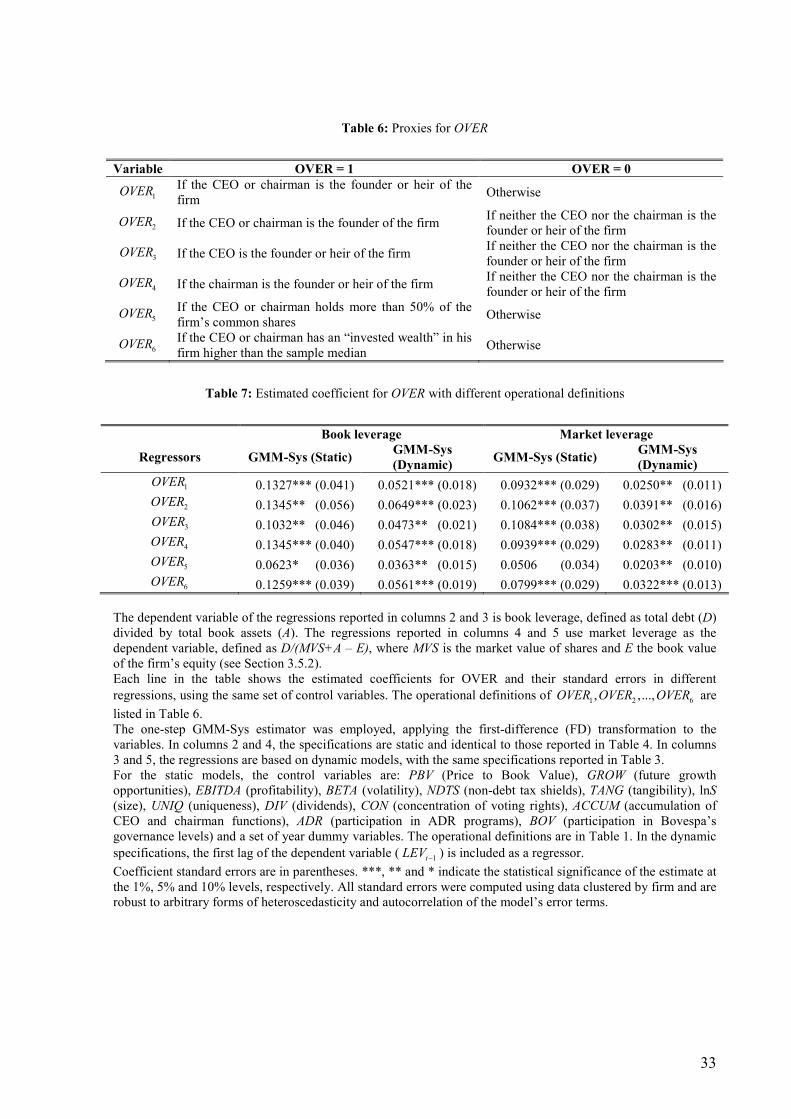
Perhaps more importantly, we analyzed the stability of results by estimating models with alternative proxies
for the degree of managerial overconfidence/optimism. Table 7 reports the estimated coefficients associated with
six different operational definitions for these cognitive biases, called 1 2 6, ,...,OVER OVER OVER , each used in
four distinct models (two dynamic and two static models, using book or market leverage as the response
variable). 1
OVER is the same proxy used before and is included in the table for the sake of comparison. Its
definition is presented in Section 3.5.1, third paragraph: 1
1it
OVER = if firm i’s CEO or chairman in year t is the
founder or heir of the business and 1
0it
OVER = if neither manager fits into these categories.
The definition of 2
OVER ignores the heirs, so that 2
1it
OVER = if the CEO or chairman of firm i in year t is
the founder of the firm. In this case, in order to avoid classification errors (heirs with entrepreneurial profile
classified as non-entrepreneurs), firms managed by heirs were excluded from the sample. In practice, this means
that 2
0it
OVER = when the manager is a “professional executive”, being neither the company founder nor its
heir.
The proxy named 3
OVER defines only the firm’s CEO as the relevant manager. Its construction is similar to
1OVER , so that
31
itOVER = if firm i’s CEO in year t is the founder or heir of the business and
30
itOVER = if
neither the CEO nor the chairman fits into these categories (founders or heirs who occupied the position of
chairman were excluded to avoid classification errors). 4
OVER is defined analogously, but replacing the CEO
by the chairman as the relevant manager.
The final two definitions explore, based on the arguments in Section 3.1, the likely connection between the
under-diversification of the managers’ personal portfolio and their degree of overconfidence/optimism. More
specifically, the definition of 5
OVER focuses on the excessive holdings of common shares by some managers.
We consider “excessive” a holding by the manager of more than 50% of his firm’s common shares (hence, more
than needed to assure him control of the business). In other words, 5
1it
OVER = if firm i’s CEO or chairman in
year t holds more than 50% of its common shares and 5
0it
OVER = otherwise. Finally, 6OVER considers the
Page 20
20
monetary value invested by the manager in his firm’s common or preferred shares. This “invested wealth” was
calculated by multiplying the total percentage of shares held by the manager by their market value in each year t.
In this case, 6
1it
OVER = if the CEO or chairman of firm i in year t has a higher invested wealth than the median
invested wealth in the sample and 6
0it
OVER = otherwise. Table 6 summarizes these alternative operational
definitions.
The estimates reported in Table 7 were obtained by applying the System GMM method to models specified
identically (except for the variable OVER) to those reported in Table 4 (for the static models) or in Table 3 (for
the dynamic specifications). Thus, results in Table 7 are directly comparable to those discussed in the previous
sections.
Table 7 shows that the magnitude of the coefficient may vary considerably when we change the operational
definition. Nevertheless, in all cases, its sign remains positive and, in almost all cases, it remains statistically
significant at conventional levels, pointing towards the very same conclusions. In fact, the estimated coefficient
is not significant at the 10% level in only one case.
The proxy 2
OVER , which considers only firm founders as “cognitively biased”, shows the strongest results
in terms of the magnitude of the estimates. On the other hand, the estimates for 6
OVER , related to the amount of
money the manager invested in his firm’s shares, were the most statistically significant ones, on average. In both
cases, results are quite similar to those obtained with the proxy 1
OVER , used in earlier regressions. At the other
extreme, 5
OVER , associated with the manager’s holdings of common shares, produced the smallest and least
significant coefficient estimates. Other variants of these operational definitions were constructed and tested and,
in general, the results obtained are coherent with those discussed above.
Another extension of this research is based on the explicit modeling of the constructs of interest as latent
(unobserved) variables that influence the observed proxies. For example, sales and total assets can be interpreted
as indicators of the theoretical construct ‘firm size’. The latent variable ‘board structure’, in turn, can be reflected
in different indicators, such as the number of board members, the proportion of independent directors and the
accumulation of the jobs of CEO and chairman by the same person. The representation of the ‘managerial
overconfidence/optimism’ construct as a latent variable is of particular interest and we assume this variable is
reflected in the different proxies mentioned above. The alternative operational definitions for each construct
were then combined using an Exploratory Factor Analysis. This procedure produced factor scores, interpreted as
estimates of the latent variables. Next, the factor scores were used as regressors in models specified similarly to
those previously reported and estimated by the System GMM method. In general, the estimated coefficients for
the factor scores showed lower absolute values (these regressions are not reported here and may be requested
from the authors). On the other hand, these estimates are more precise, often displaying much lower standard
errors than those obtained before. More importantly, the conclusions about the directions and significance of the
relations between the main variables are maintained. The use of estimates of latent variables instead of individual
indicators in the regressions may be useful to mitigate measurement error problems and has also been justified as
a way of avoiding, on the one hand, ad hoc selection of the proxies used as regressors and, on the other,
multicolinearity problems (TITMAN; WESSELS, 1988).
The exclusion of outliers, identified, for example, using the studentized residuals of preliminary regressions,
does not materially change our conclusions. Neither does the winsorization of all non-dichotomous variables
Page 21
21
(replacement of their extreme values, highest and lowest, by adjacent “non-extreme” values). Also, the results of
the application of a test procedure described by Wooldridge (2002, p. 581) suggest that our inferences do not
seem to be significantly influenced by a possible sample selection bias induced by the significant number of
missing observations in some regressors.
Finally, we computed static regressions similar to those reported in Table 4 using more traditional
estimation methods. Although less justifiable on statistical grounds, according to our different diagnostic
analyses, these procedures are more compatible with the strategies used in earlier research in this area. We
specifically estimated models using the Ordinary Least Squares (OLS), Fixed Effects (FE) and Random Effects
(RE) methods, besides the procedure used by Fama and French (2002), known as the Fama-MacBeth (FM)
estimator. For some regressors, results differed substantially from those reported earlier. Nonetheless, the
positive and significant relationship between OVER and our leverage measures was maintained in all cases,
proving to be robust to considerable variations of the coefficient estimation method. As an illustration, in two
static regressions estimated by OLS, the first with a book leverage indicator and the second with a market
leverage indicator as the dependent variable, the estimated coefficients for OVER were significant at the 1%
level with magnitude close to 0.16 and 0.12, respectively.
5 CONCLUDING REMARKS
In the previous sections, we used different empirical research strategies to examine the hypothesis that the
cognitive biases of overconfidence and optimism significantly influence firms’ financing decisions. Specifically,
behavioral models postulate that firms managed by cognitively biased individuals, in the sense described here,
will choose higher debt proportions, ceteris paribus, as these managers perceive greater benefits and lower
expected costs associated with financial leverage. Based on earlier theoretical and empirical research, we argue
that the biases of optimism and overconfidence should be more pronounced in the group of managers who are
also “entrepreneurs” (that is, they manage their own business), in comparison with the group of hired executives
or “non-entrepreneurs”. We also argue that these biases are likely to influence, to a certain extent, the manager’s
propensity to hold shares of the firm he works for in his personal investments portfolio. These arguments form
the basis for the operational definitions of managerial overconfidence/optimism used in this study, which
presents one of the first tests of the above mentioned hypothesis.
In our empirical analyses we extensively investigated potential endogeneity problems applicable to this
research. Diagnostic tests suggest, for example, that it is important to explicitly model firms’ unobserved
heterogeneity and that the assumption of regressors’ strict exogeneity, shared by traditional panel data regression
methods, such as the Fixed and Random Effect procedures, is probably not realistic. In this context, the
characteristics of our data and the diagnostic results point towards the superiority of the estimation procedures
for short panels based on the Generalized Method of Moments (GMM), in particular of the System GMM
estimator (BLUNDELL; BOND, 1998), which can simultaneously address the different potential endogeneity
problems. For this reason, the results obtained by applying this estimator constitute the basis for inferences in
this study. Nevertheless, different alternative estimation strategies were used in order to examine the stability of
our results and their sensitivity to specific problems, such as the presence of outliers in the sample.
Page 22
22
In static as well as dynamic formulations, the estimated coefficient for OVER (our proxy for managerial
overconfidence/optimism) is positive and generally significant at conventional levels. Moreover, if the dynamics
of leverage is adequately captured by a partial adjustment model towards a target value, like the one shown in
equation (2), the magnitude of the “long-term” impact of OVER on debt ratios is similar to the one estimated in
purely static formulations. These results do not seem to be driven neither by outliers, nor by peculiarities of the
model specification or operational definitions of the variables. Table 7, in particular, shows that our conclusions
are robust to variations in the operational definition of OVER. In fact, when only firm founders are classified as
entrepreneurs, excluding heirs from the sample, the estimated coefficients for OVER are higher and more
significant than those previously obtained, which grants additional support to the identification strategy of the
cognitive biases proposed in this study.
It should also be highlighted that managers classified as overconfident/optimistic are, on average, more
exposed to the idiosyncratic risk of the business they run than other managers because they usually have more
invested wealth in their firm’s shares. It can be argued that such exposition should make them more careful or
conservative, leading them to choose a less levered financing structure. However, the results we found show
exactly the opposite, as firms managed by these individuals are generally more levered, ceteris paribus. This
evidence is compatible with the hypothesis that these managers’ supposed reduced willingness to take risks is
overshadowed by their biased perception of the same risks, motivated by their optimism and overconfidence. In
fact, these cognitive biases may stimulate the individual to expose himself (sometimes exaggeratedly, from a
rational perspective) to the idiosyncratic risks of the business in the first place.
As to the other potential determinants of capital structure, the binary variable ACCUM showed the most
stable and significant results. This indicator tells us whether the same person accumulates the functions of CEO
and chairman. Our results clearly suggest that, keeping other factors constant, leverage ratios tend to be
substantially lower in firms where the same person accumulates both functions, possibly reflecting the influence
of corporate governance standards on their access to external financing instruments, partially captured by this
variable. The estimated coefficients for other indicators related to corporate governance and ownership
concentration were significant in some models, though not with such stability, suggesting that systematic
differences in firms’ governance and ownership structure can be important in explaining observed differences in
their capital structure.
The estimated coefficients for our firm size proxies showed a positive sign in all cases and statistical
significance, at least at the 10% level, in most regressions (particularly in static specifications). These results
suggest that leverage tends to be higher in larger companies, which is coherent with the main capital structure
theories. Similar results are reported, for example, by Rajan and Zingales (1995), Fama and French (2002), and
Gaud et al. (2005). We also found a negative relation between profitability and leverage (especially when we use
market leverage measures). This evidence, compatible with the pecking order theory, is one of the most
frequently reported empirical regularities in this field (see, for example, FAMA; FRENCH, 2002). Finally, in
line with Fama and French (2002) and Frank and Goyal (2004), we found some evidence that dividend-paying
firms are less levered, while, in accordance with Rajan and Zingales (1995), Gaud et al. (2005), and Frank and
Goyal (2004), firms with a higher degree of asset tangibility tend to be more levered. Other potential
determinants of capital structure were found not to be consistently relevant.
Page 23
23
In general, the results of this empirical study suggest that differences in opinion, style and perception of
reality related to managers’ personal traits can significantly impact observed corporate decisions. Moreover, it
seems that some of these influences can be predicted by behavioral theories. In particular, there is evidence that
managerial overconfidence/optimism can be an important determinant of firms’ capital structure.
Page 24
24
REFERENCES
ALICKE, Mark D. et al. Personal contact, individuation, and the better-than-average effect. Journal of
Personality and Social Psychology, v. 68, n. 5, p. 804-25, may 1995.
ALPERT, Marc; RAIFFA, Howard. A progress report on the training of probability assessors (1969). In:
KAHNEMAN, Daniel et al. (Org.). Judgment under uncertainty: heuristics and biases. Cambridge,
England: Cambridge University Press, 1982.
ARABSHEIBANI, Gholamreza et al. And a vision appeared unto them of a great profit: evidence of self-
deception among the self-employed. Economic Letters, v. 67, n. 1, p. 35-41, apr. 2000.
ARELLANO, Manuel. Panel data econometrics. Oxford: Oxford University Press, 2003.
ARELLANO, Manuel; BOND, Stephen R. Some tests of specification for panel data: Monte Carlo evidence and
an application to employment equations. Review of Economic Studies, v. 58, n. 194, p. 277-97, apr. 1991.
BAKER, Malcom et al. Behavioral corporate finance: a survey. NBER Working Paper n. 10863. oct. 2004.
Available at: <http://www.nber.org/papers/w10863>. Access in: 10/22/2004.
BARON, Robert A. Cognitive mechanisms in entrepreneurship: why and when entrepreneurs think differently
than other people. Journal of Business Venturing, v. 13, n. 4, p. 275-94, jul. 1998.
______. Counterfactual thinking and venture formation: the potential effects of thinking about "what might have
been". Journal of Business Venturing, v. 15, n. 1, p. 79-91, jan. 2000a.
______. Psychological perspectives on entrepreneurship: cognitive and social factors in entrepreneurs' success.
Current Directions in Psychological Science, v. 9, n. 1, p. 15-18, feb. 2000b.
BENARTZI, Shlomo. Excessive extrapolation and the allocation of 401(k) accounts to company stock. Journal
of Finance, v. 56, n. 5, p. 1747-64, oct. 2001.
BERNARDO, Antonio E.; WELCH, Ivo. On the evolution of overconfidence and entrepreneurs. Journal of
Economics and Management Strategy, v. 10, n. 3, p. 301-30, Fall 2001.
BLUNDELL, Richard; BOND, Stephen R. Initial conditions and moment restrictions in dynamic panel data
models. Journal of Econometrics, v. 87, n. 1, p. 115-43, nov. 1998.
BLUNDELL, Richard et al. Estimation in dynamic panel data models: improving on the performance of the
standard GMM estimator. In: BALTAGI, Badi H. (Org.). Advances in econometrics: Nonstationary panels,
panel cointegration, and dynamic panels. New York: Elsevier Science, 2000.
BOWSHER, Clive G. On testing overidentifying restrictions in dynamic panel data models. Economic Letters,
v. 77, n. 2, p. 211-20, oct. 2002.
BRENNER, Lyle A. et al. Overconfidence in probability and frequency judgments: a critical examination.
Organizational Behavior and Human Decision Processes, v. 65, n. 3, p. 212-19, mar. 1996.
BRITO, Ricardo D.; LIMA, Monica R. Capital structure choice under weak legal protection: the case of Brazil.
Revista Brasileira de Economia, v. 59, n. 2, p. 177-208, apr./jun. 2005. (only in portuguese)
BUSENITZ, Lowell W.; BARNEY, Jay B. Differences between entrepreneurs and managers in large
organizations: biases and heuristics in strategic decision-making. Journal of Business Venturing, v. 12, n.
1, p. 9-30, jan. 1997.
CAMERER, Colin F.; LOVALLO, Dan. Overconfidence and excess entry: an experimental approach. American
Economic Review, v. 89, n. 1, p. 306-18, mar. 1999.
Page 25
25
COOPER, Arnold C. et al. Entrepreneurs’ perceived chances for success. Journal of Business Venturing, v. 3,
n. 2, p. 97-108, Spring 1988.
CHUNG, Kee, PRUITT. Stephen. A simple approximation of Tobin's Q. Financial Management, v. 23, n. 3, p.
70-74, Autumn, 1994.
DE BONDT, Werner F. M.; THALER, Richard H. Financial decision-making in markets and firms: a behavioral
perspective. In: JARROW, Robert et al. (Org.). Handbooks in operations research and management
science: Finance. Amsterdam: Elsevier, 1995.
DE MEZA, David; SOUTHEY, Clive. The borrower´s curse: optimism, finance and entrepreneurship.
Economic Journal, v. 106, n. 435, p. 375-86, mar. 1996.
EVANS, David S.; LEIGHTON, Linda S. Some empirical aspects of entrepreneurship. American Economic
Review, v. 79, n. 3, p. 519-35, jun. 1989.
FAIRCHILD, Richard J. The effect of managerial overconfidence, asymmetric information, and moral hazard on
capital structure decisions. Working Paper. apr. 2005. Available at: <http://ssrn.com/abstract=71184>.
Access in: 06/25/2005.
FAMA, Eugene F; FRENCH, Kenneth R. Testing trade-off and pecking order predictions about dividends and
debt. Review of Financial Studies, v. 15, n. 1, p. 1-33, Spring 2002.
FINKEL, Steven E. Causal analysis with panel data (Sage University Paper series on Quantitative
Applications in the Social Sciences, 07-105). Thousand Oaks: Sage, 1995.
FISCHHOFF, Baruch et al. Knowing with certainty: the appropriateness of extreme confidence. Journal of
Experimental Psychology: Human Perception and Performance, v. 3, n. 4, p. 552-64, nov. 1977.
FRANK, Murray Z.; GOYAL, Vidhan K. Testing the pecking order theory of capital structure. Journal of
Financial Economics, v. 67, n. 2, p. 217-48, feb. 2003.
______. Capital structure decisions: which factors are reliably important? Working Paper. feb. 2004. Available
at: <http://pacific.commerce.ubc.ca/frank/CapitalStructure.pdf>. Access in: 01/12/2005.
FRENCH, Kenneth R.; POTERBA, James M. Investor diversification and international equity markets.
American Economic Review, v. 81, n. 2, p. 222-6, may 1991.
GAUD, Philippe et al. The capital structure of Swiss companies: an empirical analysis using dynamic panel data.
European Financial Management, v. 11, n. 1, p. 51-69, jan. 2005.
GERVAIS, Simon; ODEAN, Terrance. Learning to be overconfident. Review of Financial Studies, v. 14, n. 1,
p. 1-27, Spring 2001.
GERVAIS, Simon et al. Overconfidence, investment policy, and executive stock options. Rodney L. White
Center for Financial Research Working Paper n. 15-02. jul. 2003. Available at:
<http://ssrn.com/abstract=361200>. Access in: 07/15/2004.
GOEL, Anand M.; THAKOR, Anjan V. Do overconfident managers make better leaders? Working Paper. aug.
2002. Available at: <http://pages.stern.nyu.edu/~agoel/papers/leader.pdf>. Access in: 11/16/2004.
HACKBARTH, Dirk. Managerial traits and capital structure decisions. Working Paper. sep. 2004. Available at:
<http://ssrn.com/abstract=362740>. Access in: 09/15/2004.
HARRIS, Milton; RAVIV, Artur. The theory of capital structure. Journal of Finance, v. 46, n. 1, p. 297-355,
mar. 1991.
Page 26
26
HEATON III, James Breckinridge. Managerial optimism and corporate finance. Financial Management, v. 31,
n. 2, p. 33-45, Summer 2002.
HUBERMAN, Gur. Familiarity breeds investment. Review of Financial Studies, v. 14, n. 3, p. 659-80, Fall
2001.
JENSEN, Michael C. Agency costs of free cash flow, corporate finance and takeover. American Economic
Review, v. 76, n. 2, p. 323-39, may 1986.
KUNDA, Ziva. Motivated inference: self-serving generation and evaluation of causal theories. Journal of
Personality and Social Psychology, v. 53, n. 4, p. 636-47, oct. 1987.
LANDIER, Augustin; THESMAR, David. Financial contracting with optimistic entrepreneurs. Working Paper.
may 2004. Available at: <https://wpweb2k.gsia.cmu.edu/wfa/wfasecure/upload/631588_optimism2.pdf>
Access in: 08/07/2004.
LICHTENSTEIN, Sarah et al. Calibration of probabilities: state of the art to 1980. In: KAHNEMAN, Daniel et
al. (Org.). Judgment under uncertainty: heuristics and biases. Cambridge, England: Cambridge University
Press, 1982.
MALMENDIER, Ulrike; TATE, Geoffrey A. CEO overconfidence and corporate investment. Working Paper.
oct. 2002. Available at: <http://ssrn.com/abstract=354387>. Access in: 07/19/2004.
______. Who makes acquisitions? CEO overconfidence and the market's reaction. Working Paper. mar. 2003.
Available at: <http://ssrn.com/abstract=470788>. Access in: 07/19/2004.
MARCH, James G.; SHAPIRA, Zur. Managerial perspectives on risk and risk taking. Management Science, v.
33, n. 11, p. 1404-18, nov. 1987.
MCCONNELL, John J.; SERVAES, Henri. Equity ownership and the two faces of debt. Journal of Financial
Economics, v. 39, n. 1, p. 131-58, sep. 1995.
MCKENNA, Frank P. It won't happen to me: unrealistic optimism or illusion of control? British Journal of
Psychology, v. 84, n. 1, p. 39-50, feb. 1993.
MILLER, Dale T.; ROSS, Michael. Self-serving biases in attribution of causality: fact or fiction? Psychological
Bulletin, v. 82, n. 2, p. 213-25, mar. 1975.
MYERS, Stewart C. The capital structure puzzle. Journal of Finance, v. 39, n. 3, p. 575-92, jul. 1984.
______. Financing of corporations. In: CONSTANTINIDES, George et al. (Org.). Handbook of the economics
of finance. New York: North-Holland, 2003.
MYERS, Stewart C.; MAJLUF, Nicholas S. Corporate financing and investment decisions when firms have
information that investors do not have. Journal of Financial Economics, v. 13, n. 2, p. 187-221, jun. 1984.
NISBETT, Richard E.; ROSS, Lee. Human inference: strategies and shortcomings of social judgment.
Englewood Cliffs, New Jersey: Prentice-Hall, 1980.
PALICH, Leslie E.; BAGBY, D. Ray. Using cognitive theory to explain entrepreneurial risk-taking: challenging
conventional wisdom. Journal of Business Venturing, v. 10, n. 6, p. 425-38, nov. 1995.
PETERSEN, Mitchell A. Estimating standard errors in finance panel data sets: comparing approaches. Kellogg
Finance Department Working Paper n. 329. jan. 2005. Available at: <http://ssrn.com/abstract=661481>.
Access in: 03/19/2005.
PINFOLD, John F. The expectations of new business founders: the New Zealand case. Journal of Small
Business Management, v. 39, n. 3, p. 279-85, jul. 2001.
Page 27
27
RAJAN, Raghuran G.; ZINGALES, Luigi. What do we know about capital structure? Some evidence from
international data. Journal of Finance, v. 50, n. 5, p. 1421-41, dec. 1995.
RUBINSTEIN, Mark. Rational markets: yes or no? The affirmative case. Financial Analysts Journal, v.
57, n. 3, p. 15-29, may/jun. 2001.
SHYAM-SUNDER, Lakshmi; MYERS, Stewart C. Testing static tradeoff against pecking order models of
capital structure. Journal of Financial Economics, v. 51, n. 2, p. 219-44, feb. 1999.
STULZ, Rene M. Managerial discretion and optimal financing policies. Journal of Financial Economics, v. 26,
n. 1, p. 3-27, jul. 1990.
SVENSON, Ola. Are we all less risky and more skillful than our fellow drivers? Acta Psychologica, v. 47, n. 2,
p. 143-48, feb. 1981.
TAYLOR, Shelter E.; BROWN, Jonathon D. Illusion and well-being: a social psychological perspective on
mental health. Psychological Bulletin, v. 103, n. 2, p. 193-210, mar. 1988.
TITMAN, Sheridan; WESSELS, Roberto. The determinants of capital structure choice. Journal of Finance, v.
43, n. 1, p. 1-19, mar. 1988.
TREYNOR, Jack L.; BLACK, Fisher. Corporate investment decisions. In: MYERS, Stewart C. (Org.). Modern
developments in financial management. New York: Praeger, 1976.
WEINSTEIN, Neil D. Unrealistic optimism about future life events. Journal of Personality and Social
Psychology, v. 39, n. 5, p. 806-20, may 1980.
______. Unrealistic optimism about susceptibility to health problems. Journal of Behavioral Medicine, v. 5, n.
4, p. 441-60, dec. 1982.
WOOLDRIDGE, Jeffrey M. Econometric analysis of cross section and panel data. Cambridge,
Massachusetts: MIT Press, 2002.
ZACHARAKIS, Andrew L.; SHEPHERD, Dean A. The nature of information and overconfidence on venture
capitalists' decision making. Journal of Business Venturing, v. 16, n. 4, p. 311-32, jul. 2001.
Page 28
28
Table 1: Operational definitions of control variables
Code Name of Variable Definition
PBV Price to Book Value Market value of shares divided by their book value
Q Tobin’s Q Estimated with the approximation formula proposed by
Chung and Pruitt (1994):
it it
it
it
MVS D Q
A
+≅
MVS – market value of common and preferred shares; D
– book value of debt, defined as current liabilities plus
long-term debt plus inventories minus current assets; A –
total assets
MVA Market value on assets ratio it it it
it
it
A E MVS MVA
A
− +≡
MVS – market value of common and preferred shares; E
– book equity; A – total book assets
GROW Growth opportunities Cumulative percentage variation of net revenues over the
last three years
dA Asset growth rate Percentage variation of assets between years 1t − and t
EBITDA Profitability based on
EBITDA
Earnings before interest, taxes, depreciation and
amortization divided by total assets
OPA Profitability based on
Operating Income
Operating Income divided by assets
TANG Tangibility Fixed assets (before depreciation) plus inventories
divided by total assets
lnS or lnA Size Natural logarithm of net sales or total assets
UNIQ Uniqueness Selling expenses over net sales
BETA ou SDS Volatility Stock beta using a 60 weeks estimation window (BETA)
or the standard deviation of daily stock returns
throughout the year (SDS)
NDTS Non-debt tax shields Depreciation plus amortization over total assets
PAYOUT Payout ratio Dividends per share divided by net income per share
DIVA Dividends on assets Dividends paid within year divided by total assets
DIV Dividend distribution Dummy variable equal to one if the firm paid dividends
during the year and zero otherwise
CON and TOT
Controlling shareholder’s
concentration of voting rights
and property rights
Percentage of common shares (CON) or percentage of
total shares (TOT) owned by the firm’s controlling
shareholder(s)
TYPE1... TYPE6 Type of controlling
shareholder
Six dummy variables informing whether the controlling
shareholder is national and non-government, state,
foreign, founding family, bank or pension fund
ACCUM Accumulation of CEO and
chairman functions by the
same person
Dummy variable equal to one if the same person
accumulates the functions of CEO and chairman of the
board, and zero otherwise
BS Board Size Number of members of the board
BI Board Independence Number of board members who are not executives of the
firm divided by the total number of board members
ADR Participation in ADR
programs
Dummy variable equal to one if the firm issued ADRs
and zero otherwise
BOV Participation in Bovespa’s
governance levels
Dummy variable equal to one if the firm entered
Bovespa’s Differentiated Corporate Governance Levels
and zero otherwise
IND1... IND17 Industry dummies Seventeen dummy variables, equal to one for firms
belonging to a specific industry and zero for those
belonging to other industries (using the
ECONOMATICA classification, comprising twenty
categories, three of which were not represented in the
sample)
Page 29
29
YEAR(1)...(6) Year dummies Dummy variables ( )YEAR t defined as ( ) 1YEAR t = in
the t − th year and ( ) 0YEAR t = otherwise, with
1,...,6t = (1998 to 2003)
Table 2: Descriptive statistics
Variable Mean Standard
Deviation
1st Quartile Mean 3rd Quartile
LEV. - D/A 0.359 0.342 0.184 0.308 0.453
LEV. - D/(MVS+A – E) 0.323 0.206 0.174 0.317 0.460
LEV. - LTD/A 0.200 0.228 0.053 0.156 0.273
LEV. - LTD/(MVS+A – E) 0.174 0.140 0.058 0.152 0.263
Price to Book Value - PBV 1.063 1.455 0.372 0.659 1.240
Tobin’s Q 0.680 0.431 0.411 0.623 0.833
Market value/assets - MVA 1.0 0.639 0.753 0.910 1.066
Growth opportunities - GROW 0.004 0.607 -0.030 0.072 0.172
Asset growth rate - dA 0.008 0.229 -0.074 0.008 0.100
Profitability - EBITDA 0.149 0.118 0.080 0.136 0.207
Profitability - OPA 0.094 0.105 0.041 0.085 0.140
Tangibility - TANG 1.051 0.510 0.758 0.988 1.239
Size (Sales) - lnS 5.934 0.693 5.537 5.982 6.384
Size (Assets) - lnA 14.117 1.644 13.209 14.105 15.106
Uniqueness - UNIQ 0.089 0.077 0.028 0.077 0.134
Volatility - BETA 0.533 0.418 0.242 0.477 0.772
Volatility - SDS 0.767 0.568 0.452 0.610 0.821
Non-debt tax shields - NDTS 0.046 0.031 0.027 0.038 0.056
Dividends - PAYOUT 83.485 1064.961 0 27.733 50.380
Dividends - DIVA 0.020 0.036 0 0.012 0.027
Dividends - DIV 0.723 0.448 0 1.0 1.0
Governance - CON 0.742 0.201 0.573 0.766 0.928
Governance - TOT 0.508 0.234 0.316 0.491 0.683
Governance - BS 7.150 3.100 5.0 7.0 9.0
Governance - BI 0.822 0.153 0.714 0.833 1.0
Page 30
30
Table 3: Determinants of capital structure: regressions using the System GMM method with dynamic models
Book leverage Market leverage
Regressors GMM-Sys Transf. Coeff. GMM-Sys Transf. coeff.
LEVt-1 0.6614*** (0.076) 0.8041*** (0.044)
OVER 0.0521*** (0.018) 0.1538 0.0250** (0.011) 0.1278
PBV -0.0016 (0.005) -0.0048 -0.0031 (0.003) -0.0156
Growth opportunities 0.0085 (0.010) 0.0250 0.0032 (0.007) 0.0164
Profitability -0.1961* (0.115) -0.5792 -0.2133** (0.085) -1.0885
Volatility 0.0237 (0.023) 0.0699 0.0448*** (0.017) 0.2288
Non-debt tax shields -0.6282 (0.500) -1.8551 -0.3361 (0.339) -1.7154
Tangibility 0.0812** (0.032) 0.2398 0.0513*** (0.019) 0.2617
Size 0.0320* (0.018) 0.0944 0.0052 (0.013) 0.0267
Uniqueness 0.0026 (0.128) 0.0076 0.0302 (0.090) 0.1542
Dividends -0.0465 (0.043) -0.1372 -0.0107 (0.027) -0.0544
CON -0.1216* (0.069) -0.3590 -0.0563 (0.045) -0.2872
ACCUM -0.0718*** (0.016) -0.2121 -0.0354*** (0.012) -0.1807
ADR -0.0111 (0.030) -0.0327 -0.0074 (0.017) -0.0379
BOV 0.0271 (0.019) 0.0802 0.0092 (0.011) 0.0471
Year dummies YES - YES -
Number of obs. 452 456
Hansen’s J 95.03 (91; 0.366) 101.96 (91; 0.203)
m1 -3.19 (0.001) -3.94 (0.000)
m2 0.00 (0.998) -0.39 (0.697)
The dependent variable of the regression reported in column 2 is book leverage, defined as total debt (D) divided
by total book assets (A). The regression reported in column 4 uses market leverage as the dependent variable,
defined as D/(MVS+A – E), where MVS is the market value of shares and E the book value of the firm’s equity
(see Section 3.5.2).
The regressors are: the first lag of the response variable (1t
LEV−), OVER (see definition in Section 3.5.1, third
paragraph), PBV (Price to Book Value), GROW (future growth opportunities), EBITDA (profitability), BETA
(volatility), NDTS (non-debt tax shields), TANG (tangibility), lnS (size), UNIQ (uniqueness), DIV (dividends),
CON (concentration of voting rights), ACCUM (accumulation of CEO and chairman functions), ADR
(participation in ADR programs), BOV (participation in Bovespa’s governance levels) and a set of year dummy
variables. The operational definitions are listed in Table 1.
The one-step GMM-Sys estimator was employed, applying the first-difference (FD) transformation to the
variables. We used a set of instruments that includes one-period first-differenced lagged values and appropriate
lags beginning in 2t − of LEV and of the regressors PBV, EBITDA, NDTS, BETA, DIV and CON. In this
specification we assume that the remaining regressors are strictly exogenous.
Coefficient standard errors are in parentheses. ***, ** and * indicate the statistical significance of the estimate at
the 1%, 5% and 10% levels, respectively. All standard errors were computed using data clustered by firm and are
robust to arbitrary forms of heteroscedasticity and autocorrelation of the model’s error terms. Columns 3 and 5
show the transformed coefficients obtained by dividing the original estimates by ˆ1 α− , where α̂ is the
estimated coefficient for 1t
LEV−.
Hansen’s J test is a robust version (to arbitrary forms of autocorrelation and heteroscedasticity of the error) of the
better known Sargan test of overidentifying restrictions. m1 and m2 refer to the first and second-order
autocorrelation tests, respectively, applied to the first-differenced residuals, proposed by Arellano and Bond
(1991). For Hansen’s test we report the test statistic and, in parentheses, its degrees of freedom and p-value,
respectively. For m1 and m2, we report the test statistic and, in parentheses, its p-value.
Page 31
31
Table 4: Determinants of capital structure using the System GMM method with static models
Book leverage Market leverage
Regressors GMM-Sys GMM-Sys
OVER 0.1327*** (0.041) 0.0932*** (0.029)
PBV 0.0087 (0.010) -0.0130** (0.006)
Growth opportunities 0.0143* (0.008) 0.0051 (0.005)
Profitability -0.1042 (0.249) -0.4131** (0.173)
Volatility 0.0484 (0.041) 0.0308 (0.036)
Non-debt tax shields 0.5369 (0.773) 0.2365 (0.655)
Tangibility 0.0493 (0.052) 0.0431 (0.031)
Size 0.1089*** (0.031) 0.0684** (0.028)
Uniqueness -0.3564* (0.215) -0.3194 (0.205)
Dividends -0.1118** (0.056) -0.0655 (0.050)
CON -0.2597 (0.157) -0.1668 (0.145)
ACCUM -0.1396*** (0.032) -0.1201*** (0.026)
ADR -0.1166** (0.048) -0.0899** (0.044)
BOV 0.0575 (0.042) 0.0577 (0.040)
Year dummies YES YES
Number of obs. 524 526
Hansen’s J 81.97 (78; 0.357) 80.31 (78; 0.406)
m1 -2.32 (0.020) -1.89 (0.058)
m2 -1.99 (0.047) -1.45 (0.148)
The dependent variable of the regression reported in column 2 is book leverage, defined as total debt (D) divided
by total book assets (A). The regression reported in column 3 uses market leverage as the dependent variable,
defined as D/(MVS+A – E), where MVS is the market value of shares and E the book value of the firm’s equity
(see Section 3.5.2).
The regressors are: OVER (see definition in Section 3.5.1, third paragraph), PBV (Price to Book Value), GROW
(future growth opportunities), EBITDA (profitability), BETA (volatility), NDTS (non-debt tax shields), TANG
(tangibility), lnS (size), UNIQ (uniqueness), DIV (dividends), CON (concentration of voting rights), ACCUM
(accumulation of CEO and chairman functions), ADR (participation in ADR programs), BOV (participation in
Bovespa’s governance levels) and a set of year dummy variables. The operational definitions are in Table 1.
The one-step GMM-Sys estimator was employed, applying the first-difference (FD) transformation to the
variables. We used a set of instruments that includes one-period first-differenced lagged values and appropriate
lags beginning in 2t − of the regressors PBV, EBITDA, NDTS, BETA, DIV and CON. In this specification we
assume that the remaining regressors are strictly exogenous.
Coefficient standard errors are in parentheses. ***, ** and * indicate the statistical significance of the estimate at
the 1%, 5% and 10% levels, respectively. All standard errors were computed using data clustered by firm and are
robust to arbitrary forms of heteroscedasticity and autocorrelation of the model’s error terms.
Hansen’s J test is a robust version (to arbitrary forms of autocorrelation and heteroscedasticity of the error) of the
better known Sargan test of overidentifying restrictions. m1 and m2 refer to the first and second-order
autocorrelation tests, respectively, applied to the first-differenced residuals, proposed by Arellano and Bond
(1991). For Hansen’s test we report the test statistic and, in parentheses, its degrees of freedom and p-value,
respectively. For m1 and m2, we report the test statistic and, in parentheses, its p-value.
Page 32
32
Table 5: Determinants of capital structure using the System GMM method with static models (alternative
specification, allowing all regressors to be endogenous)
Accounting leverage Market leverage
Regressors GMM-Sys GMM-Sys
OVER 0.1849** (0.094) 0.1297** (0.067)
PBV 0.0011 (0.012) -0.0201** (0.009)
Growth opportunities 0.0179 (0.025) 0.0014 (0.021)
Profitability -0.2269 (0.246) -0.4087** (0.211)
Volatility 0.0139 (0.051) -0.0053 (0.045)
Non-debt tax shields 0.6013 (0.787) 0.5311 (0.839)
Tangibility 0.0619 (0.077) 0.0497 (0.053)
Size 0.1181** (0.060) 0.1039** (0.050)
Uniqueness 0.5045 (0.483) 0.5238 (0.413)
Dividends -0.1237* (0.075) -0.1027* (0.054)
CON -0.1522 (0.167) 0.0395 (0.125)
ACCUM -0.1518*** (0.056) -0.1561*** (0.047)
ADR -0.1844** (0.085) -0.1613** (0.076)
BOV 0.0309 (0.091) 0.0260 (0.069)
Year dummies YES YES
Number of obs. 524 526
Hansen’s J 99.60 (100; 0.429) 107.29 (100; 0.291)
m1 -2.34 (0.019) -2.35 (0.019)
m2 -1.73 (0.083) -0.99 (0.321)
The dependent variable of the regression reported in column 2 is book leverage, defined as total debt (D) divided
by total book assets (A). The regression reported in column 3 uses market leverage as the dependent variable,
defined as D/(MVS+A – E), where MVS is the market value of shares and E the book value of the firm’s equity
(see Section 3.5.2).
The regressors are: OVER (see definition in Section 3.5.1, third paragraph), PBV (Price to Book Value), GROW
(future growth opportunities), EBITDA (profitability), BETA (volatility), NDTS (non-debt tax shields), TANG
(tangibility), lnS (size), UNIQ (uniqueness), DIV (dividends), CON (concentration of voting rights), ACCUM
(accumulation of CEO and chairman functions), ADR (participation in ADR programs), BOV (participation in
Bovespa’s governance levels) and a set of year dummy variables. The operational definitions are in Table 1.
The one-step GMM-Sys estimator was employed, applying the first-difference (FD) transformation to the
variables. We assume that the model’s error term follows a first-order moving average process (MA(1)) and,
therefore, is first-order autocorrelated. We used a set of instruments that includes two-period first-differenced
lagged values and appropriate lags beginning in 3t − of all regressors, except for the year dummy variables,
treated as strictly exogenous.
Coefficient standard errors are in parentheses. ***, ** and * indicate the statistical significance of the estimate at
the 1%, 5% and 10% levels, respectively. All standard errors were computed using data clustered by firm and are
robust to arbitrary forms of heteroscedasticity and autocorrelation of the model’s error terms.
Hansen’s J test is a robust version (to arbitrary forms of autocorrelation and heteroscedasticity of the error) of the
better known Sargan test of overidentifying restrictions. m1 and m2 refer to the first and second-order
autocorrelation tests, respectively, applied to the first-differenced residuals, proposed by Arellano and Bond
(1991). For Hansen’s test we report the test statistic and, in parentheses, its degrees of freedom and p-value,
respectively. For m1 and m2, we report the test statistic and, in parentheses, its p-value.
Page 33
33
Table 6: Proxies for OVER
Variable OVER = 1 OVER = 0
1OVER
If the CEO or chairman is the founder or heir of the
firm Otherwise
2OVER If the CEO or chairman is the founder of the firm
If neither the CEO nor the chairman is the
founder or heir of the firm
3OVER If the CEO is the founder or heir of the firm
If neither the CEO nor the chairman is the
founder or heir of the firm
4OVER If the chairman is the founder or heir of the firm
If neither the CEO nor the chairman is the
founder or heir of the firm
5OVER
If the CEO or chairman holds more than 50% of the
firm’s common shares Otherwise
6OVER
If the CEO or chairman has an “invested wealth” in his
firm higher than the sample median Otherwise
Table 7: Estimated coefficient for OVER with different operational definitions
Book leverage Market leverage
Regressors GMM-Sys (Static) GMM-Sys
(Dynamic) GMM-Sys (Static)
GMM-Sys
(Dynamic)
1OVER 0.1327*** (0.041) 0.0521*** (0.018) 0.0932*** (0.029) 0.0250** (0.011)
2OVER 0.1345** (0.056) 0.0649*** (0.023) 0.1062*** (0.037) 0.0391** (0.016)
3OVER 0.1032** (0.046) 0.0473** (0.021) 0.1084*** (0.038) 0.0302** (0.015)
4OVER 0.1345*** (0.040) 0.0547*** (0.018) 0.0939*** (0.029) 0.0283** (0.011)
5OVER 0.0623* (0.036) 0.0363** (0.015) 0.0506 (0.034) 0.0203** (0.010)
6OVER 0.1259*** (0.039) 0.0561*** (0.019) 0.0799*** (0.029) 0.0322*** (0.013)
The dependent variable of the regressions reported in columns 2 and 3 is book leverage, defined as total debt (D)
divided by total book assets (A). The regressions reported in columns 4 and 5 use market leverage as the
dependent variable, defined as D/(MVS+A – E), where MVS is the market value of shares and E the book value
of the firm’s equity (see Section 3.5.2).
Each line in the table shows the estimated coefficients for OVER and their standard errors in different
regressions, using the same set of control variables. The operational definitions of 1 2 6, ,...,OVER OVER OVER are
listed in Table 6.
The one-step GMM-Sys estimator was employed, applying the first-difference (FD) transformation to the
variables. In columns 2 and 4, the specifications are static and identical to those reported in Table 4. In columns
3 and 5, the regressions are based on dynamic models, with the same specifications reported in Table 3.
For the static models, the control variables are: PBV (Price to Book Value), GROW (future growth
opportunities), EBITDA (profitability), BETA (volatility), NDTS (non-debt tax shields), TANG (tangibility), lnS
(size), UNIQ (uniqueness), DIV (dividends), CON (concentration of voting rights), ACCUM (accumulation of
CEO and chairman functions), ADR (participation in ADR programs), BOV (participation in Bovespa’s
governance levels) and a set of year dummy variables. The operational definitions are in Table 1. In the dynamic
specifications, the first lag of the dependent variable (1t
LEV−) is included as a regressor.
Coefficient standard errors are in parentheses. ***, ** and * indicate the statistical significance of the estimate at
the 1%, 5% and 10% levels, respectively. All standard errors were computed using data clustered by firm and are
robust to arbitrary forms of heteroscedasticity and autocorrelation of the model’s error terms.