SEPTEMBER 2015 DSHS Research and Data Analysis Division Olympia, Washington RDA REPORT 4.92 PAGE 1 Overdose Deaths among Medicaid Enrollees in Washington State The Role of Behavioral Health Needs Jingping Xing, PhD David Mancuso, PhD Barbara E.M. Felver, MES, MPA EATHS FROM DRUG OVERDOSE have been the leading cause of injury death in the United States (1). Overdose deaths have risen over the past two decades, primarily driven by increased use of opioid analgesic prescription drugs. From 1999 through 2012, the age- adjusted rates for drug-poisoning deaths involving opioid analgesics more than tripled, from 1.4 per 100,000 in 1999 to 5.1 in 2012 (2). In addition, drug overdoses disproportionately impact Medicaid enrollees, with Medicaid enrollees about six times more likely than the general population to have a fatal overdose involving opioid analgesics (3). In Washington State, poisoning is the leading cause of unintentional injury-related death, with over 90 percent of poisoning deaths due to drug overdoses. The most common substance connected to these overdoses is opioid analgesics (4). Drug misuse or abuse not only leads to drug addiction and overdose deaths, but also increases costs for all health care payers including Medicaid. The Substance Abuse and Mental Health Services Administration estimated that for every unintentional overdose death related to an opioid analgesic, there are 35 visits to emergency departments, 161 reports of drug abuse or dependence, and 461 reports of nonmedical uses of opioid analgesics (5-7). This policy brief reviews the incidence and scope of drug overdose deaths in Washington State during the 2006 to 2012 time period, and identifies the Medicaid populations at greatest risk of overdose. Medicaid covers many individuals who have mental illness and/or substance use disorders, which are each risk factors associated with higher rates of opioid analgesic misuse and overdose death. Mental illness and substance use disorders often occur together and having one condition can make the treatment of the other more difficult. Findings from this study provide useful context for assessing recent overdose prevention efforts and provide a framework for behavioral health system quality measures focused on reducing overdoses. Key Findings • In Washington State, the most common drugs involved in overdose deaths were opioid analgesics. During the 2006 to 2012 period, there were 6,295 deaths due to drug overdose in Washington State; 3,541 deaths (56 percent) involved opioid analgesics (see Table 1, page 3). D
Transcript
SEPTEMBER 2015
DSHS Research and Data Analysis Division Olympia, Washington RDA REPORT 4.92
PAG
E 1
Overdose Deaths among Medicaid Enrollees in Washington State The Role of Behavioral Health Needs
Jingping Xing, PhD David Mancuso, PhD Barbara E.M. Felver, MES, MPA
EATHS FROM DRUG OVERDOSE have been the leading cause of injury death in the United States (1). Overdose deaths have risen over the past two decades, primarily driven by increased use of opioid analgesic prescription drugs. From 1999 through 2012, the age-
adjusted rates for drug-poisoning deaths involving opioid analgesics more than tripled, from 1.4 per 100,000 in 1999 to 5.1 in 2012 (2). In addition, drug overdoses disproportionately impact Medicaid enrollees, with Medicaid enrollees about six times more likely than the general population to have a fatal overdose involving opioid analgesics (3).
In Washington State, poisoning is the leading cause of unintentional injury-related death, with over 90 percent of poisoning deaths due to drug overdoses. The most
common substance connected to these overdoses is opioid analgesics (4).
Drug misuse or abuse not only leads to drug addiction and overdose deaths, but also increases costs for all health care payers including Medicaid. The Substance Abuse and Mental Health Services Administration estimated that for every unintentional overdose death related to an opioid analgesic, there are 35 visits to emergency departments, 161 reports of drug abuse or dependence, and 461 reports of nonmedical uses of opioid analgesics (5-7).
This policy brief reviews the incidence and scope of drug overdose deaths in Washington State during the 2006 to 2012 time period, and identifies the Medicaid populations at greatest risk of overdose. Medicaid covers many individuals who have mental illness and/or substance use disorders, which are each risk factors associated with higher rates of opioid analgesic misuse and overdose death. Mental illness and substance use disorders often occur together and having one condition can make the treatment of the other more difficult. Findings from this study provide useful context for assessing recent overdose prevention efforts and provide a framework for behavioral health system quality measures focused on reducing overdoses.
Key Findings • In Washington State, the most common drugs involved in overdose deaths were opioid
analgesics. During the 2006 to 2012 period, there were 6,295 deaths due to drug overdose in Washington State; 3,541 deaths (56 percent) involved opioid analgesics (see Table 1, page 3).
D
PAG
E 2
Overdose Deaths among Medicaid Enrollees in Washington State The Role of Behavioral Health Needs DSHS
• Medicaid enrollees are at high risk for drug-poisoning deaths. Among all persons who died from drug overdose in the 2006 to 2012 time period, 2,211 (35 percent) were enrolled in Medicaid at some point in the 12 months before death. The opioid analgesic overdose death rate for Medicaid enrollees was more than 4 times as high as that for the general state population. With the implementation of expanded adult Medicaid coverage under the Affordable Care Act in January 2014, Medicaid enrollees are likely to account for a significantly higher proportion of overdose deaths than in the time period analyzed in this report.
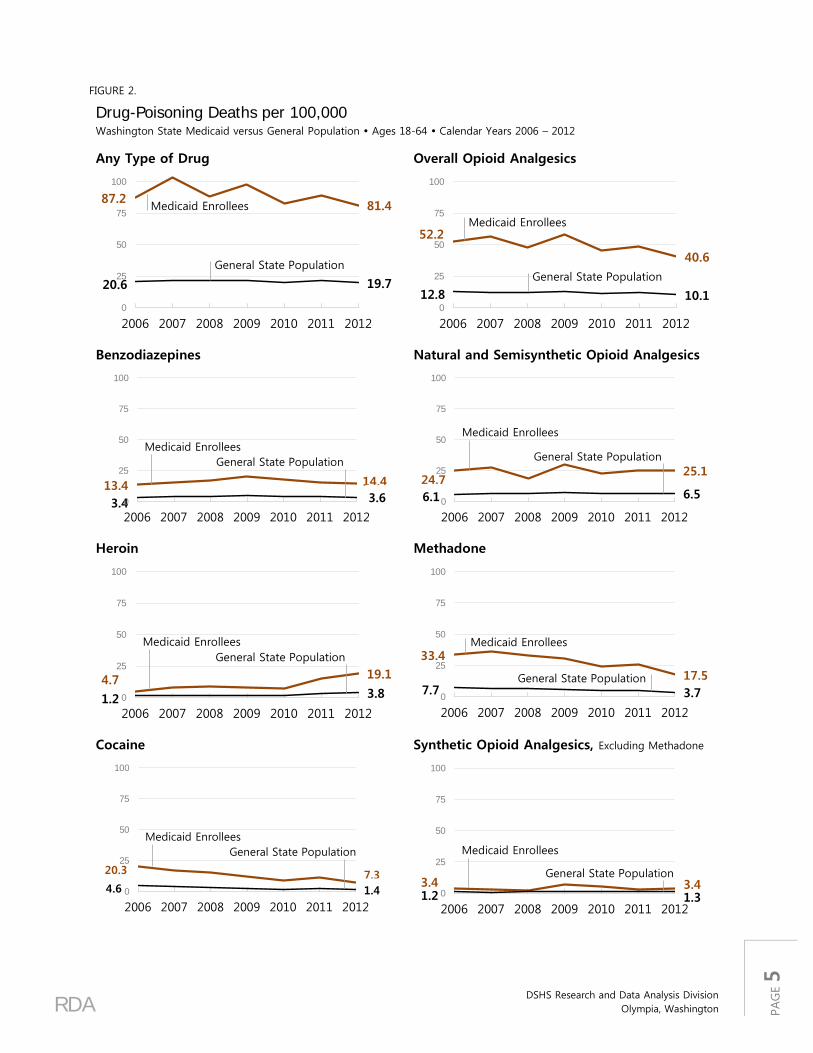
• While the death rate from prescription opiate overdoses declined over the study period, the death rate from heroin more than doubled from 2010 to 2012 (see Figure 2, page 5).
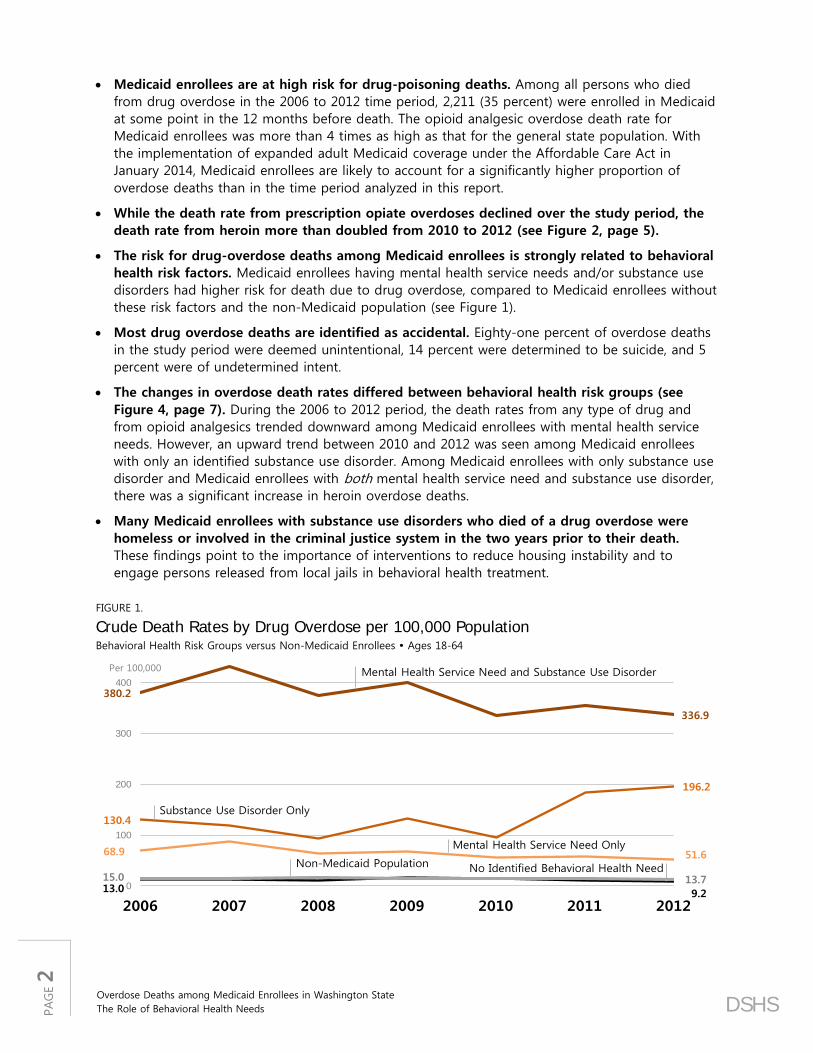
• The risk for drug-overdose deaths among Medicaid enrollees is strongly related to behavioral health risk factors. Medicaid enrollees having mental health service needs and/or substance use disorders had higher risk for death due to drug overdose, compared to Medicaid enrollees without these risk factors and the non-Medicaid population (see Figure 1).
• Most drug overdose deaths are identified as accidental. Eighty-one percent of overdose deaths in the study period were deemed unintentional, 14 percent were determined to be suicide, and 5 percent were of undetermined intent.
• The changes in overdose death rates differed between behavioral health risk groups (see Figure 4, page 7). During the 2006 to 2012 period, the death rates from any type of drug and from opioid analgesics trended downward among Medicaid enrollees with mental health service needs. However, an upward trend between 2010 and 2012 was seen among Medicaid enrollees with only an identified substance use disorder. Among Medicaid enrollees with only substance use disorder and Medicaid enrollees with both mental health service need and substance use disorder, there was a significant increase in heroin overdose deaths.
• Many Medicaid enrollees with substance use disorders who died of a drug overdose were homeless or involved in the criminal justice system in the two years prior to their death. These findings point to the importance of interventions to reduce housing instability and to engage persons released from local jails in behavioral health treatment.
FIGURE 1.
Crude Death Rates by Drug Overdose per 100,000 Population Behavioral Health Risk Groups versus Non-Medicaid Enrollees Ages 18-64
380.2
336.9
130.4
196.2
68.9 51.6
13.0 9.2
15.0 13.70
100
200
300
400
2006 2007 2008 2009 2010 2011 2012
Mental Health Service Need and Substance Use Disorder
Substance Use Disorder Only
Mental Health Service Need Only
Non-Medicaid Population No Identified Behavioral Health Need
Per 100,000
RDA
DSHS Research and Data Analysis Division
Olympia, Washington
PAG
E 3
Annual Trends in Overdose Deaths Table 1 reports the number of overdose deaths associated with different drugs in the Washington State population aged 18-64. The average overdose death was associated with 2.5 different drug types, and deaths associated with multiple drugs are counted within each drug type. Over the 2006 to 2012 period, there were 6,295 deaths due to drug overdose in Washington State, with 56 percent (3,541 deaths) of these deaths involving opioid analgesics. Methadone, used to treat opioid dependence and chronic pain, was involved in 28 percent of deaths. Thirty-one percent of overdose deaths involved other natural or semisynthetic opioid analgesics. Mortality involving opioid analgesics exceeded the combined mortality associated with illegal drugs such as cocaine and heroin. Cocaine was involved in 13 percent and heroin was reported in 10 percent of overdose deaths. Benzodiazepines, a class of drugs that depresses the central nervous system and are prescribed for their sedative-hypnotic and anti-anxiety effects, were involved in 19 percent of overdose deaths.
TABLE 1.
Washington State Overdose Deaths, Adults Ages 18-64 By Selected Contributing Cause of Death*
YEAR OF DEATH ALL YEARS DRUG 2006 2007 2008 2009 2010 2011 2012 TOTAL % DEATHS
INVOLVING DRUG ALL DRUG CLASSES T36-T50.9 851 911 927 934 878 939 855 6,295
Cocaine T40.5 190 160 124 113 76 92 59 814 12.9% Other and unspecified narcotics*** T40.6
136 163 139 122 69 130 92 851 13.5%
* Deaths associated with multiple drug classes are counted in every identified drug class. Therefore, the count of deaths by detailed drug class will exceed the total overdose death count.
** The subcategories listed do not represent the full range of agents included in this code category. *** This category is intended for other and unspecified drugs classified pharmacologically as narcotics (opioids/opiates). However, in
practice it may also be used for drugs classified legally as narcotics such as cocaine. The proportion of this category made up by opioids/opiates varies by jurisdiction, so inclusion of this code in any compilation of opioid deaths depends on more detailed analysis of death certificate text and/or medical examiner/coroner records in the jurisdiction.
PAG
E 4
Overdose Deaths among Medicaid Enrollees in Washington State The Role of Behavioral Health Needs DSHS
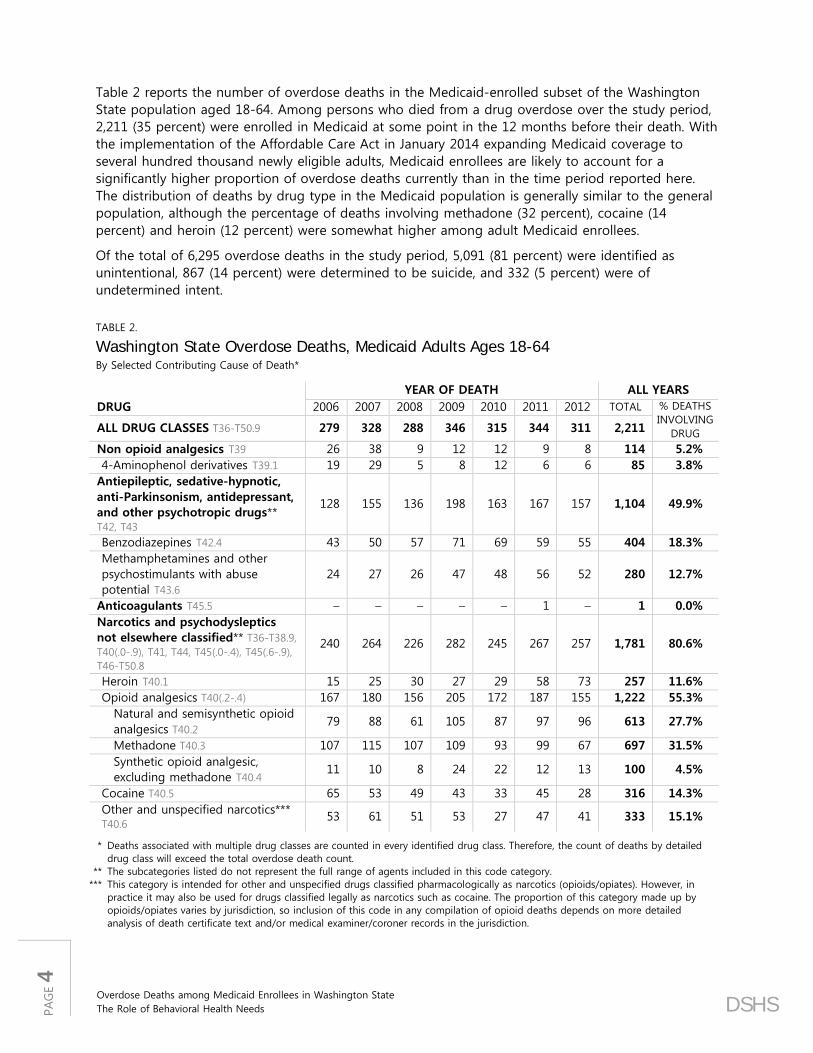
Table 2 reports the number of overdose deaths in the Medicaid-enrolled subset of the Washington State population aged 18-64. Among persons who died from a drug overdose over the study period, 2,211 (35 percent) were enrolled in Medicaid at some point in the 12 months before their death. With the implementation of the Affordable Care Act in January 2014 expanding Medicaid coverage to several hundred thousand newly eligible adults, Medicaid enrollees are likely to account for a significantly higher proportion of overdose deaths currently than in the time period reported here. The distribution of deaths by drug type in the Medicaid population is generally similar to the general population, although the percentage of deaths involving methadone (32 percent), cocaine (14 percent) and heroin (12 percent) were somewhat higher among adult Medicaid enrollees.
Of the total of 6,295 overdose deaths in the study period, 5,091 (81 percent) were identified as unintentional, 867 (14 percent) were determined to be suicide, and 332 (5 percent) were of undetermined intent.
TABLE 2.
Washington State Overdose Deaths, Medicaid Adults Ages 18-64 By Selected Contributing Cause of Death*
YEAR OF DEATH ALL YEARS DRUG 2006 2007 2008 2009 2010 2011 2012 TOTAL % DEATHS
INVOLVING DRUG ALL DRUG CLASSES T36-T50.9 279 328 288 346 315 344 311 2,211
Cocaine T40.5 65 53 49 43 33 45 28 316 14.3% Other and unspecified narcotics*** T40.6
53 61 51 53 27 47 41 333 15.1%
* Deaths associated with multiple drug classes are counted in every identified drug class. Therefore, the count of deaths by detailed drug class will exceed the total overdose death count.
** The subcategories listed do not represent the full range of agents included in this code category. *** This category is intended for other and unspecified drugs classified pharmacologically as narcotics (opioids/opiates). However, in
practice it may also be used for drugs classified legally as narcotics such as cocaine. The proportion of this category made up by opioids/opiates varies by jurisdiction, so inclusion of this code in any compilation of opioid deaths depends on more detailed analysis of death certificate text and/or medical examiner/coroner records in the jurisdiction.
RDA
DSHS Research and Data Analysis Division
Olympia, Washington
PAG
E 5
FIGURE 2.
Drug-Poisoning Deaths per 100,000 Washington State Medicaid versus General Population Ages 18-64 Calendar Years 2006 – 2012
Any Type of Drug
87.2 81.4
20.6 19.7
0
25
50
75
100
2006 2007 2008 2009 2010 2011 2012
Medicaid Enrollees
General State Population
Overall Opioid Analgesics
52.2
40.6
12.8 10.10
25
50
75
100
2006 2007 2008 2009 2010 2011 2012
Medicaid Enrollees
General State Population
Benzodiazepines
13.4 14.4
3.4 3.60
25
50
75
100
2006 2007 2008 2009 2010 2011 2012
Medicaid EnrolleesGeneral State Population
Natural and Semisynthetic Opioid Analgesics
24.725.1
6.1 6.50
25
50
75
100
2006 2007 2008 2009 2010 2011 2012
Medicaid Enrollees
General State Population
Heroin
4.7 19.1
1.2 3.80
25
50
75
100
2006 2007 2008 2009 2010 2011 2012
Medicaid EnrolleesGeneral State Population
Methadone
33.4
17.57.7 3.70
25
50
75
100
2006 2007 2008 2009 2010 2011 2012
Medicaid Enrollees
General State Population
Cocaine
20.3 7.34.6 1.40
25
50
75
100
2006 2007 2008 2009 2010 2011 2012
Medicaid EnrolleesGeneral State Population
Synthetic Opioid Analgesics, Excluding Methadone
3.4 3.41.2 1.30
25
50
75
100
2006 2007 2008 2009 2010 2011 2012
Medicaid Enrollees
General State Population
PAG
E 6
Overdose Deaths among Medicaid Enrollees in Washington State The Role of Behavioral Health Needs DSHS
Figure 2 shows the relative trends in death rates for selected drug types for Medicaid adults age 18-64, compared to the general population. Key findings include:
• The rate of drug overdose death among Medicaid enrollees is about 4 times the rate in the general population.
• The rate of drug overdose death generally declined over the study period.
• The decline in the overall overdose death rate masks significant variation in trends in specific drug types. While methadone and cocaine related overdose death rates showed significant declines over the study period, the heroin death rate spiked from 2010 to 2012.
Behavioral Health Risk Factors and Overdose Deaths
In 2012, about 9 percent of the Washington State population aged 18 to 64 were enrolled in Medicaid and not dually eligible for Medicare (Figure 3). Among these 382,196 Medicaid enrollees, nearly half (47 percent) were identified as having a mental health service need and 21 percent were identified as having a substance use disorder based on risk factors observed in health care encounters and other available administrative data. The analyses that follow subset the age 18-64 Medicaid population into four mutually exclusive subgroups: (1) those with a mental health service need but no identified substance use disorder; (2) those with a substance use disorder but no identified mental health service need; (3) those with co-occurring mental health service needs and a substance use disorder; and (4) the balance of the Medicaid population who had no identified behavioral health need.
FIGURE 3.
Distribution of Adult Medicaid Enrollees by Behavioral Health Needs Washington State General Population and Medicaid Enrollees Ages 18-64 Calendar Year 2012
Non Dual Medicaid Adults
9%382,196
2012 Washington State Adult PopulationAges 18–64TOTAL = 4.4 million
Substance Use Disorder Only
6%21,913
Mental Health Service Need
Only
32%120,248
CO-OCCURRINGMental Health
Service Need and Substance Use
Disorder
15%56,099
No Identified Behavioral Health Need
48%183,936
AD
ULT
MED
ICAID
EN
RO
LLEE
S
RDA
DSHS Research and Data Analysis Division
Olympia, Washington
PAG
E 7
The risk of drug overdose among Medicaid enrollees is driven by behavioral health risk factors (Figure 4). Medicaid enrollees without mental health needs or substance use disorders have low overdose death rates (9.2 deaths per 100,000 in CY 2012). In comparison, the overdose death rate for Medicaid enrollees with co-occurring mental health needs and substance use disorders was 17 times the general population rate in CY 2012 (336.9 deaths per 100,000 for Medicaid enrollees with co-occurring disorders, compared to 19.7 deaths per 100,000 in the general population). Over the study period, overall and opiate-related overdose death rates trended downward among Medicaid enrollees with mental health service needs (including persons with co-occurring disorders). However, an upward trend is seen among the “substance use disorder only” group between 2010 and 2012, driven by increases in deaths associated with heroin and natural and semisynthetic opioid analgesics (Figure 5).
FIGURE 4.
Overdose Deaths per 100,000, by Behavioral Health Risk Washington State Adult Medicaid Enrollees Ages 18-64
0
100
200
300
400
2006
2007
2008
2009
2010
2011
2012
0
100
200
300
400
2006
2007
2008
2009
2010
2011
2012
0
100
200
300
400
2006
2007
2008
2009
2010
2011
2012
0
100
200
300
400
2006
2007
2008
2009
2010
2011
2012
per 100,000
NO IDENTIFIED BEHAVIORAL HEALTH NEED
MENTAL HEALTH SERVICE NEED ONLY
SUBSTANCE USE DISORDER ONLY
MENTAL HEALTH SERVICE NEED AND SUBSTANCE
USE DISORDER
Any Type of DrugOpioid AnalgesicsBenzodiazepinesHeroinCocaine
FIGURE 5.
Opiate Overdose Deaths per 100,000 Population, by Behavioral Health Needs Washington State Adult Medicaid Enrollees Ages 18-64
0
100
200
300
2006
2007
2008
2009
2010
2011
2012
0
100
200
300
2006
2007
2008
2009
2010
2011
2012
0
100
200
300
2006
2007
2008
2009
2010
2011
2012
0
100
200
300
2006
2007
2008
2009
2010
2011
2012
per 100,000Opioid AnalgesicsNatural and Semisynthetic Opioid Analgesic MethadoneSynthetic Opioid Analgesic, Excluding Methadone
MENTAL HEALTH SERVICE NEED ONLY
SUBSTANCE USE DISORDER ONLY
MENTAL HEALTH SERVICE NEED AND SUBSTANCE
USE DISORDER
NO IDENTIFIED BEHAVIORAL HEALTH NEED
PAG
E 8
Overdose Deaths among Medicaid Enrollees in Washington State The Role of Behavioral Health Needs DSHS
Figure 6 compares overdose death rates for Medicaid enrollees age 18-64 relative to the balance of the age 18-64 population in Washington State. Key findings include:
• Medicaid enrollees without mental health service needs or substance use disorders have lower overdose death rates than the non-Medicaid population (9.2 deaths per 100,000, compared to 13.7 deaths per 100,000 in the non-Medicaid population).
• Medicaid enrollees with substance use disorders had significantly higher drug-overdose death rates, compared with other groups.
• Age-adjusted methods produced similar trends and relative risk relationships across population groups (Figure 7).
FIGURE 6.
Crude Drug Overdose Deaths per 100,000 Medicaid Behavioral Health Risk Groups versus Non-Medicaid Enrollees Ages 18-64
380.2
336.9
130.4
196.2
68.9 51.6
13.0 9.2
15.0 13.70
100
200
300
400
2006 2007 2008 2009 2010 2011 2012
Mental Health Service Need and Substance Use Disorder
Substance Use Disorder Only
Mental Health Service Need Only
Non-Medicaid Population No Identified Behavioral Health Need
Per 100,000
FIGURE 7.
Age-adjusted Drug Overdose Deaths per 100,000 Medicaid Behavioral Health Risk Groups versus Non-Medicaid Enrollees Ages 18-64
385.2
334.2
189.3
232.0
74.9 58.122.8
14.114.9 13.20
100
200
300
400
2006 2007 2008 2009 2010 2011 2012
Mental Health Service Need and Substance Use Disorder
Substance Use Disorder Only
Mental Health Service Need Only
Non-Medicaid Population No Identified Behavioral Health Need
Per 100,000
RDA
DSHS Research and Data Analysis Division
Olympia, Washington
PAG
E 9
Discussion After years of increase, the recent decline in opioid analgesic overdose mortality is encouraging, and may be attributable to a variety of initiatives including (but not limited to) the promulgation of the Opioid Dosing Guideline for Chronic non-cancer Pain beginning in March 2007 (8), the initiation of the Narcotic Review Program by the Washington State Health Care Authority, and the implementation of the Prescription Monitoring Program in 2011 by the Washington State Department of Health. However, there has been a significant increase in heroin overdose deaths since 2010, which may reflect changes in the availability of heroin relative to prescription opioids.
We found that adult Medicaid enrollees with mental health service needs and/or substance use disorders had significantly higher drug-overdose death rates, compared to Medicaid enrollees without behavioral health risk factors. Mental illness is common among adult Medicaid recipients, with nearly half of adult Medicaid enrollees (prior to the coverage expansion under the Affordable Care Act) having an indication of a mental health service need in their health service records. Among persons with mental illness, chronic pain is an especially common condition. For example, 50 percent of patients who suffer from anxiety or depression disorders have a comorbid pain diagnosis (8). The synergistic effect of mental illness and chronic pain makes the treatment of both conditions more challenging. Other studies have found that the prevalence of long-term opioid use was significantly higher and the likelihood of being a heavy opioid user greater among individuals with mental health diagnoses (9, 10), which might help explain the higher opioid analgesic overdose death rates observed in Medicaid populations with mental health needs.
We found the highest overdose death rates among Medicaid enrollees with substance use disorders. Studies have identified non-opioid substance use as a risk factor for opioid analgesics misuse and abuse (11, 12). The higher death rate from opioid analgesics and upward trend among “substance use disorder only” Medicaid enrollees highlights the need to assess intervention strategies in this population. Most Medicaid enrollees with a substance use disorder also have mental health needs, and this co-occurring disorder group had the highest overdose death rate. The alignment of Medicaid mental health and substance use disorder services under integrated behavioral health organizations is scheduled to be implemented in April 2016. Behavioral health service purchasing alignment offers an opportunity to support improved care for persons with co-occurring disorders, which may help to reduce overdoses in this population.
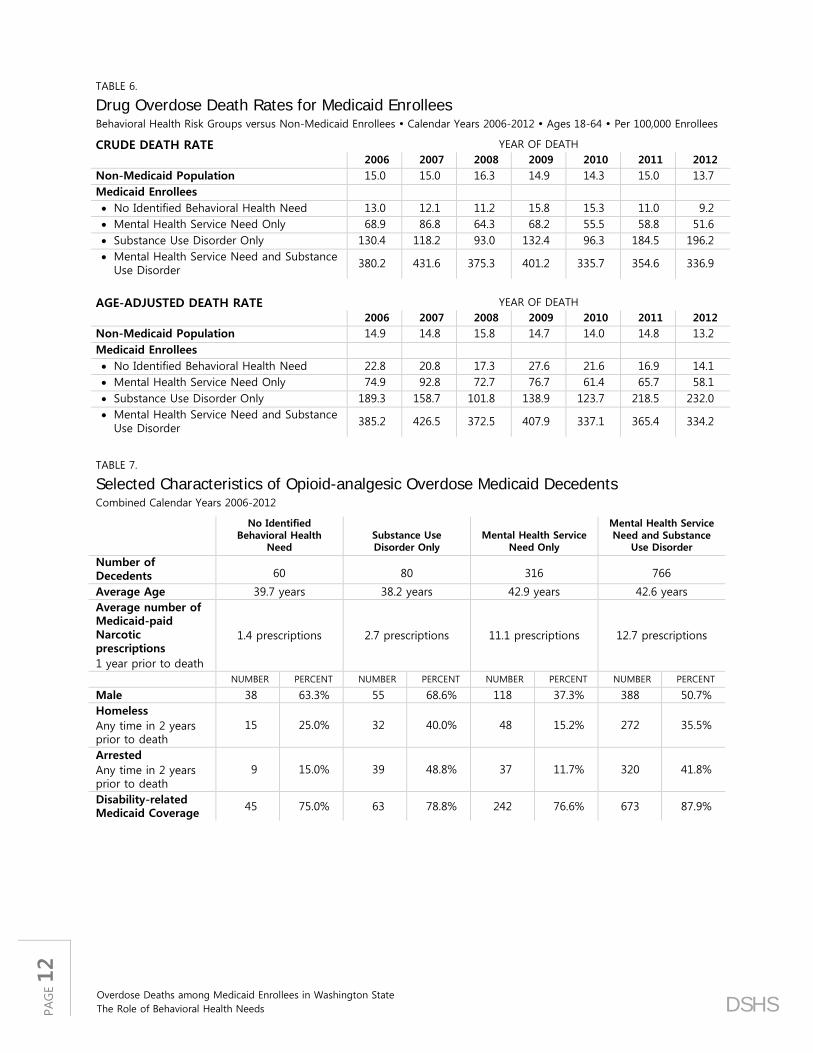
Finally, as indicated in Table 7 in the appendix (page 12), we note that a significant proportion of Medicaid enrollees with previously identified substance use disorders who died of a drug overdose were homeless or involved in the criminal justice system in the two years prior to their death. For example, of the 766 deaths over the study period of Medicaid enrollees with co-occurring mental illness and substance use disorders, 320 were arrested and 272 were observed to be homeless at some point in the 24 months before their death. These findings point to the importance of interventions to reduce housing instability and engage persons released from local jails in behavioral health treatment to reduce overdose risk.
PAG
E 10
Overdose Deaths among Medicaid Enrollees in Washington State The Role of Behavioral Health Needs DSHS
APPENDIX | Supporting Tables
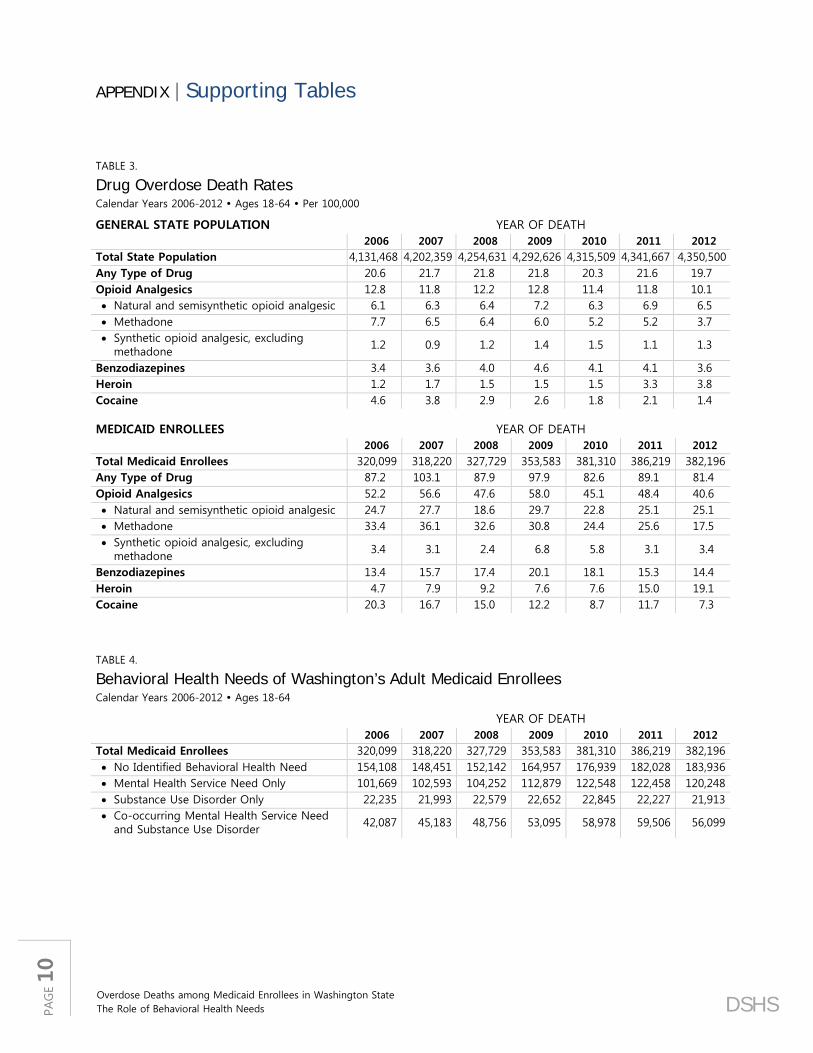
TABLE 3.
Drug Overdose Death Rates Calendar Years 2006-2012 Ages 18-64 Per 100,000
GENERAL STATE POPULATION YEAR OF DEATH 2006 2007 2008 2009 2010 2011 2012
Total State Population 4,131,468 4,202,359 4,254,631 4,292,626 4,315,509 4,341,667 4,350,500 Any Type of Drug 20.6 21.7 21.8 21.8 20.3 21.6 19.7 Opioid Analgesics 12.8 11.8 12.2 12.8 11.4 11.8 10.1 • Natural and semisynthetic opioid analgesic 6.1 6.3 6.4 7.2 6.3 6.9 6.5 • Methadone 7.7 6.5 6.4 6.0 5.2 5.2 3.7 • Synthetic opioid analgesic, excluding
methadone 1.2 0.9 1.2 1.4 1.5 1.1 1.3
Benzodiazepines 3.4 3.6 4.0 4.6 4.1 4.1 3.6 Heroin 1.2 1.7 1.5 1.5 1.5 3.3 3.8 Cocaine 4.6 3.8 2.9 2.6 1.8 2.1 1.4 MEDICAID ENROLLEES YEAR OF DEATH
2006 2007 2008 2009 2010 2011 2012
Total Medicaid Enrollees 320,099 318,220 327,729 353,583 381,310 386,219 382,196 Any Type of Drug 87.2 103.1 87.9 97.9 82.6 89.1 81.4 Opioid Analgesics 52.2 56.6 47.6 58.0 45.1 48.4 40.6 • Natural and semisynthetic opioid analgesic 24.7 27.7 18.6 29.7 22.8 25.1 25.1 • Methadone 33.4 36.1 32.6 30.8 24.4 25.6 17.5 • Synthetic opioid analgesic, excluding
Behavioral Health Needs of Washington’s Adult Medicaid Enrollees Calendar Years 2006-2012 Ages 18-64
YEAR OF DEATH
2006 2007 2008 2009 2010 2011 2012 Total Medicaid Enrollees 320,099 318,220 327,729 353,583 381,310 386,219 382,196 • No Identified Behavioral Health Need 154,108 148,451 152,142 164,957 176,939 182,028 183,936 • Mental Health Service Need Only 101,669 102,593 104,252 112,879 122,548 122,458 120,248 • Substance Use Disorder Only 22,235 21,993 22,579 22,652 22,845 22,227 21,913 • Co-occurring Mental Health Service Need
and Substance Use Disorder 42,087 45,183 48,756 53,095 58,978 59,506 56,099
RDA
DSHS Research and Data Analysis Division
Olympia, Washington
PAG
E 11
TABLE 5.
Drug Overdose Death Rates for Medicaid Enrollees by Type of Behavioral Health Need Calendar Years 2006-2012 Ages 18-64 Per 100,000 Enrollees
NO IDENTIFIED BEHAVIORAL HEALTH NEED
YEAR OF DEATH
2006 2007 2008 2009 2010 2011 2012
TOTAL No Identified Behavioral Health Need 154,108 148,451 152,142 164,957 176,939 182,028 183,936 Any Type of Drug 13.0 12.1 11.2 15.8 15.3 11.0 9.2 Opioid Analgesics 7.1 5.4 4.6 6.7 4.5 3.8 4.3 • Natural and semisynthetic opioid analgesic 2.6 1.3 0.7 2.4 3.4 2.2 1.6 • Methadone 5.2 4.0 4.6 4.2 0.6 2.2 1.6 • Synthetic opioid analgesic, excluding
Overdose Deaths among Medicaid Enrollees in Washington State The Role of Behavioral Health Needs DSHS
TABLE 6.
Drug Overdose Death Rates for Medicaid Enrollees Behavioral Health Risk Groups versus Non-Medicaid Enrollees Calendar Years 2006-2012 Ages 18-64 Per 100,000 Enrollees
CRUDE DEATH RATE YEAR OF DEATH 2006 2007 2008 2009 2010 2011 2012
Non-Medicaid Population 15.0 15.0 16.3 14.9 14.3 15.0 13.7 Medicaid Enrollees • No Identified Behavioral Health Need 13.0 12.1 11.2 15.8 15.3 11.0 9.2 • Mental Health Service Need Only 68.9 86.8 64.3 68.2 55.5 58.8 51.6 • Substance Use Disorder Only 130.4 118.2 93.0 132.4 96.3 184.5 196.2 • Mental Health Service Need and Substance
Use Disorder 380.2 431.6 375.3 401.2 335.7 354.6 336.9
AGE-ADJUSTED DEATH RATE YEAR OF DEATH
2006 2007 2008 2009 2010 2011 2012 Non-Medicaid Population 14.9 14.8 15.8 14.7 14.0 14.8 13.2 Medicaid Enrollees • No Identified Behavioral Health Need 22.8 20.8 17.3 27.6 21.6 16.9 14.1 • Mental Health Service Need Only 74.9 92.8 72.7 76.7 61.4 65.7 58.1 • Substance Use Disorder Only 189.3 158.7 101.8 138.9 123.7 218.5 232.0 • Mental Health Service Need and Substance
Use Disorder 385.2 426.5 372.5 407.9 337.1 365.4 334.2
TABLE 7.
Selected Characteristics of Opioid-analgesic Overdose Medicaid Decedents Combined Calendar Years 2006-2012
No Identified Behavioral Health
Need Substance Use Disorder Only
Mental Health Service Need Only
Mental Health Service Need and Substance
Use Disorder
Number of Decedents 60 80 316 766
Average Age 39.7 years 38.2 years 42.9 years 42.6 years Average number of Medicaid-paid Narcotic prescriptions 1 year prior to death
Decedents statewide were defined as those who died between calendar year (CY) 2006 and 2012 and who were between 18 and 64 years old. Medicaid decedents were defined using the same time frame and age limits, and who were eligible for Medicaid (eligibility category: 1-11) but not eligible for Medicare in the 12 months period before death including the month of death.
DATA SOURCES AND METHODS
Estimates are based on the Death Statistical File from Washington State Department of Health. Deaths were classified using the International Classification of Diseases, 10th Revision (ICD-10), 2010 version (available from http://apps.who.int/classifications/icd10/browse/2010/en). Each death is assigned a single ICD-10 code as the underlying cause of death (UCOD). Because deaths are complex and may have multiple causal factors, the multiple cause of death (MCOD) fields were used to provide additional detail on the substances involved in overdose deaths. The population data used as thedenominator for calculating death rates were obtained from the Office of Financial Management (OFM) (http://www.ofm.wa.gov/pop/), which develops annual estimates of the population using information from the decennial censuses, annual data on the number of births and deaths in Washington, and a variety of other data, such as housing starts, to estimate migration into and out of Washington. Medicaid enrollment status, patient substance use disorder and mental health service need were obtained from the integrated client databases maintained by Washington State Department of Social and Health Services, Research and Data Analysis Division.
Drug-poisoning deaths (excludes late effects and adverse effects of drugs) were defined as having ICD-10 underlying cause-of-death codes X40-X44, X60-X64, X85, Y10-Y14, [F11-F16] (.0), or F19.0. Among deaths with drug overdose as the underlying cause, the types of drugs involved are indicated by contributing cause codes (T36-T50.9). Opioid analgesics (T40.2, T40.3, or T40.4) are usually prescribed to relieve pain and include: natural and semisynthetic opioid analgesics (T40.2) such as morphine, codeine, hydrocodone, and oxycodone; methadone (T40.3); and synthetic opioid analgesics, excluding methadone (T40.4) such as fentanyl and meperidine (13).
Unless otherwise specified, crude death rates were calculated. Age-adjusted death rates were also calculated using the direct method and the 2000 U.S. standard population, which could eliminate the potential differences in the age composition of population overtime. The trend based on the crude rates was similar to the trend based on the age-adjusted rates.
BEHAVIORAL HEALTH RISK
The two risk factors associated with drug-poisoning death that we focused on were substance use disorder and mental health service need, which were defined using a 2-year window before death including the month of death. Medicaid enrollees were categorized into four groups based on their behavioral health needs: (1) No identified behavioral health need; (2) Mental health service need only; (3) Substance use disorder only; (4) Mental health service need and substance use disorder. Substance use disorder was defined based on: (a) a medical claim or encounter with a diagnosis of a substance use disorder; (b) substance abuse treatment or detoxification service use; (c) an arrest for a substance-related offense in the Washington State Patrol database (includes DUI/DWI, drug possession, and related offenses).
Mental health service need was defined based on: (a) Mental illness diagnosis (psychotic disorder, mania and bipolar disorder, depression, anxiety, ADHD/conduct/impulse, adjustment disorder); (b) Mental illness medication (antipsychotic, anti-mania, antidepressants, antianxiety, ADHD); (c) Any DSHS or HCA mental illness services; (d) Children Administration behavioral rehabilitation services; (e) Tribal mental health service.
Overdose Deaths among Medicaid Enrollees in Washington State The Role of Behavioral Health Needs DSHS
REFERENCES
1. Centers for Disease Control and Prevention. Web-based Injury Statistics Query and Reporting System (WISQARS) [online]. (2014) Available from http://www.cdc.gov/injury/wisqars/fatal.html.
2. National Center for Health Statistics. Trends in Drug-poisoning Deaths Involving Opioid Analgesics and Heroin: United States, 1999-2012. December 2014. Available from http://www.cdc.gov/nchs/data/hestat/drug_poisoning/drug_poisoning.htm.
3. Centers for Disease Control and Prevention. Overdose Deaths Involving Prescription Opioids Among Medicaid Enrollees Washington, 2004-2007. Morbidity and Mortality Weekly Report (MMWR) October 30, 2009 / 58(42); 1171-1175. Available from http://www.cdc.gov/mmwr/preview/mmwrhtml/mm5842a1.htm.
4. Washington State Department of Health. Drug poisoning and overdose. Available from http://www.doh.wa.gov/portals/1/Documents/2900/DOH530090Poison.pdf.
5. Substance Abuse and Mental Health Services Administration, Office of Applied Studies. National admissions to substance abuse treatment services. Rockville, MD: Substance Abuse and Mental Health Services Administration; 2009.
6. Substance Abuse and Mental Health Services Administration. The DAWN report: highlights of the 2009 Drug Abuse Warning Network (DAWN) findings on drug-related emergency department visits. Rockville, MD: Substance Abuse and Mental Health Services Administration; 2010. Available from http://www.samhsa.gov/data/2k10/dawnsr034edhighlights/edhighlights.htm.
7. Substance Abuse and Mental Health Services Administration. Results from the 2009 National Survey on Drug Use and Health: volume 1: summary of national findings. Rockville, MD: Substance Abuse and Mental Health Services Administration; 2010.
8. Substance Abuse and Mental Health Service Administration, Health Resource Service Administration. Center for Integrated Health Solutions. Treatment of Chronic Pain: Our Approach. Available from http://www.integration.samhsa.gov/about-us/Pain_Management_Webinar_Slides.pdf.
9. Thielke SM, Simoni-Wastila L, Edlund MJ, DeVries A, Martin BC, Braden JB, et al. Age and sex trends in long-term opioid use in two large American health systems between 2000 and 2005. Pain medicine. 2010 Feb;11(2):248-56.
10. Edlund MJ, Martin BC, Fan MY, Braden JB, Devries A, Sullivan MD. An analysis of heavy utilizers of opioids for chronic noncancer pain in the TROUP study. Journal of pain and symptom management. 2010 Aug;40(2):279-89.
11. Becker WC, Sullivan LE, Tetrault JM, Desai RA, Fiellin DA. Non-medical use, abuse and dependence on prescription opioids among U.S. adults: psychiatric, medical and substance use correlates. Drug and alcohol dependence. 2008 Apr 1;94(1-3):38-47.
12. Tetrault JM, Desai RA, Becker WC, Fiellin DA, Concato J, Sullivan LE. Gender and non-medical use of prescription opioids: results from a national US survey. Addiction. 2008 Feb;103(2):258-68.
13. Injury Surveillance Workgroup (ISW7). Consensus recommendations for national and state poisoning surveillance. Atlanta, GA: The Safe States Alliance, 2012. Available from http://c.ymcdn.com/sites/www.safestates.org/resource/resmgr/imported/ISW7%20Full%20Report_3.pdf.
REPORT CONTACT: Alice Huber, PhD, 369.902.0707
VISIT US AT: https://www.dshs.wa.gov/SESA/research-and-data-analysis