Page 1
Overestimation of others’ willingness to pay – An investigation
Bin Li
A Thesis
in
The John Molson School of Business
Presented in Partial Fulfillment of the Requirementsfor the Degree of Master of Science in Administration (Marketing) at
Concordia UniversityMontreal, Quebec, Canada
April 2017
© Bin Li, 2017
Page 2
CONCORDIA UNIVERSITYSchool of Graduate Studies
This is to certify that the thesis prepared
By: Bin LiEntitled: Overestimation of others’ willingness to pay – An investigation
and submitted in partial fulfillment of the requirements for the degree of
Master of Science in Administration (Marketing)
Complies with the regulation of the University and meets the accepted standards with respect to the originality and quality.Signed by the final examining committee:
Dr. Ravi Mateti Chair
Dr. Darlene Walsh Examiner
Dr. Tieshan Li Examiner
Dr. Mrugank Thakor Supervisor
Approved by _____________________________________________Chair of Department of Graduate Program Director
April 2017 ______________________________________________Dean of Faculty
Page 3
iii
Abstract
Overestimation of others’ willingness to pay – An investigation
Bin Li
This project focuses on consumers’ overestimation of others’ willingness to pay, a topic of
theoretical importance as well as managerial importance. Previous research has found that
consumers often overestimate others’ willingness to pay, and that this effect can be found in a
variety of circumstances. The underlying reasons behind this effect are, however, not well
understood. We conducted seven studies to test the leading proposed explanations – namely,
perceptions of others’ consumer spending self-control capabilities and perceptions of others’
affluence – and also considered moderating factors such as product type – hedonic/ utilitarian, and
ethical/conventional products. Overall, our research contributes to the pricing literature by adding
to the limited number of studies that have so far addressed this issue. Our findings replicate some
earlier ones, and also provide insight into the mechanism through which overestimation occurs.
Pricing practitioners should also benefit from our findings as they will be able to calibrate
themselves better so as to minimize overestimation, and generate sales while charging the optimal
price in the conduction of an appropriate marketing strategy.
Page 4
iv
Acknowledgment
First and foremost, I would like to appreciate my supervisor, Prof Thakor. Without his guidance, I
would never have had an opportunity to complete my research, which was fun and interesting. He
inspired me from the very early stage of thinking about different topics to the last stage, data
analysis. At every stage, he was a role model for me and showed me what an intelligent researcher
should be like. I learned a lot from him, not just about marketing research but also about time
management, professional development, and personality formation. He really cares about his
students, truly thinking about them, hoping they would be successful.
I am also very grateful to the members of my committee, Professor Walsh and Professor Li. They
offered great help during the defense preparation period. I truly believe that if it had not been for
their genuine willingness to help, I would not have been able to defend my thesis as I wished.
Then, I would like to say thank you to my family, who always supported me and never laughed at
my crazy ideas. It might sound funny, but, in their eyes, I am still the super-girl who can make
everything come true. I have confidence because they trusted me first.
I also want to thank my friend Long, who never felt bored talking to me and shared every silly life
moment with me. This has meant a lot to me, especially during the first lonely Loyola year. I also
want to thank Thao and all my friends here in school. We have faced all the academic problems
together, grown up together, and explored this wonderful city together. I am so lucky to have met
them before and now, here and there.
Last but never least, I would like to thank my puppy, Kaka. Her innocence is the sugar of my life.
She can refresh me in a second, whenever I am exhausted.
I wish everyone the best in their life. I wholeheartedly cherish the memories we share and look
forward to a greater future together.
Page 5
v
Table of Contents
LIST OF TABLES..................................................................................................................................... vii
LIST OF FIGURES.................................................................................................................................. viii
Figure 1: Results of Study 2. The plot shows participants’ WTP gap of nine products as well as average WTP gap against underestimation proportion of others consumer spending self-control.......................................................................................................................................................... viii
Figure 2: Results of Study 4. The plot shows participants’ WTP gaps against affluence belief of others’ towards four products...................................................................................................................................viii
Introduction................................................................................................................................................. 1
Theoretical background and hypotheses development.............................................................................2
1 Overestimation effect........................................................................................................................... 2
1.1 Explanations of WTP gap............................................................................................................. 2
2 Self-control............................................................................................................................................ 3
2.1 General self-control....................................................................................................................... 3
2.2 Consumer spending self-control................................................................................................... 4
3 Hedonic consumption and self-control................................................................................................5
4 Affluence belief and ethical products..................................................................................................7
5 Research Strategies...............................................................................................................................9
Methodology...............................................................................................................................................10
Study 1 Main effect test.........................................................................................................................10
Study 2 Alternative explanation: Consumer Spending Self-control................................................. 12
Study 3 Hedonic VS Utilitarian product types....................................................................................19
Main Study 3.......................................................................................................................................20
Study 4 Main effect – Affluence belief and WTP................................................................................23
Study 5 A causal link between beliefs about others’ affluence and beliefs about their willingness to pay for ethical products........................................................................................................................ 27
Study 7 Self-control, Affluence belief, hedonic VS utilitarian and WTP..........................................32
General Discussion.................................................................................................................................... 36
Contributions............................................................................................................................................. 38
Limitations and future research directions............................................................................................. 40
References.................................................................................................................................................. 42
Appendices................................................................................................................................................. 46
Page 6
vi
Appendix A Main effect - Overestimation of others’ WTP, Study 1 & 2...............................................46
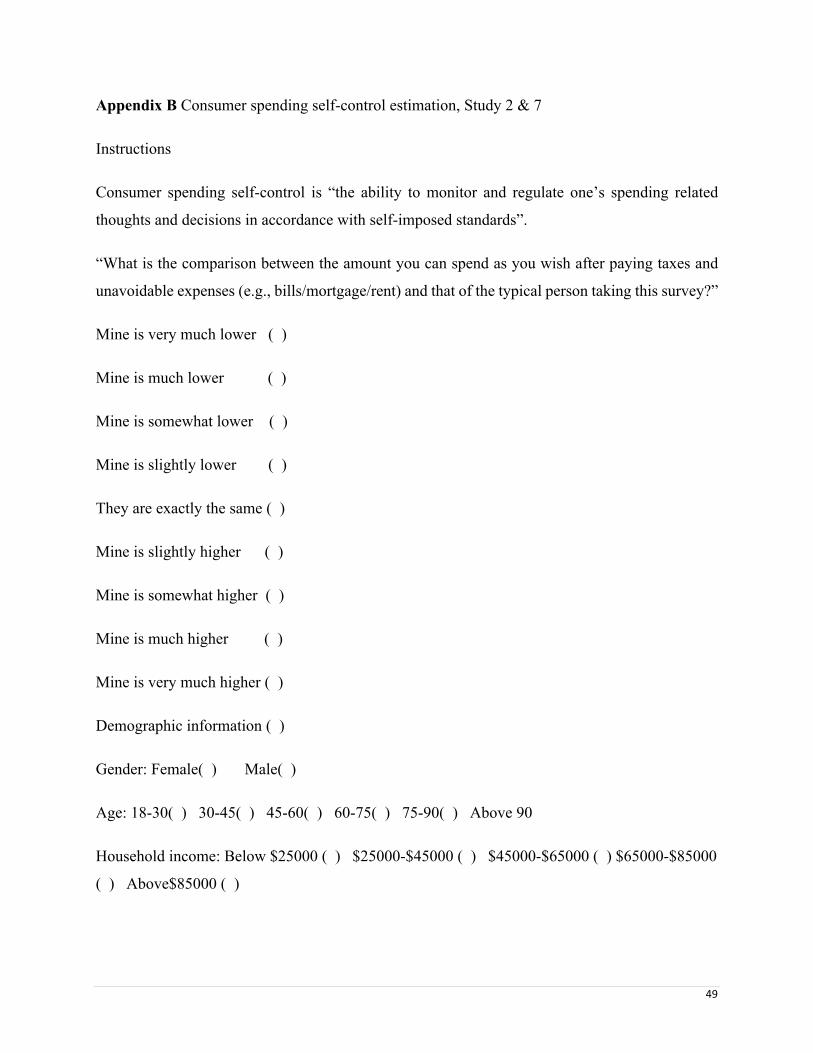
Appendix B Consumer spending self-control estimation, Study 2 & 7.................................................. 49
Appendix C Hedonic VS Utilitarian attributes, Study 3........................................................................50
Appendix D Affluence belief and WTP gap, Study 4 & 7......................................................................51
Appendix E Causal link between affluence belief and WTP for ethical product, Study 5..................... 55
Appendix F WTP for ethical products, Study 6......................................................................................58
Page 7
vii
LIST OF TABLES
Table 1: Arithmetic Self and Other mean price offers for nine goods, Study 1.............................11
Table 2: Arithmetic mean of price offer for self and other, Study 2..............................................13
Table 3: Correlations between participants’ average *WTP rates against underestimation
proportion of others consumer spending self-control……………………………………….……16
Table 4: Geometric Mean Price offer for Self- and Other-WTP values of hedonic and utilitarian
attributed products in Study 3.........................................................................................................21
Table 5: Arithmetic Mean Price offer for Self- and Other-WTP values of hedonic and utilitarian
attributed products, Study 3............................................................................................................22
Table 6: Geometric means for Self- and Other-WTP values in Study 4........................................25
Table 7: Arithmetic means for Self- and Other-WTP values, Study 4...........................................25
Table 8 Arithmetic Mean price offers in high and low income groups, Study 5…….....................28
Table 9: Independent Sample Test Results to compare mean price offer in high and low income
conditions, Study
5......................................................................................................................................................28
Table 10: Geometric means for Self- and Other-WTP values in Study 6......................................30
Table 11: Arithmetic means for Self- and Other-WTP values, Study 6.........................................31
Table 12 Correlation test to confirm the effectiveness of affluence belief manipulation, Study
7…………………………………………………………………………………………..………34
Table 13 General linear model to investigate the relationship between groups, setting
underestimation of others’ consumer spending self-control as a covariate, Study 7……..……...34
Page 8
viii
LIST OF FIGURES
Figure 1: Results of Study 2. The plot shows participants’ WTP gap of nine products as well as
average WTP gap against underestimation proportion of others consumer spending self-
control.............................................................................................................................................13
Figure 2: Results of Study 4. The plot shows participants’ WTP gaps against affluence belief of
others’ towards four products.........................................................................................................26
Page 9
1
Introduction
Estimation of the amount others are willing to pay for a product or service is an important issue,
as it underlies many pricing decisions. Both individual sellers putting their goods up for sale on
sites such as eBay and corporate pricing departments need to guess at buyers' reservation prices in
order to select the optimal price. Surprisingly, though, this issue has seen little research. In a recent
article, Frederick (2012) summarizes the extant studies on the topic and shows that subjects
reliably overestimate others' willingness-to-pay (hereafter WTP) compared to their own WTP.
This effect appears robust to different forms of measurement, and is not attributed to several widely
researched theories (i.e. endowment effect and better-than-average effect).
Our objectives were to test promising explanations for this widely observed phenomenon that had
not already been considered, such as the perception of others' consumer spending self-control,
which in Frederick (2012)'s study is suggested as a possible avenue for future research. Then we
conducted a study to investigate the moderating effect of product type, such as products with
hedonic/utilitarian attributes. We also conducted a replication of the findings of Matthews,
Gheorghiu and Callan (2016), who show that affluence beliefs can also affect overestimation of
others' WTP. Based on the applicable explanation – affluence belief (Matthews et al, 2016), we
moved to find another moderator: ethical/conventional products. Finally, we extended existing
research by assessing the effects of both consumer spending self-control perceptions and affluence
beliefs concurrently in order to estimate their interactions and effects concerning WTP.
Study 1 replicates Frederick (2012)’s study to ensure the existence of main effect - overestimation
of others’ willingness to pay. Study 2 investigates the new explanation - underestimation of others’
consumer spending self-control. Study 3 explores the moderating effect of hedonic product. Study
4 replicates Matthews et al (2016)’s study by supporting the explanation - affluence belief. Study
5 sets the causal link between affluence belief and willingness to pay for ethical products. Study 6
found support of moderating effect of ethical products on willingness to pay. Study 7 investigates
that two explanations, underestimation of others’ self-control and affluence belief are separate and
independent.
The reminder of the paper discusses the entire study logic, point out the limitations and future
research directions.
Page 10
2
Theoretical background and hypotheses development
1 Overestimation effect
An overestimation effect is “a tendency to overestimate how much others will pay for goods”
(Frederick, 2012, p.1), which is widespread.
Frederick (2012) found that there is a bias among customers, that they tend to overestimate others’
willingness to pay (hereafter WTP) for commercial goods. The bias is relatively robust, because
in Frederick (2012)’s six studies, many procedural changes were made: for instance, offering
incentives for precise estimation, asking participants to estimate others’ WTP by proportion,
letting people give their maximum WTP and estimate the next participant’s WTP, asking if
subjects’ WTP was more or less than a typical person’s offer, estimating the mean of bids in a
BDM auction – bid price is generated randomly, which could be selected as accepted or rejected
by buyers and sellers (Becker, DeGroot & Marschak, 1964). All these attempts point to the same
result, overestimating others’ willingness to pay compared to their own. Hence, this leads to a self-
other WTP gap.
Other studies have also observed a similar phenomenon, including from both sellers and buyers’
eyes. Sellers tend to overestimate buyers’ willingness to pay, which is known as the endowment
effect – “the tendency to value an object more once one owns it” (van Boven, Dunning &
Loewenstein, 2000, p.66). When paying for others, people will generally offer a higher price (Jung,
Nelson, Gneezy & Gneezy, 2014). Self-other difference exists in value function, which is that
buyers always overestimate other buyers’ purchasing price offer for a same product than they
would by over 20% (Kurt & Inman, 2013). In other words, when estimating the price that will be
offered by others, people always tend to overestimate the amount.
1.1 Explanations of WTP gap
Frederick (2012) conducted a coherent work and thereby rejected a series of explanations for
the overestimation effect. First, giving subjects the market price (how much a product is offered
in market place) of a product does not affect overestimation of others’ willingness to pay for the
product. Second, individual differences in perceived liking are not leading to overestimation effect
Page 11
3
- whether people like a product or not, they tend to overestimate what others will pay for the
product. Third, the “empathy gap” (van Boven et al., 2000) explanation does not account for the
overestimation bias, with measures of this gap being uncorrelated with overestimation. Fourth, the
better-than-average effect – “people evaluate themselves more positively than they evaluate most
other people” (Brown, 2012, p.209) would not explain the effect, offers no explanation since WTP
does not seem to be regarded as an undesirable trait. Fifth, the “availability” heuristic suggesting
that overexposure to commercials showing others consumption evokes overestimation of others’
WTP does not hold for different kinds of prices. Lastly, different levels of self-construal leading
to an abstract perception to different extents of other people (Trope & Lieberman, 2003) do not
seem to be an explanation because the effect persists whether subjects know the others or not.
Therefore, Frederick (2012) named this effect "the X effect."
However, it does appeal that there is at least one explanation for this bias. To investigate the reason
why people generally overestimate others' willingness to pay, Matthews et al. (2016) found that
there is a causal link between income belief and WTP. Hence, they showed that the bias of
the overestimation of others' affluence partly contributes to the overestimation of others'
willingness to pay. Different people could have different affluence believes, leading to different
extents of overestimation of others’ WTP.
As a suggestion for future research, at the end of Frederick's (2012) study, he mentions that the
underestimation of others' ability to exert self-control may be an explanation. This direction is
promising yet there have not been any studies which have investigated self-control. This study will
focus on investigating this explanation, among others. We discuss self-control next.
2 Self-control
2.1 General self-control
The definition of general self-control is having the ability to control one's behavior, having clear
standards, and having the ability to change (Baumeister, 2002; Vohs & Faber 2007). In the five-
factor taxonomy of personality traits, self-control has been proved to be an important personality
trait that has the capacity to explain a series of individual differences (Baumeister, 2002). There is
also a measure of self-control developed by Tangney, Baumeister, and Boone (2004), which tests
Page 12
4
the level of resisting temptation, keeping good self-discipline, and breaking habits. A high level of
self-control correlates positively with "better adjustment (fewer reports of psychopathology,
higher self-esteem), less binge eating and alcohol abuse, better relationships and interpersonal
skills, secure attachment, and more optimal emotional responses" (Tangney et al, 2014, p.271);
however, a low level of self-control relates to both eating problems and problematic drinking
patterns (Tangney et al., 2014, p.296).
2.2 Consumer spending self-control
When considering people's general self-control and their performance when they have to make
purchasing decisions, Hoch and Loewenstein (1991) defined consumer self-control as a conflict
between desires generated from preference and respect of time.
In an attempt to observe and explain customers' spending self-control, Haws, Bearden, and Nenkov
(2012) invented a scale to measure consumer spending self-control (CCSS). They emphasize the
importance of the effect of individual traits and also demonstrate how self-control plays an
important role in consumers' spending behavior and purchase decision-making process. Moreover,
it is consistent with the ideas that traits or attitudes obtain the ability to foresee relevant behaviors.
For example, people with low levels of stability (in the five-factor model of personality) show a
high tendency of compulsive buying behavior; there is a negative relationship between
consciousness and compulsive buying and a positive relationship between agreeability and
compulsive buying (Mowen & Spears, 1999).
The progressive meaning of consumer spending self-control is that it focuses specifically on
consumers' spending self-control and its purchasing decision results. Moreover, previous research
has found that people with high self-control levels could fail to control themselves when they
spend (Baumeister et al., 2007).
Similar with a previous idea that personality traits could predict human spending results, previous
researchers have found that people with high self-control levels could still fail to control
themselves when they spent money. This may be attributed to differences in people's allocation of
self-resources; in other words, when studying consumption self-control, the difference between
domains should be considered (Baumeister et al., 2007). Hence, Haws et al. (2012) argued that
Page 13
5
consumer spending self-control is defined as "the ability to monitor and regulate one's spending-
related thoughts and decisions in accordance with self-imposed standards" (p.697).
Haws et al. (2012) have proven that customers with low levels of consumer spending self-control
are more likely to make purchase decisions. Meanwhile, these consumers tend to pay more for
products than those with a high level of consumer spending self-control. Hence, it is predictable
that the estimation of a low level of self-control may lead to an overestimation of payment
willingness.
Extending previous studies, we propose that the underestimation of others' self-control in spending
might also give rise to a self/other difference in WTP. Hence comes the first hypothesis:
H1: The underestimation of others' self-control in spending leads to the overestimation of others'
willingness to pay (WTP).
3 Hedonic consumption and self-control
According to Babin, Darden, and Griffin (1994), the motivations for shopping hedonic and
utilitarian products are very distinct. Hedonic consumption brings benefits such as fantasy,
escapism, arousal, sensory attributes, and spiritual delight; meanwhile, utilitarian consumption is
more about customers' practical tasks, instrumental needs, and rational work (Hirschman &
Holbrook, 1982; Babin et al., 1994). Dhar and Wertenbroch (2000) revealed that from a
postmodern marketing perspective, hedonic consumption produces something while consuming.
More specifically, hedonic goods were described as containing magical aspects (Arnould, Price &
Otnes, 1999), being sacred (Belk, 1988), projecting an extended self (Belk, 1988), and highlighting
a participation in sports (Hopkinson & Pujari, 1999).
Hedonic consumption is a sequentially psychological fulfillment process. It first starts with a loss
of self and subsequently transforms to control over self, and eventually acts as a move to fulfill
self-enhancement (Babin et al, 1994). Hopkinson and Pujari (1999) also argue that it has the
function to create one's identity. The fantasy parts in hedonic consumption fulfill the imagination
of the consumers (Hirschman & Holbrook, 1982). The imagination of consumers creates the
Page 14
6
perception that hedonic consumption is a process of consuming magic and enchantment
(Hopkinson & Pujari, 1999).
Hedonic consumption also has more effects on consumers than utilitarian consumption, because
consumers value hedonic products and services from a purely hedonic perspective besides their
utilitarian function. In other words, hedonic value acts as an extra or bonus value. In addition,
because there is a positive link between involvement and positive affect, hedonic consumption
itself is actually an activity of involvement, so it works on consumers with strength (Hightower,
Brady & Baker 2002).
The lack or failure of self-control is called "impulsiveness", which contains strong incentive
hedonic value to tempt people to make the hedonic-oriented decision right away that could be the
opposite of a long-term restrained goal (Loewenstein, 1996). More specifically, people are always
torn between controlling themselves from consumption and their instant spending for fulfilling
hedonic satisfaction, such as candy consumption and beer purchase (Hofmann, Friese & Strack,
2016). In other words, when a hedonic component defeats self-control, that is when an "indulgent"
purchase decision is made. People face the self-control dilemma nearly every day.
As stated by Baumeister et al. (2007), consumers' self-control reacts differently to different
domains; hence, it is very likely that when contexts are set to be hedonic and utilitarian ones, the
self-control level will be observed differently based on their estimations of others' self-control
levels. Previously, it was found that consumers use self-control mechanisms to resist the
temptation of hedonic products (Wertenbroch, 1998). It was also found that to resist the immediate
temptation of a hedonic effect, a high level of self-control is demanded (Giner-Sorolla, 2001).
Moreover, Urminsky and Kivetz (2004) argue that the consumption of hedonic goods causes an
enhanced use of self-control because the desire for hedonic consumption is stronger than utilitarian
goods. In other words, consumers need more effort and put in the resistance to hedonic
consumption, so there is a larger possibility to fail.
Furthermore, new research by Lu, Liu, and Fang (2016) states that when consumers decide for
others, they are more likely to select hedonic choices over utilitarian ones than if they are making
purchase decisions for themselves. This makes it evident that there is a self-other difference in
hedonic and utilitarian products.
Page 15
7
Hence, hedonic attributes are found to play an important role in influencing people's consumption
self-control. It would therefore be logical to expect that there would be a difference between
people's estimation of others' willingness to pay for hedonic and utilitarian products. In other
words, hedonic and utilitarian product types might work as moderators towards the WTP gap. This
attempt is creative and might bring forth salient research findings.
Hereby, the second hypothesis is as shown below:
H2: For a hedonic product, people tend to overestimate others’ WTP more than they do for a
utilitarian product.
4 Affluence belief and ethical products
After Frederick's work (2012), only Matthews, et al. (2016) revealed that the overestimation of
others' affluence explains the overestimation of others' WTP phenomenon. They found a causal
link between the overestimation of others' income and wealth status and their WTP. Therefore,
I wondered if there could be a moderator between the overestimation of others' affluence and
the overestimation of WTP to strengthen the relationship. Finally, we found the ethical product,
which is always believed as enjoying a price premium (Hainmueller, Hiscox & Sequeira, 2012;
Marian, Chrysochou, Krystallis & Thøgersen, 2014, etc.). If or when it works together with
overestimated affluence beliefs, a higher level of overestimation of others' WTP is presumed.
There are four most commonly known ethical product labels: Fair Trade, Rainforest Alliance,
Carbon Footprint, and Animal Welfare. Customers' understanding of ethical products is still
limited, majorly vis-à-vis the protection of the environment currently. Moreover, the
understanding of ethical products is related to life values. Higher social classes are found to use
sustainability label products more (Grunert, 2011).
There are four kinds of motivations that drive customers to purchase ethical products: conformity
motivations, self-orientation motivations, self-actualization motivations, and hedonism
motivations (Karsaklian & Fee, 2015). Conformity motivations drive consumers to behave like
other people; therefore, if other people are purchasing ethical products, they would like to do so as
well. Self-orientation motivations show consumers' desire to be different from others; in other
Page 16
8
words, the point that others are not purchasing ethical products would motivate them to make the
purchase decision. Self-actualization motivations are the willingness to help people in need
through the purchase of ethical products. Hedonism motivations are the concerns about consumers
themselves, such as health, beauty, economic benefits, etc.
Customers approve of the fact that ethical products involve a price premium. It has been found
that organic fruits and vegetables are perceived differently from other products; moreover,
customers are generally willing to pay more for them (Krystallis & Chryssohoidis, 2005).
However, it was also found that there is a percentage limit to this price premium. When the price
premium percentage is equal to or lower than 8%, sales remain steady. Nevertheless, when the
price premium percentage rises to 9%, sales will dramatically witness a 30% drop (Hainmueller et
al., 2012).
The estimation of consumers' WTP for a price premium for the ethical products was previously
researched. The reason behind this WTP for higher prices could be explained as consumers'
preferring the ethical contributions a product makes. For example, the WTP for fair trade coffee
(Basu & Hicks 2008; Carlsson, García & Löfgren. 2010, etc.), fair trade chocolate (Didier & Lucie
2008; Rousu & Corrigan 2008), and sweatshop-free clothing was investigated (Rode et al. 2008;
Hustvedt & Bernard 2010). Moreover, there is proof that product information on an ethical product
label can lead to more customers' willingness to pay extra (Basu & Hicks 2008; Didier & Lucie
2008; Rousu & Corrigan 2008). Additionally, there is also social context impact on individuals
making them more willing to pay (Carlsson et al., 2010).
As customers prove to accept that there is a price premium for ethical products, the general WTPs
for them are higher (Krystallis & Chryssohoidis, 2005). However, meanwhile, noticeably, it was
also found that a large number of consumers are not really ready to pay more for organic and fair
trade products because of their high prices (Didier & Lucie, 2008). This suggests that there is a
firm link between ethical products and higher price. Hence, when introducing the affluence beliefs
of others, consumers may witness some relatively more expensive products as well as a relatively
wealthier group. It is logical to presume that they would consequently believe more that others are
willing to pay extra for an ethical product.
Here is the third hypothesis:
Page 17
9
H3: When the overestimation of WTP is induced by a belief in affluence and it is for an ethical
product, people tend to overestimate more than they estimate others' willingness to pay for a
conventional product.
5 Research Strategies
This research involved seven studies in total.
There is no great number of overestimation literature on WTP effects. Frederick's study
(2012) was the first one to be presented, and after that, the same perspective on buyers' estimations
of others' WTP was seen in Matthews' et al. (2016) research. Apart from these two studies, there
is some literature holding the view of buyers', but this research was mainly concerned about the
endowment effect, such as in Weawer and Frederick (2012) as well as Kurt and Inman (2013).
There was great research potential to continue working on the overestimation of the WTP effect,
but at the same time, it was necessary to test the main effect again. Thus, our research could be
well based and developed in an effective direction.
In study 1, the overestimation of others' willingness to pay was tested again to support the main
effect, replicating Frederick (2012)'s methodologies. Then, in study 2, the strategies selected in
Matthews et al. (2016) were adopted; however, rather than testing the affluence belief, study 2
investigated if underestimation of others' consumer spending self-control (Haws et al., 2012)
explains the phenomenon of overestimation of WTP. A range of consumer products was selected
to investigate participants' beliefs about other people's consumer spending self-control and
willingness to pay for those products, aiming to find the self-other WTP gap. Next, study 3 tested
the overestimation of others' willingness to pay for hedonic and utilitarian attributed products.
In study 4, the explanation of the affluence belief gap between self and others found in Matthews
et al. (2016) was examined again to test the robustness of this finding. The methods conducted in
both Matthews et al. (2016) and Frederick (2012)'s work were replicated, asking people to estimate
self-other affluence and self-other willingness to pay for a series of consumer products. Then, in
study 5, a causal link between affluence belief and willingness to pay more for ethical products
was tested to show the moderating effect of ethical product. Following this study, in study 6, a list
Page 18
10
of ethical consumer products (that are exact alternatives to those in study 4) was used to test
consumers' overestimation of others' willingness to pay.
In all the studies of our research, participants were recruited via the online data collection website
CrowdFlower.
Methodology
Study 1 Main effect test
Participants
Participants were recruited via CrowdFlower. Consequently, people who were under the age of 18
or who could not complete the task were removed from the dataset. As a result, the dataset contains
55 participants (24 male, 31 female), aged 22–62 (M=40.4, SD=10.9).
Design and procedure
Participants first read the instructions. Then they were randomly assigned to one of two groups. In
each group, they were shown nine goods. One group was first told, "Please indicate the most you
would like to pay for each of nine products. (CAD)". Thus, they gave the price for each product.
After this, on the next page, they were shown the nine products again and told, "Please indicate
the most the typical person who is taking this survey would like to pay for each of nine products.
(CAD)". For the second group, participants were asked first to predict how much the typical person
would like to pay for each product and then report their own willingness to pay. Participants were
asked to fill their demographic information in at the end of the task.
At the end of the study, demographic information was asked of the participants. This included
gender, age, and annual pre-tax household income options: less than $25000; $25000–$45000;
$45000–$65000; $65000–$85000; above $85000.
Results and Discussion
Respondents overestimated the price offered by others by an average of 38% (see Table 1). A
paired t-test was conducted here.
Page 19
11
A within-subject analysis here (participants stated their own price offer and then estimated others'
willingness to pay) reveals that participants considerably overestimated that the typical person
taking this survey would like to pay for the same products (seven out of nine products). This result
is consistent with previous findings on this WTP bias.
Table 1 Arithmetic Self and Other mean price offers for nine goods, Study 1
Mean Price offer
Good Self Other Sig
LEGO Classic - Creative Bricks 23.38 31.98 0.000*
Music CD of your favorite
singer/band
13.23 19.07 0.028*
HP DeskJet 1112 Printer 125.55 191.13 0.019*
2lbs Joe’s Tasty Travels Roasted
Peanuts
8.99 8.67 0.857
NESTLÉ KITKAT Minis Milk
Chocolate Bar (10x12g)
4.37 5.47 0.004*
1 large Cucumber 1.55 1.98 0.005*
Manchester by the sea DVD 19.51 15.56 0.443
500 ml Canada Dry 2.50 3.00 0.001*
A voucher giving a large pizza
at Pizza Hut
11.17 13.96 0.000*
Average 23.36 32.31
* p<0.05
Page 20
12
Study 2 Alternative explanation: Consumer Spending Self-control
Participants
Participants took part online and were recruited via CrowdFlower. Therefore, participants who
were under the age of 18 or could not complete the task were removed from the data pool. The
dataset eventually contained 50 participants (17 male, 33 female), aged 18-81 (M=43.5, SD=13.1).
Design and procedure
After reading the initial instructions, participants chose to agree or not to agree to the rules of the
study. Hence, only participants reading and agreeing with the instructions would be guided to the
following content.
The following web page presented a list of nine goods (same as used in Study 1). For every
product, participants were asked to offer their maximum price offer for each product and then their
estimation of the "typical person's" willingness to pay for same product list.
After answering these price offer questions, participants were guided to a new page, where they
read the definition of consumption self-control: "Consumer spending self-control is the ability to
spend carefully, in line with a budget, without being too impulsive or over-spending". This was
simplified based on a definition of "the ability to monitor and regulate one's spending related
thoughts and decisions in accordance with self-imposed standards" (Haws et al., 2012). Then they
were asked to indicate "the proportion of people taking part in the survey who have lower
consumer spending self-control than you do (%)".
After answering all the questions, on the next page, the demographic information was gathered,
including gender, age, and annual pre-tax household income range.
Page 21
13
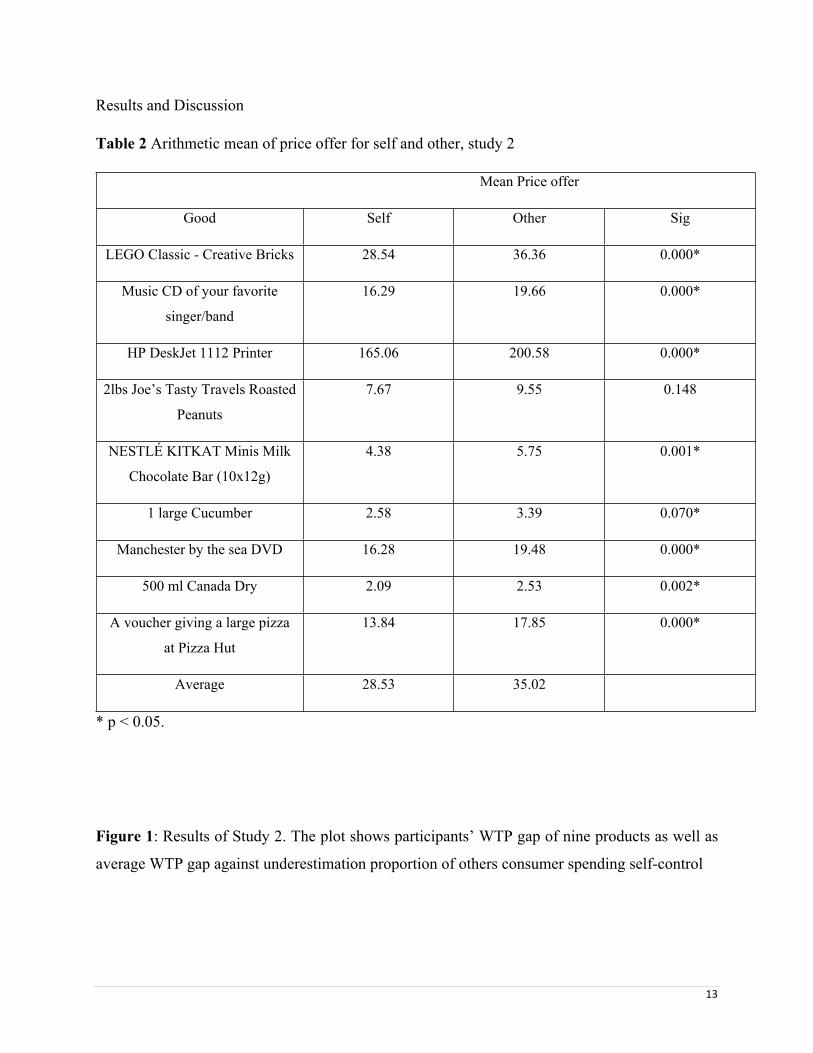
Results and Discussion
Table 2 Arithmetic mean of price offer for self and other, study 2
Mean Price offer
Good Self Other Sig
LEGO Classic - Creative Bricks 28.54 36.36 0.000*
Music CD of your favorite
singer/band
16.29 19.66 0.000*
HP DeskJet 1112 Printer 165.06 200.58 0.000*
2lbs Joe’s Tasty Travels Roasted
Peanuts
7.67 9.55 0.148
NESTLÉ KITKAT Minis Milk
Chocolate Bar (10x12g)
4.38 5.75 0.001*
1 large Cucumber 2.58 3.39 0.070*
Manchester by the sea DVD 16.28 19.48 0.000*
500 ml Canada Dry 2.09 2.53 0.002*
A voucher giving a large pizza
at Pizza Hut
13.84 17.85 0.000*
Average 28.53 35.02
* p < 0.05.
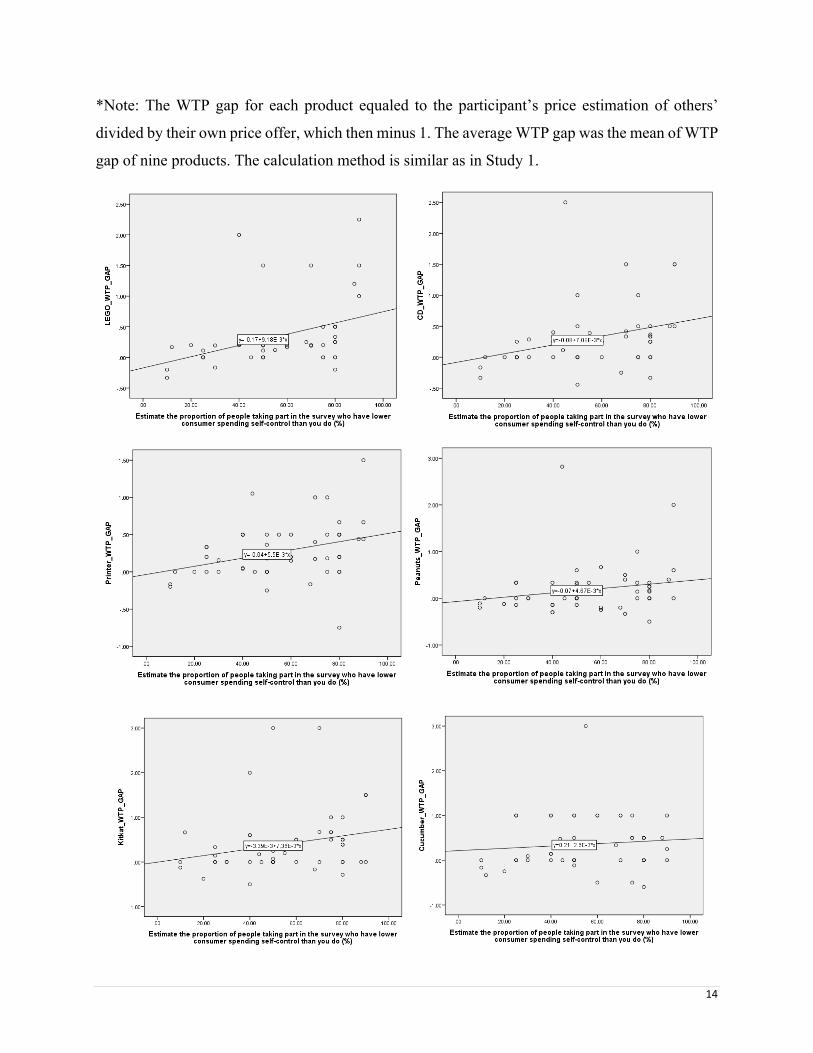
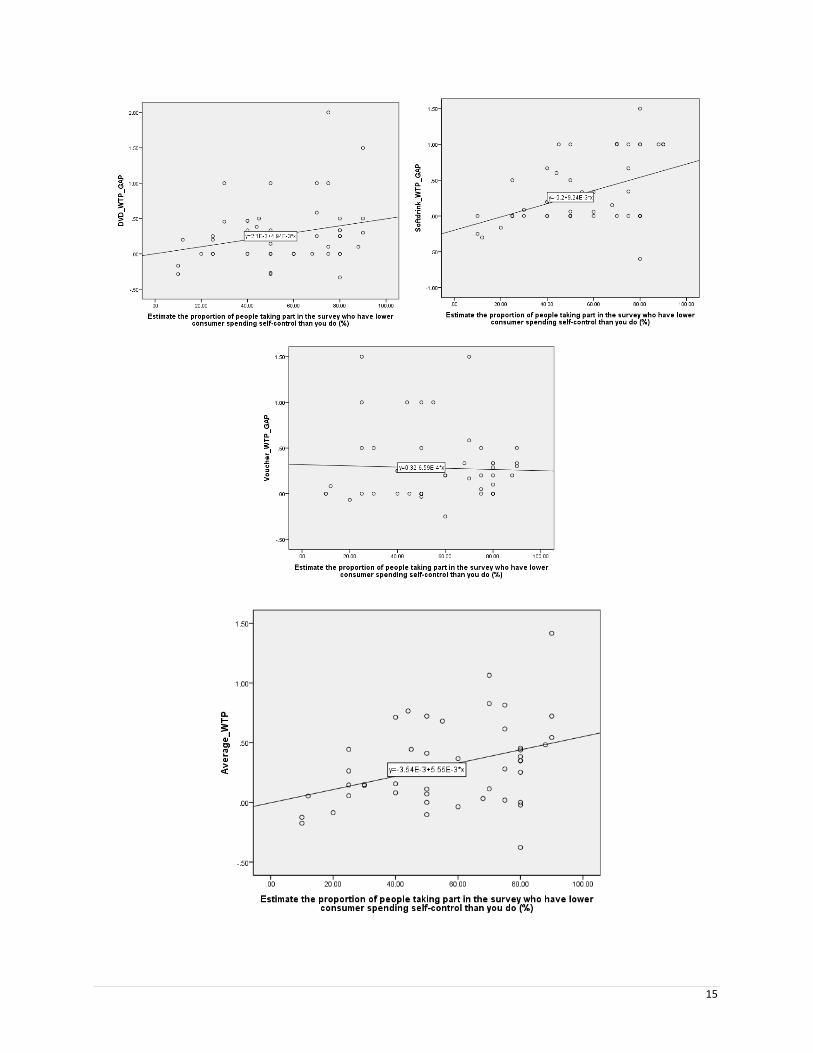
Figure 1: Results of Study 2. The plot shows participants’ WTP gap of nine products as well as
average WTP gap against underestimation proportion of others consumer spending self-control
Page 22
14
*Note: The WTP gap for each product equaled to the participant’s price estimation of others’
divided by their own price offer, which then minus 1. The average WTP gap was the mean of WTP
gap of nine products. The calculation method is similar as in Study 1.
Page 24
16
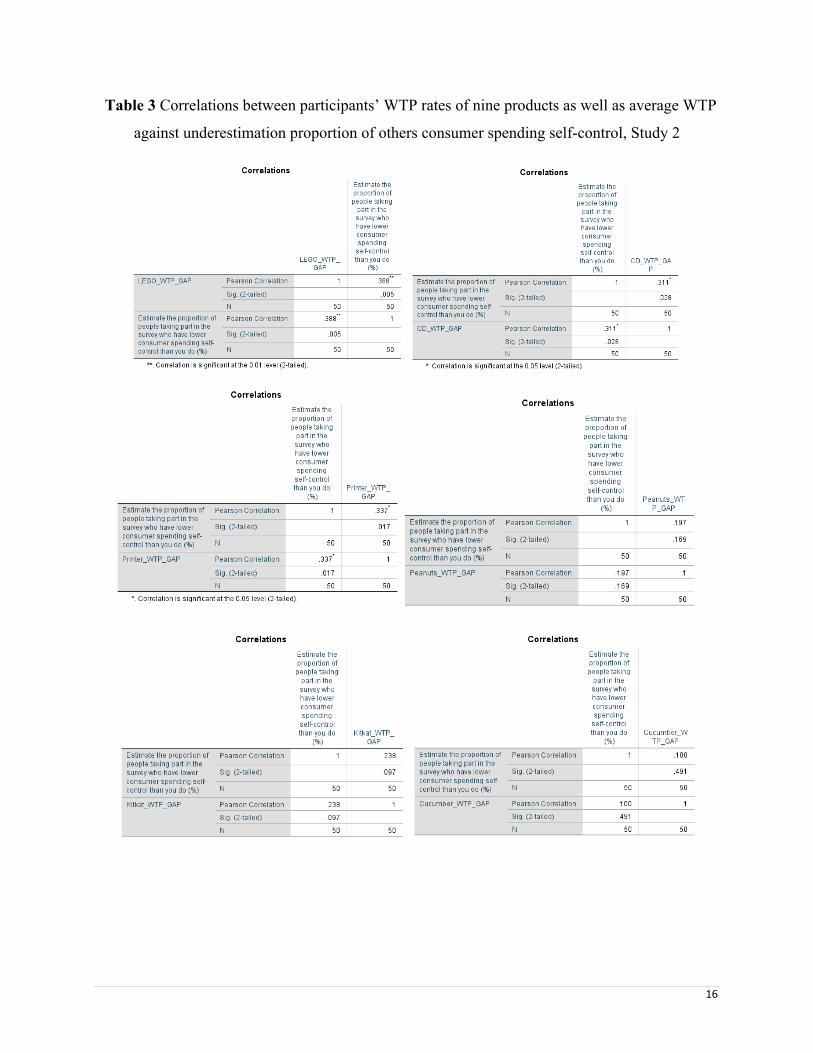
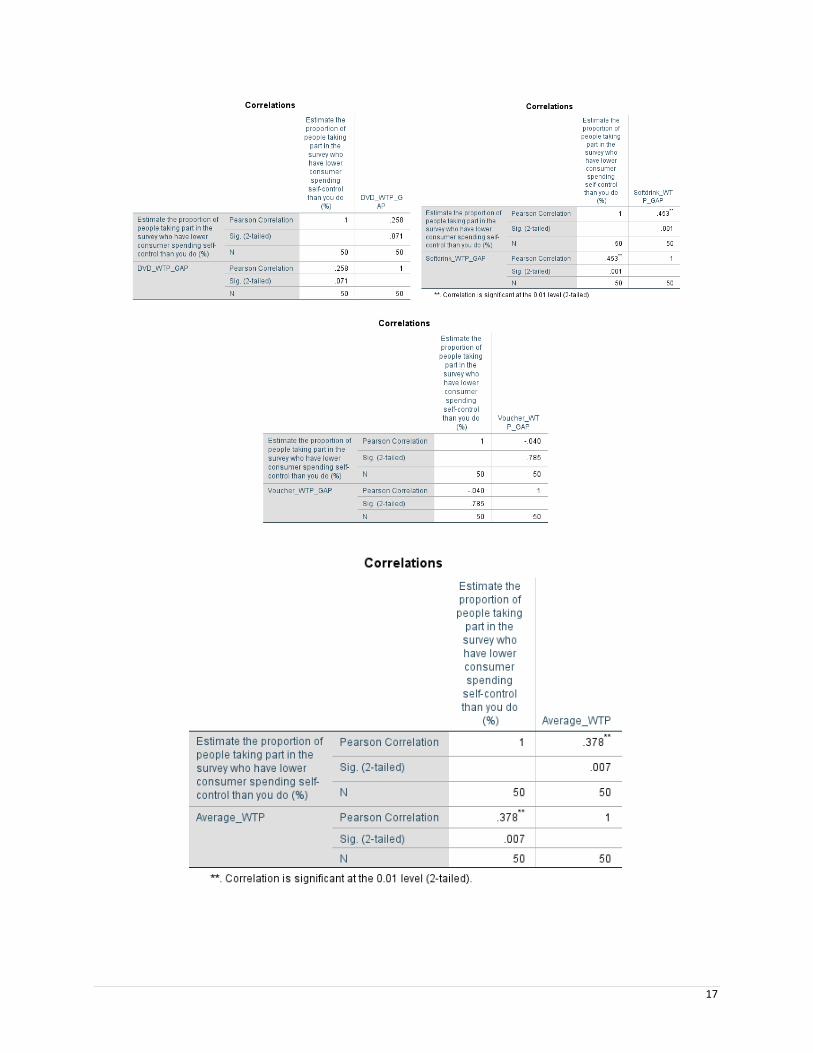
Table 3 Correlations between participants’ WTP rates of nine products as well as average WTP
against underestimation proportion of others consumer spending self-control, Study 2
Page 26
18
First, Figure 1 shows the plot of participants' WTP rates of nine products against
the underestimation proportion of others' consumer spending self-control.
In this study, three findings were illustrated.
First, participants estimated that others would like to pay more than themselves regarding most of
the products, which is clearly shown with data clustering being more above the 0.00 average WTP.
This is also shown in Table 2. For eight out of nine products (p<0.05), consumers generally
estimated that others would pay more than they were willing to.
Second, there is confirmation that respondents tend to believe that others have lower consumer
spending self-control than they do. On average, participants believe that they have higher
consumer spending self-control than 55.84% of the ordinary population. As many as 60% of
participants reported that they had higher consumer spending self-control than the average level.
Only 34% of participants believed that they had lower consumer self-control than others. In other
words, the belief that others' consumer spending self-control could be lower is strong in
participants' minds.
Third, we can also say that the overestimation of others' willingness to pay is positively correlated
with the underestimation of others' consumer spending self-control levels, which is shown in
Figure 1. As such, there is an upward-sloping regression line for the average WTP gap and
consumer spending self-control underestimation. Specifically, when looking at the WTP gap for
each product, eight of the nine regression lines sloped upward, showing the same trend. Moreover,
when we ran a linear regression to test the correlation efficiency between the average WTP and
participants' estimates of the percentage of other participants who had lower consumer spending
self-control than themselves, the p-value was 0.007, which is smaller than
the 0.05 significance threshold. Also, from Table 3, we could observe that there was a significant
correlation between WTP rates and underestimation of others' consumer spending self-control
percentages, with a correlation coefficient of 0.378 and a p-value of 0.007 (smaller than 0.05).
However, when we saw the correlations between each product and consumer spending self-control
estimation rates, the results were not very satisfactory. This might have been caused by subtle and
uncontrollable reasons. Since Frederick (2012) relied heavily on average results without log-
transformation, we chose to accept the result of the correlation test of consumer spending self-
Page 27
19
control and the average WTP gap. Hence, the correlation between underestimation of others'
consumer spending self-control and overestimation of others' willingness to pay is significant.
In brief, the idea of self-control as a reason behind the WTP phenomenon from Frederick's (2012)
reviewer is therefore supported. and our hypothesis 1 is accepted.
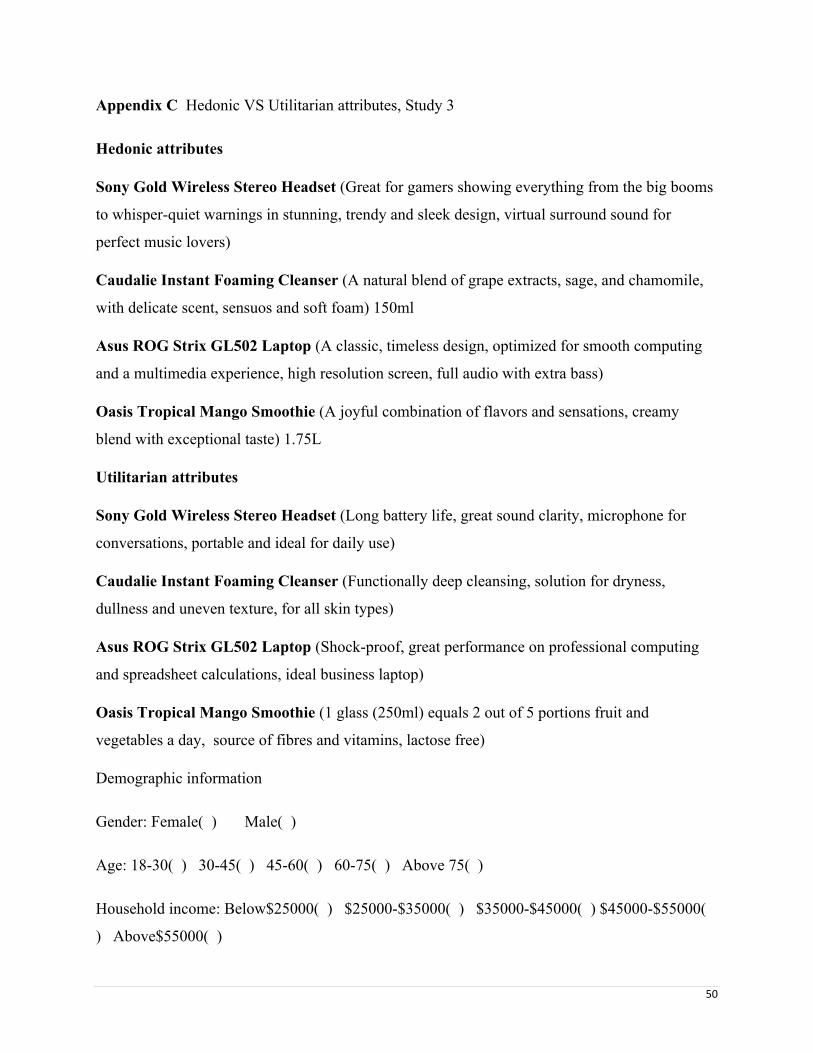
Study 3 Hedonic VS Utilitarian product types
Pretest
Before we started study 3, we did a pretest to find out if the selection of products for this study fits
in hedonic/utilitarian category form the angle of participants' perceptions. Hedonic products
always contain fantasy elements, so they were items like designer clothes, sports cars, and luxury
watches. By contrast, utilitarian products contain instrumental and functional values, for instance
minivans, personal computers and microwaves (Dhar & Werternbroch, 2000). After reading
previous research, we found that it was difficult to equalize different products, but Lu, Liu and
Fang (2016) showed a good example by selecting products with both hedonic and utilitarian
attributes. In our study, we adopted their general product types, but utilized four specific products,
which are Sony Gold Wireless Stereo Headset, Caudalie Instant Foaming Cleanser, Asus ROG
Strix GL502 Laptop, and Oasis Tropical Mango Smoothie.
We adopted the pretest method "Frivolous VS Practical product" from Strahilevitz and Myers'
(1988) study. The only difference is Strahilevitz and Myers (1998) asked participants to choose
between practical, frivolous, practical and frivolous, and neither practical nor frivolous. In our
study, we only asked participants to choose between "Frivolous product" and "Practical product".
Participants
We recruited 20 participants online via CrowdFlower (12 male, 8 female), aged 22-57. (M=37.8,
SD=10.1).
Design and Procedures
Participants first read the instructions for the pretest. Then they were shown the definitions of
"Frivolous products" and "Practical products": "Frivolous Products – Pleasure-oriented
Page 28
20
consumption. Something fun, experiential, and perhaps even ‘decadent'." and "Practical products
– Goal-oriented consumption. Something which one ordinarily buys to carry out a necessary
function or task in one's life." Then they were asked to choose one category for each product.
Results of the pretest
Results showed that the attributes we gave products fit the right direction (hedonic or utilitarian)
as we had expected. Therefore, they could be used as hedonic and utilitarian products in main
study 3.
Main Study 3
Participants
Recruited via CrowdFlower, participants took part online. Therefore, participants who were
under the age of 18 or who could not complete the task were removed from the data pool. The
dataset eventually came to contain 87 participants (34 male, 53 female), aged 19–81 (M=42.8,
SD=12.6).
Design and Procedures
After reading the initial instructions, participants were asked to offer the highest price they would
be willing to pay for four products. Then, as in study 2, they were asked to give their own price
offers for a list of four consumer products first and then estimate others' willingness to pay for the
same products from the list. Participants were randomly assigned to two groups (one consisting of
43 of them and the other 44). In the first group, the headset and laptop had descriptions with
hedonic attributes, while the foaming cleanser and smoothie had utilitarian attributes. In the second
group, the headset and laptop had utilitarian attributes, whereas the foaming cleanser and smoothie
had hedonic attributes. All participants only encountered one of four products that had either
hedonic or utilitarian attributes once.
Demographic information, such as age, gender, and annual pre-tax household income, was
collected at the end.
Page 29
21
Results and Discussions
Table 4 Geometric Mean Price offer for Self- and Other-WTP values of hedonic and utilitarian
attributed products, Study 3
Mean Price offer after log
transformation*
Sig WTP_GAP **
Hedonic Attributes Self Other
Sony Gold Wireless Stereo
Headset
2.13 2.21 .004 0.08
Caudalie Instant Foaming
Cleanser
1.37 1.45 .000 0.08
Asus ROG Strix GL502
Laptop
2.95 3.01 .000 0.06
Oasis Tropical Mango
Smoothie
0.64 0.76 .000 0.12
Average: 0.085
Utilitarian Attributes Self Other
Sony Gold Wireless Stereo
Headset
2.08 2.16 .000 0.08
Caudalie Instant Foaming
Cleanser
1.38 1.44 .000 0.06
Asus ROG Strix GL502
Laptop
2.94 2.99 .000 0.05
Oasis Tropical Mango
Smoothie
0.63 0.73 .000 0.1
Average: 0.0725
*Note: The prices of these four products are widely distributed. Hence, we conducted log
transformation for the price offers given by participants to symmetrize the data.
**Note: WTP_GAP was calculated by using log-transformed mean price offer for self minus
log-transformed mean price offer for others
Page 30
22
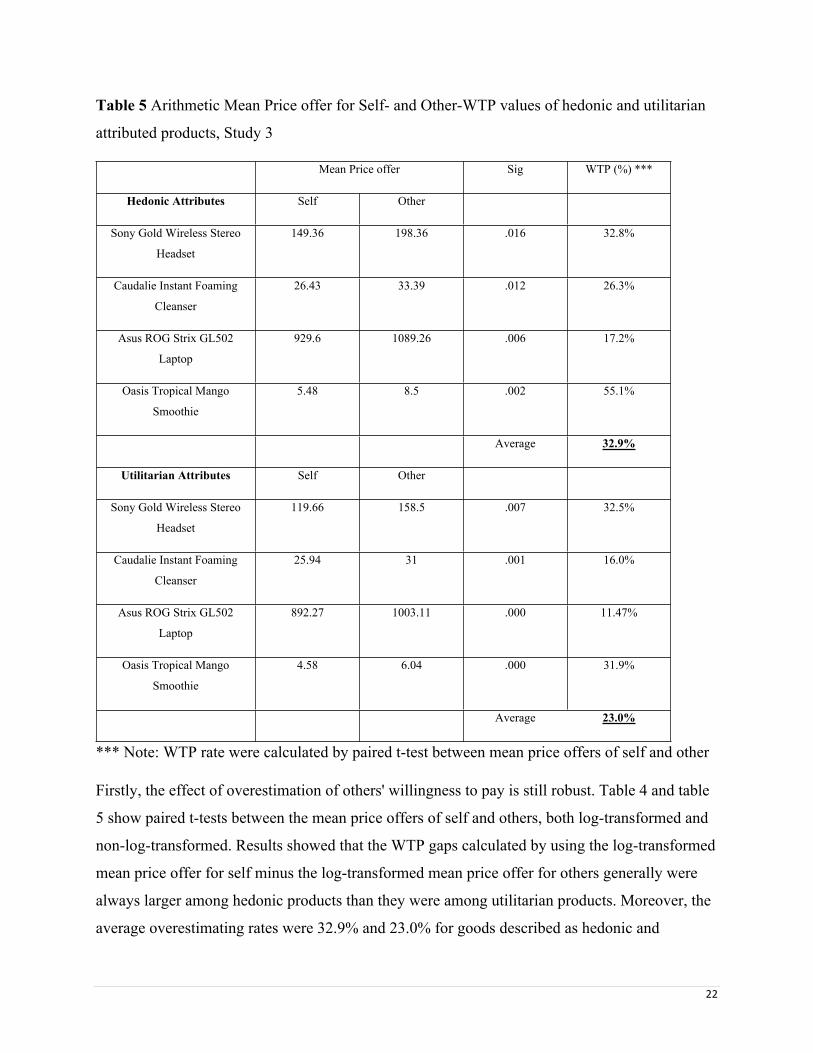
Table 5 Arithmetic Mean Price offer for Self- and Other-WTP values of hedonic and utilitarian
attributed products, Study 3
Mean Price offer Sig WTP (%) ***
Hedonic Attributes Self Other
Sony Gold Wireless Stereo
Headset
149.36 198.36 .016 32.8%
Caudalie Instant Foaming
Cleanser
26.43 33.39 .012 26.3%
Asus ROG Strix GL502
Laptop
929.6 1089.26 .006 17.2%
Oasis Tropical Mango
Smoothie
5.48 8.5 .002 55.1%
Average 32.9%
Utilitarian Attributes Self Other
Sony Gold Wireless Stereo
Headset
119.66 158.5 .007 32.5%
Caudalie Instant Foaming
Cleanser
25.94 31 .001 16.0%
Asus ROG Strix GL502
Laptop
892.27 1003.11 .000 11.47%
Oasis Tropical Mango
Smoothie
4.58 6.04 .000 31.9%
Average 23.0%
*** Note: WTP rate were calculated by paired t-test between mean price offers of self and other
Firstly, the effect of overestimation of others' willingness to pay is still robust. Table 4 and table
5 show paired t-tests between the mean price offers of self and others, both log-transformed and
non-log-transformed. Results showed that the WTP gaps calculated by using the log-transformed
mean price offer for self minus the log-transformed mean price offer for others generally were
always larger among hedonic products than they were among utilitarian products. Moreover, the
average overestimating rates were 32.9% and 23.0% for goods described as hedonic and
Page 31
23
utilitarian, respectively. Hence, it is remarkable to see that the overestimation rate for hedonic
products is greater than for utilitarian goods. This outcome was consistent with our expectations.
Furthermore, we compared the mean price offer (after log transformation) between the same
products with different hedonic or utilitarian attributes for both self and others. In this case, we
could clearly observe that price offers for hedonic products are always higher than utilitarian
products. This was true in every case except for with the foaming cleanser, whose price offer for
utilitarian goods was slightly higher than for its hedonic counterpart. The situation of offering
price for others was even more absolute, with all of the greater offers coming for hedonic
products rather than utilitarian ones.
In short, subjects have a higher overestimation trend towards others' willingness to pay when
they encounter hedonic products rather than utilitarian goods. Thereby, our Hypothesis 2 is
supported.
Study 4 Main effect – Affluence belief and WTP
Participants
Participants took part in the study online and were recruited via CrowdFlower. Eventually,
participants who were under the age of 18 or unable to complete the task were removed from the
dataset. The final dataset comprised 50 participants (23 male, 27 female), aged 22-81 (M=42.7,
SD=12.1)
Design and procedure
This study adopted the methods of one of Matthews' et al. (2016) studies to test the robustness of
the relationship between affluence beliefs and the overestimation of others' willingness to pay.
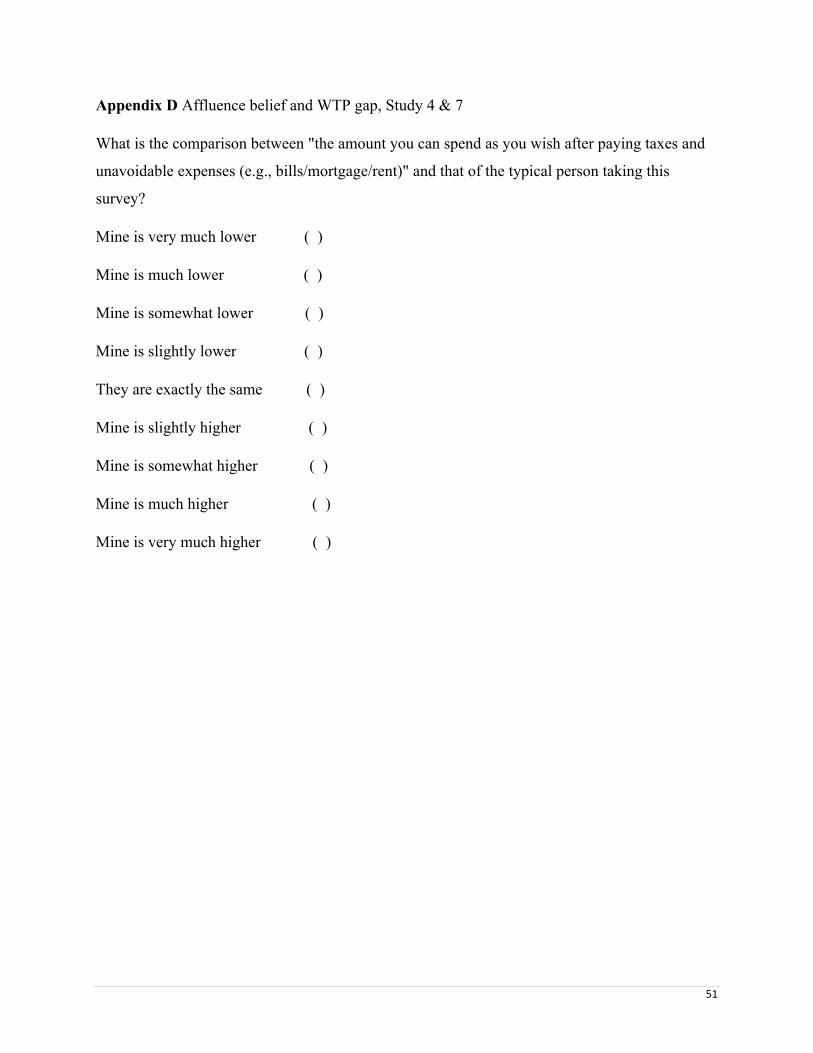
In Study 4, participants were first asked, "What is the comparison between the amount you can
spend as you wish after paying taxes and unavoidable spending (e.g., bills/mortgage/rent) and
that of the typical person who takes this survey?" The judgements were made using a 9-point
scale: "Mine is very much lower"; "Mine is much lower"; "Mine is somewhat lower"; "Mine is
slightly lower"; "They are exactly the same"; "Mine is slightly higher"; and "Mine is very much
higher". It was coded from +4 to -4, respectively. The coding method was referenced from
Page 32
24
Matthews et al. (2016), but the wording of the question was slightly modified to suit Canadian
English users.
On the next page, participants were told to offer prices for a list of four consumer products. They
were told, "Please give the maximum price you would like to pay for each product". Product
selection was based on the availability of their organic counterparts. In the end, four products
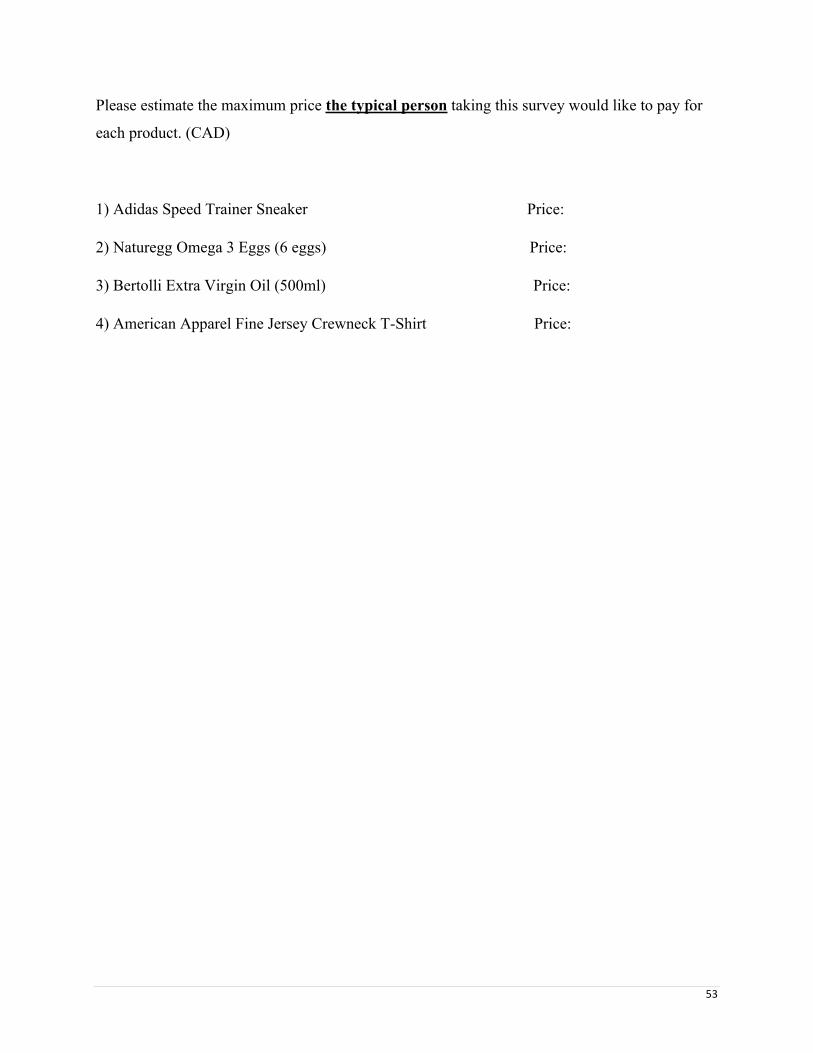
were selected as they had exact ethical alternatives under the same brands in same product lines.
These products were Adidas Speed Trainer Sneaker, Naturegg Omega 3 Eggs (6 eggs), Bertolli
Extra Virgin Olive Oil, and American Apparel Fine Jersey Crewneck T-Shirt.
The next page presented the participants with the same list of consumer products. However, this
time, participants were asked to estimate the typical person taking this survey's willingness to
pay by reading "Please estimate the maximum price the typical person taking this survey would
like to pay for each product."
At the end, the participants reported their demographic information.
Page 33
25
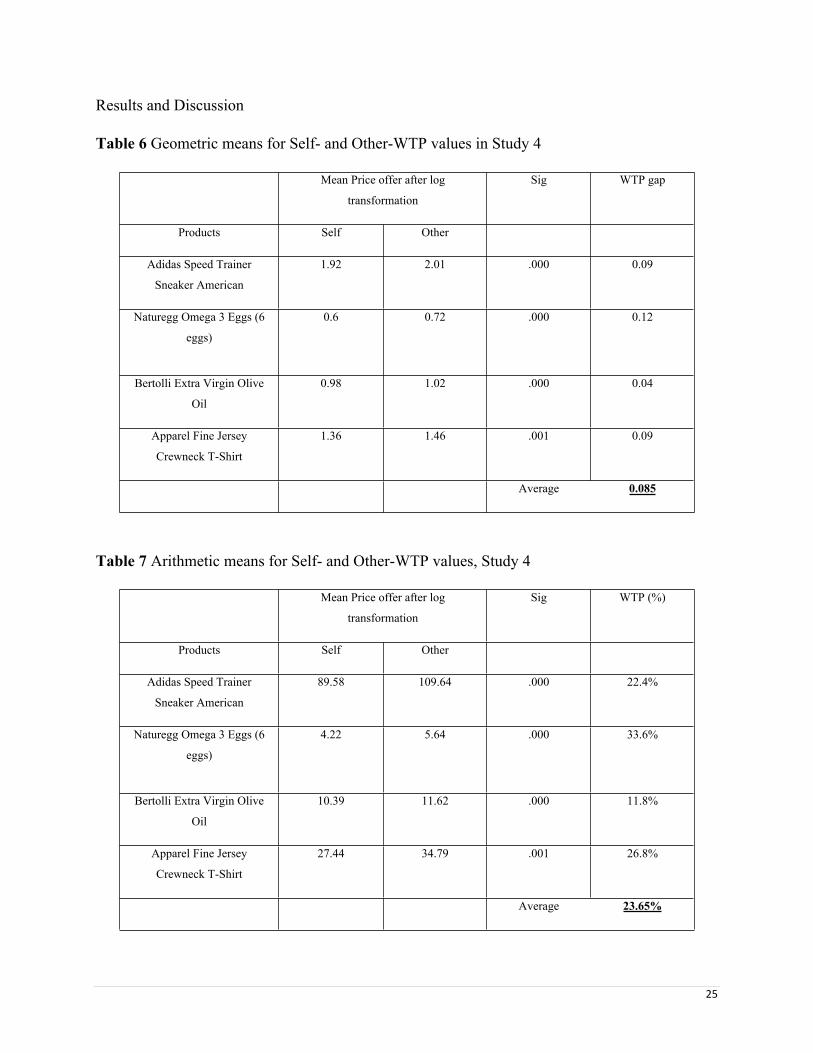
Results and Discussion
Table 6 Geometric means for Self- and Other-WTP values in Study 4
Mean Price offer after log
transformation
Sig WTP gap
Products Self Other
Adidas Speed Trainer
Sneaker American
1.92 2.01 .000 0.09
Naturegg Omega 3 Eggs (6
eggs)
0.6 0.72 .000 0.12
Bertolli Extra Virgin Olive
Oil
0.98 1.02 .000 0.04
Apparel Fine Jersey
Crewneck T-Shirt
1.36 1.46 .001 0.09
Average 0.085
Table 7 Arithmetic means for Self- and Other-WTP values, Study 4
Mean Price offer after log
transformation
Sig WTP (%)
Products Self Other
Adidas Speed Trainer
Sneaker American
89.58 109.64 .000 22.4%
Naturegg Omega 3 Eggs (6
eggs)
4.22 5.64 .000 33.6%
Bertolli Extra Virgin Olive
Oil
10.39 11.62 .000 11.8%
Apparel Fine Jersey
Crewneck T-Shirt
27.44 34.79 .001 26.8%
Average 23.65%
Page 34
26
Figure 2 Results of Study 4. The plot shows participants’ WTP gaps against affluence belief of
others’ towards four products
First, from Table 6, we can see that the WTP effect is significant for all four products after
conducting a paired t-test of log-transformed mean price offers. We also calculated the WTP gap
by using mean price estimates for others minus the one for the self. All values are positive with an
average WTP gap of 0.085. Moreover, the WTP rate was also calculated by comparing the real
mean price offers in Table 7, which showed the same results as the WTP gap, with an average
WTP rate of 23.65%. Hence, all the figures show a robustness of the WTP effect.
Second, the affluence belief of others is positively related to the WTP gap. We plotted Figure 2
using the WTP gap against a subjective difference in discretionary income for each of the four
Page 35
27
products. Therefore, greater values on the y-axis stand for the greater overestimation of others'
willingness to pay while greater values on the x-axis represent the stronger affluence belief of
others. From Figure 2, we can clearly find that when people feel they have less discretionary
affluence than others, they tend to overestimate others' willingness more, illustrated as all four
rising regression lines. Therefore, the relationship between affluence belief and WTP gap in
Matthews et al.'s (2016) studies is also supported here.
Study 5 A causal link between beliefs about others’ affluence and beliefs about their
willingness to pay for ethical products
Similar steps were adopted from Matthews et al. (2016) to build the causal link between affluence
belief and willingness to pay for ethical products.
Participants
Participants were recruited via CrowdFlower, and IDs that had been involved in Studies 1 and 2a
were excluded. Eventually, in total, there was a sample of 117 participants (44 male and 73 female)
aged 18-81 (M=42.2, SD=12.7).
Design and procedure
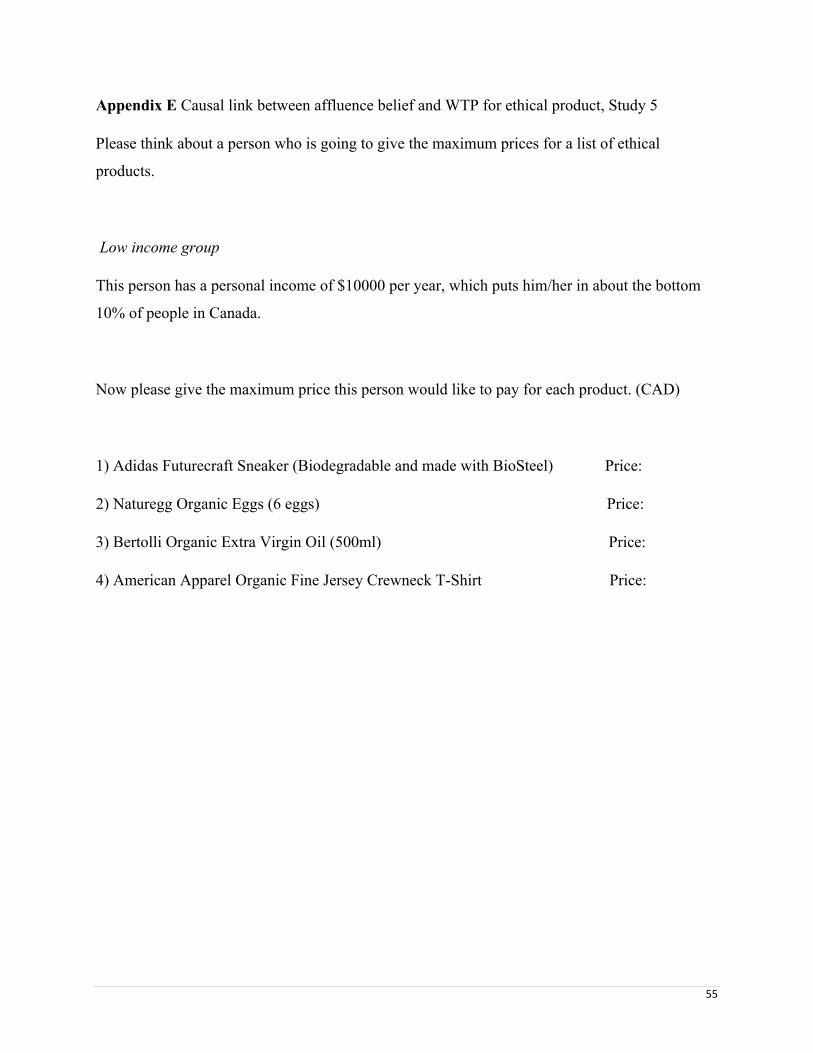
Participants were asked to imagine that a person is going to pay the maximum prices for a series
of consumer products. On the next page, participants were randomly assigned to a "low income"
(N=55) or a "high income" (N=62) condition. They were told that the person has a personal income
of either $10000 or $90000 per year, "which puts them in about the bottom [and top] 10 percentile
of people in Canada."
The next page showed a list of ethical products. Participants were asked to answer, "What is the
maximum price would the person pay for each product?" They entered their responses in a text
box for each product. Eventually, they answered questions about their demographic information.
Page 36
28
Results and discussion
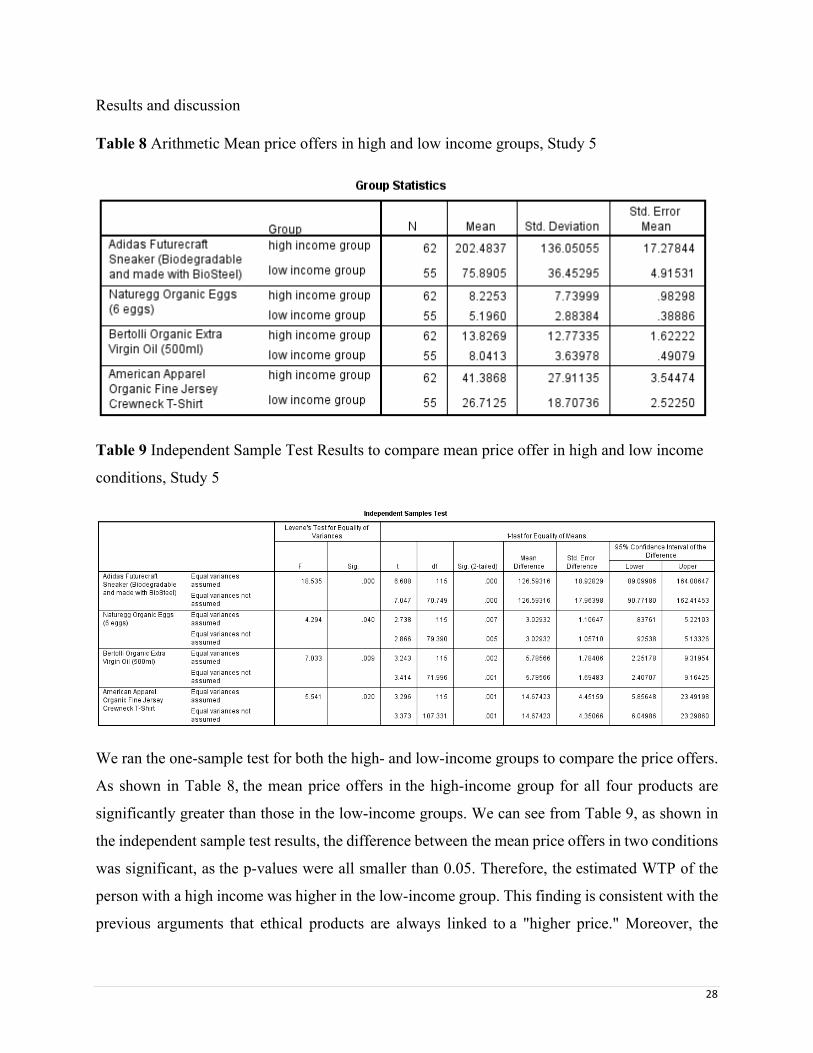
Table 8 Arithmetic Mean price offers in high and low income groups, Study 5
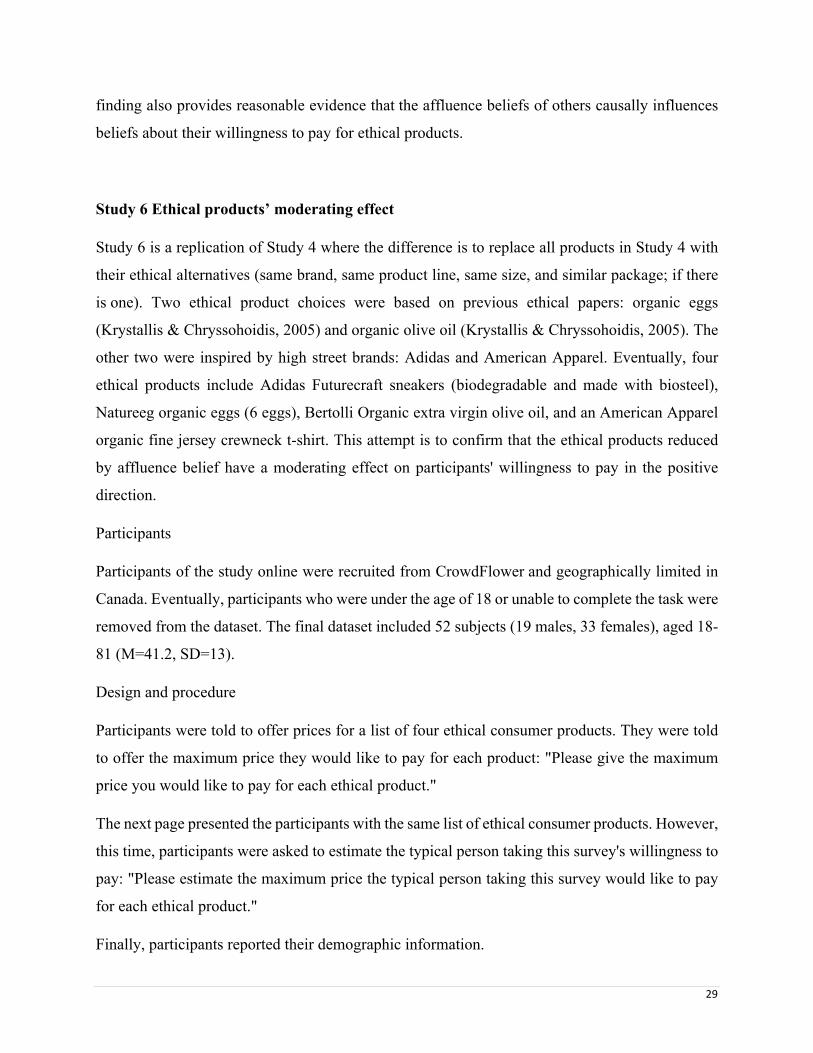
Table 9 Independent Sample Test Results to compare mean price offer in high and low income
conditions, Study 5
We ran the one-sample test for both the high- and low-income groups to compare the price offers.
As shown in Table 8, the mean price offers in the high-income group for all four products are
significantly greater than those in the low-income groups. We can see from Table 9, as shown in
the independent sample test results, the difference between the mean price offers in two conditions
was significant, as the p-values were all smaller than 0.05. Therefore, the estimated WTP of the
person with a high income was higher in the low-income group. This finding is consistent with the
previous arguments that ethical products are always linked to a "higher price." Moreover, the
Page 37
29
finding also provides reasonable evidence that the affluence beliefs of others causally influences
beliefs about their willingness to pay for ethical products.
Study 6 Ethical products’ moderating effect
Study 6 is a replication of Study 4 where the difference is to replace all products in Study 4 with
their ethical alternatives (same brand, same product line, same size, and similar package; if there
is one). Two ethical product choices were based on previous ethical papers: organic eggs
(Krystallis & Chryssohoidis, 2005) and organic olive oil (Krystallis & Chryssohoidis, 2005). The
other two were inspired by high street brands: Adidas and American Apparel. Eventually, four
ethical products include Adidas Futurecraft sneakers (biodegradable and made with biosteel),
Natureeg organic eggs (6 eggs), Bertolli Organic extra virgin olive oil, and an American Apparel
organic fine jersey crewneck t-shirt. This attempt is to confirm that the ethical products reduced
by affluence belief have a moderating effect on participants' willingness to pay in the positive
direction.
Participants
Participants of the study online were recruited from CrowdFlower and geographically limited in
Canada. Eventually, participants who were under the age of 18 or unable to complete the task were
removed from the dataset. The final dataset included 52 subjects (19 males, 33 females), aged 18-
81 (M=41.2, SD=13).
Design and procedure
Participants were told to offer prices for a list of four ethical consumer products. They were told
to offer the maximum price they would like to pay for each product: "Please give the maximum
price you would like to pay for each ethical product."
The next page presented the participants with the same list of ethical consumer products. However,
this time, participants were asked to estimate the typical person taking this survey's willingness to
pay: "Please estimate the maximum price the typical person taking this survey would like to pay
for each ethical product."
Finally, participants reported their demographic information.
Page 38
30
Results and Discussion
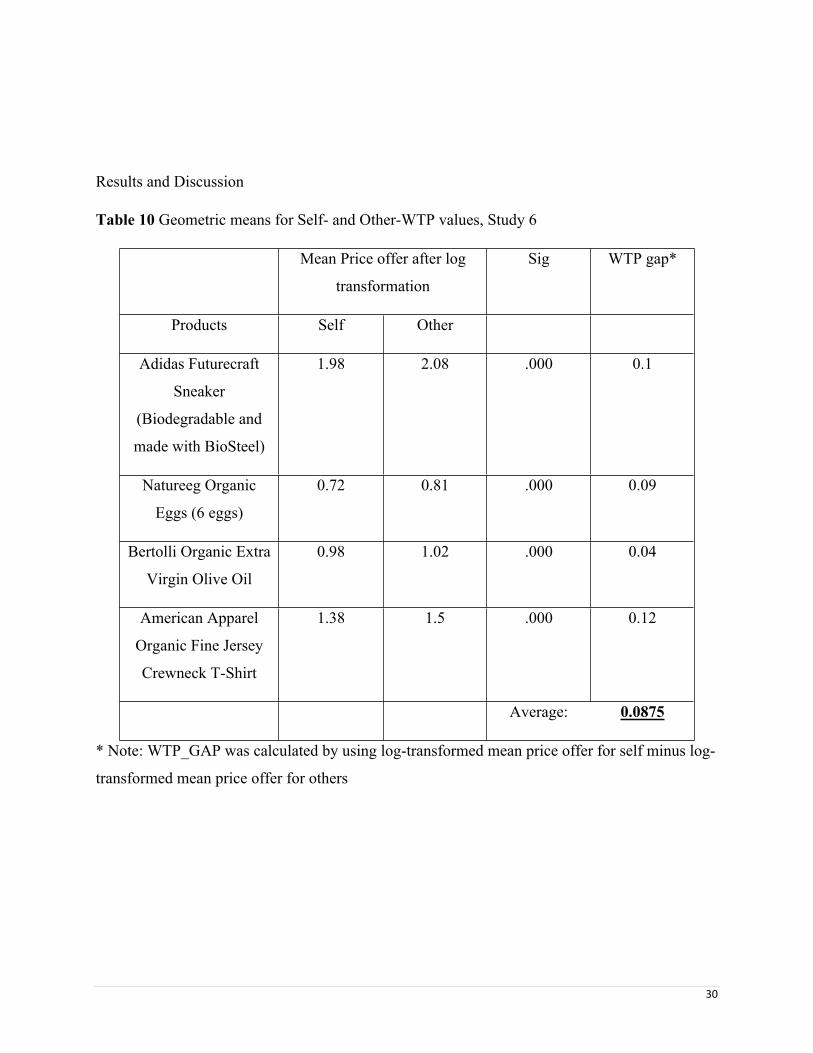
Table 10 Geometric means for Self- and Other-WTP values, Study 6
Mean Price offer after log
transformation
Sig WTP gap*
Products Self Other
Adidas Futurecraft
Sneaker
(Biodegradable and
made with BioSteel)
1.98 2.08 .000 0.1
Natureeg Organic
Eggs (6 eggs)
0.72 0.81 .000 0.09
Bertolli Organic Extra
Virgin Olive Oil
0.98 1.02 .000 0.04
American Apparel
Organic Fine Jersey
Crewneck T-Shirt
1.38 1.5 .000 0.12
Average: 0.0875
* Note: WTP_GAP was calculated by using log-transformed mean price offer for self minus log-
transformed mean price offer for others
Page 39
31
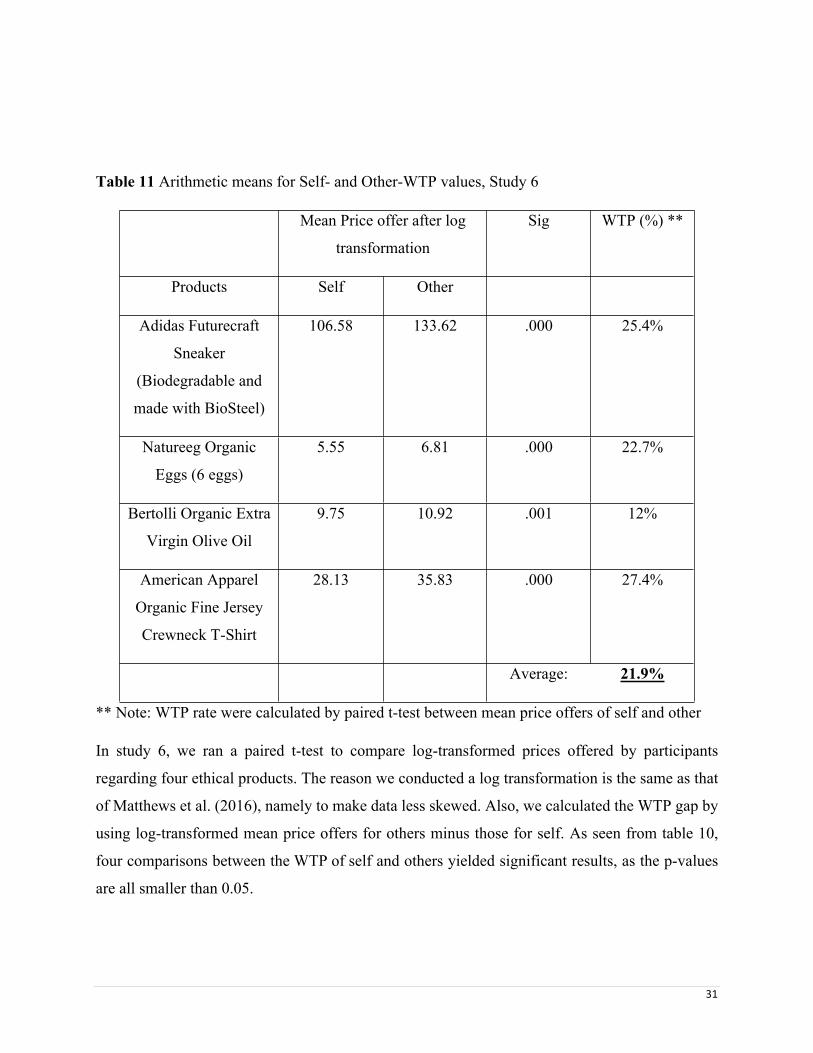
Table 11 Arithmetic means for Self- and Other-WTP values, Study 6
Mean Price offer after log
transformation
Sig WTP (%) **
Products Self Other
Adidas Futurecraft
Sneaker
(Biodegradable and
made with BioSteel)
106.58 133.62 .000 25.4%
Natureeg Organic
Eggs (6 eggs)
5.55 6.81 .000 22.7%
Bertolli Organic Extra
Virgin Olive Oil
9.75 10.92 .001 12%
American Apparel
Organic Fine Jersey
Crewneck T-Shirt
28.13 35.83 .000 27.4%
Average: 21.9%
** Note: WTP rate were calculated by paired t-test between mean price offers of self and other
In study 6, we ran a paired t-test to compare log-transformed prices offered by participants
regarding four ethical products. The reason we conducted a log transformation is the same as that
of Matthews et al. (2016), namely to make data less skewed. Also, we calculated the WTP gap by
using log-transformed mean price offers for others minus those for self. As seen from table 10,
four comparisons between the WTP of self and others yielded significant results, as the p-values
are all smaller than 0.05.
Page 40
32
Therefore, firstly, we could see that the mean prices offered for every product, for both self and
others, are higher than their counterparts in study 4, which is consistent with previous
literature's determining that people do consider ethical products to be more expensive.
Secondly, the overestimation of WTP between self and others is also significant here among
ethical products. As shown in table 10, all prices estimated that others would pay are higher than
self-paid prices. And the paired t-test indicates that the comparison is significant.
Third, if we compare Table 10 and Table 6 in Study 4, we can clearly see that not only are all
prices offered for both self and others higher in Table 11 (for ethical products), but also the WTP
gap between self and others is always larger in Table 10 (three out of four products, except the
eggs). Moreover, we can observe the overestimation of the WTP rate calculated from arithmetic
price means of bio sneakers, organic oil, and ethical t-shirts, all show a higher WTP rate when
compared with their non-ethical counterparts in Study 4. This shows us that when consumers
estimate others' willingness to pay for ethical products, they tend to overestimate the price gap to
a larger extent. Since the causal link between affluence beliefs and ethical products was already
tested in Study 5, these findings combined support our Hypothesis 3: When the overestimation of
WTP is induced by affluence beliefs, if it is for an ethical product, people tend to overestimate
more than they estimate others' willingness to pay for a general product.
Study 7 Self-control, Affluence belief, hedonic VS utilitarian and WTP
Participants
Participants of the study were recruited from CrowdFlower, geographically limited to Canada.
Eventually, participants who were under the age of 18 or unable to complete the task were removed
from the dataset. The final dataset included 88 subjects (30 males, 58 female), aged 18-66
(M=40.2, SD=12.0).
Design and procedure
This study is a combination of factors tested in our previous studies. The purpose of this study was
to discover potential relationships between consumer spending self-control, affluence belief, and
hedonic and utilitarian product categories.
Page 41
33
Our participants were put into two conditions, high income and low income, with 46 and 42
subjects each, by informing them that their peer participants in the same survey had an average
income of $90000 [or $10000], which put them in the top [or bottom] 10% revenue population in
Canada.
To measure if this manipulation actually worked, we asked participants to compare their
discretionary income to that their peer participants' in the same survey: "What is the comparison
between the amount you can spend as you wish after paying taxes and unavoidable spending (e.g.,
bills/mortgage/rent), and that of the typical person who takes this survey?" The question was
modified from Matthews et al (2016)’s study, by changing words to fit Canadian English users.
Then, in both peer income conditions, participants were asked to compare of consumer spending
self-control between themselves and others: "Estimate the proportion of people taking part in the
survey who have lower consumer spending self-control than you do (%)."
After that, participants were told to give the maximum price for a list of four products. Then, they
were asked to estimate the maximum price what the typical person taking the same survey would
like to pay. The product selection was the same as in Study 3, which contained four products with
either hedonic or utilitarian attributes. However, all participants only encountered each
product once. In other words, they only witnessed either the hedonic or utilitarian attribute of a
product, not the other one.
At the end, the demographic information of the participants was recorded.
Page 42
34
Results and Discussions
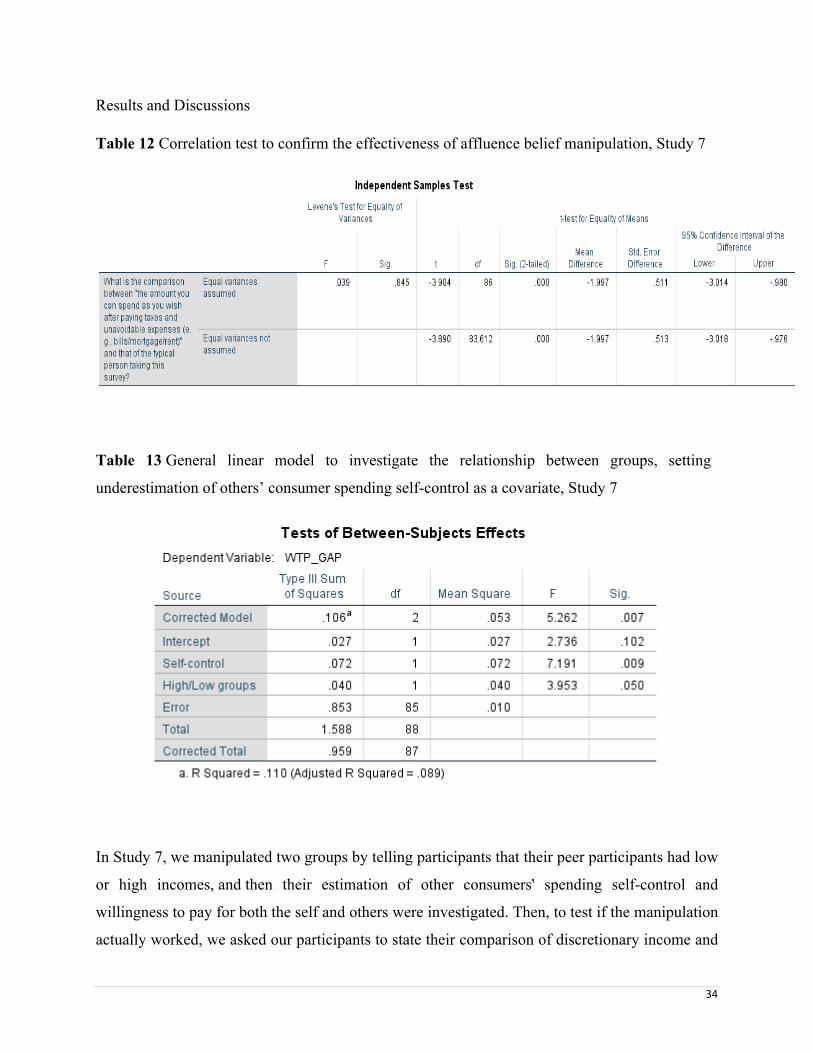
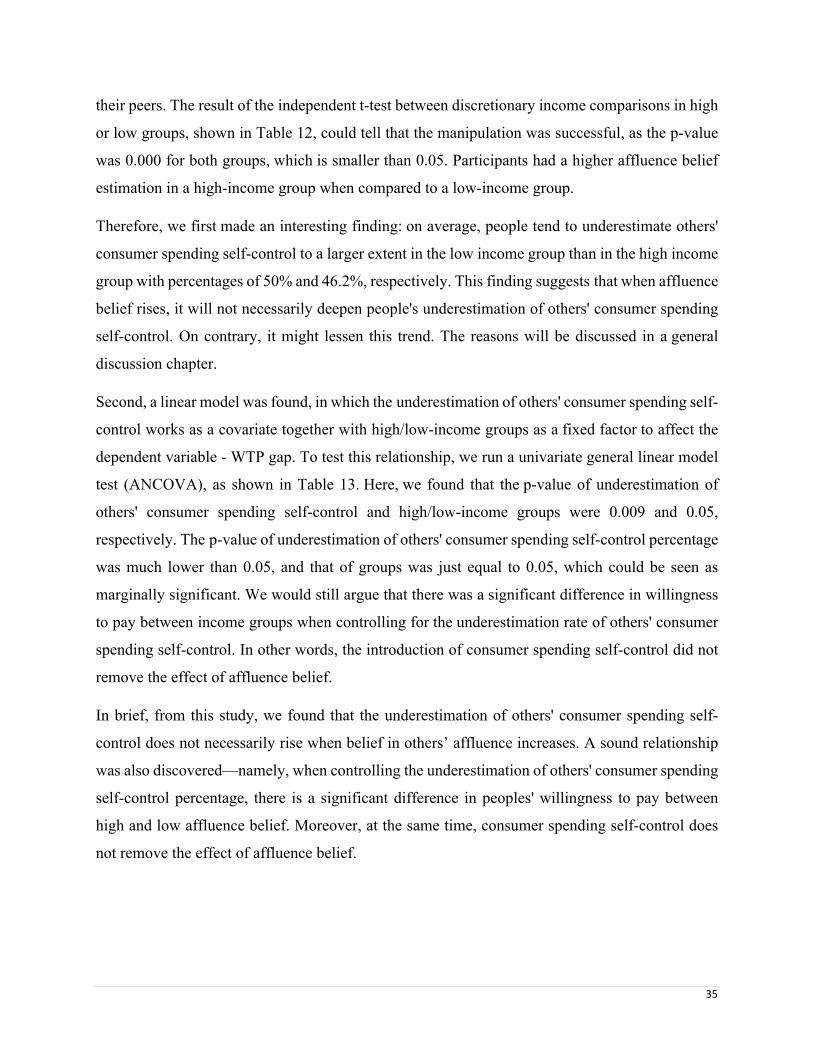
Table 12 Correlation test to confirm the effectiveness of affluence belief manipulation, Study 7
Table 13 General linear model to investigate the relationship between groups, setting
underestimation of others’ consumer spending self-control as a covariate, Study 7
In Study 7, we manipulated two groups by telling participants that their peer participants had low
or high incomes, and then their estimation of other consumers' spending self-control and
willingness to pay for both the self and others were investigated. Then, to test if the manipulation
actually worked, we asked our participants to state their comparison of discretionary income and
Page 43
35
their peers. The result of the independent t-test between discretionary income comparisons in high
or low groups, shown in Table 12, could tell that the manipulation was successful, as the p-value
was 0.000 for both groups, which is smaller than 0.05. Participants had a higher affluence belief
estimation in a high-income group when compared to a low-income group.
Therefore, we first made an interesting finding: on average, people tend to underestimate others'
consumer spending self-control to a larger extent in the low income group than in the high income
group with percentages of 50% and 46.2%, respectively. This finding suggests that when affluence
belief rises, it will not necessarily deepen people's underestimation of others' consumer spending
self-control. On contrary, it might lessen this trend. The reasons will be discussed in a general
discussion chapter.
Second, a linear model was found, in which the underestimation of others' consumer spending self-
control works as a covariate together with high/low-income groups as a fixed factor to affect the
dependent variable - WTP gap. To test this relationship, we run a univariate general linear model
test (ANCOVA), as shown in Table 13. Here, we found that the p-value of underestimation of
others' consumer spending self-control and high/low-income groups were 0.009 and 0.05,
respectively. The p-value of underestimation of others' consumer spending self-control percentage
was much lower than 0.05, and that of groups was just equal to 0.05, which could be seen as
marginally significant. We would still argue that there was a significant difference in willingness
to pay between income groups when controlling for the underestimation rate of others' consumer
spending self-control. In other words, the introduction of consumer spending self-control did not
remove the effect of affluence belief.
In brief, from this study, we found that the underestimation of others' consumer spending self-
control does not necessarily rise when belief in others’ affluence increases. A sound relationship
was also discovered—namely, when controlling the underestimation of others' consumer spending
self-control percentage, there is a significant difference in peoples' willingness to pay between
high and low affluence belief. Moreover, at the same time, consumer spending self-control does
not remove the effect of affluence belief.
Page 44
36
General Discussion
In this paper, there are seven research goals which we achieved in our research. These are: (1) the
robustness of the overestimation of others' WTP; (2) the explanation of the overestimation of
others' WTP – the underestimation of others' consumer spending-self control; (3) the moderating
effect of hedonic/utilitarian product attributes on the WTP gap; (4) the robustness of the existing
explanation – affluence belief; (5) the link between affluence belief and ethical products; (6) the
moderating effect of ethical products on the WTP gap; and (7) a deeper investigation to examine
the underestimation of others' consumer spending self-control. They were tested in seven studies
in an orderly fashion.
In study 1, we retested the robustness of the phenomenon – the overestimation of others'
willingness to pay. We found that this phenomenon exists significantly among the consumer
products we selected. Our participants consistently overestimated others' price offers by the
"typical person." Also the paired t-tests between price offer for self and others are generally
significant. Therefore, Frederick's (2012) finding of overestimation of others' willingness to pay is
constant and robust.
In Study 2, we explored a new explanation of the WTP gap, which is the underestimation of others'
consumer spending self-control. This possibility was first mentioned in Frederick's (2012) future
research segment, which was recommended as a direction by one of the reviewers. We narrowed
the general self-control to a more specified concept, which was consumer spending self-control
(Haws et al., 2012). As a result, participants had a trend by which to underestimate others'
consumer spending self-control. Moreover, overestimation of others' WTP for a list of commercial
products, on average, was found to be positively related to the underestimation effect. Hence, the
underestimation of others' consumer spending self-control as an explanation to the "X effect" --
overestimation of others' WTP -- is primarily supported. Hence, it is assumed that people do have
a trend to be biased as a subconscious “double standard” when they rate themselves and estimate
others. When the trait is good, people tend to overestimate their own capabilities, such as consumer
spending self-control; however when the behavior is considered to be a little bit guilty or painful,
such as spending money, they are more likely to exaggerate others’ possibility of conducting it.
Later, in Study 3, we tried to emphasize the same products with different hedonic or utilitarian
attributes to induce participants' different perceptions. This attempt was not very common in
Page 45
37
previous literature, so we expected that the findings might be creative. We first conducted a pretest
to confirm the correct setting of hedonic and utilitarian attributes. As a result, our participants did
overestimate others' WTP to a larger extent when they faced the products with hedonic attributes
than when they offered prices and estimated utilitarian-attributed products for others.
In study 4, in the end, we re-proved the existence of a reason for WTP gap - affluence belief of
others' (Matthews et al, 2016) with four consumer products we selected. Results showed that when
affluence belief was raised, WTP gap also increased. This is consistent with previous findings that
hedonic products are more likely to be selected for others, but are estimated as having a higher
price.
Study 5 was an adopted research method from Matthews et al. (2016). In their study, there was a
causal link to prove between affluence belief and willingness to pay. Nevertheless, in our study,
we adopted the method but tried to test another causal link between affluence belief and ethical
products. When people were told to have either high income or low income, their price offers
towards ethical products were highly different. Noticeably, we used a list of four ethical products,
which were precisely the alternatives of conventional products in study 4, with same brand, under
same product lines, and with similar size or packaging. Eventually, the causal link was supported.
This suggests that the previous research pointing out that ethical products have a price premium
and are linked to wealthier groups is sound and consistent with our current findings.
Study 6 was a confirmation of ethical products' moderating effect on WTP phenomenon. The
methodology was same as Study 4, and the consumer products were same as Study 5. The design
of research was consistent from Studies 4 and 5 to remain the validity of results. The results showed
that there was not only a generally higher price offer phenomenon among ethical products, but
likewise a larger WTP gap among ethical products than among conventional products as well.
In the last study, Study 7, we combined and tested the potential relation(s) between the
underestimation of other consumers' spending self-control, affluence belief, and WTP gap. In
short, we found a meaningful relationship that noted that when controlling underestimation of
other consumers' spending self-control percentages, there is a significant difference in people's
willingness to pay between people having high and low affluence beliefs. Hence, we could say
that consumer spending self-control did not remove the effect of affluence beliefs. This suggests
that underestimation of others’ consumer spending self-control, and affluence believes are two
Page 46
38
separate factors that could both explain the overestimation effect. Moreover, we found that when
people believe that others are more affluent, this does not necessarily lead to underestimation of
those others’ consumer spending self-control. This may be related to the thought of elite theory,
which describes the high-income group as having high culture, rationality, self-control, and
respect and is worth future research dedication.
In conclusion, this study suggested that there is a new explanation for the overestimation of others'
willingness to pay effect, which is the underestimation of other consumers' spending self-control.
When people underestimate others' consumer spending self-control more, they tend to
overestimate others' willingness to pay to a larger extent. Moreover, new moderators of the WTP
gap were found, which are hedonic/utilitarian products and conventional/ethical products.
Specifically, people overestimate others' willingness to pay for hedonic products more than for
utilitarian alternatives; they have a larger overestimation rate for ethical products than for their
conventional counterparts. Last but not least, there was a relation found when controlling
for underestimation of others' consumer spending self-control percentage; there is a significant
difference in peoples' willingness to pay between people having high and low affluence belief. The
underestimation of others' consumer spending self-control does not remove the effect of affluence
belief.
Contributions
This project fills a lack of research on the topic of others' WTP and sheds light on the validity of
one explanation of the phenomenon, as well as two moderators of the WTP gap.
Our first contribution is providing an assessment of the merit of proposed factors underlying the
phenomenon of overestimation of others' WTP. We confirm that there is an explanation based on
an estimate of others' consumer spending self-control capabilities being a significant predictor of
over-estimation effects. This offers more directions to the academic area when looking at
the overestimation of others' WTP effect. Together with affluence belief as a reason behind WTP
effect found by Matthews et al (2016), now there are two explanations, which could therefore
widen the current research paths and bring more potentials, because researchers could use these
two factors as new starting points.
Page 47
39
Second, we make a theoretical contribution by extending existing research to assess whether or not
overestimation effects vary systematically across product types. Although several different stimuli
were used by Frederick (2012) and Mathews et al. (2016), product type was not incorporated as a
factor in either article; nor was it systematically varied. Within the broad umbrella of product type,
we see two classifications of products that can yield potential moderators: the classification of
products into hedonic (vs. utilitarian) products and the classification of products into those with a
significant number of ethical attributes vs. those without such attributes. With regard to the first
classification, we find that hedonic products elicit higher levels of overestimation of others' WTP
than utilitarian attributed products. As for products with ethical attributes, these products are
commonly found to charge premium prices, and it is consistent that inferences made about the
values of people who buy these products, as well as their affluence, leads to the overestimation of
others' WTP.
Thirdly, this research makes an applied contribution in that the accurate estimation of others' WTP
is a key input into pricing decisions both for individuals and companies. Just as
the underestimation of others' WTP may lead to foregone profits and other opportunity costs,
chronic overestimation of others' WTP is likely to lead to lost sales, excessive inventory holding
costs, and poor investment decisions. It may also make a public policy contribution by making
resale markets more efficient, if sellers can choose realistic prices which allow the purchase of
used goods instead of those used goods ending up in landfills.
Fourthly, the two moderators to the X effect we find out would also contribute to strategic
implications, such as promotion strategy design and location strategy. For example, product
managers may want to emphasize different hedonic/utilitarian attributes on the same products
when they need to promote in such a direction. Moreover, marketers might wish to use the
ethical/conventional product moderator flexibly in their location strategy—for instance,
conducting promotions of ethical products in a CBD with a high distribution of companies and
business offices, which might witness a greater success than if such promotions occurred in a
general supermarket.
Limitations and future research directions
First, the term of "typical person taking the same survey" is used in our studies and also being the
used as the compared subject in other self-other studies, such as Frederick (2012) and Matthews
Page 48
40
et al. (2016). Similar terms are like "the other people taking this survey," "the median price that
other people are taking this survey give," etc. However, the effectiveness of these terms used to
make participants understand is under-examined. Hence, future methodology research could focus
on the effectiveness of the phrasing from both psychological and linguistic ways.
Second, different people may have different attitudes toward product types because of their various
personalities, so the overestimation effect may be moderated by personalities. And also, there were
not previous research in WTP field dressing on personality varieties. Hence, this could be a very
interesting research direction.
Third, people's sensitivity to different kinds of ethical products is different based on their
background, lifestyle, exposure to ethical categories, and influence of mass media. So it will be
interesting to investigate people's reaction and willingness to pay to different types of ethical
products, together with those potential moderators, such as education background, gender,
knowledge of a specific ethical product category, etc.
Fourth, we did have few outliers in the results (i.e., in Studies 1 and 2) that opposed our hypotheses
and the majority of our results. Also outliers changed, for example peanuts and DVD were not
significant in Study 1, but DVD turned to be significant in Study 2. Hence, it might be meaningful
to dig deeper into the reasons of those outliers, which will probably bring new moderators or
special conditions to consider. Thus, the exploration of these outlier products may be worth further
work, as well.
Fifth, our sample sizes are relatively limited and could be developed to a larger scale. This
could also be one reason why we did have some outliers in our results. Therefore, future studies
could expand sample sizes to increase validity. What's more, our research is limited to one country;
hence, future research might look into the same issue from a cross-country perspective.
Sixth, this research on consumer spending self-control is primary and could be enriched further by
adding empirical work that considers several aspects of consumer spending self-control, the factors
that could strengthen or weaken consumer spending self-control estimation. Also, the timing of
perception of others’ consumer spending self-control is also worth researching on, for example,
when the perception is near to the time to make a purchase decision, does it make a difference to
influence WTP effect?
Page 50
42
References
Arnould, E, J., Price, L, L., & Otnes, C. (1999). Making Consumption Magic: A Study of White-
Water River Rafting. Journal of Contemporary Ethnography, 28 (1), 33–68.
Babin, B.J., Darden, W.R., & Griffin, M. (1994). Work and/or fun: Measuring hedonic and
utilitarian shopping value. Journal of Consumer Research, 20, 4, 644–656.
Basu, A. K., & Hicks, R. L. (2008). Label performance and the willingness to pay for Fair Trade
coffee: A cross-national perspective. International Journal of Consumer Studies, 32, 470–478.
Baumeister, R, F. (2002). Yielding to Temptation: Self-control Failure, Impulsive Purchasing, and
Consumer Behavior. The Journal of Consumer Research, Vol. 28, No. 4 (March., 2002). 670-676.
Baumeister, R, F., Vohs, K, D., & Tice, D, M. (2007). The Strength Model of Self-Control.
Association for Psychological Science. 16(6). 351-355.
Becker, G, M., DeGroot, M, H., & Marschak, J. (1964). Measuring Utility by a Single-Response
Sequential Method. Behavioral Science, 9 (3), 226–32.
Belk. R,W, (1988). .Possessions and the Extended Self.Journal of Consumer Research. 15
(September). 139-68.
Brown, J. D. (2012). Understanding the better than average effect: Motives (still) matters.
Personality and Social Psychology Bulletin, 38(2), 209–219.
Carlsson, F., García, J. H., & Löfgren, Ậ. (2010). Conformity and the demand for environmental
goods. Environmental Resource Economics, 47, 407–421.
Dhar, R., & Wertenbroch, K. (2000). Consumer choice between hedonic and utilitarian goods.
Journal of Marketing Research, 37, 60–71.
Didier, T., & Lucie, S. (2008). Measuring consumer’s willingness to pay for organic and Fair
Trade products. International Journal of Consumer Studies, 32, 479–490.
Frederick, S. (2012). Overestimating others’ willingness to pay. Journal of Consumer Research,
39, 1–21.
Page 51
43
Giner-Sorolla, R. (2001). Guilty Pleasures and Grim Necessities: Affective Attitudes in Dilemmas
of Self-Control. Journal of Personality and Social Psychology, Vol. 80, No. 2, 206-221
Grunert, K, G. (2011). Sustainability in the food sector: a consumer behaviour perspective. Int. J.
Food Sys. Dyn. 2, 207-218.
Hainmueller, J., Hiscox, M, J., & Sequeira, S. (2012). Consumer Demand for the Fair Trade Label:
Evidence from a Field Experiment. The Review of Economics and Statistics, May 2015, 97(2):
242–256.
Haws, K. L., Bearden, W. O., & Nenkov, G. Y. (2012). Consumer spending self-control
effectiveness and outcome elaboration prompts. Journal of the Academic Marketing Science.
(2012) 40:695–710.
Hightower, R., Brady, M. K., & Baker, T. L. (2002), “Investigating the Role of the Physical
Environment in Hedonic Service Consumption: An Exploratory Study of Sporting Events,”
Journal of Business Research, 55 (9), 697-707.
Hirschman, E, C., & Holbrook, M, B. (1982), “Hedonic Consumption: Emerging Concepts,
Methods and Propositions,” Journal o f Marketing, 46 (3), 92-101.
Hoch, S, J., & Loewenstein, G, F. (1991). Time-inconsistent Preferences and Consumer Self-
Control. Journal of Consumer Research. Vol.17, March 1991, 492-507.
Hofmann,W., Friese, M., & Strack, F. (2016). Impulse and Self-Control from a Dual-Systems
Perspective. Perspectives on Psychological Science, 4(2), 162-176.
Hopkinson, C. G., & Pujari, D. (1999). A factor analytic study of the sources of meaning of
Hedonic consumption. European Journal of Marketing, 33(3/4), 273-290.
Jung, M, H., Nelson, L, D., Gneezy, A., & Gneezy, U. Paying More When Paying for Others.
Journal of Personality and Social Psychology, Vol. 107, No. 3, 414 – 431.
Dhar, R., & Wertenbroch, K. (2000). Consumer choice between hedonic and utilitarian goods.
Journal of Marketing Research, 37, 60-71.
Karsaklian, E., & Fee, A. (2015). From Green to Ethical Consumers: What Really Motivates
Consumers to Buy Ethical Products?. In: Campbell C., Ma J. (eds) Looking Forward, Looking
Page 52
44
Back: Drawing on the Past to Shape the Future of Marketing. Developments in Marketing Science:
Proceedings of the Academy of Marketing Science. Springer, Cham192-201.
Krystallis, A., & Chryssohoidis, G. (2005). Consumers’ willingness to pay for organic food:
Factors that affect it and variation per organic product type. British Food Journal, 107 (5), 320-
343.
Kurt, D., Inman, J.J. (2013). Mispredicting Others’ Valuations: Self-Other Difference in the
Context of Endowment. Journal of Consumer Research, 40(June): 78-89.
Loewenstein, G. (1996). Out of control: Visceral influences on behavior. Organizational Behavior
and Human Decision Processes, 65, 272.
Lu, J., Liu, Z., & Fang, Z. (2016). Hedonic products for you, utilitarian products for me. Judgment
and Decision Making, Vol. 11, No. 4, July 2016: 332-341.
Matthews, W, J., Gheorghiu, A, I., & Callan, M, J. (2016). Why do we overestimate others’
willingness to pay? Judgment and Decision Making, Vol. 11, No. 1, January 2016, 21–39.
Marian, L., Chrysochou, P., Krystallis, A., & Thøgersen, J. (2014). Food Quality and Preference
Volume 37, October 2014, Pages 52–60.
Mowen, J. C. & Spears, N. (1999). A hierarchical model approach to understanding compulsive
buying among college students. Journal of Consumer Psychology, 8 (4), 407-430.
Rode, J., Hogarth, R. M., & Le Menestrel, M. (2008). Ethical differentiation and market behavior:
An experimental approach. Journal of Economic Behavior & Organization, 66, 265–280.
Rousu, M. C., & Corrigan, J. R. (2008). Estimating the welfare loss to consumers when food labels
do not adequately inform: An application to fair trade certification. Journal of Agricultural & Food
Industrial Organization 6(1), article 3.
Strahilevitz, M., & Myers, J, G. (1998). Donations to Charity as Purchase Incentives: How Well
They Work May Depend on What You Are Trying to Sell. Journal of Consumer Research. Vol.
24, March 1998. 434-446.
Page 53
45
Tangney, J. P., Baumeister, R, F., Boone, A, L. (2004). High Self-Control Predicts Good
Adjustment, Less Pathology, Better Grades, and Interpersonal Success. Volume 72, Issue 2, 271–
324.
Trope, Y., & Liberman, N. (2003). Temporal Construal. Psychological Review, 110(3), 403–421.
Trudel, R., & Cotte, J. (2009). Does it pay to be good? MIT Sloane Management Review, 50, 61–
68.
Khan, U., & Urminsky, O. (2004). Special Session Summary Navigating Between Virtues and
Vices: Moderators of Decisions Involving Hedonic Versus Utilitarian Choices. Advances in
Consumer Research, (31), 358-361.
van Boven, L., Dunning, D., & Loewenstein, G. (2000). Egocentric Empathy Gaps between
Owners and Buyers: Misperceptions of the Endowment Effect. Journal of Personality and Social
Psychology, 79 (1), 66–76.
Vohs, K. D., & Faber, R. J. (2007). Spent Resources: Self-Regulatory Resource Availability
Affects Impulse Buying. Journal of Consumer Research Vol. 33, 537-547.
Wertenbroch, K. (1998). Consumption Self-Control by Rationing Purchase Quantities of
Virtue and Vice. Marketing Science, 17 (4), 317-337.
Page 54
46
Appendices
Appendix A Main effect - Overestimation of others’ WTP, Study 1 & 2
Instructions: “For each of the nine products, please indicate the most you would like to pay for
it.”
(1) LEGO Classic - Creative Bricks Price:
(2) Music CD of your favorite singer/band Price:
(3) HP DeskJet 1112 Printer Price:
(4) 2lbs Joe’s Tasty Travels Roasted Jumbo Virginia Peanuts Price:
(5) NESTLÉ KITKAT Minis Milk Chocolate Bar (10x12g) Price:
(6) 1 large Cucumber Price:
(7) Manchester by the sea DVD Price:
(8) 500 ml Canada Dry Price:
(9) A voucher giving a large pizza at Pizza Hut Price:
Page 55
47
“Please look at these products again and estimate the most price the typical person taking this
survey would like to pay for each product.”
1) LEGO Classic - Creative Bricks Price:
2) Music CD of your favorite singer/band Price:
3) HP DeskJet 1112 Printer Price:
4) 2lbs Joe’s Tasty Travels Roasted Jumbo Virginia Peanuts Price:
5) NESTLÉ KITKAT Minis Milk Chocolate Bar (10x12g) Price:
6) 1 large Cucumber Price:
7) Manchester by the sea DVD Price:
8) 500 ml Canada Dry Price:
9) A voucher giving a large pizza at Pizza Hut Price:
Page 56
48
Demographic information
Gender: Female ( ) Male ( )
Age: 18-30( ) 30-45( ) 45-60( ) 60-75( ) 75-90( ) Above 90( )
Household income: Below$25000( ) $25000-$45000( ) $45000-$65000( ) $65000-$85000(
) Above $85000( )
Page 57
49
Appendix B Consumer spending self-control estimation, Study 2 & 7
Instructions
Consumer spending self-control is “the ability to monitor and regulate one’s spending related
thoughts and decisions in accordance with self-imposed standards”.
“What is the comparison between the amount you can spend as you wish after paying taxes and
unavoidable expenses (e.g., bills/mortgage/rent) and that of the typical person taking this survey?”
Mine is very much lower ( )
Mine is much lower ( )
Mine is somewhat lower ( )
Mine is slightly lower ( )
They are exactly the same ( )
Mine is slightly higher ( )
Mine is somewhat higher ( )
Mine is much higher ( )
Mine is very much higher ( )
Demographic information ( )
Gender: Female( ) Male( )
Age: 18-30( ) 30-45( ) 45-60( ) 60-75( ) 75-90( ) Above 90
Household income: Below $25000 ( ) $25000-$45000 ( ) $45000-$65000 ( ) $65000-$85000
( ) Above$85000 ( )
Page 58
50
Appendix C Hedonic VS Utilitarian attributes, Study 3
Hedonic attributes
Sony Gold Wireless Stereo Headset (Great for gamers showing everything from the big booms
to whisper-quiet warnings in stunning, trendy and sleek design, virtual surround sound for
perfect music lovers)
Caudalie Instant Foaming Cleanser (A natural blend of grape extracts, sage, and chamomile,
with delicate scent, sensuos and soft foam) 150ml
Asus ROG Strix GL502 Laptop (A classic, timeless design, optimized for smooth computing
and a multimedia experience, high resolution screen, full audio with extra bass)
Oasis Tropical Mango Smoothie (A joyful combination of flavors and sensations, creamy
blend with exceptional taste) 1.75L
Utilitarian attributes
Sony Gold Wireless Stereo Headset (Long battery life, great sound clarity, microphone for
conversations, portable and ideal for daily use)
Caudalie Instant Foaming Cleanser (Functionally deep cleansing, solution for dryness,
dullness and uneven texture, for all skin types)
Asus ROG Strix GL502 Laptop (Shock-proof, great performance on professional computing
and spreadsheet calculations, ideal business laptop)
Oasis Tropical Mango Smoothie (1 glass (250ml) equals 2 out of 5 portions fruit and
vegetables a day, source of fibres and vitamins, lactose free)
Demographic information
Gender: Female( ) Male( )
Age: 18-30( ) 30-45( ) 45-60( ) 60-75( ) Above 75( )
Household income: Below$25000( ) $25000-$35000( ) $35000-$45000( ) $45000-$55000(
) Above$55000( )
Page 59
51
Appendix D Affluence belief and WTP gap, Study 4 & 7
What is the comparison between "the amount you can spend as you wish after paying taxes and
unavoidable expenses (e.g., bills/mortgage/rent)" and that of the typical person taking this
survey?
Mine is very much lower ( )
Mine is much lower ( )
Mine is somewhat lower ( )
Mine is slightly lower ( )
They are exactly the same ( )
Mine is slightly higher ( )
Mine is somewhat higher ( )
Mine is much higher ( )
Mine is very much higher ( )
Page 60
52
Please give the maximum price you would like to pay for each product. (CAD)
1) Adidas Speed Trainer Sneaker Price:
2) Naturegg Omega 3 Eggs (6 eggs) Price:
3) Bertolli Extra Virgin Oil (500ml) Price:
4) American Apparel Fine Jersey Crewneck T-Shirt Price:
Page 61
53
Please estimate the maximum price the typical person taking this survey would like to pay for
each product. (CAD)
1) Adidas Speed Trainer Sneaker Price:
2) Naturegg Omega 3 Eggs (6 eggs) Price:
3) Bertolli Extra Virgin Oil (500ml) Price:
4) American Apparel Fine Jersey Crewneck T-Shirt Price:
Page 62
54
Demographic information
Gender: Female( ) Male( )
Age: 18-30( ) 30-45( ) 45-60( ) 60-75( ) Above 75( )
Household income: Below$25000( ) $25000-$35000( ) $35000-$45000( ) $45000-$55000(
) Above$55000( )
Page 63
55
Appendix E Causal link between affluence belief and WTP for ethical product, Study 5
Please think about a person who is going to give the maximum prices for a list of ethical
products.
Low income group
This person has a personal income of $10000 per year, which puts him/her in about the bottom
10% of people in Canada.
Now please give the maximum price this person would like to pay for each product. (CAD)
1) Adidas Futurecraft Sneaker (Biodegradable and made with BioSteel) Price:
2) Naturegg Organic Eggs (6 eggs) Price:
3) Bertolli Organic Extra Virgin Oil (500ml) Price:
4) American Apparel Organic Fine Jersey Crewneck T-Shirt Price:
Page 64
56
High income group
This person has a personal income of $90000 per year, which puts him/her in about the top 10%
of people in Canada.
Now please give the maximum price this person would like to pay for each product. (CAD)
1) Adidas Futurecraft Sneaker (Biodegradable and made with BioSteel) Price:
2) Naturegg Organic Eggs (6 eggs) Price:
3) Bertolli Organic Extra Virgin Oil (500ml) Price:
4) American Apparel Organic Fine Jersey Crewneck T-Shirt Price:
Page 65
57
Demographic information
Gender: Female( ) Male( )
Age: 18-30( ) 30-45( ) 45-60( ) 60-75( ) Above 75( )
Household income: Below$25000( ) $25000-$35000( ) $35000-$45000( ) $45000-$55000(
) Above$55000( )
Page 66
58
Appendix F WTP for ethical products, Study 6
Now please give the maximum price you would like to pay for each ethical product. (CAD)
1) Adidas Futurecraft Sneaker (Biodegradable and made with BioSteel) Price:
2) Naturegg Organic Eggs (6 eggs) Price:
3) Bertolli Organic Extra Virgin Oil (500ml) Price:
4) American Apparel Organic Fine Jersey Crewneck T-Shirt Price:
Page 67
59
Now please give the maximum price the typical person would like to pay for each ethical
product. (CAD)
1) Adidas Futurecraft Sneaker (Biodegradable and made with BioSteel) Price:
2) Naturegg Organic Eggs (6 eggs) Price:
3) Bertolli Organic Extra Virgin Oil (500ml) Price:
4) American Apparel Organic Fine Jersey Crewneck T-Shirt Price:
Page 68
60
Demographic information
Gender: Female( ) Male( )
Age: 18-30( ) 30-45( ) 45-60( ) 60-75( ) Above 75( )
Household income: Below$25000( ) $25000-$35000( ) $35000-$45000( ) $45000-$55000(
) Above$55000( )