Page 1
1
© M
irce
a St
an, K
evin
Ska
dron
, Dav
id B
rook
s, 2
002
Overview
1. Motivation (Kevin)2. Thermal issues (Kevin)3. Power modeling (David)4. Thermal management (David)5. Optimal DTM (Lev)6. Clustering (Antonio)7. Power distribution (David)8. What current chips do (Lev)9. HotSpot (Kevin)
Page 2
2
© M
irce
a St
an, K
evin
Ska
dron
, Dav
id B
rook
s, 2
002
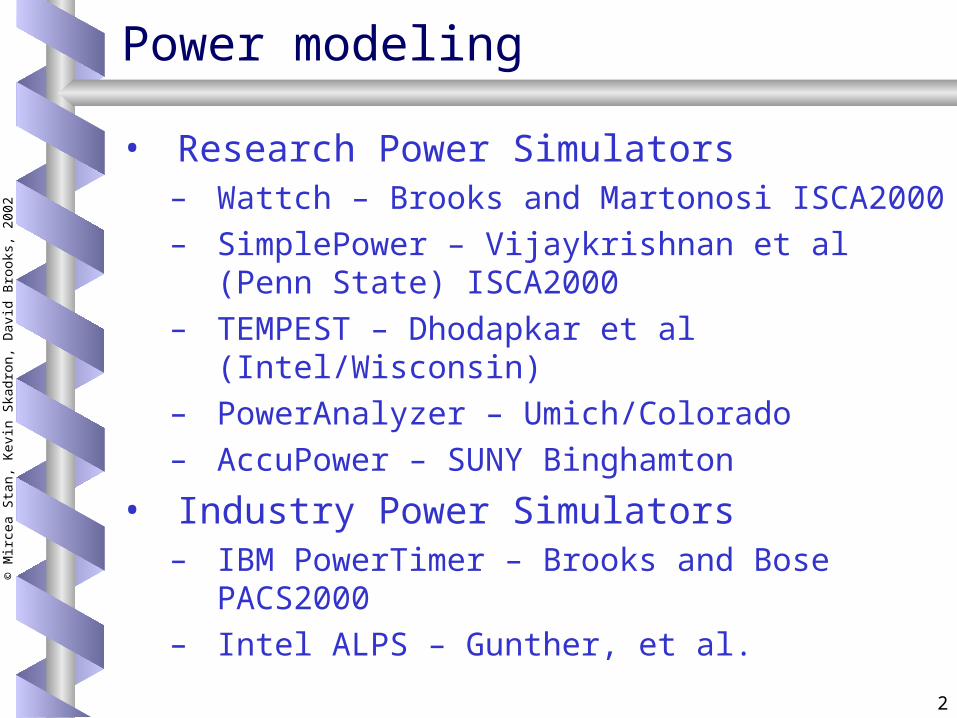
Power modeling
• Research Power Simulators– Wattch – Brooks and Martonosi ISCA2000– SimplePower – Vijaykrishnan et al (Penn
State) ISCA2000– TEMPEST – Dhodapkar et al (Intel/Wisconsin)– PowerAnalyzer – Umich/Colorado– AccuPower – SUNY Binghamton
• Industry Power Simulators– IBM PowerTimer – Brooks and Bose
PACS2000– Intel ALPS – Gunther, et al.
Page 3
3
© M
irce
a St
an, K
evin
Ska
dron
, Dav
id B
rook
s, 2
002
Power: The Basics
• Dynamic power vs. Static power– Dynamic: “switching” power– Static: “leakage” power– Dynamic power dominates, but static power
increasing in importance– Trends in each
• Static power: steady, per-cycle energy cost• Dynamic power: capacitive and short-circuit• Capacitive power: charging/discharging at
transitions from 01 and 10• Short-circuit power: power due to brief short-
circuit current during transitions.• Mostly focus on capacitive, but recent work on
others
Page 4
4
© M
irce
a St
an, K
evin
Ska
dron
, Dav
id B
rook
s, 2
002
Capacitive Power dissipation
Power ~ ½ CV2Af
Capacitance:Function of wire length, transistor size
Supply Voltage:Has been dropping with successive fab generations
Clock frequency:Increasing…Activity factor:
How often, on average, do wires switch?
Vin Vout
CL
Vdd
Page 5
5
© M
irce
a St
an, K
evin
Ska
dron
, Dav
id B
rook
s, 2
002
Short-Circuit Power Dissipation
• Short-Circuit Current caused by finite-slope input signals
• Direct Current Path between VDD and GND when both NMOS and PMOS transistors are conducting
VOUT
CL
ISC
VIN
Page 6
6
© M
irce
a St
an, K
evin
Ska
dron
, Dav
id B
rook
s, 2
002
Leakage Power
• Subthreshold currents grow exponentially with increases in temperature, decreases in threshold voltage
Tka
Vq
DSub a
T
ekI
VOUT
CL ISub
VIN
IGate
Page 7
7
© M
irce
a St
an, K
evin
Ska
dron
, Dav
id B
rook
s, 2
002
Modeling Hierarchy and Tool Flow
set of workloads
Early analytical performance modelsTrace/exec-driven, cycle-accurate simulation models
Microarchparms/specs
RTL MODEL (VHDL) RTLsim
Circuit-level (hierarchical) netlist model
gate-level model (if synthesized)
Layout-level physical design model
microarchlevel
RTLlevel
gate-level
ckt-level
layout-level
Energy Models
cktextract
Capextract,sim
Sim Test Cases
Bitvectortest cases
(Architectural)
edit/debug
edit/tune/debug
Design rules
design rulecheck,validate
PerformanceTest Cases
edit/debug
refine,update
sim,
Page 8
8
© M
irce
a St
an, K
evin
Ska
dron
, Dav
id B
rook
s, 2
002
Analysis Abstraction Levels
Abstraction Analysis Analysis Analysis Analysis Energy
Level Capacity Accuracy Speed Resources Savings
Most Worst Fastest Least Most
Application
Behavioral
Architectural (RTL)
Logic (Gate)
Transistor (Circuit)
Least Best Slowest Most Least
Page 9
9
© M
irce
a St
an, K
evin
Ska
dron
, Dav
id B
rook
s, 2
002
Power/Performance abstractions
• Low-level:– Hspice– PowerMill
• Medium-Level: – RTL Models
• Architecture-level:– PennState SimplePower– Intel Tempest– Princeton Wattch– IBM PowerTimer– Umich/Colorado PowerAnalyzer
Page 10
10
© M
irce
a St
an, K
evin
Ska
dron
, Dav
id B
rook
s, 2
002
Low-level models: Hspice
• Extracted netlists from circuit/layout descriptions– Diffusion, gate, and wiring capacitance is modeled
• Analog simulation performed– Detailed device models used– Large systems of equations are solved– Can estimate dynamic and leakage power dissipation
within a few percent– Slow, only practical for 10-100K transistors
• PowerMill (Synopsys) is similar but about 10x faster
Page 11
11
© M
irce
a St
an, K
evin
Ska
dron
, Dav
id B
rook
s, 2
002
Medium-level models: RTL
• Logic simulation obtains switching events for every signal
• Structural VHDL or verilog with zero or unit-delay timing models
• Capacitance estimates performed– Device Capacitance
• Gate sizing estimates performed, similar to synthesis
– Wiring Capacitance• Wire load estimates performed, similar to
placement and routing
• Switching event and capacitance estimates provide dynamic power estimates
Page 12
12
© M
irce
a St
an, K
evin
Ska
dron
, Dav
id B
rook
s, 2
002
Architecture level models
• Bottom-up Approach: – Estimate “CV2f” via analytical models– Tools: Wattch, PowerAnalyzer, Tempest (mixed-
mode)
• Top-Down Approach– Estimate “CV2f” via empirical measurements– Tools: PowerTimer, AccuPower, Most Industrial Tools
• Estimate “A” via statistics from architectural-performance simulators
Power ~ ½ CV2Af
Page 13
13
© M
irce
a St
an, K
evin
Ska
dron
, Dav
id B
rook
s, 2
002
Analytical Models: Capacitance
• Requires modeling wire length and estimating transistor sizes
• Related to RC Delay analysis for speed along critical path– But capacitance estimates require summing
up all wire lengths, rather than only an accurate estimate of the longest one.
Page 14
14
© M
irce
a St
an, K
evin
Ska
dron
, Dav
id B
rook
s, 2
002
Register File: Capacitance Analysis
Pre-ChargeD
ecod
ers
Bitlines
(Data Width of Entries)
Wordlines
(Number of Entries)
Sense Amps
Cell
Bit
metal
gatecapNrdlineDrivediffcapWorwordline
CngthWordlinele
CinesNumberBitlCC
*
* 1
metal
diffcapNgdiffcapPchbitline
CgthBitlinelen
ClinesNumberWordCC
*
* 1
Cell Access Transistors (N1)
Number of Ports
Number of Ports
Bit
Page 15
15
© M
irce
a St
an, K
evin
Ska
dron
, Dav
id B
rook
s, 2
002
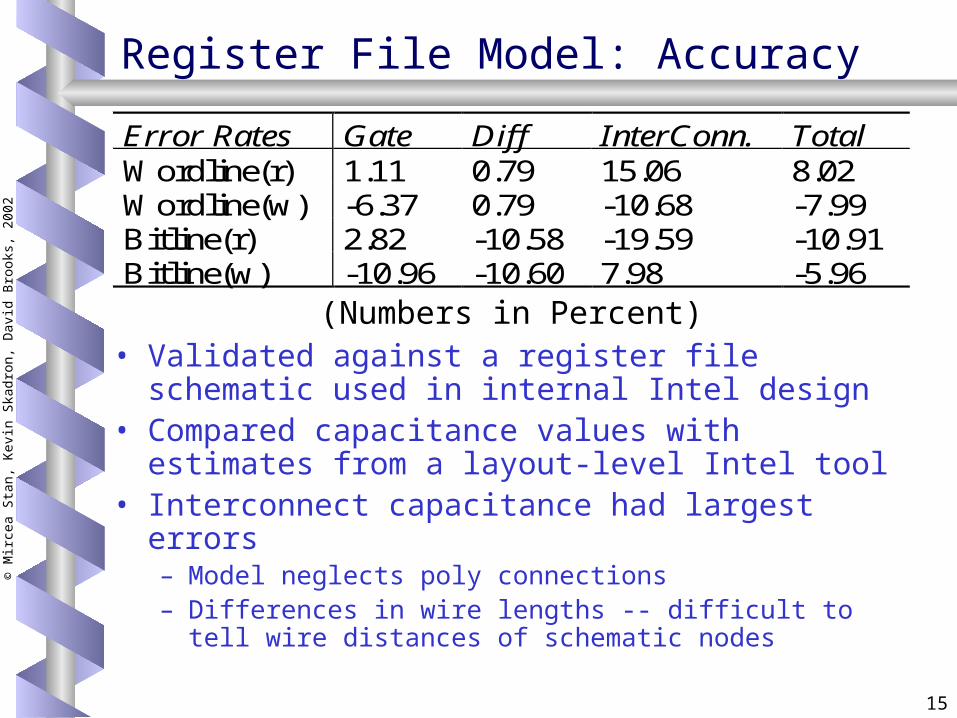
Register File Model: Accuracy
• Validated against a register file schematic used in internal Intel design
• Compared capacitance values with estimates from a layout-level Intel tool
• Interconnect capacitance had largest errors– Model neglects poly connections– Differences in wire lengths -- difficult to tell wire
distances of schematic nodes
Error Rates Gate Diff InterConn. Total Wordline(r) 1.11 0.79 15.06 8.02 Wordline(w) -6.37 0.79 -10.68 -7.99 Bitline(r) 2.82 -10.58 -19.59 -10.91 Bitline(w) -10.96 -10.60 7.98 -5.96 (Numbers in Percent)
Page 16
16
© M
irce
a St
an, K
evin
Ska
dron
, Dav
id B
rook
s, 2
002
Different Circuit Design Styles
• RTL and Architectural level power estimation requires the tool/user to perform circuit design style assumptions– Static vs. Dynamic logic– Single vs. Double-ended bitlines in register
files/caches– Sense Amp designs– Transistor and buffer sizings
• Generic solutions are difficult because many styles are popular
• Within individual companies, circuit design styles may be fixed
Page 17
17
© M
irce
a St
an, K
evin
Ska
dron
, Dav
id B
rook
s, 2
002
Clock Gating: What, why, when?
• Dynamic Power is dissipated on clock transitions
• Gating off clock lines when they are unneeded reduces activity factor
• But putting extra gate delays into clock lines increases clock skew
• End results:– Clock gating complicates design analysis but saves
power.
Clock
Gate
Gated Clock
Page 18
18
© M
irce
a St
an, K
evin
Ska
dron
, Dav
id B
rook
s, 2
002
Wattch: An Overview
Overview of Features• Parameterized models for different CPU units
– Can vary size or design style as needed• Abstract signal transition models for speed
– Can select different conditional clocking and input transition models as needed
• Based on SimpleScalar (has been ported to many simulators)
• Modular: Can add new models for new units studied
Wattch’s Design Goals• Flexibility• Planning-stage info• Speed• Modularity• Reasonable accuracy
Page 19
19
© M
irce
a St
an, K
evin
Ska
dron
, Dav
id B
rook
s, 2
002
Unit Modeling
Modeling Capacitance• Models depend on structure,
bitwidth, design style, etc.• E.g., may model capacitance of a
register file with bitwidth & number of ports as input parameters
Modeling Activity Factor• Use cycle-level simulator to
determine number and type of accesses– reads, writes, how many
ports• Abstract model of bitline activity
ParameterizedRegister File
PowerModel
PowerEstimate
Number of entries
Data width of entries
# Read Ports
# Write Ports
Bitline Activity
Number of Active Ports
Page 20
20
© M
irce
a St
an, K
evin
Ska
dron
, Dav
id B
rook
s, 2
002
Fetch Dispatch Issue/Execute Writeback/ Commit
Power (Units Accessed)
I-cache Bpred
Rename Table
Inst. Window Reg. File
Inst. Window Reg File ALU D-Cache Load/St Q
Result Bus Reg File Bpred
Performance Cache Hit? Bpred
Lookup?
Inst. Window Full?
Dependencies Satisfied?
Resources?
Commit Bandwidth?
One Cycle in Wattch
• On each cycle:– determine which units are accessed– model execution time issues– model per-unit energy/power based on which units used
and how many ports.
Page 21
21
Units Modeled by Wattch
Array Structures Caches, Reg Files,
Map/Bpred tables Content-
Addressable Memories (CAMs) TLBs, Issue Queue,
Reorder Buffer Complex combinational blocks ALUs, Dependency
Check Clocking network Global Clock
Drivers, Local Buffers
Page 22
22
© M
irce
a St
an, K
evin
Ska
dron
, Dav
id B
rook
s, 2
002
PowerTimer
• IBM Tool First Develop During Summer of 2000– Continued Development: 2001 => Today– Methodology Applied to Research and
Product Power-Performance Simulators with IBM
– Currently in Beta-Release– Working towards Full Academic Release
Page 23
23
© M
irce
a St
an, K
evin
Ska
dron
, Dav
id B
rook
s, 2
002
PowerTimer: Empirical Power
IFU
6%
ISU
10%
LSU
19%
GX
1%
L2
23%
Clock Tree
10%
RAS
5%
FBC
3%
CIU
4%
ZIO
4%
FPU
5%Core
Buffer
1%
FXU
4%IDU
3%L3 Tags
2%
Issue Queues
32%
Completion Table9%
Dispatch6%
Other10%
Map Tables43%
Pre-silicon, POWER4-like superscalar design
Page 24
24
© M
irce
a St
an, K
evin
Ska
dron
, Dav
id B
rook
s, 2
002
Processor Power Density
Pre-silicon, POWER4-like superscalar designOriginally presented at PACS2002
0
0.1
0.2
0.3
0.4
0.5
0.6
0.7
IFU IDU ISU FXU LSU FPU L2 L3 Tag BHT Icache FX-IssueQ
Page 25
25
© M
irce
a St
an, K
evin
Ska
dron
, Dav
id B
rook
s, 2
002
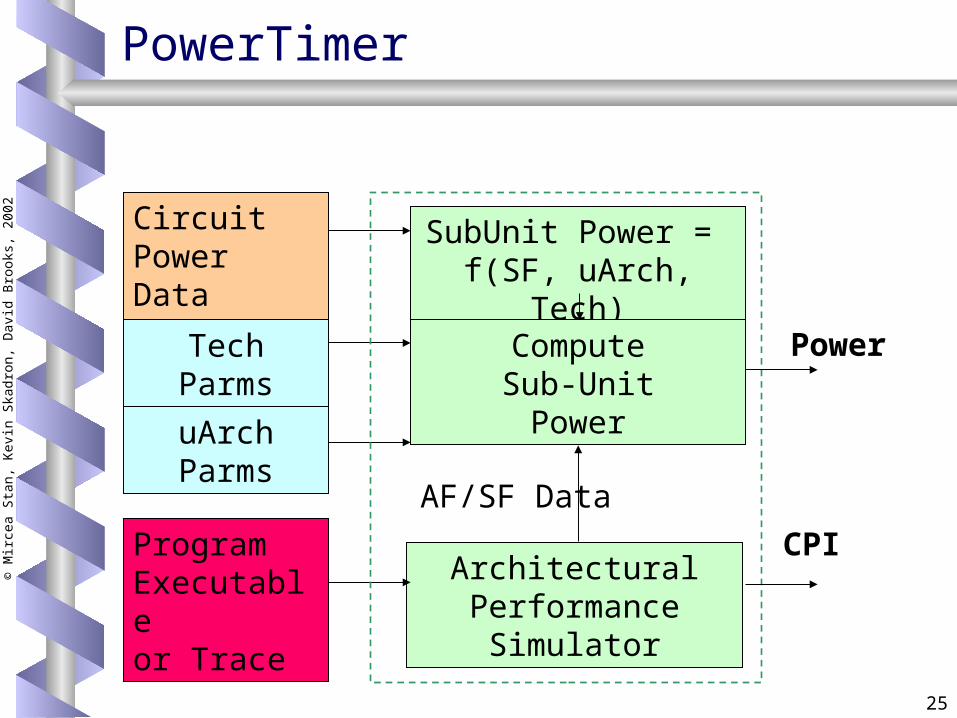
PowerTimer
Circuit PowerData (Macros)
Tech Parms
uArch Parms
Program Executable or Trace
SubUnit Power = f(SF, uArch, Tech)
ComputeSub-Unit
Power
Architectural Performance
Simulator
Power
CPI
AF/SF Data
Page 26
26
© M
irce
a St
an, K
evin
Ska
dron
, Dav
id B
rook
s, 2
002
PowerTimer: Energy Models
• Energy models for uArch structures formed by summation of circuit-level macro data
Power=C1*SF+HoldPower
Power=C2*SF+HoldPower
Power=Cn*SF+HoldPower
Macro1
Macro2
MacroN
Sub-Units (uArch-level Structures)
Energy Models
SF Data
Power Estimate
Page 27
27
© M
irce
a St
an, K
evin
Ska
dron
, Dav
id B
rook
s, 2
002
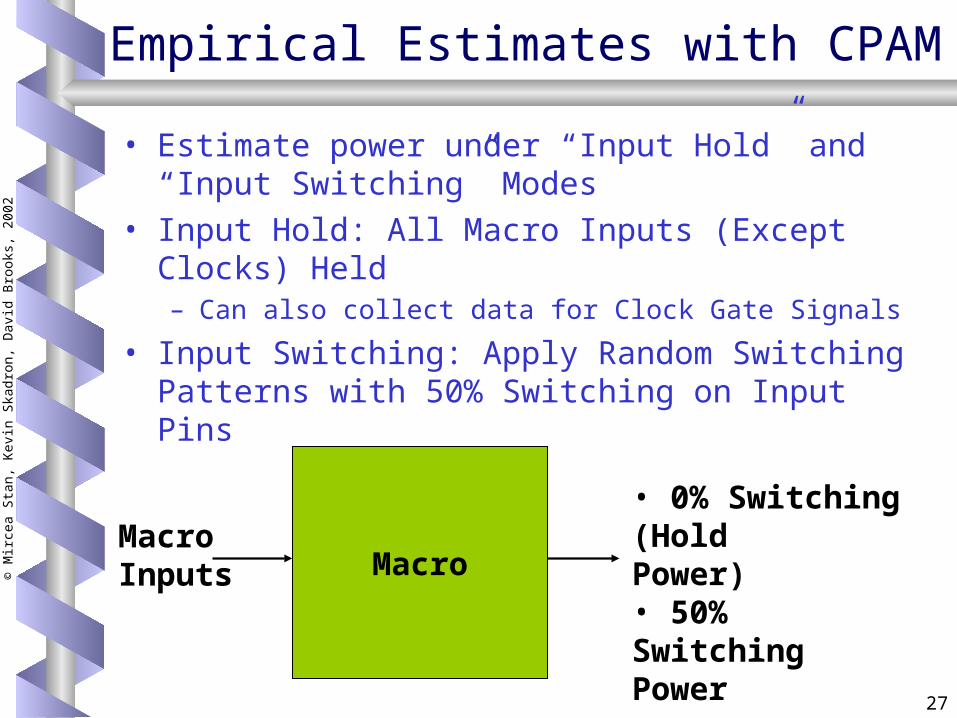
Empirical Estimates with CPAM
• Estimate power under “Input Hold” and “Input Switching” Modes
• Input Hold: All Macro Inputs (Except Clocks) Held– Can also collect data for Clock Gate Signals
• Input Switching: Apply Random Switching Patterns with 50% Switching on Input Pins
MacroMacro Inputs
• 0% Switching (Hold Power)• 50% Switching Power
Page 28
28
© M
irce
a St
an, K
evin
Ska
dron
, Dav
id B
rook
s, 2
002
Example Unit
• Made up of 5 macros
0
100
200
300
400
500
600
700
800
0 10 20 30 40 50SF
mW
macro1
macro2
macro3
macro4
macro5
total
Page 29
29
© M
irce
a St
an, K
evin
Ska
dron
, Dav
id B
rook
s, 2
002
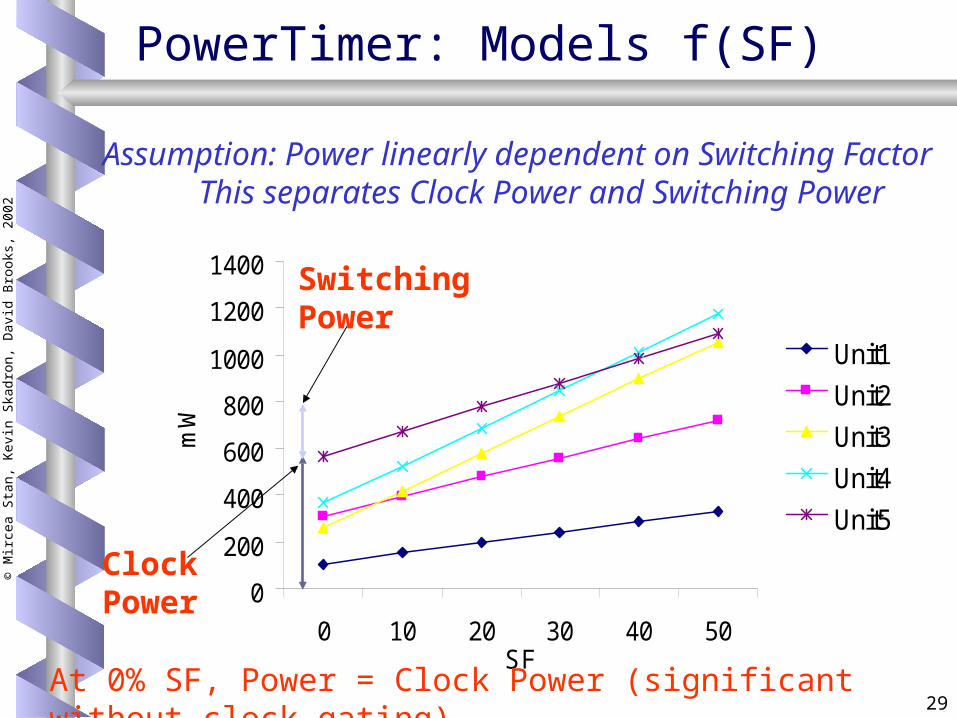
PowerTimer: Models f(SF)
0
200
400
600
800
1000
1200
1400
0 10 20 30 40 50SF
mW
Unit1
Unit2
Unit3
Unit4
Unit5
Assumption: Power linearly dependent on Switching FactorThis separates Clock Power and Switching Power
At 0% SF, Power = Clock Power (significant without clock gating)
ClockPower
SwitchingPower
Page 30
30
© M
irce
a St
an, K
evin
Ska
dron
, Dav
id B
rook
s, 2
002
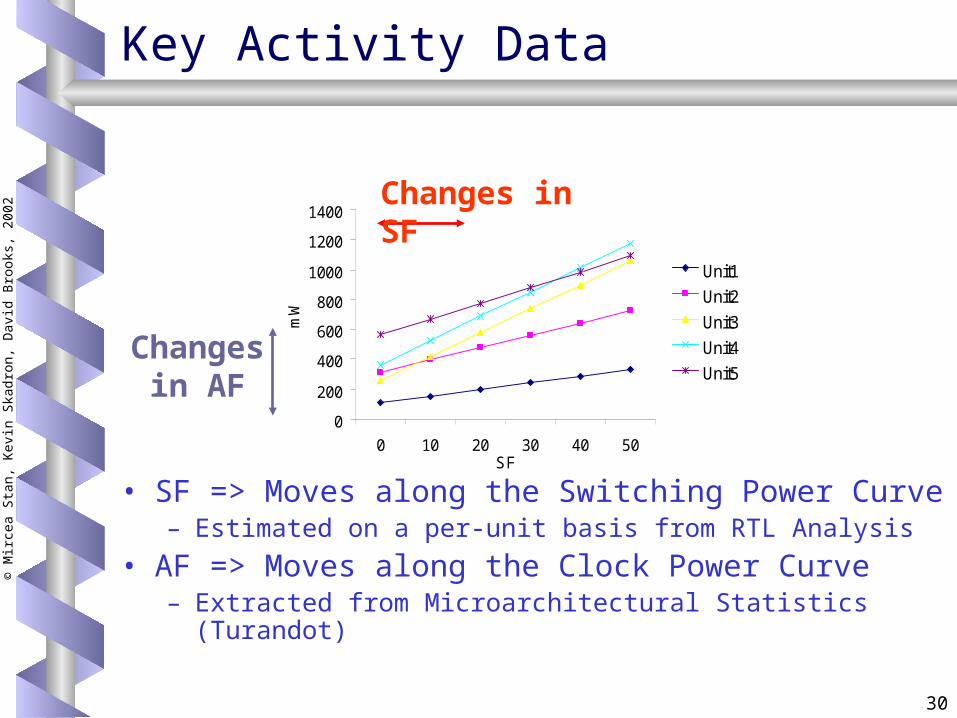
Key Activity Data
• SF => Moves along the Switching Power Curve– Estimated on a per-unit basis from RTL Analysis
• AF => Moves along the Clock Power Curve– Extracted from Microarchitectural Statistics (Turandot)
0
200
400
600
800
1000
1200
1400
0 10 20 30 40 50SF
mW
Unit1
Unit2
Unit3
Unit4
Unit5
Changes in SF
Changes in AF
Page 31
31
© M
irce
a St
an, K
evin
Ska
dron
, Dav
id B
rook
s, 2
002
Microarchitectural Statistics
• Stats are very similar to tracking used in Wattch, etc• Differences:
– Clock Gating Modes (3 modes)– Customized Scaling Based on Circuit Style (4 styles)
• Clock Gating Modes:– P_constrained = P_unconstrained (not clock-gateable)– P_constrained_1 = AF * (Pclock + Plogic) (common)– P_constrained_2 = AF * Pclock + Plogic (rare)– P_constrained_3 = Pclock + AF * Plogic (very rare)
• Scaling Based on Circuit Styles– AF_1 = #valid (Latch-and-Mux, No Stall
Gating)– AF_2 = #valid - #stalls (Latch-and-Mux, With Stall
Gating)– AF_3 = #writes (Arrays that only gate
updates)– AF_4 = #writes + #reads (Arrays, RAM Macros)
Page 32
32
© M
irce
a St
an, K
evin
Ska
dron
, Dav
id B
rook
s, 2
002
Clock Gating: Valid-Bit Gating
V V V V V V
Clock
• Latch-Based Structures: Execute Pipelines, Issue Queues
Page 33
33
© M
irce
a St
an, K
evin
Ska
dron
, Dav
id B
rook
s, 2
002
Clock Gating Modes
• P_constrained_1 = AF * (Pclock + Plogic)
Plogic
clockvalid
• P_constrained_2 = AF * Pclock + Plogic
SelectionLogic
Pclock
Pclock Plogic
clockvalid
Page 34
34
© M
irce
a St
an, K
evin
Ska
dron
, Dav
id B
rook
s, 2
002
Valid-bit Gating, Stalls?
• Option 1: Stalls cannot be gated
clkvalid
Data From Previous Pipestage
Data For Next Pipestage
Stall FromPrevious Pipestage
clkvalid
Data From Previous Pipestage
Data For Next Pipestage
Stall FromPrevious Pipestage
• Option 2: Stalls can be gated
Page 35
35
© M
irce
a St
an, K
evin
Ska
dron
, Dav
id B
rook
s, 2
002
Scaling: Array Structures
• Option 1: Reads and Writes Eligible to Gate for Power
Cell
Write Bitline
write_wordline_activewrite_gate
Read Bitline
write_gate write_data
read_wordline_activeread_gate
read_data
Page 36
36
© M
irce
a St
an, K
evin
Ska
dron
, Dav
id B
rook
s, 2
002
Scaling: Array Structures
• Option 2: Only Writes Eligible to Gate for Power
Cell
Write Bitline
write_wordline_activewrite_gate
write_gate write_data
read_data
read_entry_0
read_entry_1
read_entry_2
read_entry_n
Page 37
Gating
Mode
Valid Valid+
Stalls
Writes Writes+
Reads
Gate
Both
Gate
Clock
Gate
Logic
Examples
0 No No No No No No No Control Logic, Buffers, Small Macros
1 Yes No No No Yes No No Issue Queues, Execute Pipelines2 No Yes No No Yes No No
3 No No Yes No Yes No No Caches
4 No No No Yes Yes No No Some Queues
5 Yes No No No No Yes No CAMs, Selection Logic
6 No Yes No No No Yes No
7 No No Yes No No Yes No No Known macros
8 No No No Yes No Yes No No Known macros
9 Yes No No No No No Yes No Known macros
10 No Yes No No No No Yes No Known macros
11 No No Yes No No No Yes No Known macros
12 No No No Yes No No Yes No Known macros
12 Clock Gating Modes
Page 38
38
© M
irce
a St
an, K
evin
Ska
dron
, Dav
id B
rook
s, 2
002
PowerTimer Observations
• PowerTimer works well for POWER4-like estimates and derivatives– Scale base microarchitecture quite well– E.g. optimal power-performance pipelining
study– Lack of run-time, bit-level SF not seen as a
problem within IBM (seen as noise)• Chip bit-level SFs are quite low (5-15%)• Most (60-70%) power is dissipated while
maintaining state (arrays, latches, clocks)• Much state is not available in early-stage timers
Page 39
39
© M
irce
a St
an, K
evin
Ska
dron
, Dav
id B
rook
s, 2
002
Comparing models: Flexibility
• Flexibility necessary for certain studies– Resource tradeoff analysis– Modeling different architectures
• Purely analytical tools provides fully-parameterizable power models– Within this methodology, circuit design styles could
also be studied
• PowerTimer scales power models in a user-defined manner for individual sub-units– Constrained to structures and circuit-styles
currently in the library
• Perhaps Mixed Mode tools could be very useful
Page 40
40
© M
irce
a St
an, K
evin
Ska
dron
, Dav
id B
rook
s, 2
002
Comparing models: Accuracy
• PowerTimer -- Based on validation of individual pieces– Extensive validation of the performance model (AFs)– Power estimates from circuits are accurate – Circuit designers must vouch for clock gating
scenarios– Certain assumptions will limit accuracy or require
more in-depth analysis
• Analytical Tools– Inherent Issues
• Analytical estimates cannot be as accurate as SPICE analysis (“C” estimates, CV2 approximation)
– Practical Issues• Without industrial data, must estimate transistor sizing,
bits per structure, circuit choices
Page 41
41
© M
irce
a St
an, K
evin
Ska
dron
, Dav
id B
rook
s, 2
002
Comparing models: Speed
• Performance simulation is slow enough!• Post-Processing vs. Run-Time Estimates• Wattch’s per-cycle power estimates: roughly
30% overhead– Post-processing (per-program power estimates)
would be much faster (minimal overhead)
• PowerTimer allows both no overhead post-processing and run-time analysis for certain studies (di/dt, thermal)– Some clock gating modes may require run-time
analysis
• Third Option: Bit Vector Dumps– Flexible Post-Processing Huge Output Files
Page 42
42
© M
irce
a St
an, K
evin
Ska
dron
, Dav
id B
rook
s, 2
002
Power modeling summary
• Wattch provides excellent relative accuracy– Underestimates full chip power (some units
not modeled, etc)
• PowerTimer models based on circuit-level power analysis– Inaccuracy is introduced in SF/AF and
scaling assumptions
Page 43
43
© M
irce
a St
an, K
evin
Ska
dron
, Dav
id B
rook
s, 2
002
Overview
1. Motivation (Kevin)2. Thermal issues (Kevin)3. Power modeling (David)4. Thermal management (David)5. Optimal DTM (Lev)6. Clustering (Antonio)7. Power distribution (David)8. What current chips do (Lev)9. HotSpot (Kevin)
Page 44
44
© M
irce
a St
an, K
evin
Ska
dron
, Dav
id B
rook
s, 2
002
Existing Work
• Research Ideas– DEETM – Huang and Torrellas MICRO2000– DTM – Brooks and Martonosi HPCA2001– Control-Theoretic DTM – Skadron, Abdelzaher,
Stan HPCA2002– Thermal Scheduling – Cai, Lim, Daasch
WCED2002
• Commercial Products– PowerPC G3 Microprocessor– Pentium III– Pentium 4
Page 45
45
© M
irce
a St
an, K
evin
Ska
dron
, Dav
id B
rook
s, 2
002
Overview
• Hard to optimize power-performance at design time for all cases
• Forces conservative choices for issues like cooling, current delivery, resource sizes
• Want to explore dynamic power optimizations for run-time power management– Dynamic Voltage/Frequency Scaling [Burd, 2000]– Dynamic Hardware Resizing [Albonesi, 1999]– Fetch Throttling [Sanchez, 1997]– Global Clock Gating [Gunther, 2001]– Speculation Control [Manne, 1998]– Dynamic Thermal Management [Brooks, 2001]
[Huang, 2000]
Page 46
46
© M
irce
a St
an, K
evin
Ska
dron
, Dav
id B
rook
s, 2
002
Important to optimize P & T early
00.5
11.5
22.5
33.5
44.5
5
0.7 0.8 0.9 1 1.1 1.2 1.3 1.4 1.5 1.6Relative 1/Performance
Rel
ativ
e Po
wer
tradeoff via changing Vdd and HItradeoff via changing frequencytradeoff via changing pipeline depth
18FO4 23FO4
14FO4
12FO4
Maximum Power Budget
Page 47
47
© M
irce
a St
an, K
evin
Ska
dron
, Dav
id B
rook
s, 2
002
Dynamic Thermal Management
• Goal: – Provide dynamic techniques to cool chip
when needed– Exploit natural variations due to different
applications, phase behavior, …– Allow designers to target average, rather
than worst-case behavior
• Design Decisions:– Mechanism & policy for triggering response?– What should response be?– How to select DTM trigger levels?
Page 48
48
© M
irce
a St
an, K
evin
Ska
dron
, Dav
id B
rook
s, 2
002
Power consumption impacts cost
• System costs associated with power dissipation:– Thermal control cost
• Heatsinks, fans– Power delivery
• Power supply• Decoupling caps…
CPU
From: Gunther, et al. “Managing the Impact of Increasing Microprocessor Power Consumption,” Intel Technology Journal, Q1, 2001
Page 49
49
© M
irce
a St
an, K
evin
Ska
dron
, Dav
id B
rook
s, 2
002
Average and Worst Case Power
• System costs are constrained by worst case power dissipation
• Average case power dissipation can often be much lower– Aggressive Clock Gating– Applications variations– Underutilized resources
• Not enough ILP• Floating point units during integer
code execution
• Currently about a 30% difference
• Likely to further diverge…
0
20
40
60
80
100
Alpha 21264 Intel PPro
Max
Avg
Page 50
50
© M
irce
a St
an, K
evin
Ska
dron
, Dav
id B
rook
s, 2
002
Dynamic Thermal Management
Time
Tem
pera
ture
DTM Disabled DTM/Response Engaged
Designed for Cooling Capacity w/out DTM
DTM TriggerLevel
Designed for Cooling Capacity w/ DTM
SystemCost Savings
Page 51
51
© M
irce
a St
an, K
evin
Ska
dron
, Dav
id B
rook
s, 2
002
DTM: Definitions
TriggerReached
Response Delay – Invocation time (e.g. adjust clock)
ResponseDelay
Policy Delay – Number of cycles engaged
PolicyDelay
CheckTemp
CheckTemp
TurnResponse
On
InitiationDelay
Initiation Delay – OS interrupt/handler
ShutoffDelay
TurnResponse
Off
Shutoff Delay – Disabling time (e.g. re-adjust clock)
Page 52
52
© M
irce
a St
an, K
evin
Ska
dron
, Dav
id B
rook
s, 2
002
DTM: When, How, and What
Initiation Mechanism:
How do we enabletechnique?
Response Mechanism: What technique do we enable?
Trigger Mechanism:
When do we enable
DTM techniques?
Page 53
53
© M
irce
a St
an, K
evin
Ska
dron
, Dav
id B
rook
s, 2
002
DTM: Trigger Mechanisms
• Mechanism: How to deduce temperature?
• Direct approach: Temperature sensors providing feedback– Implemented in some
PowerPC chips (G3, G4) [Sanchez, 1997]
– Sensor quantity, placement, and precision will be discussed later
• Other indirect approaches possible
Policy: When to begin responding? Trigger level set too high:
Packaging cost will be high
Little advantage Trigger level set too low
Frequent triggering causes performance to suffer
Choose trigger level to exploit difference between average and worst-case power.
Page 54
54
© M
irce
a St
an, K
evin
Ska
dron
, Dav
id B
rook
s, 2
002
DTM: Initiation Mechanisms
• Operating system or microarchitectural control?– Hardware support can significantly reduce
performance penalty
• Policy Delay Settings– For Volt/Freq scaling, much of the performance
penalty can be attributed to enabling/disabling – Increasing policy delay reduces overhead;
smarter initiation techniques would help as well
Page 55
55
© M
irce
a St
an, K
evin
Ska
dron
, Dav
id B
rook
s, 2
002
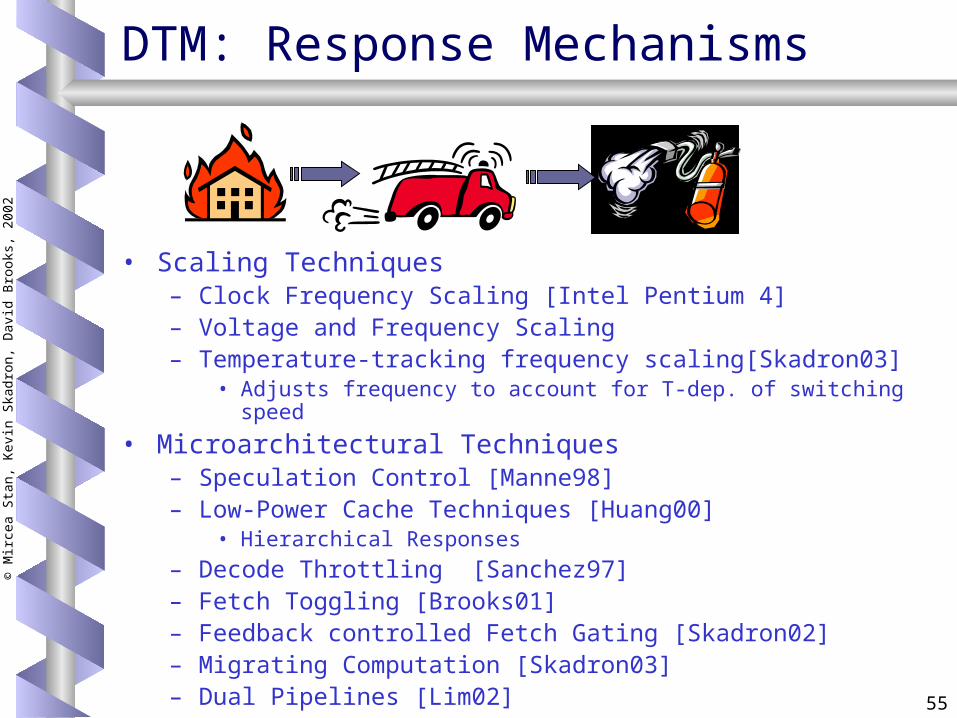
DTM: Response Mechanisms
• Scaling Techniques– Clock Frequency Scaling [Intel Pentium 4]– Voltage and Frequency Scaling– Temperature-tracking frequency scaling[Skadron03]
• Adjusts frequency to account for T-dep. of switching speed
• Microarchitectural Techniques– Speculation Control [Manne98]– Low-Power Cache Techniques [Huang00]
• Hierarchical Responses– Decode Throttling [Sanchez97]– Fetch Toggling [Brooks01]– Feedback controlled Fetch Gating [Skadron02]– Migrating Computation [Skadron03]– Dual Pipelines [Lim02]
Page 56
56
© M
irce
a St
an, K
evin
Ska
dron
, Dav
id B
rook
s, 2
002
Dynamic Voltage/Frequency Scale
• Voltage Scheduler predicts workload requirements
• Set frequency/voltage to near-optimal, energy savings
• Burd, et al., ISSCC2000– 5MHz @ 1.2V: 6 MIPS, 2.8mW– 80MHz @ 3.8V: 85 MIPS, 460mW– 70us 1.2V <-> 3.8V
• Transmeta Crusoe– Commercial implementation (500-700MHz,
1.2-1.6V)
Page 57
57
© M
irce
a St
an, K
evin
Ska
dron
, Dav
id B
rook
s, 2
002
Temperature-Tracking Frequency
Temperature affects :
• Transistor threshold and mobility
• Ion, Ioff, Igate, delay
• ITRS: 85°C for high-performance, 110°C for embedded!
• So adjust frequency as f(T) -- TTDFS
IonNMOS
Ioff
Page 58
58
© M
irce
a St
an, K
evin
Ska
dron
, Dav
id B
rook
s, 2
002
Speculation Control
• Manne et al. (ISCA ’98)– Branch confidence estimator used to determine
whether to speculate– Pipeline gating based on confidence estimation– 38% reduction in wrong-path instructions with ~1%
performance loss
• But Parikh et al. (HPCA ’02) found much smaller savings; ED product is zero or negative– Significant energy savings only come with significant
loss of performance– This is because many instructions are squashed early
in the pipeline, so reduction in wrong-path instructions is not a useful metric
– Benefit is actually a function of prediction accuracy• Only for very badly predicted programs do you get
benefit • Well-predicted programs suffer
Page 59
59
© M
irce
a St
an, K
evin
Ska
dron
, Dav
id B
rook
s, 2
002
Dynamic Hardware Resizing
• Complexity Adaptive Processors• Based on application characteristics
– Underutilized structures may be reduced with minimal performance impact
– Resize Caches, Issue Queues, etc.– Resize => Reduce Capacitance => Reduce
Energy– Of course, this only helps manage heat if it
reduces heat dissipation within hot spots• And does so for a sufficiently long duration
Page 60
60
© M
irce
a St
an, K
evin
Ska
dron
, Dav
id B
rook
s, 2
002
DEETM
• Dynamic Energy Efficiency and Temperature Management
• Slack algorithm detects if slowdown can be tolerated– If so, invoke techniques to reduce energy
• Temperature algorithm– If temperature limit is reached, invokes
techniques
• Techniques considered– Filter Cache, Voltage Scaling, etc.
Page 61
61
© M
irce
a St
an, K
evin
Ska
dron
, Dav
id B
rook
s, 2
002
Control-theoretic DTM
• Fetch toggling– disable fetch every N cycles– 4/5, 2/3, 1/2, 1/3, 1/5, …
– How to set the fetch rate?• (Assume idealized temperature sensing)
IF ID EX MEM WB
IF ID EX MEM WB
Page 62
62
© M
irce
a St
an, K
evin
Ska
dron
, Dav
id B
rook
s, 2
002
Feedback-Control of Fetch Toggling
• Formal feedback control
PID: m = KC (e + KIe + Kdde/dt)
• easy to compute• toggling = f(m)
Controller Actuator:I-fetch toggling
Thermaldynamics
Temp. sensor
e msetpoint P T
measured T
Page 63
63
© M
irce
a St
an, K
evin
Ska
dron
, Dav
id B
rook
s, 2
002
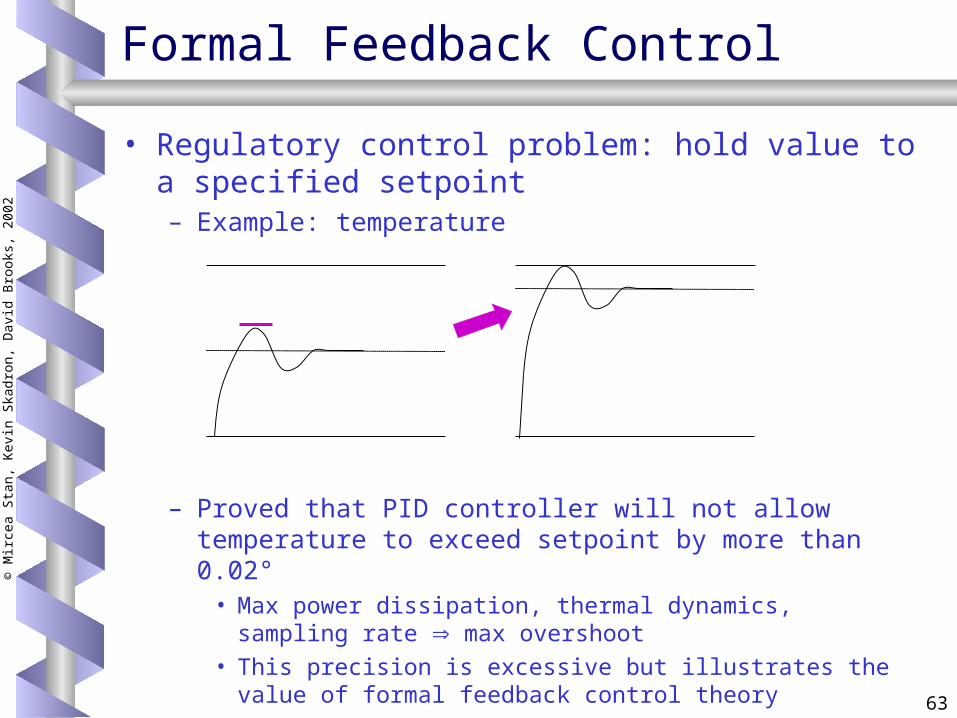
Formal Feedback Control
• Regulatory control problem: hold value to a specified setpoint– Example: temperature
– Proved that PID controller will not allow temperature to exceed setpoint by more than 0.02°
• Max power dissipation, thermal dynamics,sampling rate max overshoot
• This precision is excessive but illustrates the value of formal feedback control theory
Page 64
64
© M
irce
a St
an, K
evin
Ska
dron
, Dav
id B
rook
s, 2
002
Performance Loss
• Performance loss reduced by 65%
0%
5%
10%
15%
20%
25%
30%gc
c
mes
a art
equa
ke
craf
ty
face
rec
fma3
d
pars
er
eon
perlb
mk
vorte
x
bzip
ME
AN
Per
cen
t Lo
ss in
Per
form
ance
toggle1
PID
Page 65
65
© M
irce
a St
an, K
evin
Ska
dron
, Dav
id B
rook
s, 2
002
Migrating Computation
• When one unit overheats, migrate its functionality to a distant, spare unit (MC)– Spare register file (Skadron et al. 2003)– Separate core (CMP) (Heo et al. 2003)– Microarchitectural clusters– etc.
• Raises many interesting issues– Cost-benefit tradeoff for that area– Use both resources (scheduling)– Extra power for long-distance communication– Floorplanning
Page 66
66
© M
irce
a St
an, K
evin
Ska
dron
, Dav
id B
rook
s, 2
002
Migrating Computation – Reg File
Page 67
67
© M
irce
a St
an, K
evin
Ska
dron
, Dav
id B
rook
s, 2
002
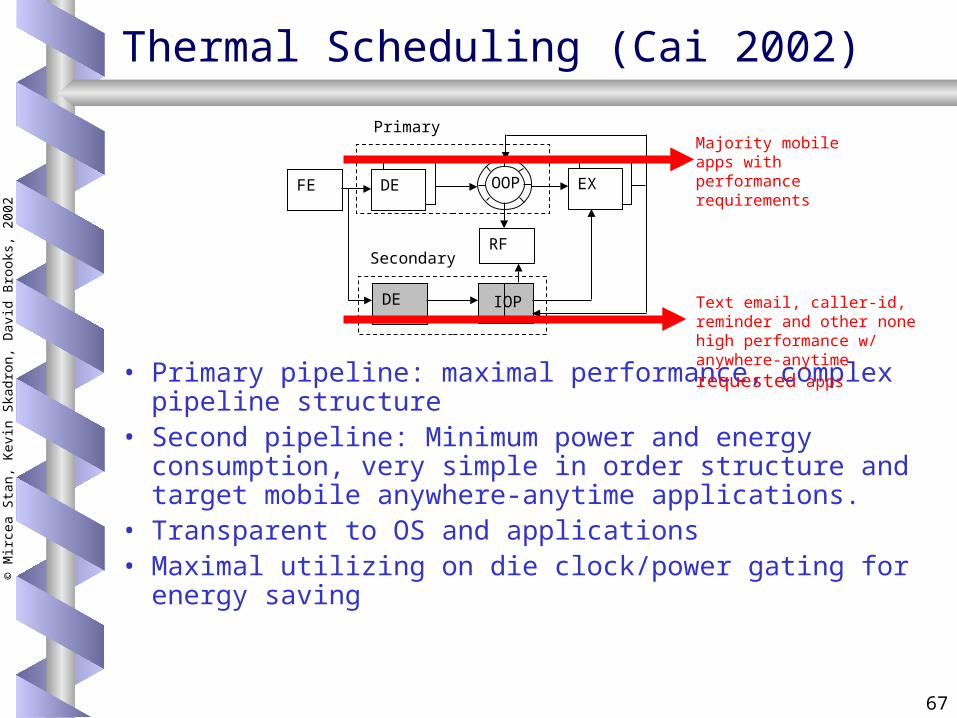
Thermal Scheduling (Cai 2002)
• Primary pipeline: maximal performance, complex pipeline structure
• Second pipeline: Minimum power and energy consumption, very simple in order structure and target mobile anywhere-anytime applications.
• Transparent to OS and applications• Maximal utilizing on die clock/power gating for
energy saving
FE DE EX
RF
DE IOP
OOP
Primary
Secondary
Majority mobile apps with performance requirements
Text email, caller-id, reminder and other none high performance w/ anywhere-anytime requested apps
Page 68
68
© M
irce
a St
an, K
evin
Ska
dron
, Dav
id B
rook
s, 2
002
Scheduling Algorithm (Cai 2002)
S1: Normal Operation (Primary Pipeline)S2: Stall Fetch & Clear PipelineS3: Alternate Operation (Secondary Pipeline)S4: Disable Clock or Scale F-V
S1
S2
S3
T1 < TH
S4
T1 TH
T1 TH
T1 TL
T1 TL
T1 > TL
& T2 < TH
T1 > TL
& T2 TH
T1 > TL
|| T2 > TL
T1 TL
& T2 TL
TS2
TS1
Temperature (C)Ta
Tmax
tcycle
TH
tcool theat
Time (s)
TL
Page 69
69
© M
irce
a St
an, K
evin
Ska
dron
, Dav
id B
rook
s, 2
002
Hybrid DTM
• DVS is attractive because of its cubic advantage– P V2f– This factor dominates when DTM must be aggressive– But changing DVS setting can be costly
• Resynchronize PLL• Sensitive to sensor noise spurious changes
• “ILP techniques” are attractive because they can use instruction level parallelism to hide/reduce impact of DTM
– Only effective when DTM is mild
• So use both!– Need to find “crossover point”
Page 70
70
© M
irce
a St
an, K
evin
Ska
dron
, Dav
id B
rook
s, 2
002
Hybrid DTM, cont.
• Combine fetch gating with DVS– When DVS is better, use it– Otherwise use fetch gating– Determined by magnitude of temperature overshoot– Crossover at FG duty cycle of 3– FG has low overhead: helps reduce cost of sensor
noise
1.0
1.1
1.2
1.3
20 5 2Duty Cycle
Slo
wd
ow
n
1.0
1.1
1.2
1.3
1.4
05101520Duty Cycle
Slo
wd
ow
n
FG
DVSHyb
Page 71
71
© M
irce
a St
an, K
evin
Ska
dron
, Dav
id B
rook
s, 2
002
Hybrid DTM, cont.
• DVS doesn’t need more than two settings for thermal control
– Lower voltage cools chip faster
• FG by itself does need multiple duty cycles and hence requires PI control
• But in a hybrid configuration, FG does not require PI control
– FG is only used at mild DTM settings– Can pick one fixed duty cycle
• This is beneficial because feedback control is vulnerable to noise
Page 72
72
© M
irce
a St
an, K
evin
Ska
dron
, Dav
id B
rook
s, 2
002
Simulation Details
• 85°C maximum temperature– Guard band requires a trigger threshold of 81.8°
• Ambient temperature (inside computer case): 45°C
• Rpackage = 0.8 K/W (old package model)– 0.7 K/W necessary if DTM not available
• Die thickness: 0.5mm• Currently neglecting interface material
• 9 SPEC2000 benchmarks, both integer and FP– 4 hover near 81.8°C, rest are above
• SimpleScalar/Wattch, modified to model pipeline and power of an Alpha 21364 as closely as possible
• Scaled to 130nm, 1.3V, 3.0 GHz
Page 73
73
© M
irce
a St
an, K
evin
Ska
dron
, Dav
id B
rook
s, 2
002
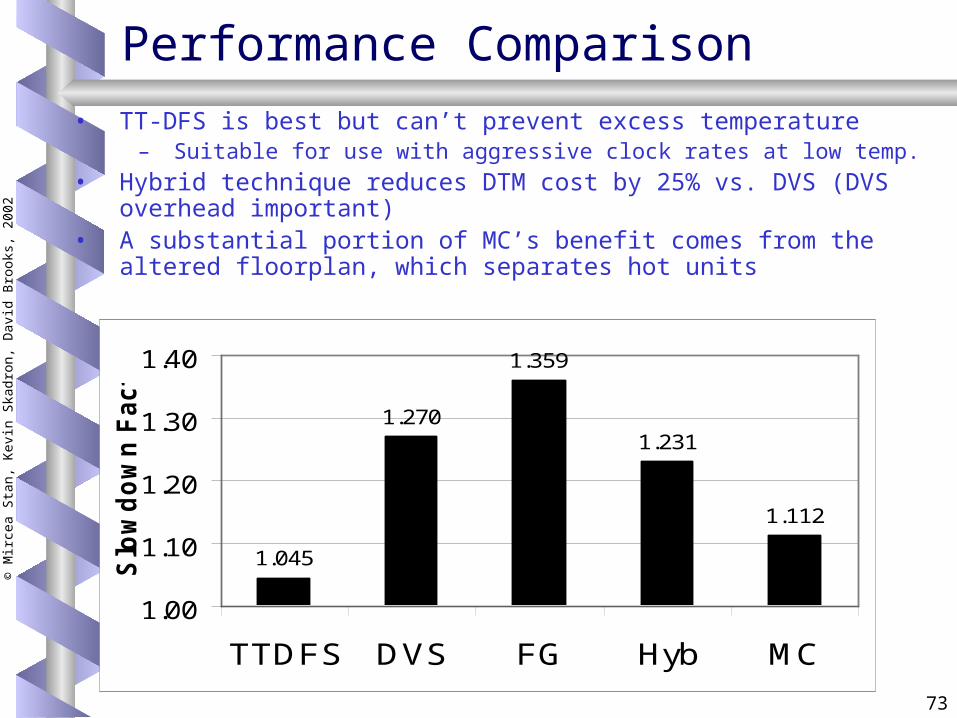
Performance Comparison
• TT-DFS is best but can’t prevent excess temperature– Suitable for use with aggressive clock rates at low temp.
• Hybrid technique reduces DTM cost by 25% vs. DVS (DVS overhead important)
• A substantial portion of MC’s benefit comes from the altered floorplan, which separates hot units
1.045
1.270
1.359
1.231
1.112
1.00
1.10
1.20
1.30
1.40
TTDFS DVS FG Hyb MC
Slo
wd
ow
n F
acto
r
Page 74
74
© M
irce
a St
an, K
evin
Ska
dron
, Dav
id B
rook
s, 2
002
Conclusions so far
• DTM can be used to reduce cooling costs• Proper modeling is required
– HotSpot is publicly available athttp://lava.cs.virginia.edu/HotSpot
• ILP matters• Hybrid techniques beneficial
– Merge advantages of different schemes– Simplify control
• Architectural techniques important in thermal design
• Growing use of clusters and redundant units opens an incredibly rich design space
Page 75
75
© M
irce
a St
an, K
evin
Ska
dron
, Dav
id B
rook
s, 2
002
DTM: Summary and Key Issues
• Dynamic optimizations translate max-power problem to average-power problem
• Heightens importance of average-power techniques like clock gating
• Key Issues:– Initiation interval– Collection of possible response mechanisms