ANNUALIZED TOTAL RETURN As at June 30, 2021 1-YEAR 5-YEAR SINCE INCEPTION* BIP (NYSE) 41% 21% 18% BIP (TSX) 28% 19% 24% BIPC (NYSE) 71% N/A 103% BIPC (TSX) 56% N/A 69% S&P 500 Index 41% 18% 11% S&P Utilities Index 16% 7% 7% S&P/TSX Composite Index 34% 11% 8% DJB Infrastructure Index** 20% 8% 6% PEER GROUP Includes dividend reinvestment. * BIP (NYSE) and U.S. index returns since Jan 2008; BIP (TSX) and Canadian index returns since Sept 2009 ** No dividend reinvestment for this index TRACK RECORD OF GROWTH 0.0 0.4 0.8 1.2 1.6 2.0 2009 3 PER UNIT FFO PER UNIT DISTRIBUTION 2021 3,4 2009 3 2021 3 $0.62 $3.27 $0.64 $2.04 10% CAGR 15% CAGR ANALYST COVERAGE Overview Brookfield Infrastructure Partners L.P. (BIP) and Brookfield Infrastructure Corporation (BIPC) own and operate a globally diversified portfolio of high-quality assets that generate sustainable and growing distributions over the long-term. With a distribution yield of approximately 4% 1 and a distribution growth target of 5%–9% annually, Brookfield Infrastructure offers an attractive risk-adjusted total return to its unitholders. Investment Highlights Globally diversified – one of the few pure-play, publicly traded, global infrastructure vehicles High-quality assets – premier utilities, midstream, transport and data operations with stable cash flows, high margins and strong internal growth prospects Growth – significant capital required to maintain and expand the infrastructure needs of the global economy resulting in potential acquisition opportunities Access to a leading asset management group – origination of opportunities through Brookfield’s network and participation in Brookfield-sponsored consortiums Experienced management team with proven track record – demonstrated commitment to growing returns to unitholders Brookfield Infrastructure Partners Brookfield Infrastructure Corporation INVESTOR FACT SHEET QUICK FACTS EXCHANGES NYSE: BIP TSX: BIP.UN NYSE: BIPC TSX: BIPC ~465M FULLY DILUTED UNITS $27B MARKET CAPITALIZATION 2 5 %-9 % TARGET DISTRIBUTION GROWTH ANNUALLY 60%-70% OF FFO TARGET PAYOUT RATIO $2.04 PER UNIT DISTRIBUTION ~4% YIELD 1 Barclays Moses Sutton BMO Capital Markets Devin Dodge CIBC Rob Catellier Citigroup Ryan Levine Credit Suisse Andrew Kuske Industrial Alliance Naji Baydoun National Bank Financial Rupert Merer Raymond James Frederic Bastien RBC Capital Markets Robert Kwan Scotia Capital Robert Hope TD Securities Cherilyn Radbourne Veritas Investment Research Dimitry Khmelnitsky Wells Fargo Jonathan Reeder 1. Based on the closing price of the partnership units at June 30, 2021. 2. Based on the closing price of the partnership units and Class A shares of BIPC at June 30, 2021. 3. Per unit FFO and distribution have been adjusted to reflect the dilutive impact of the BIPC special distribution and the 3-for-2 unit split completed in September 2016. 4. 2021 proforma FFO equal to annualized year-to-date Q2’21 FFO, normalized for Q1’21 gas storage results.
Transcript
A N N U A L I Z E D T O T A L R E T U R N
As at June 30, 2021 1-YEAR 5-YEARSINCE
INCEPTION*
BIP (NYSE) 41% 21% 18%
BIP (TSX) 28% 19% 24%
BIPC (NYSE) 71% N/A 103%
BIPC (TSX) 56% N/A 69%
S&P 500 Index 41% 18% 11%
S&P Utilities Index 16% 7% 7%
S&P/TSX Composite Index 34% 11% 8%
DJB Infrastructure Index** 20% 8% 6%
PEER GROUP
Includes dividend reinvestment.* BIP (NYSE) and U.S. index returns since Jan 2008; BIP (TSX) and Canadian index returns since Sept 2009 ** No dividend reinvestment for this index
T R A C K R E C O R D O F G R O W T H
0.0
0.4
0.8
1.2
1.6
2.0
20093
PER UNIT FFO PER UNIT DISTRIBUTION
20213,4 20093 20213
$0.62
$3.27
$0.64
$2.04
10% CAGR15% CAGR
A N A LY S T C O V E R A G E
Overview
Brookfield Infrastructure Partners L.P. (BIP) and Brookfield Infrastructure Corporation (BIPC) own and operate a globally diversified portfolio of high-quality assets that generate sustainable and growing distributions over the long-term. With a distribution yield of approximately 4%1 and a distribution growth target of 5%–9% annually, Brookfield Infrastructure offers an attractive risk-adjusted total return to its unitholders.
Investment Highlights
Globally diversified – one of the few pure-play, publicly traded, global infrastructure vehicles
High-quality assets – premier utilities, midstream, transport and data operations with stable cash flows, high margins and strong internal growth prospects
Growth – significant capital required to maintain and expand the infrastructure needs of the global economy resulting in potential acquisition opportunities
Access to a leading asset management group – origination of opportunities through Brookfield’s network and participation in Brookfield-sponsored consortiums
Experienced management team with proven track
record – demonstrated commitment to growing returns to unitholders
Q U I C K F A C T SE X C H A N G E SNYSE: BIPTSX: BIP.UNNYSE: BIPCTSX: BIPC
~465MFULLY DILUTED UNITS
$27BMARKET CAPITALIZATION2
5%-9%TARGET DISTRIBUTION GROWTH ANNUALLY
60%-70%OF FFO TARGET PAYOUT RATIO
$2.04PER UNIT DISTRIBUTION
~4%YIELD1
Barclays Moses Sutton
BMO Capital Markets Devin Dodge
CIBC Rob Catellier
Citigroup Ryan Levine
Credit Suisse Andrew Kuske
Industrial Alliance Naji Baydoun
National Bank Financial Rupert Merer
Raymond James Frederic Bastien
RBC Capital Markets Robert Kwan
Scotia Capital Robert Hope
TD Securities Cherilyn Radbourne
Veritas Investment Research Dimitry Khmelnitsky
Wells Fargo Jonathan Reeder
1. Based on the closing price of the partnership units at June 30, 2021.2. Based on the closing price of the partnership units and Class A shares of BIPC at June 30, 2021.3. Per unit FFO and distribution have been adjusted to reflect the dilutive impact of the BIPC special distribution and the 3-for-2 unit split
completed in September 2016.4. 2021 proforma FFO equal to annualized year-to-date Q2’21 FFO, normalized for Q1’21 gas storage results.
Operating SegmentsU T I L I T I E SRegulated or contracted businesses which earn a return on asset base
Comprised of businesses that provide regulated transmission and distribution of electricity and natural gas.This segment is geographically diverse, spanning seven countries — Canada, the United States, Mexico, Colombia, Brazil, India and the U.K.
T R A N S P O R TSystems involved in the movement of freight, commodities and passengers
Geographically diverse with large rail operations in Australia, Europe, the U.K., North and South America, toll roads in South America and India and aportfolio of diversified terminals across North America, Asia Pacific and the U.K.
M I D S T R E A MSystems that provide transmission and storage services
Midstream operations in Canada and the U.S.
D A T ABusinesses that provide essential services and critical infrastructure to transmit and store data globally
Consists of tower infrastructure operations in France, India, the U.K. and New Zealand and data storage operations in the U.S., Brazil and Australia
This fact sheet may contain forward-looking statements and information within the meaning of the Canadian provincial securities laws and other “forward-looking statements” within the meaning of Section 27A of the U.S. Securities Act of 1933, as amended, Section 21E of the U.S. Securities Exchange Act of 1934, as amended, “safe harbor” provisions of the United States Private Securities Litigation Reform Act of 1995 and in any applicable Canadian securities regulations. Forward-looking statements may include estimates, plans, expectations, opinions, forecasts, projections, guidance or other statements that are not statements of fact. Forward-looking statements can be identified by the use of words such as “growing” “target” and “expand” or variations of such words and phrases. Although Brookfield Infrastructure believes that such forward-looking statements and information are based upon reasonable assumptions and expectations, no assurance is given that such expectations will prove correct. The reader should not place undue reliance on forward-looking statements and information, as such statements and information involve known and unknown risks, uncertainties and other factors which may cause the actual results, performance or achievements of Brookfield Infrastructure to differ materially from anticipated future results, performance or achievement expressed or implied by such forward-looking statements and information. Except as required by law, Brookfield Infrastructure does not undertake any obligation to publicly update or revise any forward-looking statements or information, whether written or oral, that may be as a result of new information, future events or otherwise.
C O N T A C TKate White Manager, Investor Relations Tel: 416-956-5129
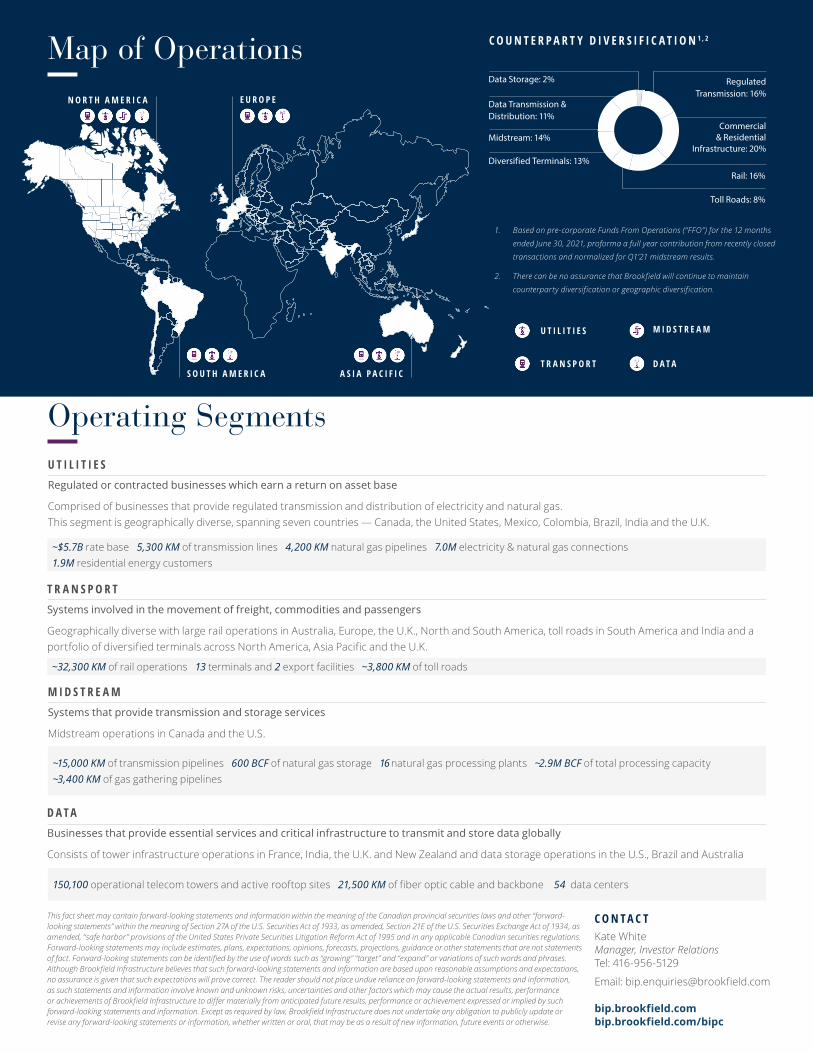
C O U N T E R P A R T Y D I V E R S I F I C A T I O N 1 , 2
Data Storage: 2%
Commercial & Residential
Infrastructure: 20%
~$5.7B rate base 5,300 KM of transmission lines 4,200 KM natural gas pipelines 7.0M electricity & natural gas connections 1.9M residential energy customers
~32,300 KM of rail operations 13 terminals and 2 export facilities ~3,800 KM of toll roads
150,100 operational telecom towers and active rooftop sites 21,500 KM of fiber optic cable and backbone 54 data centers
~15,000 KM of transmission pipelines 600 BCF of natural gas storage 16 natural gas processing plants ~2.9M BCF of total processing capacity~3,400 KM of gas gathering pipelines
M I D S T R E A M
D A T A
U T I L I T I E S
T R A N S P O R T
Map of OperationsN O R T H A M E R I C A E U R O P E
A S I A P A C I F I CS O U T H A M E R I C A
Toll Roads: 8%
Rail: 16%
Data Transmission & Distribution: 11%
Regulated Transmission: 16%
Midstream: 14%
Diversified Terminals: 13%
1. Based on pre-corporate Funds From Operations (“FFO”) for the 12 months
ended June 30, 2021, proforma a full year contribution from recently closed
transactions and normalized for Q1’21 midstream results.
2. There can be no assurance that Brookfield will continue to maintain
counterparty diversification or geographic diversification.