Overview Eric Lian President & CEO, UOB China Christine Ip CEO, UOB Hong Kong UOB Greater China Corporate Day 31 August – 1 September 2015 Disclaimer: This material that follows is a presentation of general background information about the Bank’s activities current at the date of the presentation. It is information given in summary form and does not purport to be complete. It is not to be relied upon as advice to investors or potential investors and does not take into account the investment objectives, financial situation or needs of any particular investor. This material should be considered with professional advice when deciding if an investment is appropriate. UOB accepts no liability whatsoever with respect to the use of this document or its content.
Transcript
Overview
Eric Lian
President & CEO, UOB China
Christine Ip
CEO, UOB Hong Kong
UOB Greater China
Corporate Day
31 August – 1 September 2015
Disclaimer: This material that follows is a presentation of general background
information about the Bank’s activities current at the date of the presentation. It is
information given in summary form and does not purport to be complete. It is not to
be relied upon as advice to investors or potential investors and does not take into
account the investment objectives, financial situation or needs of any particular
investor. This material should be considered with professional advice when
deciding if an investment is appropriate. UOB accepts no liability whatsoever with
respect to the use of this document or its content.
2
INTRODUCTION 1
EXPOSURE TO CHINA 3
CHINA’S ‘ONE BELT, ONE ROAD’ INITIATIVE 2
Agenda
STRATEGY FOR UOB GREATER CHINA 4
UOB GREATER CHINA’S FINANCIALS 5
3
• A wholly-owned
subsidiary of UOB
Group
• Incorporated in 2007
and headquartered
in Shanghai
• Registered capital:
RMB5.5 billion; total
equity base: RMB6.6
billion as at June
2015
• Full wholesale
banking and
selected retail
banking
• Established in 1984
• Covering 17 outlets
across 11 cities
• Rated A+ by Fitch
• Over 1,000 staff
• Shanghai Gold
Membership in
2011
• Local unit trust
license in 2013
• Shanghai Gold
Export & Import
license in 2015
UOB China’s Profile Highlights
Artist’s impression
30 Years in China
4
2,050
1,417
889
530
374
402
290
327
308
574
250 Pakistan
Nigeria
Singapore*
Malaysia*
HK
UAE
Thailand*
Taiwan
Indonesia*
S. Korea
India
China 10,380
Combined GDP of
countries in
Southeast Asia (*):
USD1.9 trillion
12%
Average GDP
growth over
2011–2014
GDP
(USD billion)
11%
12%
9%
13%
11%
9%
12%
13%
14%
9%
11%
10%
1
1
1
5
1
3
1
1
2
Number of
UOB China
branches
2014 GDP of Selected Countries 2014 GDP of Selected
Chinese Provinces and Cities
World’s 2nd Largest and Fastest Growing
Economy
1,100
1,057
965
652
465
463
382
390
346
288
255
255
232
Guangdong
Jiangsu
Shandong
Zhejiang
Liaoning
Sichuan
Shanghai
Fujian
Beijing
Inner…
Jiangxi
Tianjin
Chongqing 1
(USD billion)
Inner
Mongolia
Sources: IMF and National Bureau of Statistics
5
Guangdong
Guangzhou (1)
Shenzhen (1)
Shanghai (5)
1 Main, 4 Sub
Zhejiang
Hangzhou (1)
Tianjin (1)
Beijing (3)
1 Main, 2 Sub
Sichuan
Chengdu (1)
Fujian
Xiamen (1)
Liaoning
Shenyang (1)
Chongqing (new)
Bohai
Yangtze River Delta
Pearl River Delta
(PRD)
West Area Jiangsu
Suzhou (new)
UOB is Well-Represented Throughout China
6
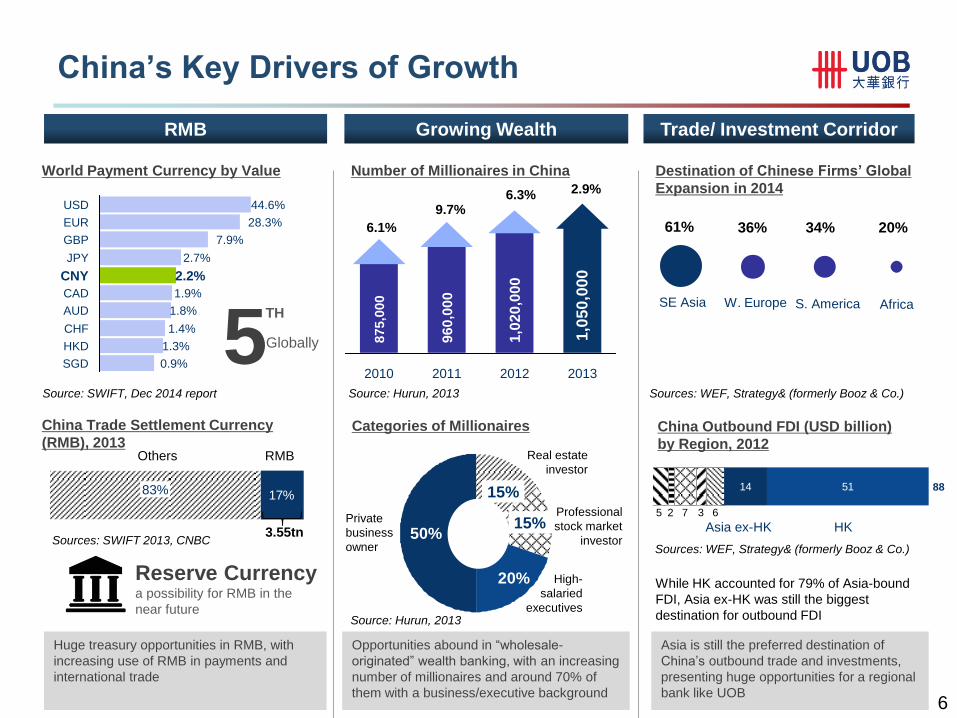
While HK accounted for 79% of Asia-bound
FDI, Asia ex-HK was still the biggest
destination for outbound FDI
1.4%
AUD
0.9%
EUR
GBP 7.9%
JPY
1.9%
44.6%
CHF
1.8%
CAD
1.3%
SGD
28.3%
CNY 2.2%
HKD
USD
2.7%
Source: SWIFT, Dec 2014 report
World Payment Currency by Value
5 TH
Globally
Reserve Currency
a possibility for RMB in the
near future
2012 2010 2011 2013
1,0
20
,00
0
875,0
00
96
0,0
00
1,0
50
,000
6.1%
9.7% 6.3% 2.9%
Number of Millionaires in China
Source: Hurun, 2013
20%
15%
15% 50%
Private
business
owner
High-
salaried
executives
Professional
stock market
investor
Real estate
investor
Source: Hurun, 2013
Categories of Millionaires
Opportunities abound in “wholesale-
originated” wealth banking, with an increasing
number of millionaires and around 70% of
them with a business/executive background
17%83%
3.55tn
Huge treasury opportunities in RMB, with
increasing use of RMB in payments and
international trade
China Trade Settlement Currency
(RMB), 2013 RMB Others
Sources: SWIFT 2013, CNBC
W. Europe SE Asia Africa S. America
61% 36% 34% 20%
Destination of Chinese Firms’ Global
Expansion in 2014
Sources: WEF, Strategy& (formerly Booz & Co.)
14 51
Asia ex-HK 6 5 2
HK
88
3 7
China Outbound FDI (USD billion)
by Region, 2012
Sources: WEF, Strategy& (formerly Booz & Co.)
Asia is still the preferred destination of
China’s outbound trade and investments,
presenting huge opportunities for a regional
bank like UOB
RMB Growing Wealth Trade/ Investment Corridor
China’s Key Drivers of Growth
7
CHINA’S ‘ONE BELT, ONE ROAD’ INITIATIVE 2
INTRODUCTION 1
Agenda
EXPOSURE TO CHINA 3
STRATEGY FOR UOB GREATER CHINA 4
UOB GREATER CHINA’S FINANCIALS 5
8
China’s ‘One Belt, One Road’ Initiative
Taiwan
Hong Kong
Philippines
Brunei
Malaysia
Singapore
Indonesia
Thailand
Myanmar
Vietnam
India
China
UOB has around 500 branches in Asia, covering >10 countries and regions along
“One Belt, One Road”; ASEAN a key bloc along the 21st Century Maritime Silk Road
9
China
Our Value Propositions
State-owned
enterprises &
large local
corporates
Strategy Focus Industries Products
• International-
isation
• Construction
• Transportation
• Power
• Heavy machinery
• Port and logistics
• Industrial
• Financial leasing
• FDI advisory
• Project financing
• Syndication loans
• M&A loans
• Bond issuance
• RMB cross-border
trade settlement and
financing
• RMB cross-border
two-way pool
• FX hedging
Geographies
• Indonesia
• Malaysia
• Thailand
• India
• Vietnam
• Myanmar
• Laos
• Cambodia
Local
corporates
and network
clients
• Public-private
partnerships
(PPP)
• Transport
• Modern logistics
• Info communications
• Medical
• Tourism
• Education
• Financial service
• Financial leasing
• Indonesia
• Thailand
• Malaysia
• Vietnam
• Myanmar
• RMB cross-border
trade settlement &
financing
• RMB cross-border
two-way pool
• FX hedging
• FDI advisory
• Project Financing
• Syndication loans
10
EXPOSURE TO CHINA 3
INTRODUCTION 1
CHINA’S ‘ONE BELT, ONE ROAD’ INITIATIVE 2
Agenda
STRATEGY FOR UOB GREATER CHINA 4
UOB GREATER CHINA’S FINANCIALS 5
11
Exposure to Mainland China1
Others2, S$1.6b
Non-bank,
S$8.1b
Bank, S$10.7b
Bank exposure in China
• 99% with <1 year tenor
• Top 5 domestic banks accounted for c.70% of bank exposures
Non-bank exposure in China
• Breakdown by customer type:
• Well-diversified by industry –
with top 3 industry exposures in
manufacturing, real estate and
housing loans (each at 20-30%
of total loans)
State-owned companies,
~40%
Foreign investment enterprises,
~25%
Privately owned
enterprises, ~25%
Individuals, ~10%
• No exposure to Qingdao fraud and local government
financing vehicles (LGFV)
• c.70% of loans denominated in RMB
• Tenor of loans:
• c.40% less than 1 year
• c.60% more than 1 year, of which roughly a quarter fully cash-
backed and another half secured by legal mortgage
• Proactive and disciplined risk management: Early alert process
• Stress test and industry trigger
• Portfolio underwriting standards
Total:
S$20.4b
1. Exposure as of 30 June 2015
2. ‘Others’ comprise mainly debt securities
12
INTRODUCTION 1
CHINA’S ‘ONE BELT, ONE ROAD’ INITIATIVE 2
Agenda
STRATEGY FOR UOB GREATER CHINA 4
EXPOSURE TO CHINA 3
UOB GREATER CHINA’S FINANCIALS 5
13
China
Hong Kong Taiwan
Philippines
Myanmar
Indonesia
Singapore
Malaysia
Thailand Vietnam
Brunei
Increasing Business Flows Between
Greater China and Southeast Asia
14
Hong Kong is UOB’s product and solutions hub; China and
Taiwan focus on deal origination
Focus on wholesale banking strategy in the first phase
Client:
Wholesale Banking
Segment
Product:
Role Specialisation
Geography:
Greater China intra-
region & inter-region
Drive cross-border business intra-region within Greater China,
as well as inter-region amongst Greater China, Southeast Asia
and the rest of UOB franchise
Greater China: Where to Play?
15
International network of c.500 offices in 19 countries and territories
Largest ASEAN footprint among the three Singapore banks; operating
through key banking subsidiaries in Malaysia, Thailand and Indonesia
Well-positioned to capture inter-regional flows
Nimble and agile in terms of execution; speed of delivery with innovative
solutions to support
Comprehensive product and solution teams based in Hong Kong hub to
support client requirements for Greater China
Global Network
with Unrivaled
ASEAN Footprint
Execution
Excellence
Greater China: How to Win?
Established local leadership teams who understand Asian clients and
build stronger banking relationships with them Strong Local
Leadership
16
INTRODUCTION 1
CHINA’S ‘ONE BELT, ONE ROAD’ INITIATIVE 2
Agenda
UOB GREATER CHINA’S FINANCIALS 5
EXPOSURE TO CHINA 3
STRATEGY FOR UOB GREATER CHINA 4
17
105 147 222 272 305
171 197
3% 5%
7% 8% 8% 9% 11%
2010 2011 2012 2013 2014 1H14 1H15
NBPT (GC) Contribution to UOB Group
Income
SGD million / Ratio %
Net Profit Before Tax (NPBT)
SGD million / Ratio %
Expenses and Cost-to-Income Ratio (CIR)
SGD million / Ratio %
31%
CAGR
Sources: Annual reports and financial statements
Rising Contributions to Group’s Income and
NPBT
130 147 181 206 235 128 148 227
323 414 502 587
304 341
57.1% 45.5% 43.7% 41.0% 40.2% 42.3% 43.3%
2010 2011 2012 2013 2014 1H14 1H15
Non NII Total Income Non NII Ratio
27%
CAGR 16%
CAGR
115 164 182 218 266 120 153
50.5% 50.9% 44.0% 43.5% 45.4%
39.5% 44.8%
2010 2011 2012 2013 2014 1H14 1H15
Expense CIR
23%
CAGR
18
Total Assets
SGD billion
Net Loans and NIM
SGD billion / Ratio %
Sources: Annual reports and financial statements
Non-Bank Deposits and LDR
SGD billion / Ratio %
11.9 19.1 19.6
27.4 32.0 29.1 31.8
2010 2011 2012 2013 2014 1H14 1H15
28%
CAGR
Healthy Growth in Loans and Deposits
5.2 8.4 9.1 12.2 16.7 14.3
17.7
1.11% 1.20% 1.27% 1.39% 1.21% 1.24% 1.25%
2010 2011 2012 2013 2014 1H14 1H15
Net Loans NIM
34%
CAGR
5.7 10.4 10.1
13.5 15.0 13.9 12.7
91.5% 80.7% 90.5% 90.3%
111.5% 103.0% 139.6%
2010 2011 2012 2013 2014 1H14 1H15
Non Bank Deposits LDR
27%
CAGR
19
NPL / NPL Ratio1
SGD billion / Ratio %
Allowances Coverage1
Ratio %
Resilient Asset Quality; Strong Capital Position
Sources: Annual reports and financial statements
1. Financial data from 2010-2012 based on booking centre; financial data from 2013 onwards based on where credit risks reside, largely
represented by the borrower's country of incorporation/operation (for non-individuals) and residence (for individuals).
2. Exposure based on where credit risks reside, largely represented by the borrower's country of incorporation/operation (for non-individuals) and
residence (for individuals).
China 52%
Hong Kong 43%
Taiwan 5%
Greater China Exposure2
SGD
39.5b
0.06 0.03 0.04
0.13 0.12 0.12 0.15
1.2%
0.4% 0.5% 0.7%
0.5% 0.6% 0.6%
2010 2011 2012 2013 2014 1H14 1H15
NPL NPL Ratio
104.9%
222.6% 171.4% 88.9%
109.7% 106.7% 98.0%
376.5%
222.6% 200.0% 177.8% 191.5% 196.9% 153.7%
2010 2011 2012 2013 2014 1H14 1H15
Allowance as % of NPLAllowance as % of unsecured NPL