Annual Report and Audited Financial Statements for the year ended 30 September 2017 a Overview Fund Manager’s Report Governance Financial Statements WELPUT West End of London Property Unit Trust Annual Report and Audited Financial Statements For the year ended 30 September 2017 For professional investors and advisers only
Transcript
Annual Report and Audited Financial Statementsfor the year ended 30 September 2017 a
Ove
rvie
wFu
nd
Ma
na
ge
r’s
Re
po
rtG
ove
rna
nce
Fin
an
cia
l S
tate
me
nts
Ove
rvie
wFu
nd
Ma
na
ge
r’s
Re
po
rtG
ove
rna
nce
Fin
an
cia
l S
tate
me
nts
WELPUT West End of London Property Unit TrustAnnual Report andAudited Financial StatementsFor the year ended 30 September 2017
For professional investors and advisers only
Annual Report and Audited Financial Statementsfor the year ended 30 September 2017 1
Ove
rvie
wFu
nd
Ma
na
ge
r’s
Re
po
rtG
ove
rna
nce
Fin
an
cia
l S
tate
me
nts
Ove
rvie
wFu
nd
Ma
na
ge
r’s
Re
po
rtG
ove
rna
nce
Fin
an
cia
l S
tate
me
nts
Contents
Overview
Highlights for the year ended 30 September 2017 2
Portfolio Map 3
Portfolio Profile 4
Investment Approach 5
Investment Report
Overview 6
Market Commentary 7
Performance 8
Strategy 9
Asset Management 10
Outlook 15
Debt 16
Responsible Investment and Sustainability 17
Governance Report
Responsibility of the Manager 20
Trustees’ Responsibilities 20
Trust Matters 21
Accounting for Debt Instruments 21
Reporting Fund Regime 21
Capital Gains Tax 22
Alternative Investment Fund Management Directive 22
Holders Advisory Committee 22
Independent Property Valuer’s Report 23
Financial Statements
Independent Auditors’ Report 24
Consolidated Statement of Financial Position 26
Consolidated Statement of Comprehensive Income 27
Consolidated Statement of Changes in Net Assets 28
Consolidated Cash Flow Statement 29
Notes to the Financial Statements 30
Unaudited Environmental Data Report 45
Unaudited General Information 51
Group Structure 55
Key Service Providers 56
Ove
rvie
wIn
ve
stm
en
t R
ep
ort
Go
ve
rna
nce
Re
po
rtFin
an
cia
l S
tate
me
nts
Highlights for the year ended 30 September 2017
Overview
WELPUT was formed in 2001 and is the largest unlisted specialistreal estate fund that invests in central London offices. It owns aportfolio of 12 assets valued at over £1.1 billion.
2WELPUT
Total return over five years of
14.0% p.a.Underlying portfolio valued at over
£1.1bn
Reversionary yield
5.2%
Number of tenants
80
20.4%loan to value% of Aggregate Trust Value
12assets in the portfolio
Weighted average unexpired lease term (WAULT)
6.7 years1
£236mof unitholder liquidity
over the past 12 months
1To the first break
Ove
rvie
w
Annual Report and Audited Financial Statementsfor the year ended 30 September 2017 3
OverviewPortfolio Map1
London
1Map shows location of assets, both directly owned and those invested in via collective investment schemes. Marker is not proportionate to asset’s value.
Source: Schroders, 30 September 2017
6
1
1110 129
2 3
5 7
4
8
Stirling Square, 5/7 CarltonGardens, SW1
143/157 Farringdon Road, EC1
101 New Cavendish Street, W1
Orion House, 5 Upper StMartin’s Lane, WC2
7 Bishopsgate, EC298 Theobald’s Road, WC1
Southside, 105 Victoria Street,Victoria, SW1
10/18 Regent’s Wharf, King’s Cross, N1
North West House, 119/127Marylebone Road, NW1
Bury House, 31 Bury Street, EC3
20 St James’s Street, SW1 6 Babmaes Street, SW1
4WELPUT
OverviewPortfolio Profile
As at/For the As at/For the As at/For theyear to year to year to
30 September 2017 30 September 2016 30 September 2015
Financial Information
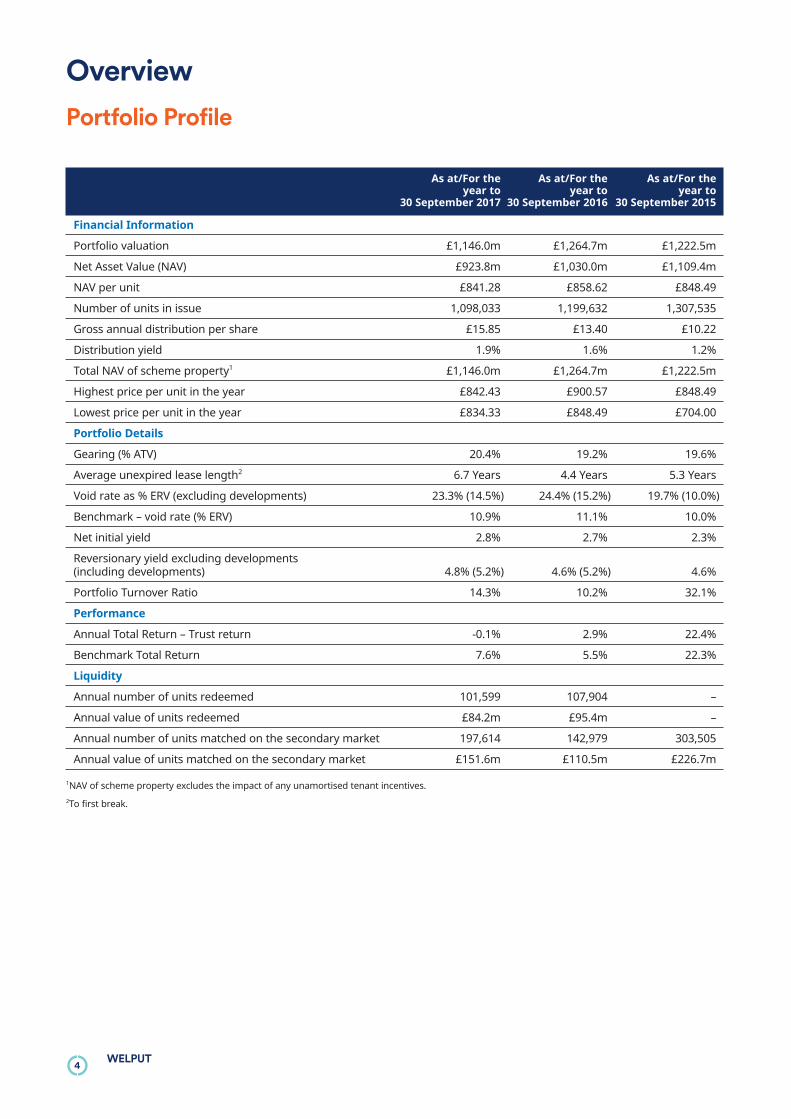
Portfolio valuation £1,146.0m £1,264.7m £1,222.5m
Net Asset Value (NAV) £923.8m £1,030.0m £1,109.4m
NAV per unit £841.28 £858.62 £848.49
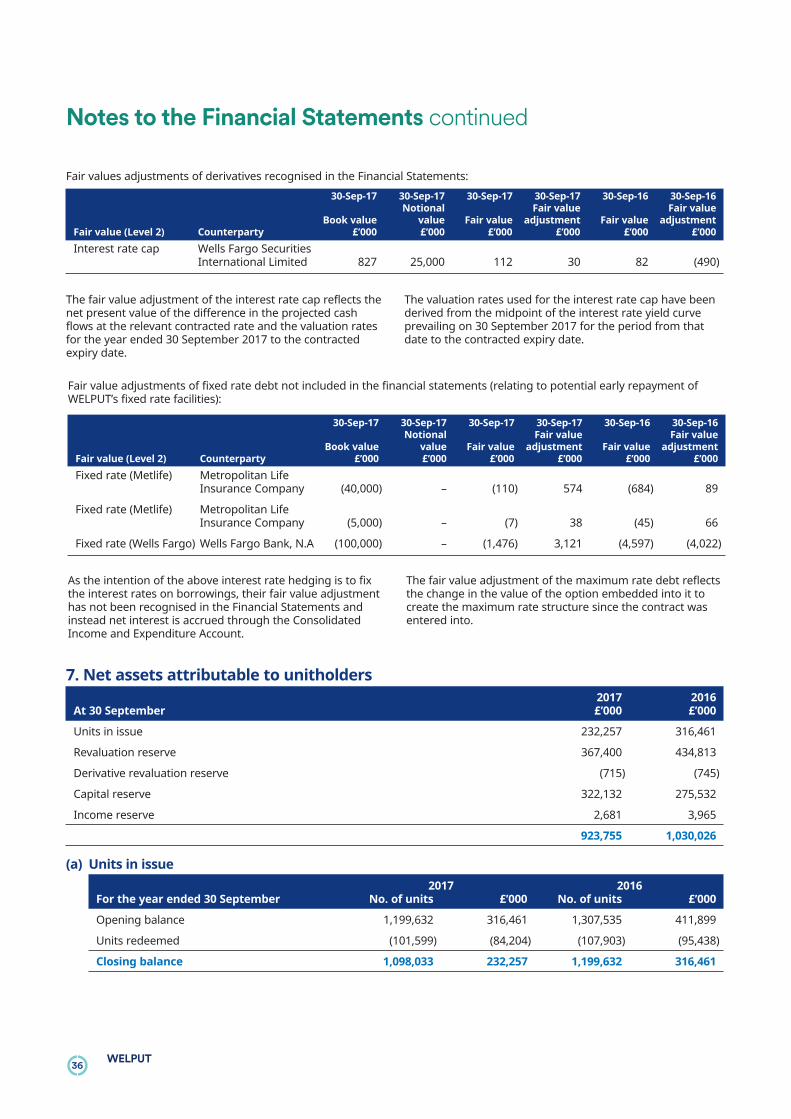
Number of units in issue 1,098,033 1,199,632 1,307,535
Gross annual distribution per share £15.85 £13.40 £10.22
Distribution yield 1.9% 1.6% 1.2%
Total NAV of scheme property1 £1,146.0m £1,264.7m £1,222.5m
Highest price per unit in the year £842.43 £900.57 £848.49
Lowest price per unit in the year £834.33 £848.49 £704.00
Portfolio Details
Gearing (% ATV) 20.4% 19.2% 19.6%
Average unexpired lease length2 6.7 Years 4.4 Years 5.3 Years
Annual Total Return – Trust return -0.1% 2.9% 22.4%
Benchmark Total Return 7.6% 5.5% 22.3%
Liquidity
Annual number of units redeemed 101,599 107,904 –
Annual value of units redeemed £84.2m £95.4m –
Annual number of units matched on the secondary market 197,614 142,979 303,505
Annual value of units matched on the secondary market £151.6m £110.5m £226.7m
1NAV of scheme property excludes the impact of any unamortised tenant incentives.
2To first break.
Annual Report and Audited Financial Statementsfor the year ended 30 September 2017 5
Ove
rvie
w
OverviewInvestment Approach
1. Research-led approach
We use our detailed research and on-the-ground experienceto target investments in central London markets withenduring occupier appeal, alongside emerging sub-markets
which can benefit from strong rental growth due toinfrastructure improvements and increasing tenant demand.
2. Portfolio management
The portfolio will comprise properties at different stages oftheir business plans and will have a blend of income andgrowth characteristics. Properties are selected by specificlocation and condition and are intensively managed to
generate attractive returns over the medium term. Gearingwill be used selectively to diversify portfolio holdings,improve operational flexibility and to enhance trust returnsover the property cycle.
3. Clear execution of business plans
Every property is managed to a detailed business plan whichis regularly reviewed and updated. Once a business plan iscompleted a review will be undertaken to establish if the
capital should be recycled into new opportunities providinghigher risk adjusted returns. Over WELPUT’s entire life,properties have been held for an average of five years.
WELPUT’s investment objective is to invest into and manage aportfolio of primarily office properties in central London. This willbe focused within the West End and Midtown, but will include theCity and other areas of Inner London. WELPUT aims to achieve atotal return at an average of 1% per annum above its MSCI (formerlyIPD) Benchmark1 over rolling three year periods.
1MSCI Benchmark is MSCI central London & Inner London Offices Quarterly Index since 1 January 2015. Prior to this it was MSCI West End and MidTown Quarterly Index.
6WELPUT
Investment ReportOverview
Despite ongoing political and economic uncertainty,investment demand for central London offices remainsstrong. International investors, notably from Asia, have beenbuyers of larger lots, driving investment volumes to thehighest levels since 2014. Meanwhile, City and West Endleasing transactions remain at above average levels, drivenby continued demand from the media and creativeindustries.
Our strategy of increasing the portfolio’s defensive qualitiescontinued during the year, with the average unexpired leaseterm, to first break, increasing from 4.4 to 6.7 years. The levelof development risk has also been reduced in line with thestrategy.
While the portfolio underperformed its Benchmark duringthe year, we believe WELPUT is well positioned to achieve itsobjective over the medium term. We will continue ourstrategy of crystallising the portfolio’s reversion andenhancing its defensive qualities
Following the year end, progress has been made executingthis strategy, including pre-letting to WeWork and exchangeof contracts for sale at North West House NW1, occupationallease regear with BAE Systems at Stirling Square, SW1 and aheadlease re-gear at 20 St James’s Street, SW1 with asimultaneous sale of 6 Babmaes Street.
Stirling Square, 5/7 Carlton Gardens, SW1
Annual Report and Audited Financial Statementsfor the year ended 30 September 2017 7
Inve
stm
en
t R
ep
ort
Investment ReportMarket Commentary
Overview
The UK economy grew by 1.6% over the year to30 September 2017, negatively impacted by rising inflationand lower levels of business investment. In November 2017,the Bank of England raised the base rate to 0.5% supportingsterling and restraining import prices. We anticipate thatinterest rates will remain low due to Brexit-relateduncertainty and the absence of strong wage growth.
Supply and demand
Demand for office space remains robust with take-up of13 million sq ft over the year to 30 September 2017. Thiscompares favourably with the long term trend of 12.2 millionsq ft per annum (source: CBRE). Good levels of demand camefrom professional services, tech and media firms andGovernment offices as they consolidate into fewer, largerhubs.
Whilst vacancy rates have risen, particularly in the City ofLondon, supply-side pressure appears to be easing, as thelevel of new office construction has fallen significantly sinceJune 2016. New starts are down 55% on the long-termquarterly average, thus reducing the pipeline over the nexttwo to three years as fewer completions are realised.
Investment market
The level of investment transactions held up well in the12 months to September 2017, at £14.1 billion, well abovethe long-term level of £11.6 billion. Buoyed by the sale oftrophy buildings such as the Leadenhall Building (the“Cheesegrater”) and 20 Fenchurch Street (the “Walkie Talkie”)for £1.1 billion and £1.3 billion respectively, the averagetransaction value at £86 million is significantly larger than thelong term average of £51 million (source: Costar).
Private and institutional investors from the Middle East andChina/Hong Kong accounted for 67% of the purchases in the12 months to end September 2017. Prime office yields wereunchanged over the period in the West End, and fell by0.25% in the City*, reflecting new benchmark levels for superprime trophy assets.
*Source CBRE
143/157 Farringdon Road, EC1
8WELPUT
Investment ReportPerformance
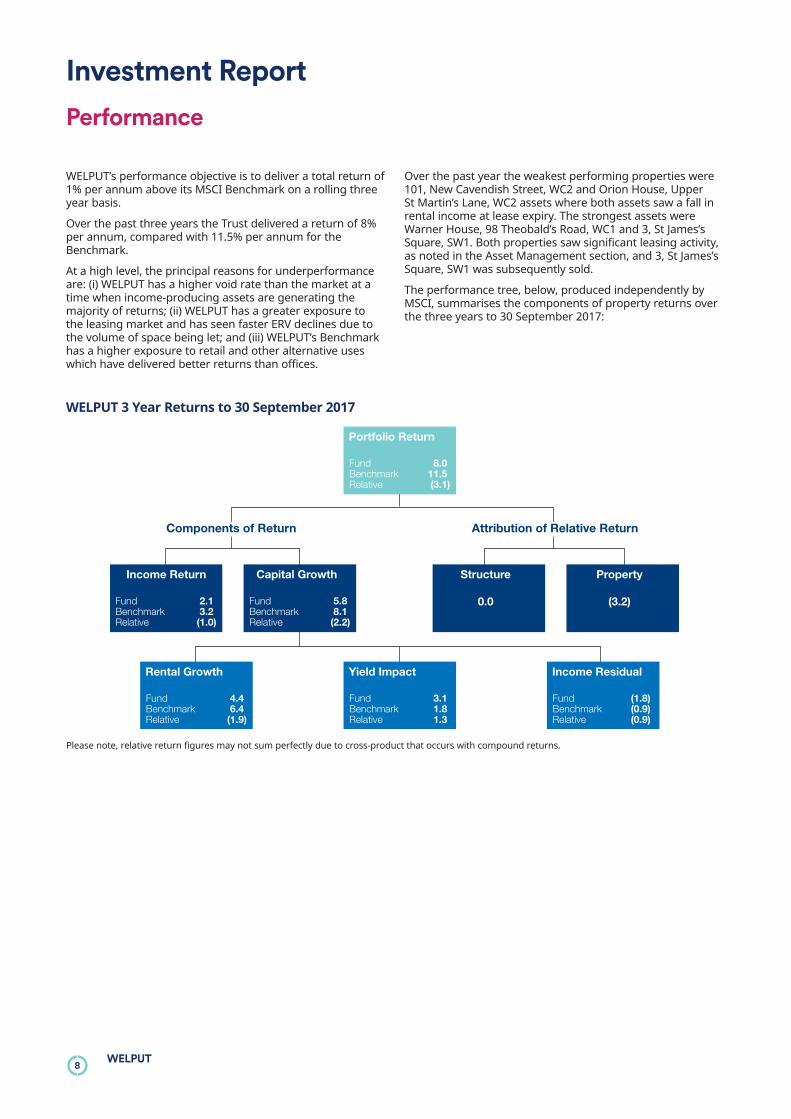
WELPUT’s performance objective is to deliver a total return of1% per annum above its MSCI Benchmark on a rolling threeyear basis.
Over the past three years the Trust delivered a return of 8%per annum, compared with 11.5% per annum for theBenchmark.
At a high level, the principal reasons for underperformanceare: (i) WELPUT has a higher void rate than the market at atime when income-producing assets are generating themajority of returns; (ii) WELPUT has a greater exposure tothe leasing market and has seen faster ERV declines due tothe volume of space being let; and (iii) WELPUT’s Benchmarkhas a higher exposure to retail and other alternative useswhich have delivered better returns than offices.
Over the past year the weakest performing properties were101, New Cavendish Street, WC2 and Orion House, UpperSt Martin’s Lane, WC2 assets where both assets saw a fall inrental income at lease expiry. The strongest assets wereWarner House, 98 Theobald’s Road, WC1 and 3, St James’sSquare, SW1. Both properties saw significant leasing activity,as noted in the Asset Management section, and 3, St James’sSquare, SW1 was subsequently sold.
The performance tree, below, produced independently byMSCI, summarises the components of property returns overthe three years to 30 September 2017:
Portfolio Return
Fund 8.0Benchmark 11.5Relative (3.1)
Income Return
Fund 2.1Benchmark 3.2Relative (1.0)
Rental Growth
Fund 4.4Benchmark 6.4Relative (1.9)
Yield Impact
Fund 3.1Benchmark 1.8Relative 1.3
Income Residual
Fund (1.8)Benchmark (0.9)Relative (0.9)
Capital Growth
Fund 5.8Benchmark 8.1Relative (2.2)
Structure
0.0
Property
(3.2)
Components of Return Attribution of Relative Return
WELPUT 3 Year Returns to 30 September 2017
Please note, relative return figures may not sum perfectly due to cross-product that occurs with compound returns.
Annual Report and Audited Financial Statementsfor the year ended 30 September 2017 9
Inve
stm
en
t R
ep
ort
Investment ReportStrategy
WELPUT’s strategy is to own a diversified portfolio of centralLondon offices combining income-producing assets withthose offering higher returns and diversification throughvalue enhancement opportunities; refurbishment; andredevelopment. The level of risk and mix of asset type willdepend on market conditions. The current market conditionshave led us to adopt a more cautious strategy focused on: (1)extending the portfolio’s income profile, and (2) reducingvoids, thereby enhancing the portfolio’s defensive qualities.
During the year to 30 September 2017, good progress hasbeen made. As described in the next section of this report,16 new lettings were completed, five leases regeared andfour rent reviews completed providing additional income of£11.1 million per annum. The security of income has beensubstantially increased with the weighted average unexpiredlease term rising to 6.7 years at September 2017, from4.4 years one year earlier. WELPUT has also reduced mediumterm risk by delaying major capital expenditure decisions. AtRegent’s Wharf in King’s Cross, development has beendeferred by two years through short-term lease extensions,while the long lease to WeWork at NorthWest House(announced post year end) reduced development risk andincreased income. Subsequent to the letting, contracts havebeen exchanged for sale of North West House Unit Trustcrystallising a value uplift.
Managing liquidity remained a key strategic considerationduring the year. The profitable sale of 3, St James’s Square,SW1 demonstrates our ability to manage liquidity whilebalancing the interests of all unitholders. The proceeds ofsale were partially used to pay outstanding redemptions of£84.2 million, following the 2016 redemption period, whileproviding capital for value-enhancing activities over thecoming years.
Redemption Notices amounting to a further 10% of net assetvalue were accepted following the September 2017redemption window. Although our preference is to matchredemption units through actively promoting WELPUT tonew investors, we will seek to provide liquidity through assetsales or debt management should this be required. Aspreviously noted contracts have been exchanged for thevehicle owning North West House.
In the UK Budget of 22 November 2017, a public consultationwas announced on new legislation which is likely to beintroduced in April 2019. This relates to the introduction ofcapital gains tax (or corporation tax on chargeable gains) ondisposals of all UK property by UK non-resident investors. Weare clarifying our understanding of these proposals with ouradvisers and examining their potential impact on WELPUT.
Regent’s Wharf, N1
10WELPUT
Investment ReportAsset Management
Acquisitions
There were no acquisitions over the year to 30 September2017.
Disposals
The sale of 100% of the units in St James Square Unit Trust,the main asset of which was 3 St James’s Square, SW1,completed on 17 May 2017. The sale was to a consortium ofinvestors headed by Joint Treasure International at a price of£133.5 million (£2,580 per sq ft). This reflected a net initialyield of 4.03% calculated against the headline price andtopped up rents and reflecting a price 10.5% above theDecember 2016 valuation. Following the reporting periodcontracts were conditionally exchanged for the sale of 100%of the units in North West House Unit Trust, the sole asset ofwhich is North West House, SW1. The net sale pricedreceived by WELPUT following the deductions of the rent freeand committed capital contributions will be £49.8 million.
Asset Management
During the year to 30 September 2017, 16 new lettings werecompleted, five leases regeared and four rent reviewscompleted providing additional income of £11.1 million perannum.
3 St James’s Square, SW1 Prior to the sale the leasingcampaign was all but completed, with three leasescompleted on office suites during the past year at rentsranging from £97.50 to £117.50 per sq ft on the fifth andsixth floors. Having identified strong demand from privategym clubs for the self-contained ground and lower groundfloors, which benefits from private access from St James’sSquare, a planning consent was successfully obtained forgym use. The floors were subsequently let to Legacy LuxuryWellness for use as a high class private gym on a twenty yearlease at an initial rent of £900,000 per annum reflecting£78.85 per sq ft overall, subject to fixed uplifts of 2.5% perannum. At sale, only the fourth floor courtyard suite wasunlet.
Orion House, WC2 In March 2017, WELPUT received vacantpossession of the second to fifth floors (22,782 sq ft).Following this the accommodation was refurbished. Therefurbishment was pitched at a level which reflectedoccupiers’ demand for affordable space on the lower floorsof the building. The accommodation was launched inSeptember 2017 at a quoting rent of £59.50 per sq ft.
143/157 Farringdon Road, EC1 Following the refurbishmentof the first to fifth floors at Scriptor Court comprising 11,449sq ft, the first, third and fourth floors have been let in threeseparate transactions achieving rents of £62.50 per sq ft onthe first letting and more recently £65.00 per sq ft.
The focus on the estate has been to minimise capitalexpenditure and extend income. Three new leases werecompleted on accommodation that was re-let in thecondition left by previous tenants. Agreement was reachedwith the vacating tenants to leave fittings and furniture inplace which allowed the accommodation to be re-let eitherpartially or fully fitted thereby also avoiding any capitalexpenditure. This approach reduced void periods as well asachieving headline rents in line with those on newlyrefurbished suites.
10/18 Regent’s Wharf, N1 Following WELPUT’s submissionearlier in 2017, in December 2017 a negative determinationwas given by Islington Council over the initial planningapplication. Discussions remain ongoing with the planningauthority for a significant redevelopment of the site foroffices with ancillary retail and food uses. All leases run to ablock date of March 2020 when it is anticipated that thescheme will be redeveloped.
20 St James’s Street, SW1 The comprehensiverefurbishment of this prime St James’s building to provide53,200 sq ft of offices is well advanced. Works include thecomplete reconfiguration of the core, a new double heightreception and top quality finishes throughout the building.Completion is scheduled for the second quarter of 2018when projections anticipate limited new supply. A pre-completion marketing campaign is underway. Following thereporting period a headlease re-gear has been agreed withthe freeholder, The Crown Estate, creating a new 125 yearterm from completion of the refurbishment, thus increasingthe term by 31 years.
Annual Report and Audited Financial Statementsfor the year ended 30 September 2017 11
Inve
stm
en
t R
ep
ort
Investment ReportAsset Management continued
98 Theobald’s Road, WC1
In January 2017 the lease of the entire 135,000 sq ft buildingto Warner Bros Entertainment (Warner) was extended by15 years from its expiry date in September 2019. Warner willpay the current rent of £5.42 million per annum reflectingapproximately £40 per sq ft until September 2019, followingwhich there is a fixed uplift to £7.99 million per annumreflecting a rent of approximately £60 per sq ft with a32 month rent free. There are five yearly upward-only rentreviews thereafter.
WELPUT agreed to pay Warner a fixed capital contribution of£15.91 million reflecting approximately £118 per sq ft torefurbish the building to an agreed Category A specification.This is the specification upon which future rent reviews willbe based and payments will be made on a phased basis oncertification of works. The new lease to Warner is guaranteedby its parent company, Time Warner Entertainment, and willexpire in 2034 with no break options providing WELPUT withlong term, secure income.
12WELPUT
Investment ReportAsset Management continued
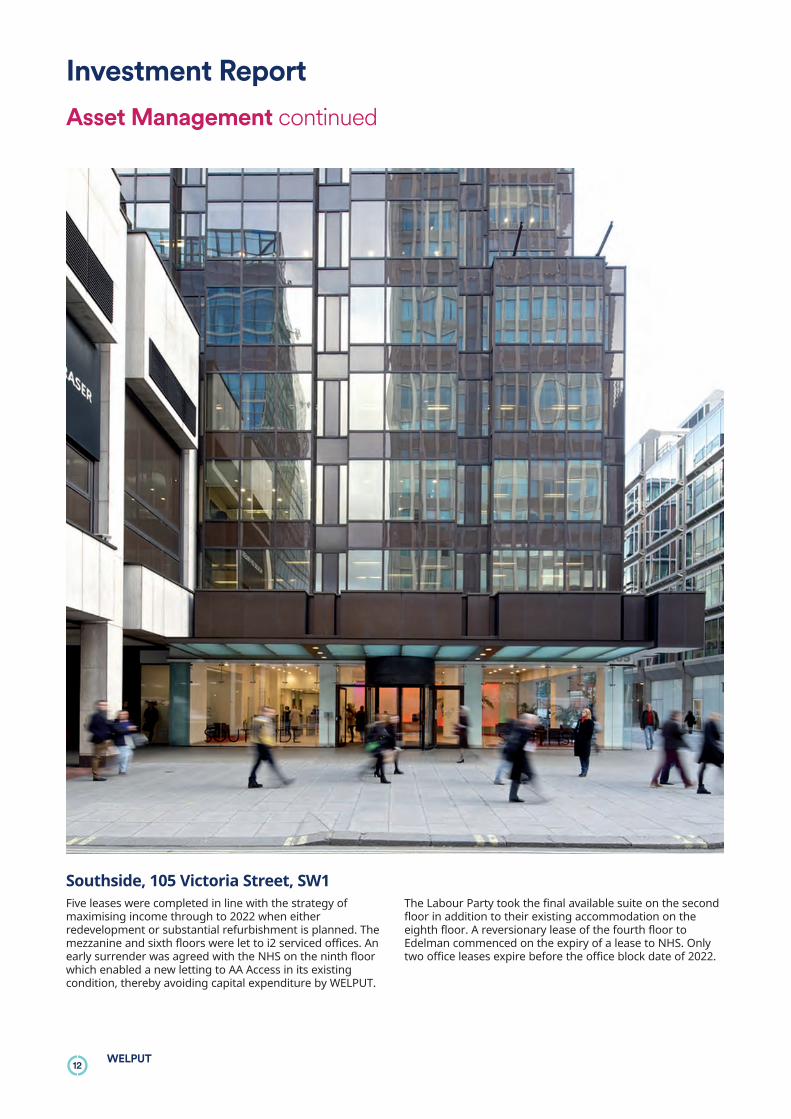
Southside, 105 Victoria Street, SW1
Five leases were completed in line with the strategy ofmaximising income through to 2022 when eitherredevelopment or substantial refurbishment is planned. Themezzanine and sixth floors were let to i2 serviced offices. Anearly surrender was agreed with the NHS on the ninth floorwhich enabled a new letting to AA Access in its existingcondition, thereby avoiding capital expenditure by WELPUT.
The Labour Party took the final available suite on the secondfloor in addition to their existing accommodation on theeighth floor. A reversionary lease of the fourth floor toEdelman commenced on the expiry of a lease to NHS. Onlytwo office leases expire before the office block date of 2022.
Annual Report and Audited Financial Statementsfor the year ended 30 September 2017 13
Inve
stm
en
t R
ep
ort
Investment ReportAsset Management continued
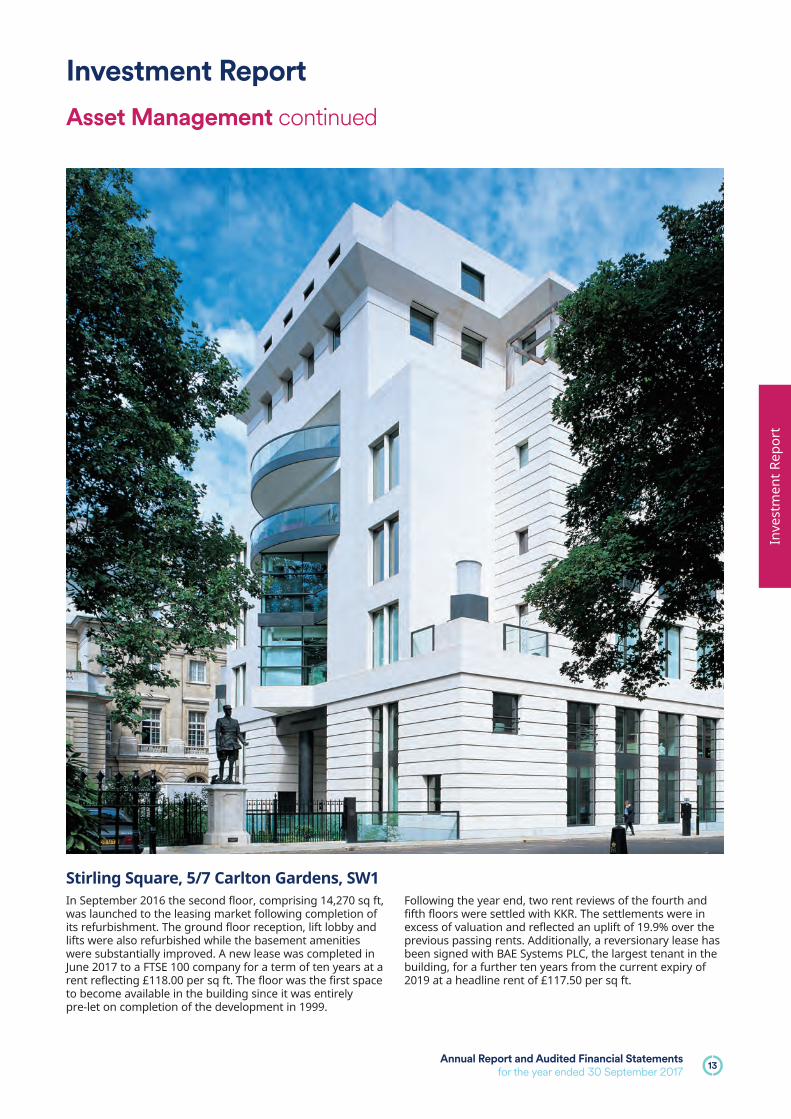
Stirling Square, 5/7 Carlton Gardens, SW1
In September 2016 the second floor, comprising 14,270 sq ft,was launched to the leasing market following completion ofits refurbishment. The ground floor reception, lift lobby andlifts were also refurbished while the basement amenitieswere substantially improved. A new lease was completed inJune 2017 to a FTSE 100 company for a term of ten years at arent reflecting £118.00 per sq ft. The floor was the first spaceto become available in the building since it was entirelypre-let on completion of the development in 1999.
Following the year end, two rent reviews of the fourth andfifth floors were settled with KKR. The settlements were inexcess of valuation and reflected an uplift of 19.9% over theprevious passing rents. Additionally, a reversionary lease hasbeen signed with BAE Systems PLC, the largest tenant in thebuilding, for a further ten years from the current expiry of2019 at a headline rent of £117.50 per sq ft.
14WELPUT
Investment ReportAsset Management continued
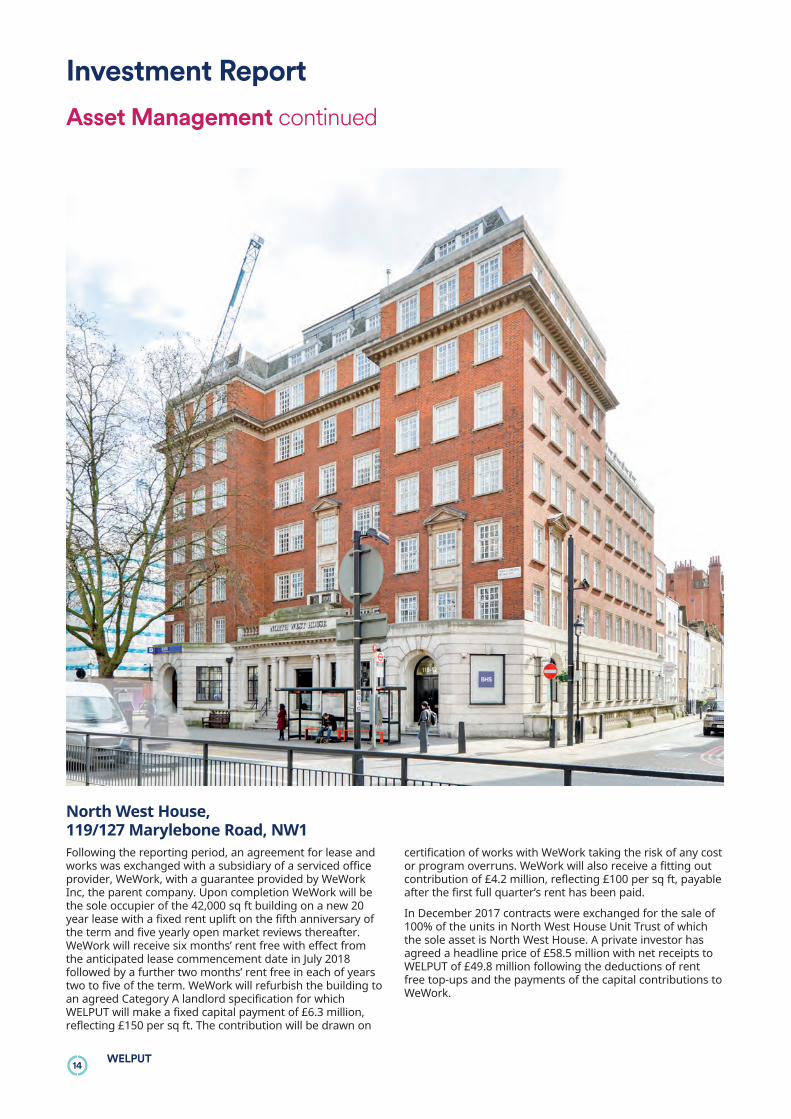
North West House, 119/127 Marylebone Road, NW1
Following the reporting period, an agreement for lease andworks was exchanged with a subsidiary of a serviced officeprovider, WeWork, with a guarantee provided by WeWorkInc, the parent company. Upon completion WeWork will bethe sole occupier of the 42,000 sq ft building on a new 20year lease with a fixed rent uplift on the fifth anniversary ofthe term and five yearly open market reviews thereafter.WeWork will receive six months’ rent free with effect fromthe anticipated lease commencement date in July 2018followed by a further two months’ rent free in each of yearstwo to five of the term. WeWork will refurbish the building toan agreed Category A landlord specification for whichWELPUT will make a fixed capital payment of £6.3 million,reflecting £150 per sq ft. The contribution will be drawn on
certification of works with WeWork taking the risk of any costor program overruns. WeWork will also receive a fitting outcontribution of £4.2 million, reflecting £100 per sq ft, payableafter the first full quarter’s rent has been paid.
In December 2017 contracts were exchanged for the sale of100% of the units in North West House Unit Trust of whichthe sole asset is North West House. A private investor hasagreed a headline price of £58.5 million with net receipts toWELPUT of £49.8 million following the deductions of rentfree top-ups and the payments of the capital contributions toWeWork.
Annual Report and Audited Financial Statementsfor the year ended 30 September 2017 15
Inve
stm
en
t R
ep
ort
The central London real estate market has weatheredconsiderable political and economic uncertainty in the pastyear. Despite a reduction in development starts, therecontinues to be a high level of supply in the City of London.As developments complete and tenants release second handspace onto the market there is potential for rental declines in2018, especially within the City of London.
Across all other London submarkets, speculative supply islow and below long-term averages. 2017 take-up in both theCity and West End was around the five year average, butdominated by larger transactions. The number oftransactions below 5,000 sq ft has reduced, owing to smalland medium sized businesses opting for serviced offices,which meet their needs of ease and flexibility. This trend isexpected to continue in 2018.
In 2017, take-up levels were supported by good levels ofdemand from emerging sectors across London; tech, media,life sciences and creative. Increasingly demand is mostprevalent in areas benefiting from strong infrastructure, localamenities and lower occupational costs. These includeFarringdon, King’s Cross, Fitzrovia and Whitechapel.WELPUT’s assets are well-positioned in this respect.
Over the year, investment volumes were robust, albeitbuoyed by fewer but larger transactions of trophy assets byoverseas investors. Less prime assets, or ones with morevalue added opportunities, have seen less investor demand.
Against this backdrop WELPUT will continue its currentstrategy reducing risk within the portfolio while ensuringthere are suitable value add opportunities in the future.
Investment ReportOutlook
CGI of 20 St James’s Street, SW1
16WELPUT
Investment ReportDebt
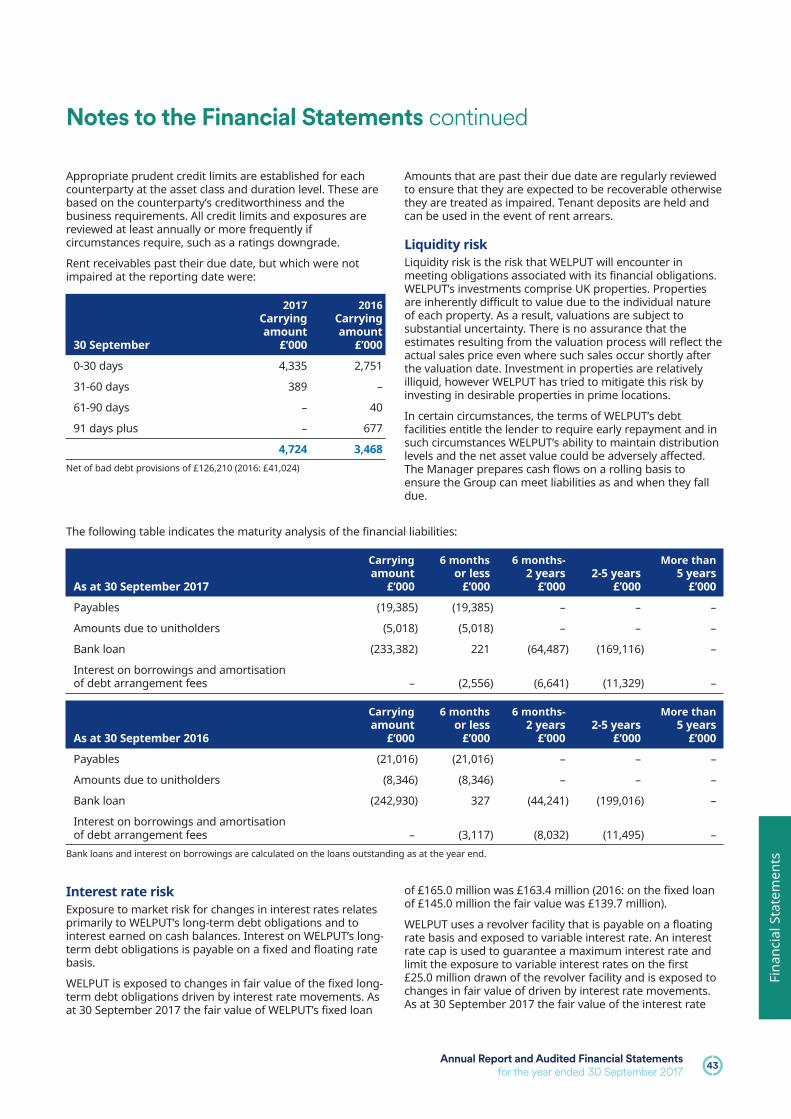
At 30 September 2017 WELPUT held £235.0 million of debt,equivalent to 20.4% of Aggregate Trust Value (ATV) calculatedon the basis of all property assets plus capital cash. Theaverage cost of debt across the Wells Fargo andMetropolitan Life Insurance Company (MetLife) facilities was2.4%.
The Wells Fargo facility was extended for one further yearuntil April 2022 on the same terms. This allowed WELPUT to
continue to benefit from the competitive terms agreed in2015. Following the reporting period the MetLife facility,which was due to expire in December 2017, has beenextended to June 2018. We aim to refinance this with afacility that will provide greater capacity and increasedflexibility.
Bury House, 31 Bury Street, EC3
Annual Report and Audited Financial Statementsfor the year ended 30 September 2017 17
Inve
stm
en
t R
ep
ort
Investment ReportResponsible Investment and Sustainability
Responsible Real Estate Investment is at the heart of ourinvestment philosophy. We believe that a successfulresponsible investment programme should deliver enhancedreturns to investors, improved business performance totenants and tangible benefits to local communities and widersociety.
The changes in markets as a consequence of environmentaland social issues are simply investment risks that Schrodersmust understand to protect our clients’ assets fromdepreciation.
Offering occupiers resource-efficient and flexible space iscritical to ensure our investments are fit for purpose andsustain their value over the long-term. As a landlord, we havethe opportunity to help reduce running costs for ouroccupiers, increase employee productivity and well-being,and contribute to the prosperity of a location throughbuilding design and management. If we ignored such issueswhen considering asset management and investments, wewould risk the erosion of income and value as well asmissing opportunities to enhance investment returns.
Through its construction, use and demolition, the builtenvironment accounts for more than one-third of globalenergy use and is the single largest source of greenhousegas emissions in many countries.
The industry’s potential to cost-efficiently reduce emissionsand the consumption of depleting resources, combined withthe political imperative to tackle issues such as climatechange, means the real estate sector will remain a primetarget for policy action. This presents new challenges andopportunities for the real estate industry with profoundimplications for both owners and occupiers.
A good investment strategy must incorporate environmentaland social issues alongside traditional economicconsiderations. At Schroders we believe a complete approachshould be rewarded by improved investment decisions andperformance.
A copy of Schroders Responsible Real Estate InvestmentStrategy can be found atwww.schroders.com/en/uk/realestate.
Environmental Management System
Over 2016/2017 Schroder Real Estate, led by our Head ofSustainability, has continued to work with sustainability andenergy management consultancy Evora Global to developour Environmental Management System (‘EMS’) which isaligned with the internationally recognised standardISO14001. The EMS provides the framework for howsustainability principles (environmental and social) aremanaged throughout all stages of our real estate investmentprocess including acquisition due diligence, assetmanagement, property management provided by thirdparties, refurbishments and developments, through todisposal.
Schroder Real Estate sets a Sustainability Policy annuallywhich confirms the commitments and targets for the year.Key aspects of the Policy and its objectives are set out below.
Property Manager SustainabilityRequirements
Property managers play an integral role in supporting thesustainability program. Schroder Real Estate has establisheda set of Sustainability Requirements for property managersto adhere to in the course of delivering their propertymanagement services. This includes a set of keyperformance indicators to help improve the propertymanagers sustainability related services to WELPUT. Theseare assessed on a six-monthly and annual basis, in April andOctober, respectively. Schroder Real Estate is pleased toreport that Savills, property managers to WELPUT, hasworked to continually improve their services and theirperformance against these KPIs over the past 12 months.
Energy
Energy is an important element of landlord’s responsibilitiesfor buildings where the landlord has operational control.Schroder Real Estate has continued to develop themonitoring of WELPUT’s energy usage and efficiency as wellas water and waste with analysis and reporting on aquarterly and annual basis.
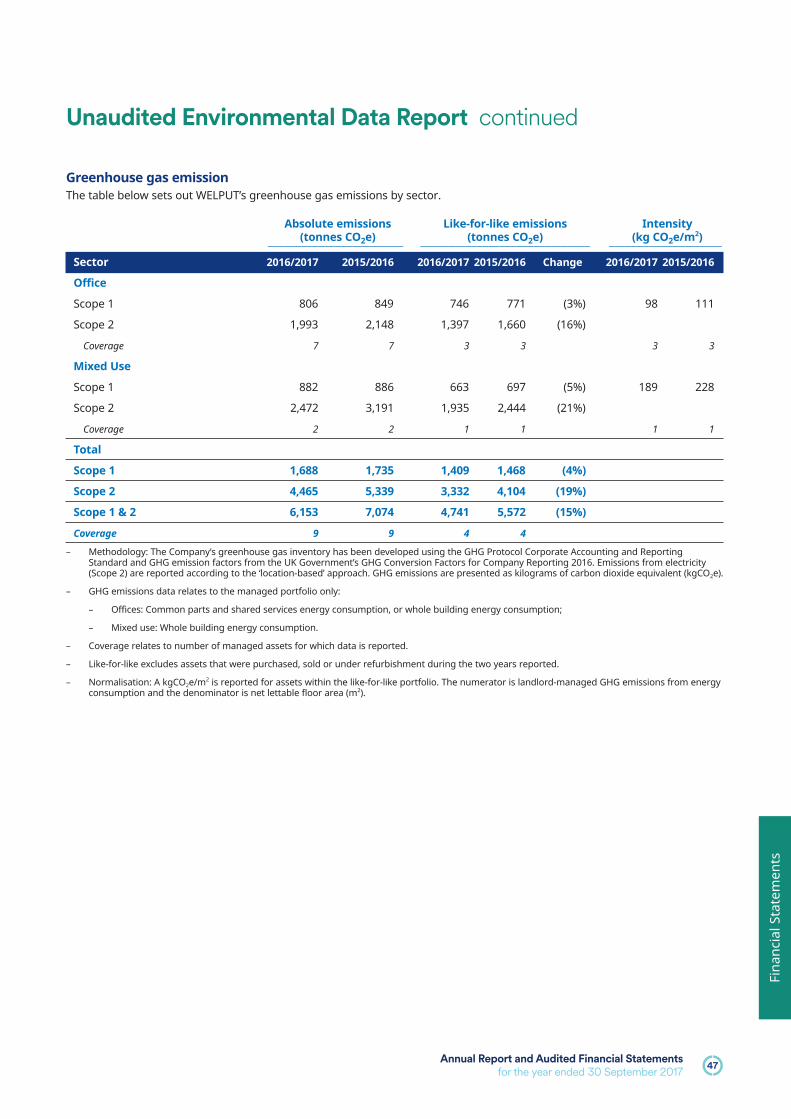
In the first quarter of 2016 Schroder Real Estate introducedan energy reduction target of 6% across its UK managedassets over a two year period to March 2018 from a baselineof 2015/16 reporting years. Alongside this Schroder RealEstate continues to work with Evora Global and WELPUT’sproperty manager to achieve further reductions on a costeffective basis. As part of this all managed assets withinWELPUT have been reviewed and sustainability objectivesidentified for 2016/2017. Initiatives include buildingmanagement system, LED lighting and boiler optimisationprograms. Improving energy efficiency and reducing energyconsumption will benefit tenants’ occupational costs andshould help tenant retention and attracting new tenants.Over the 2016/17 reporting year WELPUT’s landlord procuredenergy saw a reduction of 7% on a like-for-like basis.Progress against this target will be reported on an annualbasis.
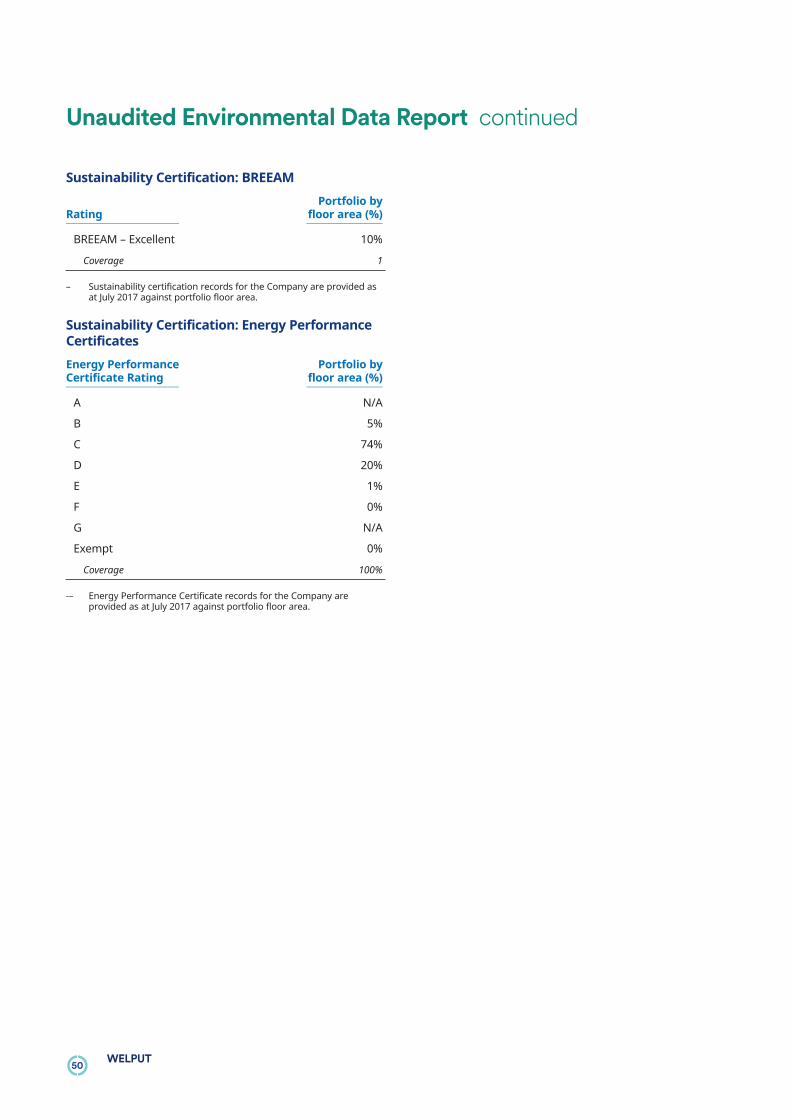
Energy Performance Certificates (EPC) for the portfolio areregularly reviewed in light of the 2015 Minimum EnergyEfficiency Standards (England and Wales) legislation.Schroder Real Estate is actively managing the potential riskof this legislation to the portfolio. This legislation brings in aminimum EPC standard of E for new leases and renewals fornon domestic buildings from 1 April 2018. This minimumstandard applies to all leases from 1 April 2023.
The EPC profile for the portfolio is set out within theEnvironmental Data report below.
Refurbishments and Green BuildingCertifications
Schroder Real Estate seeks to deliver developments andrefurbishments to sustainable standards and deliver goodperformance against building certifications, including EPCsand BREEAM (the Building Research Establishment
18WELPUT
Investment ReportResponsible Investment and Sustainability continued
Environmental Assessment Methodology an environmentalassessment method and rating system for buildings).Standards required are set for each project in context for theasset. Schroder Real Estate’s guiding principles for projectsare a minimum of D rated EPCs and BREEAM Very Good.
Water
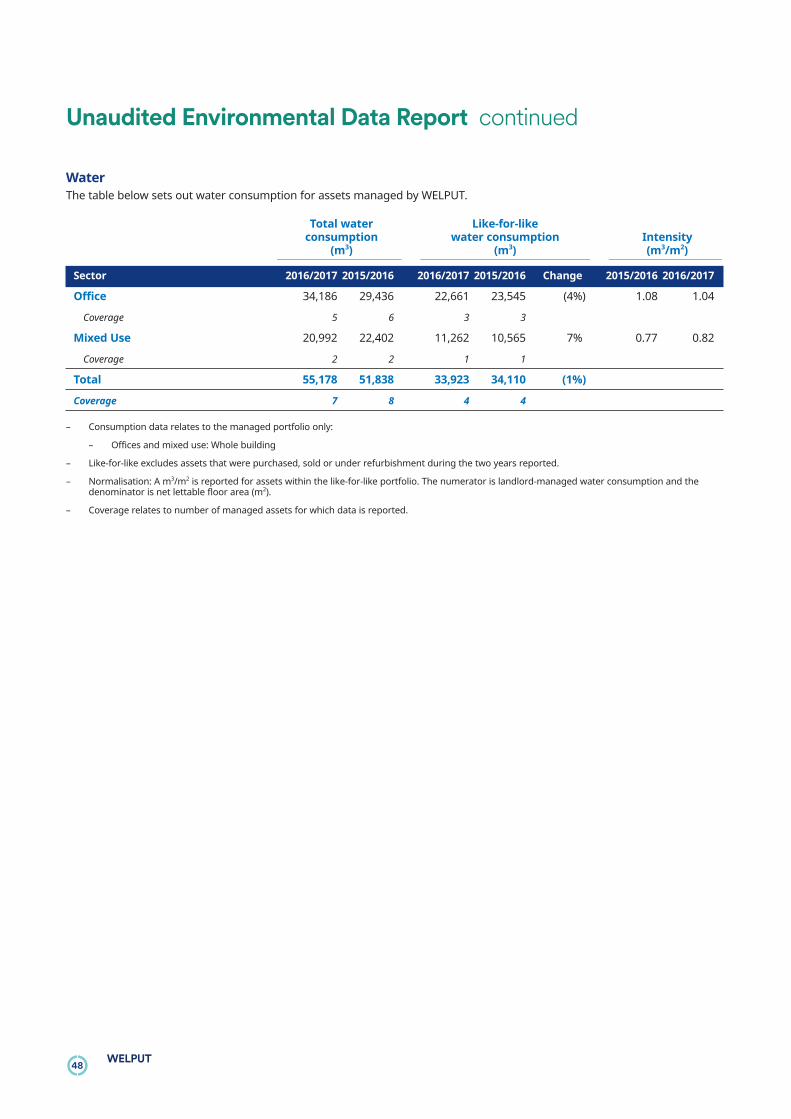
Schroder Real Estate monitors water consumption where thelandlord has supply responsibilities and encourages asset-level improvements. Like-for-like water consumption, forassets where WELPUT had supply responsibilities, decreased1% between the 2015/2016 and 2016/2017 reportingperiods.
Waste
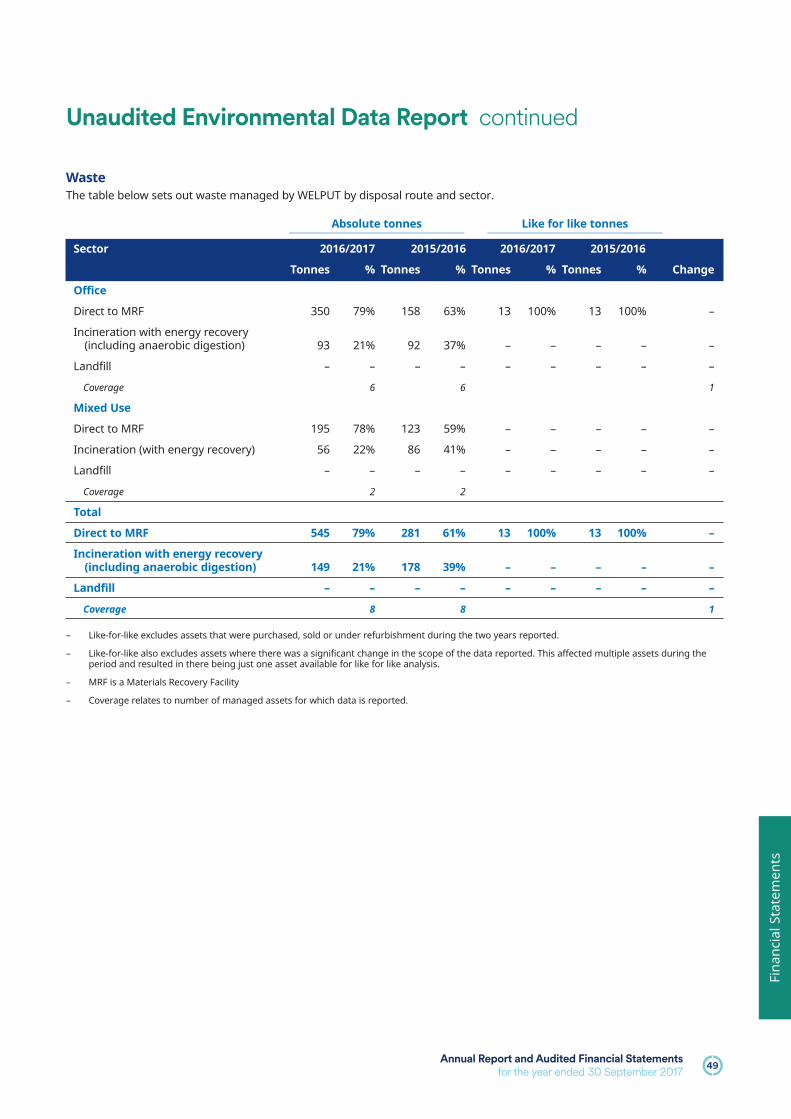
Waste management and disposal activities are responsiblefor considerable negative environmental and societal impact.As a result, waste should be minimised and disposal shouldbe as sustainable as possible. To this end, Schroder RealEstate has set an objective to send zero waste to landfill andto achieve optimal recycling. During 2016/2017 WELPUTachieved 100% diversion from landfill.
Global Real Estate SustainabilityBenchmark (’GRESB’)
WELPUT has participated in GRESB since 2011. We arepleased to report that in 2017 WELPUT again outperformedits peer average and was awarded a ‘Green Star’ for thefourth consecutive year (this rating is achieved where scoresfor the two dimensions of Management and Policy andImplementation and Measurement are at least 50 out of 100points). In 2017 the Health and Wellbeing segment, whichconsiders employees, tenants and customers, was alsocompleted for WELPUT, with a score above the segmentaverage achieved.
GRESB is the dominant global standard for assessingEnvironmental Social and Governance performance for realestate funds and companies.
Environmental Data
This year the Sustainability Report has been aligned with theINREV Sustainability Reporting Guidelines 2016 and thereforeincludes an Environmental Data report for the portfoliopresented using GRESB methodology. The EnvironmentalData Report is included at page 45.
Carbon Reduction Commitment
The Trustee holds responsibility for compliance with the CRCEnergy Efficiency Scheme and the purchase of allowances. Itwas announced in the March 2016 Budget that the CRCScheme will not continue beyond Phase II which ends31 March 2019.
Energy Savings Opportunity Scheme
The Company did not qualify for participation in the EnergySavings Opportunity Scheme.
Schroder Real Estate monitors policy and legislation relatingto Environmental Social and Governance issues to develop itsEMS and manage risk and compliance.
Health, Wellbeing and Productivity
The real estate industry is beginning to gain a newperspective on the importance of the built environment onhuman health, wellbeing and productivity. A number ofschemes have emerged which seek to identify the impacts ofspaces and places on people and provide new ways ofcertifying buildings. Case studies demonstrate the benefit ofreflecting wellbeing in good design. Health and wellbeing isconsidered in the management of the WELPUT portfolio.
Stakeholder Engagement andCommunity
Schroder Real Estate seeks active engagement with tenantsto ensure a good occupational experience to help retain andattract tenants. As the day-to-day relationship is with theproperty manager, the Property Manager SustainabilityRequirements include a key performance indicator on tenantengagement.
Schroder Real Estate believes in the importance ofunderstanding a building’s relationship with the communityand its contribution to the wellbeing of society. Positivelyimpacting on local communities helps create successfulplaces that foster community relationships, contribute tolocal prosperity, attract building users and ultimately, lead tobetter, more resilient investments. Schroder Real Estatelooks to understand and develop the community relationshipto ensure investments provide sustainable social solutionsfor the long term.
Industry Participation
Schroder Real Estate is a member of a number of industrybodies including the European Public Real Estate Association(EPRA), INREV (European Association for Investors in Non-Listed Real Estate Vehicles), British Council for Offices andthe British Property Federation. It was a founding member ofthe UK Green Building Council in 2007 and in 2017 became amember of the Better Buildings Partnership and a FundMember of GRESB.
Employees
WELPUT has no direct employees. The Manager is part ofSchroders plc which has responsibility for the employees thatsupport WELPUT. Schroders believes diversity of thought andan inclusive workplace are key to creating a positiveenvironment for their people. Schroder Real Estate’s teamhave a sustainability objective within their annual objectives.
Annual Report and Audited Financial Statementsfor the year ended 30 September 2017 19
Inve
stm
en
t R
ep
ort
Investment ReportResponsible Investment and Sustainability continued
Further information on Schroders’ principles in relation topeople including diversity, gender pay gap, values, employeesatisfaction survey, wellbeing and retention can be found athttp://www.schroders.com/annualreport2016/strategy-business-review/our-people.html
Corporate Responsibility
Schroders’ commitment to corporate responsibility is toensure that its commitment to act responsibly, supportclients, deliver value to shareholders and make a widercontribution to society is embedded across its business in allthat it does.
Full information on Schroders Corporate Responsibilityapproach, including its economic contribution,environmental impacts and community involvement, can befound athttp://www.schroders.com/annualreport2016/strategy-business-review/our-impact/corporate-responsibility.html
Slavery and Human TraffickingStatement
WELPUT is not required to produce a statement on slaveryand human trafficking pursuant to the Modern Slavery Act2015 as it does not satisfy all the relevant triggers under thatAct that require such a statement.
The Manager is part of Schroders plc whose statement onSlavery and Human Trafficking has been published inaccordance with the Modern Slavery Act 2015 (the ‘Act’). Itsets out the steps that Schroders plc and other relevantgroup companies have taken during 2016 and 2017 toprevent slavery and human trafficking from taking place inits supply chains or any part of its business. Schroder RealEstate is part of the Schroders Group.
Schroders’ statement can be found atwww.schroders.com/slavery
20WELPUT
Governance Report
Responsibility of the Manager
Manager’s responsibilities for the FinancialStatements
The Manager is required under the Trust Instrument toprepare Financial Statements for each financial period inaccordance with the Trust Instrument and United Kingdomaccounting standards (which may differ from the basis usedby the Manager to calculate the monthly net asset value),detailing the state of affairs of WELPUT as at the end of thefinancial period and of the income or loss, cash flow andother recognised gains or losses of the Group for that period.
The Manager is also required to select and consistently applysuitable accounting policies, make judgments and estimatesthat are reasonable and prudent, prepare the FinancialStatements on the going concern basis unless it isinappropriate to do so and state whether applicableaccounting standards have been followed, subject to anymaterial departures disclosed and explained in the FinancialStatements.
It is also the Manager’s responsibility to maintain adequateaccounting records, safeguard the assets of WELPUT andprevent and detect fraud, error and non-compliance with lawand regulations.
The Directors of the Manager confirm that they havecomplied with the above requirements in preparing theFinancial Statements.
The Financial Statements are published on a website(www.schroders.com/welput) maintained by the Manager.The maintenance and integrity of the website is, in so far as itrelates to WELPUT, the responsibility of the Manager. Thework carried out by the Auditors does not involveconsideration of the maintenance and integrity of thiswebsite and accordingly the Auditors accept no responsibilityfor any changes that have occurred to the Financial
Statements since they were initially presented on thewebsite. Visitors to the website need to be aware thatlegislation in Jersey governing the preparation anddissemination of Financial Statements may differ fromlegislation in their own jurisdiction.
Board of the Manager
Isabel Robins became chairman of the Board of Directors ofthe Manager on 1 January 2017. She replaced Gregor Allanwho retired from the board. We would like to thank Gregorfor his contribution to the Manager over 19 years. Followingthe year end on 13 October 2017 Duncan Owen resignedfrom the Board of Directors of the Manager and NickMontgomery was appointed.
Trustees’ Responsibilities
Trustees’ responsibilities for the FinancialStatements
The Trustees are to take reasonable care so as to ensure thatWELPUT is managed by the Manager in accordance with theTrust Instrument.
The Trustees are required to satisfy themselves onreasonable grounds and on a continuing basis that theManager has maintained and is maintaining sufficientrecords. The Trustees take into their custody, or under theircontrol, all the capital property of WELPUT and hold it in trustfor the unitholders in accordance with the Trust Instrumentand, hence, the Trustees along with the Manager areresponsible for taking all reasonable steps for the preventionand detection of fraud, error and non-compliance with lawand regulations.
Under The Trusts (Jersey) Law 1984, the Trustees are requiredto keep accurate accounts and records. Pursuant to the Trust
Annual Report and Audited Financial Statementsfor the year ended 30 September 2017 21
Go
ve
rna
nce
Re
po
rt
Governance Report
Instrument, this duty is devolved to the Manager who isrequired to keep or cause to be kept in accordance with therequirements of Jersey law proper books of account andrecords showing all transactions effected on behalf of theTrust and arrange for the audit and delivery of FinancialStatements to the Trustees as well as the unitholders. TheTrustees may accept and shall not be bound to verify theFinancial Statements produced by or on behalf of theManager unless the Trustees have actual notice of anyirregularity.
So far as the Trustees and Manager are aware, there is norelevant audit information of which the Trust’s Auditors areunaware, and each Trustee has taken all the steps that he orshe ought to have taken as a Trustee to make himself orherself aware of any relevant audit information and toestablish that the Trust’s Auditors are aware of thatinformation.
Trust Matters
Unit creations and redemptions
No units were created during the year.
At 30 September 2015, a total of 396,715.6000 units,equating to 33.1% of units in issue were submitted forredemption. In accordance with the Trust Instrument theManager accepted 119,963.2391 units for redemptionequating to 10.0% of the units in issue as at 30 September2016. During the year a total of 1,843.4636 of the redemptionunits were matched on the secondary market andredemption notices relating to 4,453.9754 units werewithdrawn with the approval of the Manager. The remaining101,598.8952 units were redeemed from WELPUT at theRedemption Unit Price on 29 June 2017.
In all, a total of 197,614.1391 units were matched during the12 months ending 30 September 2017. This is equivalent to18.0% of WELPUT’s units in issue at 30 September 2017 andconfirms the liquidity in WELPUT’s units.
During the September 2017 annual redemption window,which ended on 30 September 2017, the Manager receivedredemption requests for a total of 127,889.1211 units,representing 11.6% of all units in issue. In accordance withthe Trust Instrument the Manager has accepted redemptionsrepresenting 10% of units in issue.
Excess units for which redemption notices were served willnot be carried forward to future redemption periods. Inaddition to taking steps to meet the redemption units, theManager will continue to promote WELPUT to existing andprospective new investors.
Unitholder meetings
Two Extraordinary General Meetings were held in Jerseyduring the year.
On 22 November 2016 Derek Jacobson of MadisonInternational Realty was confirmed as the Elected Member tothe Holders Advisory Committee (HAC) for a two year periodending 30 September 2018. Holders in WELPUT representing278,089.2068 units (being 69.3% of those eligible to vote) casttheir votes. During the year, in line with change in ownership
of units in WELPUT, the four largest holder groups changedand Madison International Realty, represented by DerekJacobson, took up their position as an automatic member ofthe HAC.
On 4 September 2017 Mark Adcock of CBRE GlobalInvestment Partners was confirmed as the Elected Memberto the HAC for a two year period ending 30 September 2019.Holders in WELPUT representing 126,366.5684 units (being52.8% of those eligible to vote) cast their votes.
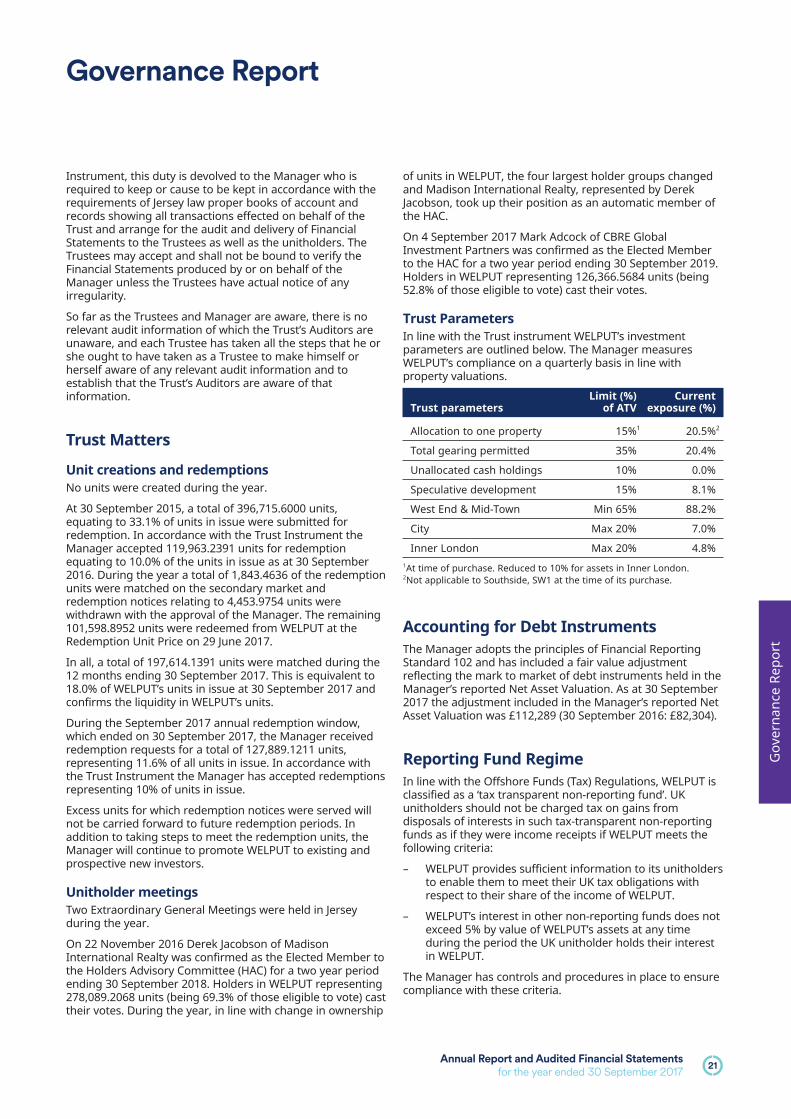
Trust Parameters
In line with the Trust instrument WELPUT’s investmentparameters are outlined below. The Manager measuresWELPUT’s compliance on a quarterly basis in line withproperty valuations.
Limit (%) CurrentTrust parameters of ATV exposure (%)
Allocation to one property 15%1 20.5%2
Total gearing permitted 35% 20.4%
Unallocated cash holdings 10% 0.0%
Speculative development 15% 8.1%
West End & Mid-Town Min 65% 88.2%
City Max 20% 7.0%
Inner London Max 20% 4.8%
1At time of purchase. Reduced to 10% for assets in Inner London.2Not applicable to Southside, SW1 at the time of its purchase.
Accounting for Debt Instruments
The Manager adopts the principles of Financial ReportingStandard 102 and has included a fair value adjustmentreflecting the mark to market of debt instruments held in theManager’s reported Net Asset Valuation. As at 30 September2017 the adjustment included in the Manager’s reported NetAsset Valuation was £112,289 (30 September 2016: £82,304).
Reporting Fund Regime
In line with the Offshore Funds (Tax) Regulations, WELPUT isclassified as a ‘tax transparent non-reporting fund’. UKunitholders should not be charged tax on gains fromdisposals of interests in such tax-transparent non-reportingfunds as if they were income receipts if WELPUT meets thefollowing criteria:
– WELPUT provides sufficient information to its unitholdersto enable them to meet their UK tax obligations withrespect to their share of the income of WELPUT.
– WELPUT’s interest in other non-reporting funds does notexceed 5% by value of WELPUT’s assets at any timeduring the period the UK unitholder holds their interestin WELPUT.
The Manager has controls and procedures in place to ensurecompliance with these criteria.
22WELPUT
Capital Gains Tax
In the UK Budget of 22 November 2017, a public consultationwas announced on new legislation which is likely to beintroduced in April 2019. This relates to non-UK residentinvestors becoming subject to capital gains tax (orcorporation tax on chargeable gains for investors which arenon-UK companies) on disposals of all UK property. Thelegislation is expected to relate to the disposals of interests indirectly owned real estate as well as real estate vehicles inwhich the seller’s interest has exceeded 25% at any time inthe preceding five years.
Schroders is assessing the impact of this proposed legislationon WELPUT. Investors should take advice from theirprofessional advisers.
Alternative Investment FundManagement Directive
The Alternative Investment Fund Management Directive(AIFMD) came into force on 22 July 2014 across the EuropeanUnion. Ahead of this, on 27 May 2014, WELPUT receivedpermission from the Jersey Financial Services Commission tobe marketed as a non-European Union AlternativeInvestment Fund (non-EU AIF) in any EU Member State orother EEA State to which the Directive applies.
WELPUT AIF remuneration disclosure
The following disclosures are required under AIFMD, asapplicable to Schroder Real Estate Managers (Jersey) Limited,as Manager.
These disclosures should be read in conjunction with theSchroders Plc Remuneration Report on pages 68 to 96 of the2016 Annual Report & Accounts (available on the Group’swebsite – www.schroders.com/ir), which provides moreinformation on the activities of Schroders’ RemunerationCommittee and Schroders’ remuneration principles andpolicies.
The Manager’s AIFMD Material Risk Takers are individuals inroles which can materially affect the risk of the Manager orany Alternative Investment Fund (AIF) it manages.
The Remuneration Committee of Schroders plc hasestablished a Remuneration Policy to ensure therequirements of AIFMD are met proportionately for all AIFMDMaterial Risk Takers. The directors of the Manager areresponsible for the adoption of the Remuneration Policy, forreviewing it at least annually, for overseeing itsimplementation and for ensuring compliance with relevantlocal legislation and regulation. You can get details of thelatest remuneration policy atwww.schroders.com/remuneration-disclosures.
The remuneration data that follows reflects amounts paid inrespect of performance during 2016. At 31 December 2016,the Manager managed a total of £3,167 million assets undermanagement, of which £1,776 million were in AIFs.
– The total amount of remuneration paid by the Managerto its staff is nil as the Manager has no employees.AIFMD Material Risk Takers of the Manager are
employed and paid by other Schroders Groupcompanies. Employees who serve as Directors of theManager receive no additional fees in respect of theirrole on the Board of Schroders Real Estate Managers(Jersey) Limited.
– The following disclosures relate to AIFMD Material RiskTakers of the Manager. Some of these individuals areemployed by and provide services to other companies in,and clients of, the Schroders group. As a result, only aportion of remuneration for those individuals is includedin the aggregate remuneration figures that follow, basedon an objective apportionment to reflect the balance ofeach role. The aggregate total remuneration paid to the36 AIFMD Material Risk Takers of the Manager in respectof the financial year ending 31 December 2016, andattributed to the Manager and the AIFs it manages, is£1,696,960, of which £463,682 is paid to SeniorManagement and £1,233,278 is paid to other AIFMDMaterial Risk Takers.
Holders Advisory Committee (HAC)
WELPUT’s HAC met three times during the financial year andfollowing each meeting minutes were distributed to allunitholders.
The HAC comprises the four largest Holders as of righttogether with the potential for an Elected Member to beappointed for a two year accounting period. The HACMembers for the 2016-2017 financial year wererepresentatives of Alecta Investment Management, PFAPension, Aviva Global Real Estate, CBRE Global InvestmentPartners (largest Holder Member for part and ElectedMember for part) and Madison International Realty (ElectedMember for part and largest Holder Member for part). As at30 September 2017 the four largest Holders were AlectaInvestment Management, PFA Pension, MadisonInternational Realty, Aviva Global Real Estate. An OrdinaryResolution was passed by minority Holders on 4 September2017 appointing Mark Adcock of CBRE Global InvestmentPartners as Elected Member.
In line with the AREF Code of Practice, the HAC Chairman,Frans Heijbel of Alecta Investment Management has madethe following statement for inclusion in this report:
“During the past financial year the HAC has formally met threetimes to discuss the business of the committee. The minutes ofthese meetings have been circulated to all Holders. The HAC hasalso met informally on several occasions to consider ad hocmatters.
The HAC has considered the following governance matters:WELPUT’s business plan; liquidity management in the context ofmanaging redemptions; Trust performance; Trust structure; andcapital raising. During the year the Manager held twoExtraordinary General Meetings concerning the appointment ofthe Elected Member of the HAC. The HAC believes that inaggregate its contribution has resulted in a benefit to Holders.”
Governance Report
Annual Report and Audited Financial Statementsfor the year ended 30 September 2017 23
Go
ve
rna
nce
Re
po
rt
At 30 September 2017
As external valuer for the Group we have valued the freeholdand leasehold properties held within the Group at30 September 2017 in accordance with the RICS Valuation –Global Standards 2017.
The Manager has been provided with a full valuation report.The properties have been valued on the basis of Fair Value.
Details of the nature and extent of the properties, the tenureand tenancies, permitted uses, town planning consents andrelated matters, have been supplied by the Manager. Wehave not examined the title documents and we havetherefore assumed that the Group’s interests are not subjectto any onerous restrictions, to the payment of any unusualoutgoings or to any charges, easements or rights of wayother than those to which we referred to in our reports. Wehave reviewed Certificates of Title in respect of each propertyand assume that the relevant solicitors will confirm that thedetails set out in our report are correct. We rely upon theManager to keep us advised of any changes that may occurin the investments.
We were not instructed to carry out structural surveys nor totest any of the service installations. Our valuations thereforehave regard only to the general condition of the propertiesas evident from our inspections. We assume that nomaterials have been used in the buildings, which aredeleterious, hazardous or likely to cause structural defect. Wehave also assumed that there has been compliance with allrelevant statutory requirements. We were not instructed tocarry out investigations into pollution hazards, which mightaffect the properties, and our valuations assume theproperties are not adversely affected by any form ofpollution.
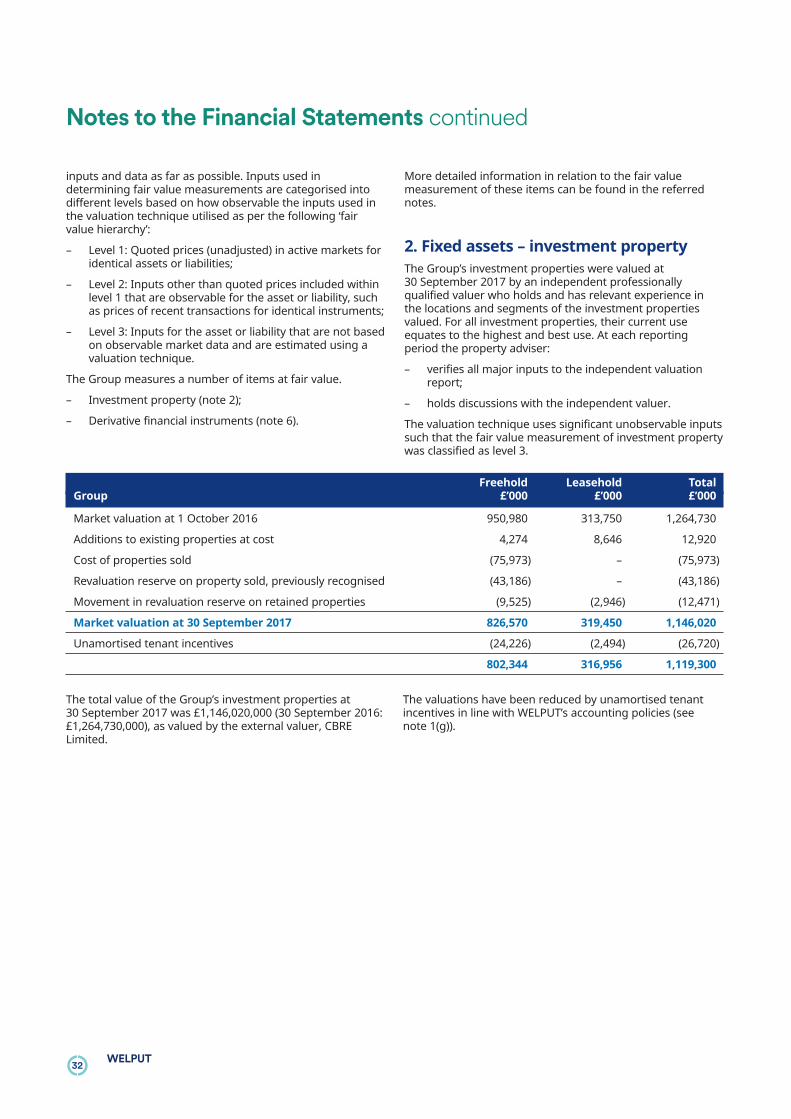
In our opinion the aggregate of the fair values of theproperties owned within the Group at 30 September 2017 is£1,146,020,000. This is apportioned as £826,570,000 forfreehold properties and £319,450,000 for those propertieswhich are held as leasehold.
No allowance is made in our valuation for the cost ofrealisation, or any liability for tax, which might arise on theevent of disposal, or for any mortgage or similar financialencumbrance over the property. Our valuations exclude VAT.
In our opinion, West End Of London Property Unit Trust’sfinancial statements (the “financial statements”):
– give a true and fair view of the financial position ofWELPUT as at 30th September 2017 and of the netrevenue and the net capital losses of its schemeproperty for the year then ended; and
– have been properly prepared in accordance with UnitedKingdom Generally Accepted Accounting Practice(United Kingdom Accounting Standards, comprising FRS102 “The Financial Reporting Standard applicable in theUK and Republic of Ireland”, and applicable law), and theTrust Deed.
We have audited the financial statements, included withinthe Annual Report and Audited Financial Statements (the“Annual Report”), which comprise: the statement of financialposition as at 30th September 2017; the statement ofcomprehensive income for the year then ended, the cashflow statement for the year then ended, the statement ofchange in net assets for the year then ended; the accountingpolicies; and the notes to the financial statements.
Basis for opinion
We conducted our audit in accordance with InternationalStandards on Auditing (UK) (“ISAs (UK)”) and applicable law.Our responsibilities under ISAs (UK) are further described inthe Auditors’ responsibilities for the audit of the financialstatements section of our report. We believe that the auditevidence we have obtained is sufficient and appropriate toprovide a basis for our opinion.
Independence
We remained independent of WELPUT in accordance withthe ethical requirements that are relevant to our audit of thefinancial statements in the UK, which includes the FRC’sEthical Standard and we have fulfilled our other ethicalresponsibilities in accordance with these requirements.
Conclusions relating to going concern
We have nothing to report in respect of the followingmatters in relation to which ISAs (UK) require us to report toyou when:
– the Manager’s use of the going concern basis ofaccounting in the preparation of the financial statementsis not appropriate; or
– the Manager has not disclosed in the financialstatements any identified material uncertainties thatmay cast significant doubt about WELPUT’s ability tocontinue to adopt the going concern basis of accountingfor a period of at least twelve months from the datewhen the financial statements are authorised for issue.
However, because not all future events or conditions can bepredicted, this statement is not a guarantee as to WELPUT’sability to continue as a going concern.
Reporting on other information
The other information comprises all of the information in theAnnual Report other than the financial statements and ourauditors’ report thereon. The Manager is responsible for theother information. Our opinion on the financial statementsdoes not cover the other information and, accordingly, we donot express an audit opinion or, except to the extentotherwise explicitly stated in this report, any form ofassurance thereon.
In connection with our audit of the financial statements, ourresponsibility is to read the other information and, in doingso, consider whether the other information is materiallyinconsistent with the financial statements or our knowledgeobtained in the audit, or otherwise appears to be materiallymisstated. If we identify an apparent material inconsistencyor material misstatement, we are required to performprocedures to conclude whether there is a materialmisstatement of the financial statements or a materialmisstatement of the other information. If, based on the workwe have performed, we conclude that there is a materialmisstatement of this other information, we are required toreport that fact. We have nothing to report based on theseresponsibilities.
Responsibilities for the financialstatements and the audit
Responsibilities of the Manager for the financialstatements
As explained more fully in the Responsibilities of theManager for the Financial Statements set out on page 20,the Manager is responsible for the preparation of thefinancial statements in accordance with the applicableframework and for being satisfied that they give a true andfair view. The Manager is also responsible for such internalcontrol as they determine is necessary to enable thepreparation of financial statements that are free frommaterial misstatement, whether due to fraud or error.
In preparing the financial statements, the Manager isresponsible for assessing WELPUT’s ability to continue as agoing concern, disclosing as applicable, matters related togoing concern and using the going concern basis ofaccounting unless the Manager either intends to liquidateWELPUT or to cease operations, or has no realistic alternativebut to do so.
Financial StatementsIndependent Auditors’ Report
Independent Auditors’ Report continued
Auditors’ responsibilities for the audit of thefinancial statements
Our objectives are to obtain reasonable assurance aboutwhether the financial statements as a whole are free frommaterial misstatement, whether due to fraud or error, and toissue an auditors’ report that includes our opinion.Reasonable assurance is a high level of assurance, but is nota guarantee that an audit conducted in accordance with ISAs(UK) will always detect a material misstatement when itexists. Misstatements can arise from fraud or error and areconsidered material if, individually or in the aggregate, theycould reasonably be expected to influence the economicdecisions of users taken on the basis of these financialstatements.
A further description of our responsibilities for the audit ofthe financial statements is located on the Financial ReportingCouncil’s website at: www.frc.org.uk/auditorsresponsibilities.This description forms part of our auditors’ report.
Use of this report
This report, including the opinion, has been prepared for andonly for the unitholders of the Fund as a body in accordancewith the Trust Deed and for no other purpose. We do not, ingiving this opinion, accept or assume responsibility for anyother purpose or to any other person to whom this report isshown or into whose hands it may come save whereexpressly agreed by our prior consent in writing.
Annual Report and Audited Financial Statementsfor the year ended 30 September 2017 25
Fin
an
cia
l S
tate
me
nts
26WELPUT
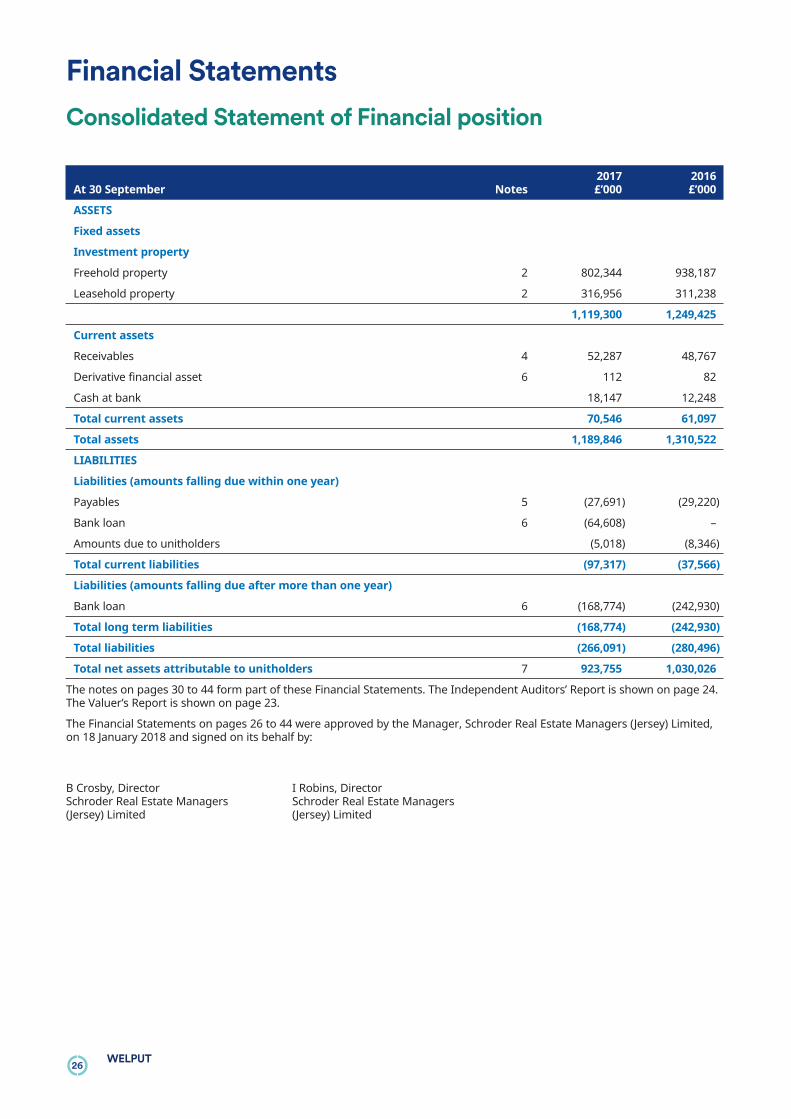
2017 2016At 30 September Notes £’000 £’000
ASSETS
Fixed assets
Investment property
Freehold property 2 802,344 938,187
Leasehold property 2 316,956 311,238
1,119,300 1,249,425
Current assets
Receivables 4 52,287 48,767
Derivative financial asset 6 112 82
Cash at bank 18,147 12,248
Total current assets 70,546 61,097
Total assets 1,189,846 1,310,522
LIABILITIES
Liabilities (amounts falling due within one year)
Payables 5 (27,691) (29,220)
Bank loan 6 (64,608) –
Amounts due to unitholders (5,018) (8,346)
Total current liabilities (97,317) (37,566)
Liabilities (amounts falling due after more than one year)
Bank loan 6 (168,774) (242,930)
Total long term liabilities (168,774) (242,930)
Total liabilities (266,091) (280,496)
Total net assets attributable to unitholders 7 923,755 1,030,026
The notes on pages 30 to 44 form part of these Financial Statements. The Independent Auditors’ Report is shown on page 24.The Valuer’s Report is shown on page 23.
The Financial Statements on pages 26 to 44 were approved by the Manager, Schroder Real Estate Managers (Jersey) Limited,on 18 January 2018 and signed on its behalf by:
B Crosby, Director I Robins, DirectorSchroder Real Estate Managers Schroder Real Estate Managers(Jersey) Limited (Jersey) Limited
Financial StatementsConsolidated Statement of Financial position
Annual Report and Audited Financial Statementsfor the year ended 30 September 2017 27
Fin
an
cia
l S
tate
me
nts
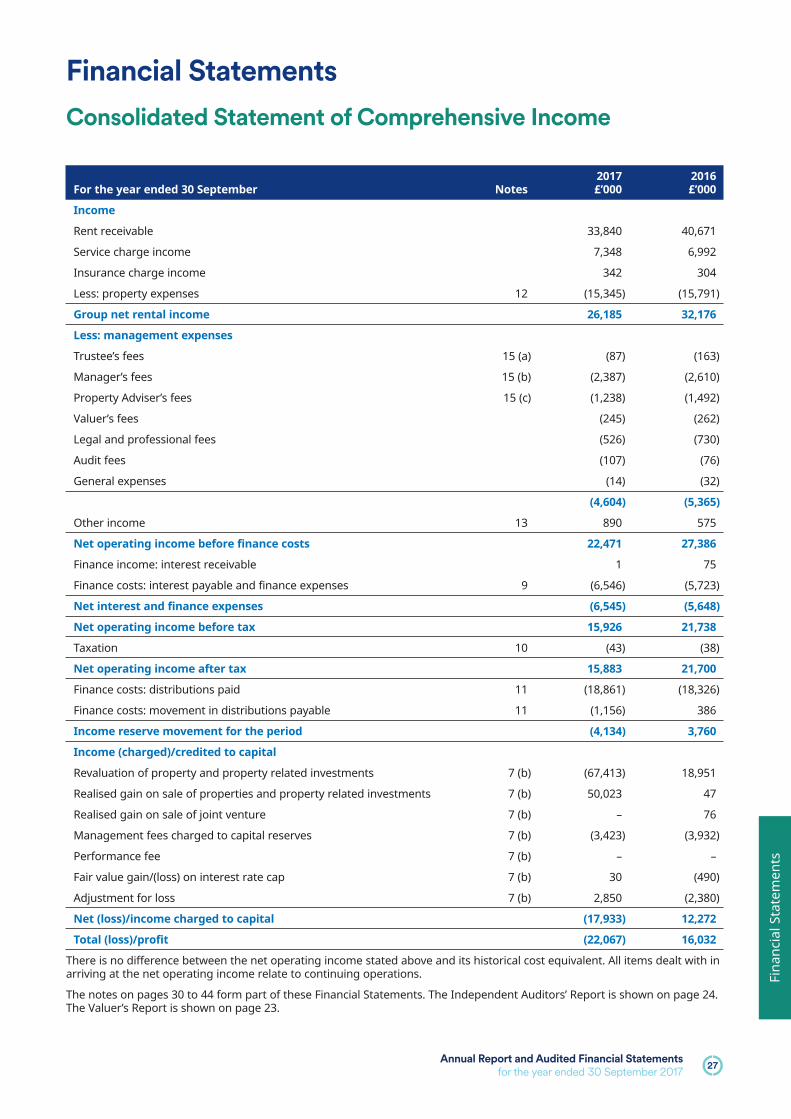
Financial StatementsConsolidated Statement of Comprehensive Income
2017 2016For the year ended 30 September Notes £’000 £’000
Income
Rent receivable 33,840 40,671
Service charge income 7,348 6,992
Insurance charge income 342 304
Less: property expenses 12 (15,345) (15,791)
Group net rental income 26,185 32,176
Less: management expenses
Trustee’s fees 15 (a) (87) (163)
Manager’s fees 15 (b) (2,387) (2,610)
Property Adviser’s fees 15 (c) (1,238) (1,492)
Valuer’s fees (245) (262)
Legal and professional fees (526) (730)
Audit fees (107) (76)
General expenses (14) (32)
(4,604) (5,365)
Other income 13 890 575
Net operating income before finance costs 22,471 27,386
Finance income: interest receivable 1 75
Finance costs: interest payable and finance expenses 9 (6,546) (5,723)
Finance costs: movement in distributions payable 11 (1,156) 386
Income reserve movement for the period (4,134) 3,760
Income (charged)/credited to capital
Revaluation of property and property related investments 7 (b) (67,413) 18,951
Realised gain on sale of properties and property related investments 7 (b) 50,023 47
Realised gain on sale of joint venture 7 (b) – 76
Management fees charged to capital reserves 7 (b) (3,423) (3,932)
Performance fee 7 (b) – –
Fair value gain/(loss) on interest rate cap 7 (b) 30 (490)
Adjustment for loss 7 (b) 2,850 (2,380)
Net (loss)/income charged to capital (17,933) 12,272
Total (loss)/profit (22,067) 16,032
There is no difference between the net operating income stated above and its historical cost equivalent. All items dealt with inarriving at the net operating income relate to continuing operations.
The notes on pages 30 to 44 form part of these Financial Statements. The Independent Auditors’ Report is shown on page 24.The Valuer’s Report is shown on page 23.
28WELPUT
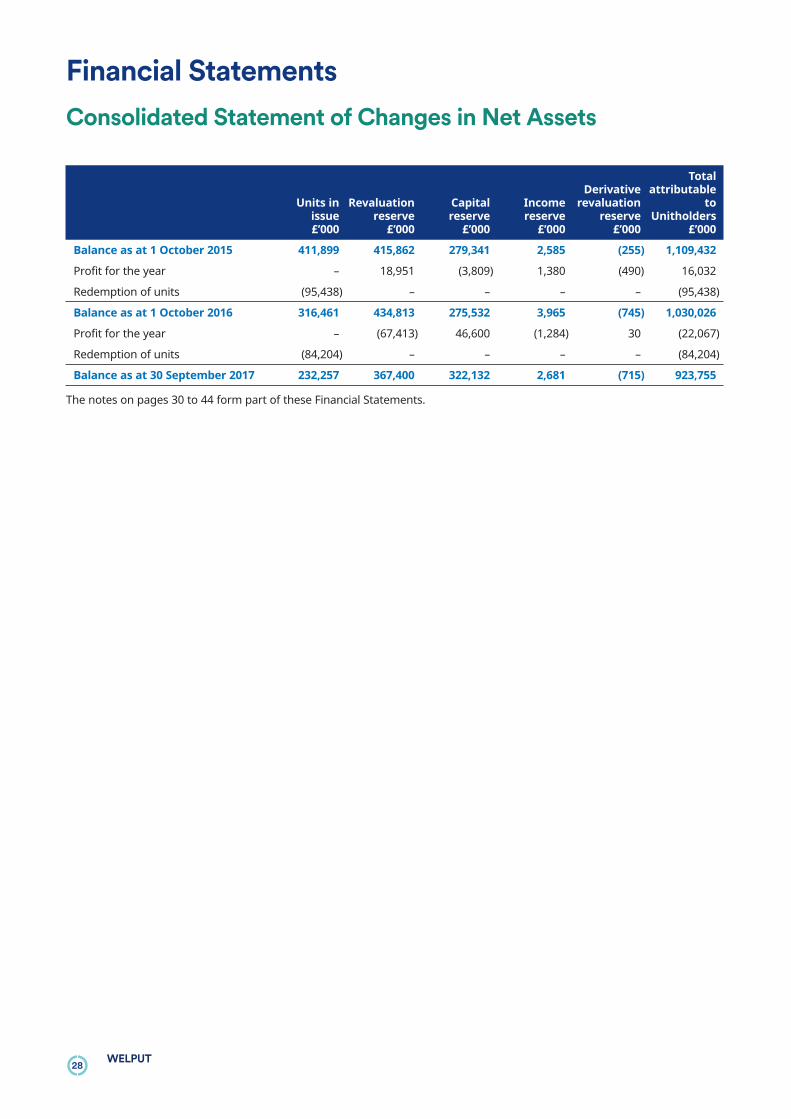
TotalDerivative attributable
Units in Revaluation Capital Income revaluation toissue reserve reserve reserve reserve Unitholders£’000 £’000 £’000 £’000 £’000 £’000
Balance as at 1 October 2015 411,899 415,862 279,341 2,585 (255) 1,109,432
Profit for the year – 18,951 (3,809) 1,380 (490) 16,032
Redemption of units (95,438) – – – – (95,438)
Balance as at 1 October 2016 316,461 434,813 275,532 3,965 (745) 1,030,026
Profit for the year – (67,413) 46,600 (1,284) 30 (22,067)
Redemption of units (84,204) – – – – (84,204)
Balance as at 30 September 2017 232,257 367,400 322,132 2,681 (715) 923,755
The notes on pages 30 to 44 form part of these Financial Statements.
Financial StatementsConsolidated Statement of Changes in Net Assets
Annual Report and Audited Financial Statementsfor the year ended 30 September 2017 29
Fin
an
cia
l S
tate
me
nts
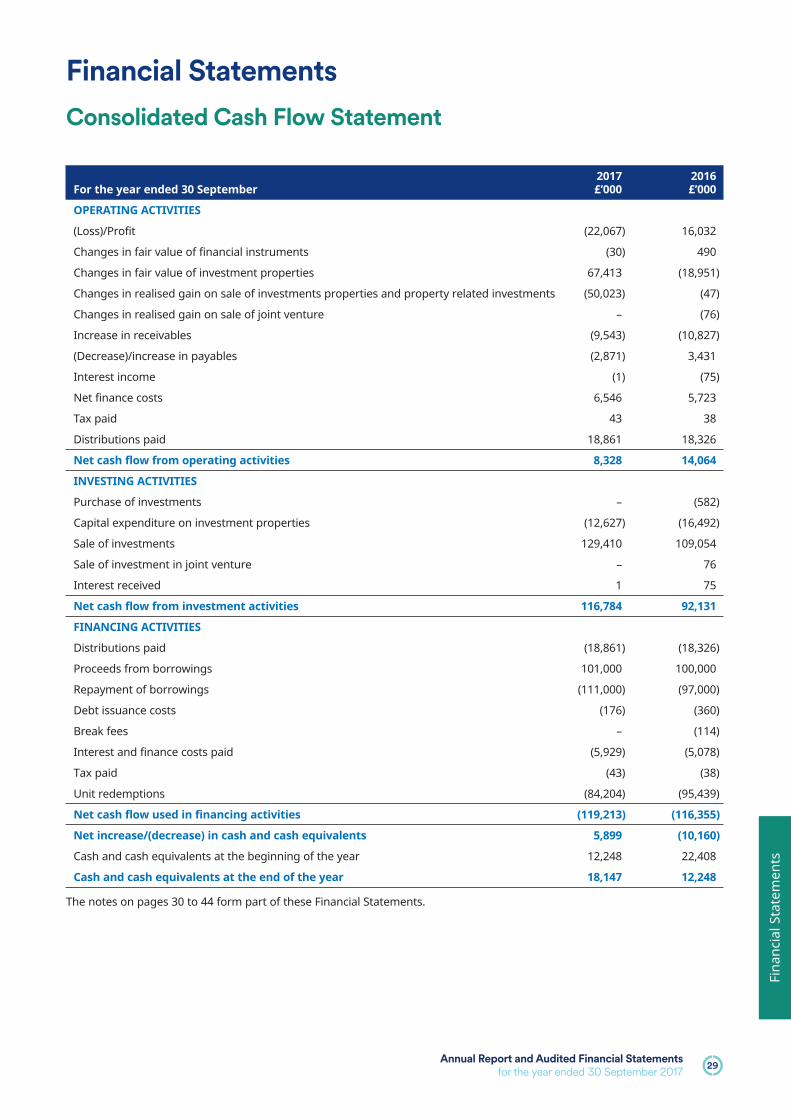
2017 2016For the year ended 30 September £’000 £’000
OPERATING ACTIVITIES
(Loss)/Profit (22,067) 16,032
Changes in fair value of financial instruments (30) 490
Changes in fair value of investment properties 67,413 (18,951)
Changes in realised gain on sale of investments properties and property related investments (50,023) (47)
Changes in realised gain on sale of joint venture – (76)
Increase in receivables (9,543) (10,827)
(Decrease)/increase in payables (2,871) 3,431
Interest income (1) (75)
Net finance costs 6,546 5,723
Tax paid 43 38
Distributions paid 18,861 18,326
Net cash flow from operating activities 8,328 14,064
INVESTING ACTIVITIES
Purchase of investments – (582)
Capital expenditure on investment properties (12,627) (16,492)
Sale of investments 129,410 109,054
Sale of investment in joint venture – 76
Interest received 1 75
Net cash flow from investment activities 116,784 92,131
FINANCING ACTIVITIES
Distributions paid (18,861) (18,326)
Proceeds from borrowings 101,000 100,000
Repayment of borrowings (111,000) (97,000)
Debt issuance costs (176) (360)
Break fees – (114)
Interest and finance costs paid (5,929) (5,078)
Tax paid (43) (38)
Unit redemptions (84,204) (95,439)
Net cash flow used in financing activities (119,213) (116,355)
Net increase/(decrease) in cash and cash equivalents 5,899 (10,160)
Cash and cash equivalents at the beginning of the year 12,248 22,408
Cash and cash equivalents at the end of the year 18,147 12,248
The notes on pages 30 to 44 form part of these Financial Statements.
WELPUT is established and domiciled in Jersey and invests incentral London offices. WELPUT’s stated objectives are to:acquire office properties or vehicles or interests in vehiclesowning office properties (including, where applicable,ancillary retail and residential accommodation) within centralLondon; to hold such properties as Investments; and toactively manage such with a view to optimising income andcapital appreciation. The financial statements of WELPUT arefor the year to 30 September 2017.
Summary of significant accounting policies
Statement of compliance
The principal accounting policies applied in the preparationof these Financial Statements are set out below. Thesepolicies have been consistently applied throughout theperiod presented, unless otherwise stated. WELPUT hasadopted FRS 102 in these financial statements which havebeen prepared in compliance with United KingdomAccounting Standards, including Financial ReportingStandard 102, ‘‘The Financial Reporting Standard applicablein the United Kingdom’’ (‘‘FRS 102’’). WELPUT’s accountingpolicies will be reviewed annually to confirm that they remainappropriate and are in accordance with FRS102 and the TrustInstrument.
The Financial Statements have been prepared on a goingconcern basis in accordance with the historical costconvention, as modified by the revaluation of investmentproperty and certain financials assets and liabilitiesmeasured at fair value through profit or loss, and inaccordance with applicable United Kingdom AccountingStandards and the Trust Instrument.
The Manager has examined significant areas of possiblefinancial risk and has not identified any materialuncertainties which would cast significant doubt onWELPUT’s ability to continue as a going concern for a periodof not less than twelve months from the date of the approvalof the financial statements. The Manager has satisfiedthemselves that WELPUT has adequate resources to continuein operational existence for the foreseeable future.
After due consideration, the Manager believes it isappropriate to adopt the going concern basis in preparingthe financial statements.
Use of estimates and judgments
The preparation of financial statements in conformity withFRS 102 requires management to make judgments,estimates and assumptions that affect the application ofpolicies and the reported amounts of assets and liabilities,income and expenses. These estimates and associatedassumptions are based on historical experience and variousother factors that are believed to be reasonable under thecircumstances, the results of which form the basis of makingjudgments about the carrying values of assets and liabilitiesthat are not readily apparent from other sources. Actualresults may differ from these estimates. The estimates and
underlying assumptions are reviewed on an ongoing basis.Revisions to accounting estimates are recognised in theperiod in which the estimates are revised and in any futureperiods affected.
The most significant estimates made in preparing theseFinancial Statements relate to the carrying value ofinvestment properties which are stated at market value.WELPUT uses external professional valuers to determine therelevant amounts. Judgments made by management in theapplication of FRS 102 that have a significant effect on thefinancial statements and estimates with a significant risk ofmaterial adjustment in the next year are disclosed in note 17under the heading ‘fair value measurement’.
The principal accounting policies adopted in these FinancialStatements, which have been applied consistently to allGroup1 entities are:
(a) Investment properties owned by WELPUT areindependently valued on the basis of market valuehaving regard to whether they are let or unlet at thedate of valuation. Sites in the course of development areindependently valued with regard to the stage reachedin the construction and taking account of any agreedletting and of any contractual liabilities to advancefurther monies. Where a legally binding, unconditionaland irrevocable purchase contract exists at the periodend date, but there has been insufficient time to arrangefor an independent valuation to be carried out, theproperty is shown at cost unless, in the opinion of theManager, there may be a material difference betweencost and valuation on completion.
In the case of sites purchased for development where nowork has taken place, the property is shown at costunless, in the opinion of the Manager there may be amaterial deficit between cost and valuation, in whichcase the property is stated at the lower of cost orvaluation.
(b) Acquisitions and disposals of properties are consideredto have taken place where, by the end of the accountingperiod, there is a legally binding, unconditional andirrevocable contract.
(c) Property related investments are valued at net assetvalue as calculated by the relevant manager of theinvestment in accordance with the same accountingpolicies as set out in this note.
(d) Investments in subsidiary undertakings are carried attheir net asset value as provided by the relevantmanager.
(e) Changes in fair values are recognised in theConsolidated Statement of Comprehensive Income.Realised profits, less realised losses, determined byreference to carrying value at the commencement of theaccounting period, are recognised in the ConsolidatedStatement of Comprehensive Income. Realised priorperiod revaluations are taken to the capital reserve as arealised profit or loss on sale.
(f) Rental income is recognised in the ConsolidatedStatement of Comprehensive Income on an accrualsbasis, including a best estimate for unsettled rent
Financial StatementsNotes to the Financial Statements
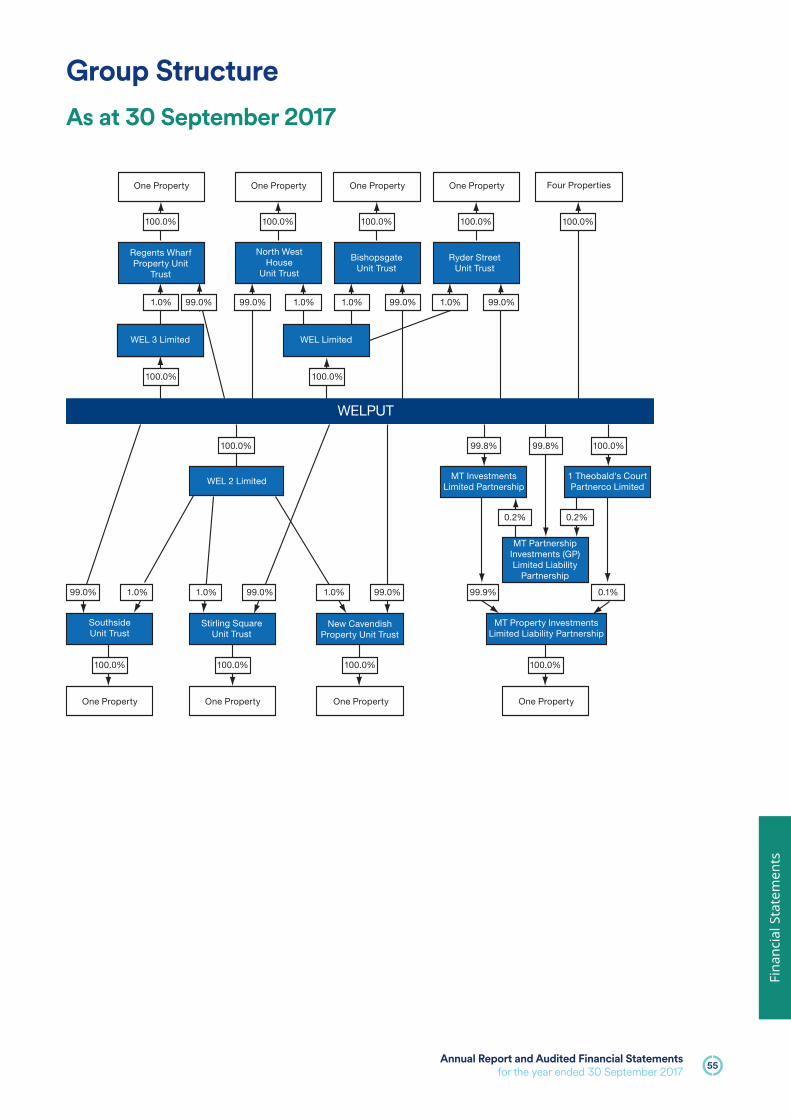
1 Group entities set out on page 55 within Group Structure.
Annual Report and Audited Financial Statementsfor the year ended 30 September 2017 31
Fin
an
cia
l S
tate
me
nts
Notes to the Financial Statements continued
reviews. Provisions are made where, in the opinion of theManager, amounts are deemed likely to be irrecoverable.Income from property related investments comprisesdistribution receivable gross of any related tax withheldand is accounted for on a receivable basis.
(g) Benefits to lessees in the form of rent free periods aretreated as a reduction in the overall return on the leasesand, in accordance with FRS102, are recognised on astraight line basis over the shorter of the lease term andthe period to the tenant lease break option if expected tobe exercised. Capital contributions paid to tenants areshown as a debtor and amortised over the shorter ofeither the period of the lease or the tenant lease breakoption. All rent free and capital contribution incentivesentered into before 1 October 2013 have beengrandfathered in accordance with FRS102, and as suchthese incentives are recognised on a straight line basisover the shorter of the lease term or the first rent reviewdate. The valuation of the investment properties isreduced by all lease incentives.
(h) Surrender premia paid to outgoing tenants to terminateleases are charged to the Consolidated Statement ofComprehensive Income. Where new tenants are to takeover the leases on more desirable terms such paymentsare deferred and amortised on a straight line basis overthe shorter of the new lease term and the tenant leasebreak option.
(i) Interest receivable and payable are accounted for on anaccruals basis.
(j) Fees and expenses are recognised on an accruals basisand are allocated between income and capital asappropriate, based on the Manager’s estimate of whatrepresents a fair apportionment. The Managerapportions 50% of the Manager’s and Property Adviser’sfees to the Consolidated Statement of ComprehensiveIncome with the remaining 50% being charged to capitalin the Consolidated Statement of Comprehensive Incomeand accumulated in the capital reserve. The Managerbelieves this fairly reflects the fact that optimisation ofboth the income and capital returns of WELPUT are jointobjectives of the Manager and Property Adviser.
(k) Borrowings are initially recognised as proceeds received,net of issue costs incurred. Debt arrangement fees whichqualify to be treated as issue costs are deducted fromthe gross amount of borrowings and are amortisedthrough the Consolidated Statement of ComprehensiveIncome over the period of the borrowing as acomponent of interest payable. Other finance expensesare written off as they are incurred.
(l) WELPUT can use interest rate swaps to help manage itsinterest rate risk. Where interest rate swaps are hedgingexisting interest rate exposures or are expected to hedgefuture interest rate exposures, the differences betweenthe interest payable by WELPUT and the interest payableto WELPUT by the swap counterparties are dealt with onan accruals basis. Gains and losses arising on the
cancellation of swaps are taken to the ConsolidatedStatement of Comprehensive Income except where:
(i) such gains and losses are received or settled by anew swap counterparty or lender and areembedded either in the interest rate relating to thenew swap entered into or the interest rate relatingto the new credit facility. These gains and losses areaccounted for on an accruals basis as interestpayable on the new swap or new credit facility;
(ii) the swaps relate to the funding of a particularproperty and are cancelled as a result of theproperty being sold. These gains and losses arecharged or credited to capital in the ConsolidatedStatement of Comprehensive Income.
All derivatives are initially recognised at fair value at thedate the derivative is entered into and are subsequentlyre-measured at fair value. The gains or losses onderivatives, which are not designated as a hedginginstrument, are recognised in the profit or loss in theConsolidated Statement of Comprehensive Income. Thegains or losses on derivatives, which are designated as ahedging instrument, are recognised in capital in theConsolidated Statement of Comprehensive Income.
(m) Performance fees are recognised in capital in theConsolidated Statement of Comprehensive Income, sincethey reflect largely capital appreciation of investmentproperties.
(n) For the purposes of the Consolidated Cash FlowStatement only, cash comprises cash in hand and onovernight deposit, net of the amount of any overdraft.
(o) WELPUT has prepared Consolidated FinancialStatements. The Consolidated Financial Statementsinclude the results of WELPUT and its subsidiaryundertakings. The results of subsidiary undertakingsacquired or sold during the year are included in theConsolidated Financial Statements from, or up to, thedate control passes. Intragroup transactions andbalances are eliminated on consolidation.
The Group’s significant accounting policies are stated above.Not all of these significant accounting policies required theGroup to make difficult, subjective or complex judgments orestimates. The following is intended to provide anunderstanding of the policies that the Group considerscritical because of the level of complexity, judgment orestimation involved in their application and their impact onthe Financial Statements. These judgments involveassumptions or estimates in respect of future events. Actualresults may differ from these estimates.
Fair value measurement
A number of assets and liabilities included in the Group’sFinancial Statements require measurement at and/ordisclosure of, fair value.
The fair value measurement of the Group’s financial and non-financial assets and liabilities utilises market observable
32WELPUT
Freehold Leasehold TotalGroup £’000 £’000 £’000
Market valuation at 1 October 2016 950,980 313,750 1,264,730
Additions to existing properties at cost 4,274 8,646 12,920
Cost of properties sold (75,973) – (75,973)
Revaluation reserve on property sold, previously recognised (43,186) – (43,186)
Movement in revaluation reserve on retained properties (9,525) (2,946) (12,471)
Market valuation at 30 September 2017 826,570 319,450 1,146,020
inputs and data as far as possible. Inputs used indetermining fair value measurements are categorised intodifferent levels based on how observable the inputs used inthe valuation technique utilised as per the following ‘fairvalue hierarchy’:
– Level 1: Quoted prices (unadjusted) in active markets foridentical assets or liabilities;
– Level 2: Inputs other than quoted prices included withinlevel 1 that are observable for the asset or liability, suchas prices of recent transactions for identical instruments;
– Level 3: Inputs for the asset or liability that are not basedon observable market data and are estimated using avaluation technique.
The Group measures a number of items at fair value.
– Investment property (note 2);
– Derivative financial instruments (note 6).
More detailed information in relation to the fair valuemeasurement of these items can be found in the referrednotes.
2. Fixed assets – investment property
The Group’s investment properties were valued at30 September 2017 by an independent professionallyqualified valuer who holds and has relevant experience inthe locations and segments of the investment propertiesvalued. For all investment properties, their current useequates to the highest and best use. At each reportingperiod the property adviser:
– verifies all major inputs to the independent valuationreport;
– holds discussions with the independent valuer.
The valuation technique uses significant unobservable inputssuch that the fair value measurement of investment propertywas classified as level 3.
Notes to the Financial Statements continued
The total value of the Group’s investment properties at30 September 2017 was £1,146,020,000 (30 September 2016:£1,264,730,000), as valued by the external valuer, CBRELimited.
The valuations have been reduced by unamortised tenantincentives in line with WELPUT’s accounting policies (seenote 1(g)).
Annual Report and Audited Financial Statementsfor the year ended 30 September 2017 33
Fin
an
cia
l S
tate
me
nts
Notes to the Financial Statements continued
3. Fixed assets – investment in subsidiary undertakings
Valuation at Additions Movement in Valuation at1 October at transfer Capital revaluation 30 Sept
Southside Unit Trust 228,783 2,434 – – 1,227 232,444
Stirling Square Unit Trust 191,547 1,812 – – 2,552 195,911
St James Square Unit Trust 124,071 2,845 (122,663) (4,253) – –
New Cavendish Square Unit Trust 136,257 218 – – (14,596) 121,879
Regents Wharf Unit Trust 56,735 643 – – (2,433) 54,945
Ryder Street Unit Trust 63,808 9,476 – – (2,951) 70,333
North West House Unit Trust 30,460 1,526 – – (1,086) 30,900
Bishopsgate Unit Trust 54,031 – – – (2,811) 51,220
WEL Limited 3,006 – – – – 3,006
WEL 2 Limited 1,460 – – – – 1,460
WEL 3 Limited 39 – – – – 39
MT Investments LP 90,189 – – – 9,443 99,632
Total 980,386 18,954 (122,663) (4,253) (10,655) 861,769
The Group completed the unit sale of St James Square UnitTrust on 17 May 2017. This was for 83,660.0825 units,representing a 100% interest in St James Square Unit Trust(82,823.5117 units held by WELPUT and 836.5708 held by WELLtd). This was a closed-ended Jersey unit trust established on25 May 2012 to acquire and hold the freehold propertyknown as 3 St James’s Square. 6 Babmaes Street waspreviously under the same ownership as 3 St James’s Squareand was retained by WELPUT as part of the sale. SchroderReal Estate Managers (Jersey) Limited was the manager ofSt James Square Unit Trust until the sale on 17 May 2017.
WELPUT owns:
105,091 units in Southside Unit Trust representing 99.0% ofthe total units in issue. Southside Unit Trust is a closed-endedJersey unit trust established on 1 July 2005 to acquire andhold the freehold property known as Southside in Victoria.Schroder Real Estate Managers (Jersey) Limited is also themanager of Southside Unit Trust.
1,174,423 units in Stirling Square Unit Trust, representing99.0% of the total units in issue. Stirling Square Unit Trust is aclosed-ended Jersey unit trust established on 15 March 2006to acquire and hold the leasehold property known as5-7 Carlton Gardens. Schroder Real Estate Managers (Jersey)Limited is also manager of Stirling Square Unit Trust.
95,604 units in New Cavendish Property Unit Trust,representing 99.0% of the total units in issue. New CavendishProperty Unit Trust is a closed-ended Jersey unit Trustestablished on 13 August 2014 to acquire and hold thefreehold property known as New Cavendish Street. SchroderReal Estate Managers (Jersey) Limited is also manager of NewCavendish Property Unit Trust.
535,902 units in Regents Wharf Property Unit Trust,representing 99.0% of the total units in issue. Regents Wharf
Property Unit Trust is a closed-ended Jersey unit Trustestablished on 27 November 2014 to acquire and hold thefreehold property known as Regents Wharf. Schroder RealEstate Managers (Jersey) Limited is also manager of RegentsWharf Property Unit Trust.
82,254 units in Ryder Street Unit Trust, representing 99.0% ofthe total units in issue. Ryder Street Unit Trust is a closed-ended Jersey unit Trust established on 31 March 2015 toacquire and hold the freehold property known as20 St James’s Street (purchased on 2 April 2015). SchroderReal Estate Managers (Jersey) Limited is also manager ofRyder Street Unit Trust.
42,469 units in North West House Unit Trust, representing99.0% of the total units in issue. North West House Unit Trustis a closed-ended Jersey unit Trust established on 1 May 2015to acquire and hold the freehold property known as NorthWest House. Schroder Real Estate Managers (Jersey) Limitedis also manager of North West House Unit Trust.
50,908 units in Bishopsgate Unit Trust, representing 99.0% ofthe total units in issue. Bishopsgate Unit Trust is a closed-ended Jersey unit Trust established on 15 July 2015 to acquireand hold the freehold property known as 7-11 Bishopsgate.Schroder Real Estate Managers (Jersey) Limited is alsomanager of Bishopsgate Unit Trust.
Two shares in WEL Limited, representing 100.0% of theshares in issue. WEL Limited is a Jersey registered limitedcompany incorporated on 28 June 2005. At 30 September2017, WEL Limited holds the remaining 1% interest inBishopsgate Unit Trust, North West House Unit Trust andRyder Street Unit Trust (30 September 2016: same holdingsand St James Square Unit Trust).
34WELPUT
426,320 shares in WEL 2 Ltd, representing 100.0% of theshares in issue. WEL 2 Limited is a Jersey registered limitedcompany incorporated on 8 June 2011. At 30 September2017, WEL 2 Limited holds the remaining 1% interest in NewCavendish Property Unit Trust, Southside Unit Trust andStirling Square Unit Trust (30 September 2016: sameholdings).
One share in WEL 3 Ltd, representing 100.0% of the shares inissue. WEL 3 Limited is a Jersey registered limited companyincorporated on 4 December 2014. At 30 September 2017,WEL 3 Limited holds the remaining 1% interest in RegentsWharf Property Unit Trust (30 September 2016: sameholding).
Through a holding structure,100.0% of MT Investments LP, aUnited Kingdom registered limited partnership incorporatedon 24 June 2009 to acquire and hold the freehold propertyknown as 98 Theobald’s Road.
Notes to the Financial Statements continued
4. Trade receivables
2017 2016At 30 September £’000 £’000
Rental debtors 10,372 14,868
Sundry debtors 10,128 11,133
Tenant deposit accounts 5,067 7,461
Unamortised tenant incentives 26,720 15,305
52,287 48,767
5. Liabilities (amounts falling due within one year)
2017 2016At 30 September £’000 £’000
Deferred rental income 8,306 8,204
Loan and swap interest accrued 1,204 1,219
VAT payable 5,197 1,507
Tenant deposit accounts 5,067 7,461
Accruals for property expenses 2,496 4,320
Accruals for capital expenditure on properties 4,471 4,049
Sundry creditors 950 2,460
27,691 29,220
6. Bank Loan
DebtWells Fargo Metlife arrangement
facility facility fees TotalUnit Trust and Group £’000 £’000 £’000 £’000
Opening balance at 1 October 2016 200,000 45,000 (2,070) 242,930
Loan drawdowns 81,000 20,000 – 101,000
Repayments of loan (111,000) – – (111,000)
Debt arrangement fees – – (176) (176)
Amortisation of debt arrangement fees – – 628 628
Closing balance at 30 September 2017 170,000 65,000 (1,618) 233,382
Amounts falling due within one year – 65,000 (392) 64,608
Amounts falling due after more than one year 170,000 – (1,226) 168,774
Closing balance at 30 September 2017 170,000 65,000 (1,618) 233,382
Annual Report and Audited Financial Statementsfor the year ended 30 September 2017 35
Fin
an
cia
l S
tate
me
nts
Notes to the Financial Statements continued
Metropolitan Life Insurance Company (MetLife)facility
On 1 December 2011, WELPUT entered into a six year£85.0 million credit facility with MetLife. The credit facility wasstructured as a term facility expiring in December 2017. On15 January 2016 WELPUT repaid £20.0 million of the MetLifefacility, reducing the facility to £65 million. At 30 September2017, WELPUT had £65 million drawn down under the creditfacility: £40.0 million at an all-in fixed interest rate of 3.64%per annum, £5.0 million at an all-in fixed interest rate of3.06% per annum and £20.0 million at a variable rate ofLIBOR plus a margin of 2.00%. A commitment fee is payableon the undrawn amount of the facility at a rate of 0.75% perannum.
As at 30 September 2017 the credit facility was secured byfixed charges over certain properties and subsidiaries, acharge over certain bank accounts and an assignment of rentfrom those.
WELPUT entered into fixed rate interest for 100.0% of theamount borrowed at the time of each draw down. The fixedrate is provided by the lender and mirrors the lender’sequivalent interest rate swap. The fixed rate includes amargin of 2.0% per annum.
The revaluation to fair value of the fixed interest rates on the£65.0 million facility would give rise to a surplus at the periodend of £2,788 (30 September 2016: £728,793 deficit). Suchrevaluation has not been reflected in the FinancialStatements.
Post year end, in November 2017 the whole MetLife facilitywas extended by six months to June 2018.
Wells Fargo facility
The Wells Fargo facility is a £200.0 million facility (composedof £100.0 million term facility and £100.0 million revolvingcredit facility (RCF)) dated 21 April 2015 from Wells FargoBank, N.A. (Wells Fargo) which expires in April 2020 with twoone year extensions from the start of the facility. In April2016 the facility was extended by one year to April 2021. InJune 2016 the addition of a further £35.0 million RCF wascompleted. In April 2017 the second extension option wasexercised, extending the enlarged facility to April 2022. At30 September 2017 WELPUT had £100.0 million drawn downfrom the term facility and £70.0 million drawn down from theRCFs.
WELPUT has created fixed and floating charges in favour ofthe lender over certain properties, subsidiaries andinvestments, charges over certain bank accounts and anassignment of all rent from those properties. The facilitybears interest at LIBOR plus a margin of between 0.90% and1.40% depending on the loan to value ratio. The underlyingLIBOR rate on the £100.0 million term facility drawn wasfixed at 0.368% per annum for the duration of the facility byfixed rate debt. Any undrawn RCF bears a commitment fee of0.36% per annum.
A £25.0 million interest rate cap was purchased on 1 June2015 from Wells Fargo Securities International Ltd, effectivefrom 22 April 2015 until 21 April 2022, for £826,700, with astrike rate of 2.50%. Post year end a further £21.0 million hasbeen drawn down from the RCF.
The bank loans are stated net of unamortised debtarrangement fees of £1,617,687 at 30 September 2017(30 September 2016: £2,070,315). These fees are allocated tothe Consolidated Income and Expenditure Account over theterm of each facility at a constant rate on the carrying value.
Interest rate hedging
Details of the Trust’s fixed rate debt and instruments used to hedge its floating rate debt are summarised below:
30 September 30 September 30 September 30 September2017 2016 2017 2016
Fixed/ Fixed/ Weighted WeightedMaximum rate Maximum rate average life average life
Facility Counterparty Per annum Per annum Years Years
Fixed rate (Metlife) Metropolitan LifeInsurance Company 1.74 1.74 0.19 1.19
Fixed rate (Metlife) Metropolitan LifeInsurance Company 1.06 1.06 0.19 1.19
The fair value adjustment of the interest rate cap reflects thenet present value of the difference in the projected cashflows at the relevant contracted rate and the valuation ratesfor the year ended 30 September 2017 to the contractedexpiry date.
The valuation rates used for the interest rate cap have beenderived from the midpoint of the interest rate yield curveprevailing on 30 September 2017 for the period from thatdate to the contracted expiry date.
Fair value adjustments of fixed rate debt not included in the financial statements (relating to potential early repayment ofWELPUT’s fixed rate facilities):
30-Sep-17 30-Sep-17 30-Sep-17 30-Sep-17 30-Sep-16 30-Sep-16Notional Fair value Fair value
Book value value Fair value adjustment Fair value adjustmentFair value (Level 2) Counterparty £’000 £’000 £’000 £’000 £’000 £’000
Fixed rate (Metlife) Metropolitan Life Insurance Company (40,000) – (110) 574 (684) 89
Fixed rate (Metlife) Metropolitan Life Insurance Company (5,000) – (7) 38 (45) 66
As the intention of the above interest rate hedging is to fixthe interest rates on borrowings, their fair value adjustmenthas not been recognised in the Financial Statements andinstead net interest is accrued through the ConsolidatedIncome and Expenditure Account.
The fair value adjustment of the maximum rate debt reflectsthe change in the value of the option embedded into it tocreate the maximum rate structure since the contract wasentered into.
7. Net assets attributable to unitholders
2017 2016At 30 September £’000 £’000
Units in issue 232,257 316,461
Revaluation reserve 367,400 434,813
Derivative revaluation reserve (715) (745)
Capital reserve 322,132 275,532
Income reserve 2,681 3,965
923,755 1,030,026
(a) Units in issue
2017 2016For the year ended 30 September No. of units £’000 No. of units £’000
Opening balance at 1 October 2016 356,535 78,278 434,813
Movement in unrealised reserve for revaluation of retained property (9,525) (2,946) (12,471)
Movement in respect of properties sold (43,186) – (43,186)
Movement in unamortised tenant incentives (11,613) (143) (11,756)
Closing balance at 30 September 2017 292,211 75,189 367,400
Capital reserves
Realised
gain
Realised Capital Realised on sale of Realised
gain Reserve gain on subsidiary gain Total
on sale of Capitalised Loan redemption under- on sale capital
property fees Waived of units taking of JV reserve
£’000 £’000 £’000 £’000 £’000 £’000 £’000
Opening balance at 1 October 2016 274,737 (78,984) (2,732) 2,249 41,861 38,401 275,532
Movement in respect of:
revaluation reserve realised on
properties sold – – – – 43,186 – 43,186
realised gain on properties sold – – – – 6,837 – 6,837
management fees charged to capital – (3,423) – – – – (3,423)
Closing balance at 30 September 2017 274,737 (82,407) (2,732) 2,249 91,884 38,401 322,132
38WELPUT
Notes to the Financial Statements continued
8. Operating leases
The Group leases out all of its investment properties under operating leases. The future minimum rentals receivable undernon-cancellable operating leases are as follows:
2017 2016For the year ended 30 September £’000 £’000
Less than one year 1,220 4,213
Between one and two years 3,498 3,849
Between three and five years 18,242 27,457
Greater than five years 17,805 4,662
Total 40,765 40,181
9. Interest payable and finance expenses
2017 2016For the year ended 30 September £’000 £’000
Interest on bank loan 5,580 4,575
Amortisation of debt arrangement fees 632 629
Loan commitment and utilisation fee 334 519
Total 6,546 5,723
10. Taxation
WELPUT is a Jersey based property unit trust and is taxexempt as agreed with the Jersey Tax Authorities. WELPUTmakes no provision for taxation and distributions are madegross to non-Jersey resident unitholders. 20% Jersey tax iswithheld from distributions payable to unitholdersconsidered to be Jersey resident for income tax purposes.Each unitholder is responsible for their own taxationtreatment on their share of WELPUT’s income. Furtherinformation on distributions and United Kingdom taxation isdetailed in the prospectus and in the General Informationsection on page 51.
WEL Limited receives UK rental income and is therefore liablefor UK income tax at the rate of 20.0%. A provision of £7,641(30 September 2016: £4,337) has been included within theFinancial Statements.
WEL 2 Limited receives UK rental income and was thereforeliable to UK income tax at the rate of 20.0%. A provision of£32,885 (30 September 2016: £30,490) has been included inthe financial statements.
WEL 3 Limited receives UK rental income and was thereforeliable to UK income tax at the rate of 20.0%. A provision of£2,951 (30 September 2016: £3,248) has been included in thefinancial statements.
Annual Report and Audited Financial Statementsfor the year ended 30 September 2017 39
Fin
an
cia
l S
tate
me
nts
Notes to the Financial Statements continued
11. Reconciliation of distributions to Consolidated Income and Expenditure Account
The distributions calculated in respect of the year are as follows:
Available forGroup distributionMonth ended £’000
September 2016 1,720
October 2016 1,601
November 2016 1,351
December 2016 1,593
January 2017 1,325
February 2017 1,315
March 2017 1,686
April 2017 1,431
May 2017 1,610
June 2017 2,107
July 2017 1,700
August 2017 1,422
Distribution paid 18,861
Movement in income reserve (1,720)
Rents distributed in October 2017 1,817
Unamortised break costs 197
Loss adjustment 971
Under-distribution adjustment for prior year (109)
Movement in distribution payable 1,156
Adjustments for rent free periods (3,206)
Amortised tenant incentives (928)
Net operating income available for distribution 15,883
12. Property expenses
2017 2016For the year ended 30 September £’000 £’000
Service charge expenses – insurance 341 391
Service charge expenses – service charge 8,430 8,280
Ground rent 1,019 1,018
Rates 2,122 4,313
Letting and legal fees 1,049 1,004
Bad debt provision 109 (9)
Surrender premium 27 333
Other expenses 2,248 461
Total property expenses 15,345 15,791
40WELPUT
Notes to the Financial Statements continued
13. Other income
2017 2016For the year ended 30 September £’000 £’000
Surrender premium 131 –
Dilapidation income 759 575
Total other income 890 575
14. Capital commitments
During the year ended 30 September 2017, the total capitalexpenditure incurred amounted to £12.9 million(30 September 2016: £19.5 million). As at 30 September 2017remaining approved unspent capital expenditure was£27.5 million (30 September 2016: £26.2 million). TheConsolidated Financial Statements include an accrual forcosts incurred but not yet paid in relation to the value ofwork carried out to 30 September 2017 of £4.5 million(30 September 2016: £4.0 million).
As at 30 September 2017 there were 109,875.0982 ofunmatched redemption units. Post year end 149.0000 unitshave been matched via the secondary market, leaving109,726.0982 of unmatched redemption units with a value of£91.3 million. It is the Manager’s intention to continue tomatch Redemption Units via the secondary market prior tothe redemption date of 29 June 2018.
15. Related party disclosure and materialcontracts
(a) Fees receivable by the Trustees
The Trustees, BNP Paribas Securities Services TrustCompany Limited and BNP Paribas Securities ServicesTrust Company (Jersey) Limited, receive a fee based onthe higher of £15,000 per annum and an amountequivalent to 0.0075% per annum of the net asset value.
Gross Trustees’ fees charged for the year ended30 September 2017 amounted to £86,852 being fees of£73,360 and disbursements of £13,492 (30 September2016: £162,920). BNP Paribas Securities Services TrustCompany Limited and BNP Paribas Securities ServicesTrust Company (Jersey) Limited also act as Trustees forBishopsgate Unit Trust, New Cavendish Property UnitTrust, North West House Unit Trust, Regents WharfProperty Unit Trust, Ryder Street Unit Trust, SouthsideUnit Trust, St James Square Unit Trust (until sale on17 May 2017) and Stirling Square Unit Trust which areinvestments held by WELPUT as detailed in note 3. TheTrust Instruments relating to these trusts state that ifthe Trustees receive fees for the management of a unittrust which is a unitholder in these trusts, the unitholdershall receive a rebate of the proportion of the Trustees’fees equivalent to its unitholding.
The Trustees have waived the right to receive fees inrelation to Bishopsgate Unit Trust, North West HouseUnit Trust, New Cavendish Property Unit Trust, RegentsWharf Property Unit Trust, Ryder Street Unit Trust,Southside Unit Trust, St James Square Unit Trust (untilsale on 17 May 2017) and Stirling Square Unit Trust.
£17,396 was due to the Trustees at 30 September 2017(30 September 2016: £19,627).
(b) Fees receivable by the Manager
WELPUT’s Manager, Schroder Real Estate Managers(Jersey) Limited, is entitled to a fee as follows:
Net Asset value at the expiration of each month
Up to and including £480.5 million 0.49% per annum
Excess over £480.5 million and up to and including 0.42% per annum
Excess over £873.7 million 0.35% per annum
As applied from 1 October 2014 following themodernisation of WELPUT and in accordance withclause 21 of the Trust Instrument.
Gross Manager’s fees charged for the year ended30 September 2017 amounted to £4,576,191(30 September 2016: £5,050,615), including £197,136(30 September 2016: £168,750) being charged to thesubsidiary entities (as detailed below).
WELPUT charges 50% of the gross Manager’s feesdirectly to capital reserves in accordance with note 1(j).
The Manager receives an annual fee of £25,000 perannum in relation to Bishopsgate Unit Trust, North WestHouse Unit Trust, New Cavendish Property Unit Trust,Regents Wharf Property Unit Trust, Ryder Street UnitTrust, Southside Unit Trust, St James Square Unit Trust(until sale on 17 May 2017) and Stirling Square Unit Trustincluded in the gross fee.
£1,087,840 was due to the Manager at 30 September2017 (30 September 2016: £1,191,904).
Annual Report and Audited Financial Statementsfor the year ended 30 September 2017 41
Fin
an
cia
l S
tate
me
nts
Notes to the Financial Statements continued
(c) Fees receivable by the Property Adviser
WELPUT’s Property Adviser was entitled to a fee duringthe period, as follows:
Net Asset value at the expiration of each month
Up to and including £480.5 million 0.21% per annum
Excess over £480.5 million and up to and including 0.28% per annum
Excess over £873.7 million 0.35% per annum
As applied from 1 October 2014 following themodernisation of WELPUT and in accordance withclause 21 of the Trust Instrument.
Gross Property Adviser’s fees charged for the year ended30 September 2017 amounted to £2,475,323(30 September 2016: £2,984,442). WELPUT charges 50%of the gross Property Adviser’s fees directly to capitalreserves in accordance with note 1(j).
The Property Adviser waived the right to receive fees inrelation to MT Property Investments Limited LiabilityPartnership, Bishopsgate Unit Trust, North West HouseUnit Trust, New Cavendish Property Unit Trust, RegentsWharf Property Unit Trust, Ryder Street Unit Trust,Southside Unit Trust, St James Square Unit Trust (untilsale on 17 May 2017) and Stirling Square Unit Trust asthese trusts are effectively 100% owned by WELPUT.
£570,141 was due to the Property Adviser at30 September 2017 (30 September 2016: £674,268).
(d) Performance fees
The Manager and Property Adviser are each entitled to a50% share of any performance fee due. The Managercalculates the performance fee payable or theperformance fee shortfall (known as the ‘reserve accountdebit’) for each relevant calculation period (based on thecalendar year and transitioning to a three year rollingperiod from 1 January 2014) in accordance withclause 23 of the Trust Instrument and following themodernisation of WELPUT on 1 October 2014.
The performance fee is calculated in relation to the levelof outperformance of the target returns at both theproperty portfolio and Trust levels. If the Trust return isgreater than the relevant Segment of the InvestmentProperty Databank Quarterly Universe (‘the IPDBenchmark’, being the West End of London and MidTown Office Segment prior to 1 January 2015 and thecentral and Inner London Offices thereafter) plus 1% andthe property portfolio return is greater than the MSCIBenchmark, a performance fee is calculated based onthe outperformance of the Trust return compared to theIPD Benchmark plus 1% and multiplied by theperformance fee multiplier determined as follows:
– 20%, if the portfolio return is greater than or equalto the IPD Benchmark, but less than the IPDBenchmark plus 2%;
– 30%, if the portfolio return is greater than or equalto the IPD Benchmark plus 2%.
If the portfolio return is less than the IPD Benchmark andthe Trust return is less than the IPD Benchmark, a reserveaccount debit is calculated for that calculation year.
A reserve account debit is calculated based on theunderperformance of the Trust return compared to theIPD Benchmark and mutliplied by the underperformancefee mulitplier determined as follows:
– 20%, if the portfolio return is less than the IPDBenchmark, but not less than the IPD Benchmarkless 2%;
– 30%, if the portfolio return is less than or equal tothe IPD Benchmark less 2%. If the portfolio return isgreater than the IPD Benchmark but the Trustreturn is less than the IPD Benchmark plus 1%, or ifthe portfolio return is less than the IPD Benchmarkbut the Trust return is higher than the IPDBenchmark, no performance fee or reserve accountdebit is calculated for that year.
The whole of the performance fee calculated is creditedto a notional account known as the reserve account Inthe event that a reserve account debit is calculated, thisamount is debited to the reserve account. Following theend of each calculation period, and the crediting to thereserve account of the performance fee or the debitingof the reserve account debit, half of the credit balance (ifany) on the reserve account is divided between and paidto the Manager and Property Adviser in equal portions.The reserve account debit may not create a negativebalance and only reduce the amounts standing to thecredit of this reserve to zero. Based on performance forthe period to 30 September 2017, no Performance Fee isexpected for the year to 31 December 2017. The balanceon the notional reserve account at 30 September 2017was £nil (30 September 2016: £nil) and therefore noaccrual for this amount has been included in theConsolidated Financial Statements as at 30 September2017 (30 September 2016: no accrual). A payment of £nilwas made during the period in respect of performancefees (30 September 2016: £nil).
(e) Unitholders
The following unitholder was considered a related partyduring the year:
The Schroder Indirect Real Estate Fund (SIRE)
Managed by the Manager and advised by a company inthe same Group as the Manager.
The following unitholders were considered relatedparties in the prior year:
Schroder UK Real Estate Fund (SREF)
Managed by a company in the same Group as theManager.
Quintain Estates and Development PLC
Parent of the Property Adviser, Grafton Advisors (2006)LLP, up to 20 July 2016.
42WELPUT
Notes to the Financial Statements continued
The balances and transactions for each unitholder shown above are as follows for the year ended:
Closing Distributions DistributionsClosing value of received received
Opening balance Units balance of unitholding during duringof units at sold units at at period ended period ended1 October during the 30 September 30 September 30 September 30 September
2016 year 2017 2017 2017 2016£’000 £’000 £’000
Schroder UK Real Estate Fund – – – – – 932.2
The Schroder Indirect Real Estate Fund 11,631.1840 (11,631.1840) – – 89.0 216.0
Quintain Estates and Development PLC* 15,709.0000 (15,709.0000) – – 88.0 223.6
* Quintain Estates and Development PLC ceased to be a related party in July 2016 and disposed of all their units in January 2017.
16. Reconciliation of movements in unitholders’ funds
2017 2016For the year ended 30 September £’000 £’000
Opening balance 1,030,026 1,109,432
Redemption of units (84,204) (95,438)
Capital surplus (20,813) 15,142
Income reserve movement for the year (1,284) 1,380
WELPUT holds cash and liquid resources as well as havingtrade receivables and trade payables that arise directly fromits operations. WELPUT purchased an interest rate cap tolimit exposure to interest rate risks. WELPUT does not haveany other derivative instruments.
The main risks arising from WELPUT’s financial instrumentsand properties are market price risk, credit risk, liquidity riskand interest rate risk. WELPUT is only directly exposed tosterling and hence is not exposed to currency risks. TheManager regularly reviews and agrees policies for managingeach of these risks and these are summarised below:
Market price risk
Rental income and the market value for properties aregenerally affected by overall conditions in the local economy,such as changes in gross domestic product, employmenttrends, inflation and changes in interest rates. Changes ingross domestic product may also impact employment levels,which in turn may impact the demand for premises.Furthermore, movements in interest rates may also affectthe cost of financing for real estate companies.
Both rental income and property values may also be affectedby other factors specific to the property market, such ascompetition from other property owners, the perceptions ofprospective tenants of the attractiveness, convenience andsafety of properties, the inability to collect rents because of
bankruptcy or the insolvency of tenants or otherwise, theperiodic need to renovate, repair and release space and thecosts thereof, the costs of maintenance and insurance, andincreased operating costs.
The Manager monitors the market value of investmentproperties by having valuations carried out monthly by a firmof independent chartered surveyors, who are a registeredindependent appraiser. Included in the market price risk isinterest rate risk which is discussed further below.
Credit risk
Credit risk is the risk that an issuer or counterparty will beunable or unwilling to meet a commitment that it hasentered into with WELPUT. In the event of default by anoccupational tenant, WELPUT will suffer a rental incomeshortfall and incur additional costs, including legal expenses,in maintaining, insuring and re-letting the property. TheManager reviews reports prepared by Experian, or othersources to assess the credit quality of WELPUT’s tenants andaims to ensure there are no excessive concentration of riskand that the impact of any default by a tenant is minimised.
In respect of credit risk arising from other financial assets ofWELPUT, which comprise of cash and cash equivalents,WELPUT’s exposure to credit risk arises from default of thecounterparty with a maximum exposure equal to thecarrying amounts of these instruments. To mitigate suchrisks WELPUT’s cash is maintained with major internationalfinancial institutions.
Annual Report and Audited Financial Statementsfor the year ended 30 September 2017 43
Fin
an
cia
l S
tate
me
nts
Notes to the Financial Statements continued
The following table indicates the maturity analysis of the financial liabilities:
Carrying 6 months 6 months- More thanamount or less 2 years 2-5 years 5 years
As at 30 September 2017 £’000 £’000 £’000 £’000 £’000
Payables (19,385) (19,385) – – –
Amounts due to unitholders (5,018) (5,018) – – –
Bank loan (233,382) 221 (64,487) (169,116) –
Interest on borrowings and amortisation of debt arrangement fees – (2,556) (6,641) (11,329) –
Carrying 6 months 6 months- More thanamount or less 2 years 2-5 years 5 years
As at 30 September 2016 £’000 £’000 £’000 £’000 £’000
Payables (21,016) (21,016) – – –
Amounts due to unitholders (8,346) (8,346) – – –
Bank loan (242,930) 327 (44,241) (199,016) –
Interest on borrowings and amortisation of debt arrangement fees – (3,117) (8,032) (11,495) –
Bank loans and interest on borrowings are calculated on the loans outstanding as at the year end.
Appropriate prudent credit limits are established for eachcounterparty at the asset class and duration level. These arebased on the counterparty’s creditworthiness and thebusiness requirements. All credit limits and exposures arereviewed at least annually or more frequently ifcircumstances require, such as a ratings downgrade.
Rent receivables past their due date, but which were notimpaired at the reporting date were:
2017 2016Carrying Carryingamount amount
30 September £’000 £’000
0-30 days 4,335 2,751
31-60 days 389 –
61-90 days – 40
91 days plus – 677
4,724 3,468
Net of bad debt provisions of £126,210 (2016: £41,024)
Amounts that are past their due date are regularly reviewedto ensure that they are expected to be recoverable otherwisethey are treated as impaired. Tenant deposits are held andcan be used in the event of rent arrears.
Liquidity risk
Liquidity risk is the risk that WELPUT will encounter inmeeting obligations associated with its financial obligations.WELPUT’s investments comprise UK properties. Propertiesare inherently difficult to value due to the individual natureof each property. As a result, valuations are subject tosubstantial uncertainty. There is no assurance that theestimates resulting from the valuation process will reflect theactual sales price even where such sales occur shortly afterthe valuation date. Investment in properties are relativelyilliquid, however WELPUT has tried to mitigate this risk byinvesting in desirable properties in prime locations.
In certain circumstances, the terms of WELPUT’s debtfacilities entitle the lender to require early repayment and insuch circumstances WELPUT’s ability to maintain distributionlevels and the net asset value could be adversely affected.The Manager prepares cash flows on a rolling basis toensure the Group can meet liabilities as and when they falldue.
Interest rate risk
Exposure to market risk for changes in interest rates relatesprimarily to WELPUT’s long-term debt obligations and tointerest earned on cash balances. Interest on WELPUT’s long-term debt obligations is payable on a fixed and floating ratebasis.
WELPUT is exposed to changes in fair value of the fixed long-term debt obligations driven by interest rate movements. Asat 30 September 2017 the fair value of WELPUT’s fixed loan
of £165.0 million was £163.4 million (2016: on the fixed loanof £145.0 million the fair value was £139.7 million).
WELPUT uses a revolver facility that is payable on a floatingrate basis and exposed to variable interest rate. An interestrate cap is used to guarantee a maximum interest rate andlimit the exposure to variable interest rates on the first£25.0 million drawn of the revolver facility and is exposed tochanges in fair value of driven by interest rate movements.As at 30 September 2017 the fair value of the interest rate
44WELPUT
Notes to the Financial Statements continued
cap was an asset of £0.1 million (2016: £0.1 million). Furtheramounts drawn on the revolver facility are exposed tointerest rate movements.
A 1% increase or decrease in short term interest rates wouldincrease or decrease the annual income by £1 million basedon the loan balance as at 30 September 2017. The equitywould increase by £199,604 with a 1% increase in LIBOR anddecrease by £81,561 with a 1% decrease in libor due to theeffect on the fair value of the interest rate cap.
Fair value measurement
The fair values of financial assets and liabilities are notmaterially different from their carrying values in the financialstatements.
The fair value hierarchy levels are as follows:
Level 1 – quoted prices (unadjusted) in active markets foridentical assets and liabilities
Level 2 – inputs other than quoted prices included withinlevel 1 that are observable for the asset or liability, such asprices of recent transactions for identical instruments
Level 3 – inputs for the assets or liability that are not basedon observable market data and are estimated using avaluation technique.
Investment Property – level 3
Fair value is based on valuations provided by an independentfirm of chartered surveyors and registered appraisers. Thesevalues were determined after having taken intoconsideration recent market transactions for similarproperties in similar locations to the investment propertiesheld by WELPUT. The fair value hierarchy of investmentproperty is level 3. See Note 2 for further details.
Interest bearing loans and borrowings – level 2
Fair values are based on valuations provided by anindependent and regulated firm of a financial riskmanagement consultancy. The fair values were determinedusing the present value of future cash flows discounted at amarket rate of interest. Issue costs are amortised over theperiod of the borrowings. See Note 6 for further details.
Trade Receivables and Trade Payables
All receivables and payables are deemed to be due withinone year and as such the notional amount is considered toreflect the fair value. There are £4.7 million overdue tradereceivables in the year to 30 September 2017 (2016:£3.5 million).
Annual Report and Audited Financial Statementsfor the year ended 30 September 2017 45
Fin
an
cia
l S
tate
me
nts
Financial StatementsUnaudited Environmental Data Report
WELPUT Annual Portfolio Report: Environmental Data
Total Energy Consumption
The table below sets out total landlord obtained energy consumption from WELPUT’s managed portfolio by sector.
Total electricity Total fuel Building energyconsumption consumption intensity
Mixed Use 6,000,474 6,903,983 4,795,477 4,803,598 603 659
Coverage 2 2 2 2 1 1
Total 10,836,795 11,551,739 9,174,404 9,407,137
Total Electricity and Fuel 20,011,199 20,958,876
Renewable energy % 53% 54%
Coverage 9 9 7 7
– Consumption data relates to the managed portfolio only:
– Offices: Common parts and shared services consumption, or whole building consumption;
– Mixed use: Whole building consumption.
– Coverage relates to number of managed assets for which data is reported
– Normalisation: A kWh/m2 is reported for assets within the like for like portfolio. The numerator is landlord-managed energy consumption and thedenominator is net lettable floor area (m2).
WELPUT reports sustainability information in accordancewith INREV Sustainability Reporting Guidelines 2016 for theyear 1st April 2016 – 31st March 2017 presented withcomparison against the period 1st April 2015 to 31st March2016. As permitted by the INREV Sustainability ReportingGuidelines, environmental data has been developed andpresented in line with the Global Real Estate SustainabilityBenchmark (GRESB).
The reporting boundary has been defined to where WELPUThas operational control: managed properties where WELPUTis responsible for payment of utility invoices and / orarrangement of waste disposal contracts. In the 2015/2016reporting year there were 9 such managed assets within theportfolio, with this remaining the same in the 2016/2017reporting year.
46WELPUT
Unaudited Environmental Data Report continued
Like-for-like energy consumption
The table below sets out the like-for-like landlord obtained energy consumption from WELPUT’s managed portfolio by sector.
Total electricity consumption Total fuel consumption(kWh) (kWh)
– Methodology: The Company’s greenhouse gas inventory has been developed using the GHG Protocol Corporate Accounting and ReportingStandard and GHG emission factors from the UK Government’s GHG Conversion Factors for Company Reporting 2016. Emissions from electricity(Scope 2) are reported according to the ‘location-based’ approach. GHG emissions are presented as kilograms of carbon dioxide equivalent (kgCO2e).
– GHG emissions data relates to the managed portfolio only:
– Offices: Common parts and shared services energy consumption, or whole building energy consumption;
– Mixed use: Whole building energy consumption.
– Coverage relates to number of managed assets for which data is reported.
– Like-for-like excludes assets that were purchased, sold or under refurbishment during the two years reported.
– Normalisation: A kgCO2e/m2 is reported for assets within the like-for-like portfolio. The numerator is landlord-managed GHG emissions from energyconsumption and the denominator is net lettable floor area (m2).
48WELPUT
Unaudited Environmental Data Report continued
Water
The table below sets out water consumption for assets managed by WELPUT.
Total water Like-for-likeconsumption water consumption Intensity
Mixed Use 20,992 22,402 11,262 10,565 7% 0.77 0.82
Coverage 2 2 1 1
Total 55,178 51,838 33,923 34,110 (1%)
Coverage 7 8 4 4
– Consumption data relates to the managed portfolio only:
– Offices and mixed use: Whole building
– Like-for-like excludes assets that were purchased, sold or under refurbishment during the two years reported.
– Normalisation: A m3/m2 is reported for assets within the like-for-like portfolio. The numerator is landlord-managed water consumption and thedenominator is net lettable floor area (m2).
– Coverage relates to number of managed assets for which data is reported.
Annual Report and Audited Financial Statementsfor the year ended 30 September 2017 49
Fin
an
cia
l S
tate
me
nts
Unaudited Environmental Data Report continued
Waste
The table below sets out waste managed by WELPUT by disposal route and sector.
Absolute tonnes Like for like tonnes––––––––––––––––––––––––––––––– –––––––––––––––––––––––––––––––
Sector 2016/2017 2015/2016 2016/2017 2015/2016
Tonnes % Tonnes % Tonnes % Tonnes % Change
Office
Direct to MRF 350 79% 158 63% 13 100% 13 100% –
Incineration with energy recovery(including anaerobic digestion) 93 21% 92 37% – – – – –
Incineration with energy recovery(including anaerobic digestion) 149 21% 178 39% – – – – –
Landfill – – – – – – – – –
Coverage 8 8 1
– Like-for-like excludes assets that were purchased, sold or under refurbishment during the two years reported.
– Like-for-like also excludes assets where there was a significant change in the scope of the data reported. This affected multiple assets during theperiod and resulted in there being just one asset available for like for like analysis.
– MRF is a Materials Recovery Facility
– Coverage relates to number of managed assets for which data is reported.
50WELPUT
Unaudited Environmental Data Report continued
Sustainability Certification: BREEAM
Portfolio byRating floor area (%)–––––––––––––––––––– ––––––––––––––
BREEAM – Excellent 10%
Coverage 1
– Sustainability certification records for the Company are provided asat July 2017 against portfolio floor area.
Sustainability Certification: Energy PerformanceCertificates
Energy Performance Portfolio byCertificate Rating floor area (%)–––––––––––––––––––– ––––––––––––––
A N/A
B 5%
C 74%
D 20%
E 1%
F 0%
G N/A
Exempt 0%
Coverage 100%
-– Energy Performance Certificate records for the Company areprovided as at July 2017 against portfolio floor area.
Annual Report and Audited Financial Statementsfor the year ended 30 September 2017 51
Fin
an
cia
l S
tate
me
nts
Unaudited General Information
Fund Summary
WELPUT is a collective investment scheme within themeaning of Section 235 of the Financial Services and MarketsAct 2000 (FSMA). WELPUT is not an authorised unit trustscheme, OEIC or recognised scheme within the meaning ofthe FSMA and therefore constitutes an unregulated collectiveinvestment scheme. As an unregulated collective investmentscheme, the distribution and promotion of units arerestricted, for the purposes of Sections 21 and 238 of theFSMA, to persons who are themselves authorised under theFSMA or who otherwise fall within the categories orexceptions made under Sections 21 and 238.
Accordingly, this material is directed at market counterpartiesand authorised persons; intermediate customers; existinginvestors in WELPUT and/or a substantially similar fund; andclients and newly accepted clients of the Schroder Groupwhere reasonable steps have been taken to ensure thatinvestment in WELPUT is suitable. This material should not berelied upon by persons of any other description.
Liquidity
WELPUT invests in real estate, the value of which is generallya matter of a valuer’s opinion. There is no recognised marketfor Units in WELPUT and an investment is not readilyrealisable. It may be difficult to trade in the Units or to sellthem at a reasonable price. The price of Units and theincome from them may fluctuate upwards or downwards andcannot be guaranteed.
Socially Responsible Investment andSustainability
Responsible Real Estate Investment (RREI) is at the heart ofSchroder Real Estate’s investment philosophy. We believethat a successful responsible investment programme shoulddeliver enhanced returns to investors, improved businessperformance to tenants and tangible benefits to localcommunities and wider society. A copy of Schroders RREIPolicy can be found at www.schroders.com/realestate. Pleaserefer to the Governance Report for further details.
Purchase of Units
Units can be purchased in WELPUT through the primary orsecondary market. The maximum number of Units that canbe issued in any 12 month period is equivalent to 30% of theaggregate Units in issue at the start of the relevant period.
An application to subscribe for Units in WELPUT is made bycompleting a Subscription Agreement for Units and sendingit to the Registrar with all other necessary information anddocumentation on the second last Business Day of a calendarmonth. A Subscription Agreement is available upon requestfrom the Manager or Registrar and accepted by the Registraron the last Business Day of each relevant calendar month.Units will normally be issued at the Offer Price, however, theManager may issue new Units at below Offer Price subject tothe consent of Holders by Extraordinary Resolution. Pleaserefer to Section 3 of WELPUT’s Prospectus for furtherinformation relating to the purchase of Units.
Redemption of Units
During the period 1 September to 30 September each yearany Holder may request the redemption of all or part of itsholding of Units by submission of a redemption notice to theManager. The Manager uses reasonable endeavours eitherto redeem the Holder’s Units or, at the Manager’s discretion,arrange a transfer of the Units to another Holder or a thirdparty. The Manager has until the penultimate Business Day inJune the following the year to fulfil its redemption obligationseither through the management of trust assets or transfer ofthe units at a pre-agreed price.
The maximum aggregate number of units that can beaccepted for redemption during any Redemption NoticePeriod is:
10% of the total units in issue at the end of the relevantRedemption Notice Period except with the consent ofHolders by Extraordinary Resolution; or at the absolutediscretion of the Manager, 15% of the total units in issue atthe end of the relevant Redemption Notice Period providedthis will not prejudice the interests of remaining Holders.
Please refer to Section 3 of WELPUT’s Prospectus for furtherinformation pertaining to issuance and redemption of units.
Secondary market
Holders have the right to transfer units subject to a priceagreed between the seller and the buyer. There is no formalsecondary market upon which units are traded with tradescompleted between individual parties or through a broker. Inall instances both the buyer and vendor of WELPUT’s unitsare required to submit completed Secondary Market Formsto the Registrar. Please contact Schroder Real EstateInvestment Management Limited for further information.
Value of Units (£m) traded
0 50 100 150 200 250
2015
YTD 2017
2014
2013
2012
2011
2010
2009
2008
2007
240.8
70.5
84.8
2016 161.1
106.3
24.3
32.7
94.1
33.2
56.2
97.3
52WELPUT
Unaudited General Information continued
Distributions
Full distributions of net operating income are made aftermaking reasonable provision for fees, costs and charges.Expenses will be made out of WELPUT in respect of eachmonthly period. Distributions will be paid on the lastbusiness day of the month, subject to the Manager invokingclause 14.1.b (ii) of the Trust Instrument, whereby part ofeach monthly distribution is carried forward and paid on adeferred basis.
Deferral of Income Distributions
In calculating the distributions to be made to Holders, theManager is entitled to disregard any income which has beenaccrued in accordance with general accounting principles butnot yet actually received by WELPUT. Any amount which inthe opinion of the Manager cannot be conveniently orequitably distributed in respect of the relevant DistributionPeriod may also be deferred to a future Distribution Date.Income distributions may also be restricted under the termsof WELPUT’s financing arrangements.
Manager fees
Details of fees and expenses incurred by WELPUT are set outwithin Section 5 of the Trust Prospectus and further in notes15(b) and 15(c) of the Annual Report and Audited FinancialStatements.
The Manager is entitled to receive a fee equivalent to:
0.49% of Net Asset Value (where the Net Asset Value is lessthan or equal to £480.5 million)
0.42% per annum of the Net Asset Value (where the NetAsset Value is greater than £480.5 million but less than orequal to £873.7 million)
0.35% per annum of the Net Asset Value (where the NetAsset Value is greater than £873.7 million).
The Manager’s fee is payable quarterly in arrears.
Property Adviser fees
The Property Adviser is entitled to receive a fee equivalent to:
0.21% per annum of the Net Asset Value (where the NetAsset Value is less than or equal to £480.5 million);
0.28% per annum of the Net Asset Value (in respect of thatpart of the Net Asset Value, if any, that is greater than£480.5 million but less than or equal to £873.7 million);
0.35% per annum of the Net Asset Value (in respect of thatpart of the Net Asset Value, if any, that is in excess of£873.7 million).
The Property Adviser’s fee is payable quarterly in arrears.
Trustees fees
The Trustees are entitled to receive a fee equivalent to0.0075% of the Net Asset Value per annum (plus VAT) or a
minimum of £15,000 per annum. The fee is paid quarterly inarrears.
Performance fee
Both the Manager and the Property Adviser may also beentitled to receive performance-related fees. Theperformance fee is calculated by reference to theperformance of WELPUT and the real estate portfolio andtakes into account changes to the MSCI Benchmark andextension to the investible area which came into effect on1 October 2014.
In respect of each Performance Fee Payment Period theManager’s and Property Adviser’s entitlement toPerformance Fees is subject to the following conditions:
– The Portfolio Return is equal to or greater than the totalreturn of the MSCI Benchmark during the relevantPerformance Period;
– The Trust Return is greater than the annualised totalreturn for the MSCI Benchmark during the relevantPerformance Period plus 1%; and
– The Trust Return is positive.
Full details are contained in section 5 of WELPUT’sProspectus.
Preferential terms and fee rebates
The management fee is applied at the same rate to allHolders and no rebates of this fee have been agreed withany Holder.
In relation to WELPUT’s performance fee, a concession wasapplied to the units owned by Holders on 2 June 2010 whenthe term of WELPUT was extended by a further 10 years.Under this arrangement, a full rebate equivalent to theperformance fee Reserve Account Debit amount waived atthat time was attached to all units so long as they wereowned by the same Holder. Any transfer or cancellation ofthose units nullifies the rebate. At 30 September 2017329,470.5314 units (30.0% of all units) remain subject to thisrebate.
Valuers fee
The Valuer is paid a quarterly fee equivalent to 0.00525multiplied by 1% of the average of the Market Value of theProperties as determined by the Valuations in such quarter(but excluding any additional Property acquired by WELPUTduring that quarter).
Insurance and service charge rebates
The managing agents, as employed by the Property Adviser,receive service charge remuneration as part of their overallremuneration. Insurance commission rebates (if any) arecalculated on an annual basis and distributed to tenants andholders as applicable.
Annual Report and Audited Financial Statementsfor the year ended 30 September 2017 53
Fin
an
cia
l S
tate
me
nts
Unaudited General Information continued
Fees payable to Manager affiliates andProperty Adviser
During the past year, Schroder Real Estate InvestmentManagement Limited (SREIM, an affiliate of the Manager)and Grafton Advisors (2006) LLP (the Property Adviser) havebeen entitled to receive £139,269 commission respectively inrelation to secondary market transfers completed by GFIBrokers Limited.
Placement agent
Schroders is responsible for marketing WELPUT and in theperformance of its duties the Manager may appointplacement agents to assist with matching redemption unitsand raising additional capital. Associated fees will not becharged to redeeming investors or WELPUT. The placementagreement with CBRE Capital Advisors was terminatedduring the year and at 30 September 2017 there were noagreements in place with placement agents.
Bid, offer and redemption pricing
WELPUT’s bid and offer prices are calculated monthly, in linewith the frequency of WELPUT’s valuations. The offer pricetakes into account the cost of acquiring the existing portfolioas well as new property, and makes an allowance for forecastcapital expenditure. The bid price takes into account thenormal costs associated with disposing of the portfolio andunamortised debt costs.
The redemption price will be provided when redemptionrequests have been received and, in addition to the factorsconsidered when calculating the bid price, includes all debtretirement costs and costs associated with the winding up ofWELPUT.
New investors are able to acquire redemption units from theManager at the redemption unit offer price. This is calculatedby reference to the bid price and may include an allowancefor placement agents’ fees.
Valuation and pricing policy
A detailed explanation of our pricing methodology iscontained within the Prospectus and further information isavailable upon request from the Manager. WELPUT’sProspectus, along with the notes to the financial statements,sets out the methodology used to value the properties andother investments of WELPUT and the valuation of directproperties having to be undertaken monthly.
Holders Advisory Committee
The Holders Advisory Committee is constituted with not morethan five members, including four members who representeach of the largest four Holders in WELPUT. Those personswho represent the largest four Holders in WELPUT areentitled to nominate, if they so wish, a person to be amember of the Holders Advisory Committee, failing whichthe right to nominate a member passes to the next largestHolder (a “Holder Member”).
There may be one member who is elected by OrdinaryResolution (by reference to the votes of those Holders whohave not nominated a Holder Member) to the HoldersAdvisory Committee to represent Holders who are notrepresented by virtue of being one of the largest fourHolders (the Elected Member). An Elected Member isappointed for two Accounting Periods. The replacement (orreappointment) of the Elected Member shall be approved byOrdinary Resolution before the last Business Day of therelevant Accounting Period. Nominations for the ElectedMember are to be received by the Manager at least 40Business Days before the last Business Day of the relevantAccounting Period in which the vote is to be taken.Nominations can be made by any Holder. The ElectedMember may be a discretionary manager or adviser of aHolder.
The Holders Advisory Committee has no right or power tomake any decisions in relation to individual investments, noright to direct or participate in the management of WELPUTor the Properties or any other assets of WELPUT or in theoperation of WELPUT, but it may comment to the Trusteesand the Manager and will be consulted on the conduct of theinvestment objects of WELPUT, including but not limited tothe following:
(a) any proposed change to the limits on the investmentobjects of WELPUT;
(b) the annual business plan of WELPUT (including individualasset plans, target leverage level, liquidity management planand the soft target for non-income producing property); and
(c) matters where there are considered to be conflicts ofinterest.
Minutes of the meeting will be circulated to all Holders aftereach meeting.
Co-investment
There are no express terms in the trust instrumentconcerning Holders’ rights over co-investments. However, theManager’s policy is to treat all Holders fairly and at itsdiscretion, it may offer Holders the opportunity to participatein co-investments in proportion to their holding in WELPUT.
Expense Ratios (as defined by AREF Codeof Practice)
Fees and expenses table % NAV
(A) Fund Management Fees 0.74%
(B) Fund Operating Fees 0.19%
(C) Total Expense Ratio (A + B) 0.93%
(D) Property Expense Ratio 0.26%
(E) Real Estate Expense Ratio (C + D) 1.19%
(F) Transaction Costs1 0.12%
(G) Performance Fees N/A1Transaction costs associated with the sale of St James Square Unit Trust
54WELPUT
Unaudited General Information continued
AREF Code of Practice
WELPUT is a member of the Association of Real Estate Funds(AREF). The aim of the Code of Practice is to achieve highstandards of transparency across the unlisted sector andpromote consistency of reporting to allow investors tocompare different funds. WELPUT completes the AREF/MSCIPooled Property Questionnaire each quarter, which is madeavailable to all investors and which forms the basis of itsentry in MSCI Property Fund Vision handbook. WELPUT’spage on the AREF website can be found athttp://www.aref.org.uk/funds/ west-end-london-property-unit-trust.
The Manager believes that these Report and FinancialStatements, together with the supporting documentsreferred to herein, are in compliance with the AREF Code ofPractice.
Taxation and reporting fund regime
Investors and potential investors should refer to WELPUT’sProspectus for detailed consideration of the taxation issuesthat are applicable to WELPUT and its holders. WELPUTmakes no provisions for taxation, and each unitholder is,therefore, responsible for their own taxation treatment bothin the United Kingdom and in the country in which theyreside on distributions from WELPUT as disclosed in thenotes to these Financial Statements.
Income (less expenses properly incurred) arising directlyfrom the properties, whether it is distributed or not, will beliable to UK income tax or corporation tax in the hands of theHolders, regardless of where they are resident.
WELPUT is treated as a transparent non-reporting fund inaccordance with Offshore Funds (Tax) Regulations 2009.
Capital Gains Tax
In the UK Budget of 22 November 2017, a public consultationwas announced on new legislation which is likely to beintroduced in April 2019. This relates to non-UK residentinvestors which may become subject to capital gains tax (orcorporation tax on chargeable gains for investors which arenon-UK companies) on disposals of all UK property. Thelegislation is expected to relate to the disposals of interests indirectly owned real estate as well as real estate vehicles inwhich the seller’s interest has exceeded 25% at any time inthe preceding five years.
Schroders is assessing the impact of this proposed legislationon WELPUT. Investors should take advice from theirprofessional advisers.
Trust documentation
A copy of all Trust documentation including the prospectusand regular reports is available from the upon request.
A copy of Schroders Audit & Assurance Faculty (AAF) internalcontrols report which has been externally audited is availablefrom the Manager upon request.
Conflicts of interest
The Manager is responsible for identifying all conflicts ofinterest and for referring such matters to Schroder GroupCompliance or such other parties in accordance with theGroup’s conflict of interest policy.
Key Persons
Ker Gilchrist is named Key Person in the Property Adviser’sAgreement.
The notes set out above are merely intended as an aide-memoire. For any matters requiring detailed consideration,reference should be made to the relevant Trust Instrument.
*Regulated by the Jersey Financial Services Commission.
Schroder Real Estate Managers (Jersey) LimitedPO Box 490, 40 Esplanade, St Helier, Jersey, JE4 9WBTel: +44 (0) 1534 756 640