2013-2014 HCEA Job Satisfaction Survey 1 OVERVIEW MORALE IN THE ERA OF EDUCATION REFORM In a well-documented national trend, educator morale is falling; sadly, this is true even in Howard County. Agreement with the statement “Overall, morale in my school/work site is good” was only 59%, down from 68% last year. Dramatically increased workload related to the Race To The Top evaluation system is contributing to a decline in morale (73%, up twenty points from the 2011 level of 53%). There is a steep decline in the perception that respondents’ work is evaluated fairly (72%, down from 88%). A majority of respondents say their professional development experiences are not meaningful and worthwhile (46%, down from 53%). Less than one-quarter believes they are paid fairly (23%, down from 52%). Sixty-nine percent say there is too much instructional time spent on administering assessments (up from 59%), and only 41% say they have adequate time during the workday to plan, prepare, and do the job (down from 55%). Still, respondents (81%) feel successful in their work, though there is a marked decline in this attitude from the previous year’s 89%. Like last year, 90% of respondents agree administrators respect their negotiated contracts. They believe their environment is conducive to success (80%) and are treated as professionals (82%) at their schools. Most respondents agree Howard County Public School System (HCPSS) offer the possibility of opportunities for advancement (67%, down from 73%) and provides appropriate support and training (71%, down from 79%). Most respondents (76%) agree administrators/ supervisors support them in enforcing discipline, their planning time is respected by administrators/supervisors (78%, down from 83%), and they have adequate work and storage space to prepare and do their jobs (80%). There is good teamwork among school-based staff (78%), non-instructional duties are equitably assigned (72%, down from 78%), there is open communication and trust (68%), and respondents say they can speak openly about important issues at their school without fear of repercussions (66%). LEADERSHIP CRISIS Confidence in the Superintendent has fallen precipitously (46%, down from 74%), and hit historic lows for the Howard County Board of Education (28%, down from 60%). CONFIDENCE IN HCEA The vast majority of respondents (89%, for two consecutive years, and up five points from 84% in 2011) are confident in the leadership exhibited by the Howard County Education Association. Notably, even non- union respondents have confidence (74%) in the Association. HARASSMENT
Transcript
2013-2014 HCEA Job Satisfaction Survey
1
OVERVIEW
MORALE IN THE ERA OF EDUCATION REFORM
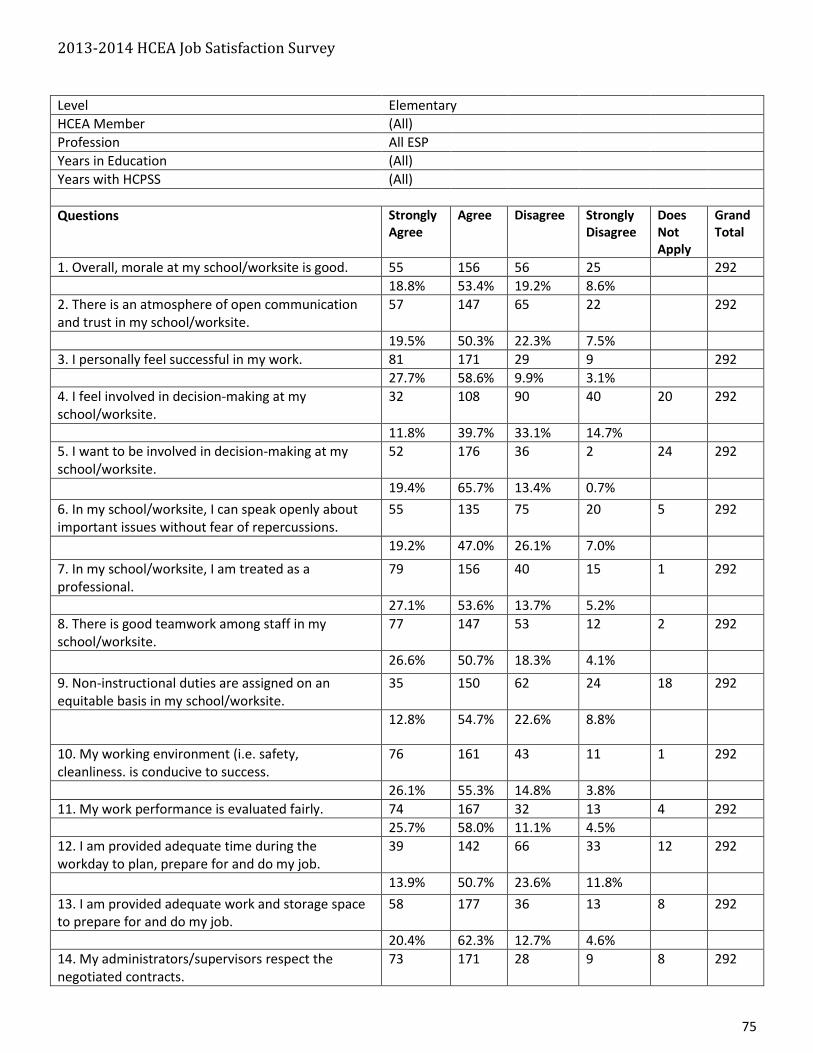
In a well-documented national trend, educator morale is falling; sadly, this is true even in Howard County.
Agreement with the statement “Overall, morale in my school/work site is good” was only 59%, down from
68% last year. Dramatically increased workload related to the Race To The Top evaluation system is
contributing to a decline in morale (73%, up twenty points from the 2011 level of 53%). There is a steep
decline in the perception that respondents’ work is evaluated fairly (72%, down from 88%).
A majority of respondents say their professional development experiences are not meaningful and
worthwhile (46%, down from 53%). Less than one-quarter believes they are paid fairly (23%, down from
52%). Sixty-nine percent say there is too much instructional time spent on administering assessments (up
from 59%), and only 41% say they have adequate time during the workday to plan, prepare, and do the job
(down from 55%).
Still, respondents (81%) feel successful in their work, though there is a marked decline in this attitude from
the previous year’s 89%. Like last year, 90% of respondents agree administrators respect their negotiated
contracts. They believe their environment is conducive to success (80%) and are treated as professionals
(82%) at their schools.
Most respondents agree Howard County Public School System (HCPSS) offer the possibility of opportunities
for advancement (67%, down from 73%) and provides appropriate support and training (71%, down from
79%). Most respondents (76%) agree administrators/ supervisors support them in enforcing discipline,
their planning time is respected by administrators/supervisors (78%, down from 83%), and they have
adequate work and storage space to prepare and do their jobs (80%). There is good teamwork among
school-based staff (78%), non-instructional duties are equitably assigned (72%, down from 78%), there is
open communication and trust (68%), and respondents say they can speak openly about important issues
at their school without fear of repercussions (66%).
LEADERSHIP CRISIS
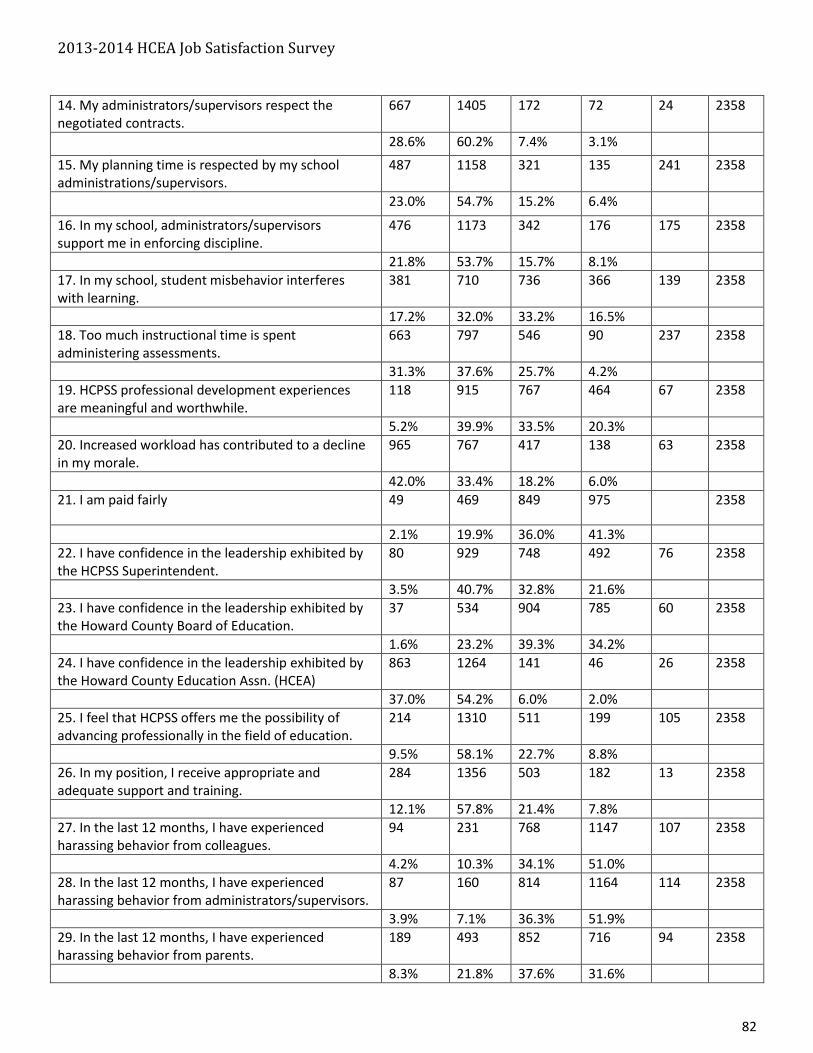
Confidence in the Superintendent has fallen precipitously (46%, down from 74%), and hit historic lows for
the Howard County Board of Education (28%, down from 60%).
CONFIDENCE IN HCEA
The vast majority of respondents (89%, for two consecutive years, and up five points from 84% in 2011) are
confident in the leadership exhibited by the Howard County Education Association. Notably, even non-
union respondents have confidence (74%) in the Association.
HARASSMENT
2013-2014 HCEA Job Satisfaction Survey
2
In the last 12 months, 29% of respondents experienced harassing behavior from parents, 14% of
respondents experienced harassing behavior from colleagues, and 11% of respondents experienced
harassing behavior from administrators/supervisors. These numbers are largely unchanged from the
previous survey.
NOTES
The HCEA Job Satisfaction Survey is a long-standing and highly regarded service provided to the
Association’s members and the Howard County community annually since the early 1990’s. Almost 2700
HCPSS employees participated in 2013-14. The survey is always conducted by an independent firm and
runs from the beginning of the second semester in January to late February. In order for employees to
have detailed information in the voluntary transfer process, survey results are released prior to April 1st.
2013-2014 HCEA Job Satisfaction Survey
3
1) Overall, morale at my school/worksite is good
Work Site Strongly Agree
Agree Does Not Apply
Disagree Strongly Disagree
Grand Total
% AGREE
% DISAGREE
Elementary 185 657 296 156 1294 65.1 34.9
West Friendship ES 8 7 15 100.0 0.0
Phelps Luck ES 15 13 1 29 96.6 3.4
Atholton ES 6 15 1 22 95.5 4.5
Worthington ES 10 16 1 1 28 92.9 7.1
Running Brook ES 6 15 1 1 23 91.3 8.7
Dayton Oaks ES 11 19 3 33 90.9 9.1
Cradlerock ES 4 20 3 27 88.9 11.1
Ducketts Lane ES 5 11 2 18 88.9 11.1
Triadelphia Ridge ES 3 28 5 36 86.1 13.9
Lisbon ES 5 19 4 28 85.7 14.3
Laurel Woods ES 4 21 4 1 30 83.3 16.7
Northfield ES 9 15 4 1 29 82.8 17.2
Stevens Forest ES 5 16 5 26 80.8 19.2
Veterans ES 6 24 7 1 38 78.9 21.1
Deep Run ES 4 33 8 2 47 78.7 21.3
Hammond ES 8 10 5 23 78.3 21.7
Gorman Crossing ES 4 22 4 4 34 76.5 23.5
Bryant Woods ES 6 13 5 2 26 73.1 26.9
Bellows Spring ES 8 41 10 9 68 72.1 27.9
Jeffers Hill ES 2 14 4 3 23 69.6 30.4
Waterloo ES 4 31 12 4 51 68.6 31.4
Forest Ridge ES 2 19 10 31 67.7 32.3
Guilford ES 4 11 6 3 24 62.5 37.5
Longfellow ES 4 9 7 1 21 61.9 38.1
Rockburn ES 2 18 9 4 33 60.6 39.4
Bollman Bridge ES 4 19 10 5 38 60.5 39.5
Manor Woods ES 7 12 8 5 32 59.4 40.6
Pointers Run ES 3 11 9 1 24 58.3 41.7
Talbott Springs ES 2 18 13 2 35 57.1 42.9
Clarksville ES 1 12 6 4 23 56.5 43.5
Ilchester ES 3 17 10 6 36 55.6 44.4
Fulton ES 4 13 10 5 32 53.1 46.9
Hollifield Station ES 3 17 13 6 39 51.3 48.7
Clemens Crossing ES 2 11 11 4 28 46.4 53.6
Waverly ES 17 14 12 43 39.5 60.5
Elkridge ES 1 8 11 3 23 39.1 60.9
Swansfield ES 3 14 15 16 48 35.4 64.6
Thunder Hill ES 3 9 11 12 35 34.3 65.7
Bushy Park ES 1 8 11 9 29 31.0 69.0
St. John's Lane ES 2 5 13 8 28 25.0 75.0
Centennial Lane ES 1 6 10 21 38 18.4 81.6
2013-2014 HCEA Job Satisfaction Survey
4
Work Site Strongly Agree
Agree Does Not Apply
Disagree Strongly Disagree
Grand Total
% AGREE
% DISAGREE
Middle 43 271 149 111 576 54.5 45.1
Harper's Choice MS 1 30 4 35 88.6 11.4
Murray Hill MS 7 29 6 3 45 80.0 20.0
Dunloggin MS 4 20 8 32 75.0 25.0
Patapsco MS 7 16 4 5 32 71.9 28.1
Burleigh Manor MS 4 16 7 28 71.4 25.0
Oakland Mills MS 3 15 7 4 29 62.1 37.9
Mount View MS 2 12 7 3 24 58.3 41.7
Bonnie Branch MS 3 16 8 7 34 55.9 44.1
Folly Quarter MS 3 17 13 4 37 54.1 45.9
Mayfield Woods MS 2 15 12 3 32 53.1 46.9
Hammond MS 12 3 9 24 50.0 50.0
Lime Kiln MS 3 8 8 2 22 50.0 45.5
Elkridge Landing MS 2 12 8 9 31 45.2 54.8
Wilde Lake MS 12 11 4 27 44.4 55.6
Ellicott Mills MS 10 7 8 25 40.0 60.0
Lake Elkhorn MS 1 11 9 14 35 34.3 65.7
Patuxent Valley MS 1 6 5 11 23 30.4 69.6
Clarksville MS 8 11 13 32 25.0 75.0
Glenwood MS 6 11 12 29 20.7 79.3
High 55 309 1 182 135 682 53.5 46.5
Mt. Hebron HS 12 23 5 3 43 81.4 18.6
Reservoir HS 15 43 12 6 76 76.3 23.7
Hammond HS 4 34 14 3 55 69.1 30.9
Centennial HS 7 41 1 14 10 73 66.7 33.3
Glenelg HS 2 21 9 3 35 65.7 34.3
Atholton HS 1 21 6 11 39 56.4 43.6
Howard HS 3 36 21 11 71 54.9 45.1
Wilde Lake HS 4 22 16 6 48 54.2 45.8
Marriotts Ridge HS 5 17 14 20 56 39.3 60.7
Oakland Mills HS 1 22 28 19 70 32.9 67.1
River Hill HS 1 16 24 19 60 28.3 71.7
Long Reach HS 13 19 24 56 23.2 76.8
Special 15 69 1 36 25 146 57.9 42.1
ARL 5 10 3 2 20 75.0 25.0
Ascend One 6 2 8 75.0 25.0
Cedar Lane 11 6 3 20 55.0 45.0
Central Office 5 15 10 16 46 43.5 56.5
Health Services 4 9 1 7 3 24 56.5 43.5
Homewood Center 1 12 7 20 65.0 35.0
Old Cedar Lane 6 1 1 8 75.0 25.0
Grand Total 298 1306 2 663 427 2698 59.5 40.4
2013-2014 HCEA Job Satisfaction Survey
5
2) There is an atmosphere of open communication and trust in my school/worksite.
Work Site Strongly Agree
Agree Does Not Apply
Disagree Strongly Disagree
Grand Total
% AGREE
% DISAGREE
Elementary 224 718 1 256 91 1294 72.9 26.8
Manor Woods ES 7 25 32 100.0 0.0
Phelps Luck ES 14 14 1 29 96.6 3.4
Lisbon ES 7 20 1 28 96.4 3.6
Running Brook ES 8 14 1 23 95.7 4.3
Atholton ES 6 15 1 22 95.5 4.5
West Friendship ES 8 6 1 15 93.3 6.7
Northfield ES 9 18 1 1 29 93.1 6.9
Worthington ES 10 16 1 1 28 92.9 7.1
Hammond ES 11 10 2 23 91.3 8.7
Ducketts Lane ES 2 14 2 18 88.9 11.1
Triadelphia Ridge ES 6 26 3 1 36 88.9 11.1
Dayton Oaks ES 13 16 4 33 87.9 12.1
Veterans ES 4 29 4 1 38 86.8 13.2
Cradlerock ES 3 20 4 27 85.2 14.8
Deep Run ES 9 28 7 3 47 78.7 21.3
Hollifield Station ES 9 21 8 1 39 76.9 23.1
Stevens Forest ES 4 16 6 26 76.9 23.1
Laurel Woods ES 4 19 6 1 30 76.7 23.3
Pointers Run ES 4 14 6 24 75.0 25.0
Waterloo ES 6 32 8 5 51 74.5 25.5
Forest Ridge ES 3 20 7 1 31 74.2 25.8
Rockburn ES 3 21 7 2 33 72.7 27.3
Ilchester ES 5 21 9 1 36 72.2 27.8
Guilford ES 4 13 5 2 24 70.8 29.2
Bellows Spring ES 13 35 14 6 68 70.6 29.4
Gorman Crossing ES 9 15 5 5 34 70.6 29.4
Thunder Hill ES 5 19 1 7 3 35 70.6 29.4
Bushy Park ES 2 18 8 1 29 69.0 31.0
Talbott Springs ES 3 21 10 1 35 68.6 31.4
Clarksville ES 2 12 5 3 23 60.9 34.8
Jeffers Hill ES 3 11 7 2 23 60.9 39.1
Bollman Bridge ES 6 17 10 4 38 60.5 36.8
Fulton ES 4 15 10 3 32 59.4 40.6
Bryant Woods ES 6 9 8 3 26 57.7 42.3
Clemens Crossing ES 4 12 7 5 28 57.1 42.9
Longfellow ES 2 10 4 4 21 57.1 38.1
Elkridge ES 1 12 9 1 23 56.5 43.5
Waverly ES 2 21 13 6 43 53.5 44.2
Centennial Lane ES 1 17 12 8 38 47.4 52.6
Swansfield ES 21 15 12 48 43.8 56.3
St. John's Lane ES 2 5 18 3 28 25.0 75.0
2013-2014 HCEA Job Satisfaction Survey
6
Work Site Strongly Agree
Agree Does Not Apply
Disagree Strongly Disagree
Grand Total
% AGREE
% DISAGREE
Middle 51 336 1 136 50 576 67.3 32.3
Murray Hill MS 11 28 1 3 2 45 88.6 11.4
Bonnie Branch MS 4 26 3 1 34 88.2 11.8
Burleigh Manor MS 3 21 4 28 85.7 14.3
Lime Kiln MS 2 16 4 22 81.8 18.2
Folly Quarter MS 5 24 7 1 37 78.4 21.6
Harper's Choice MS 1 25 9 35 74.3 25.7
Ellicott Mills MS 2 16 6 1 25 72.0 28.0
Dunloggin MS 3 20 8 1 32 71.9 28.1
Mayfield Woods MS 2 21 5 4 32 71.9 28.1
Patapsco MS 3 20 6 3 32 71.9 28.1
Lake Elkhorn MS 4 20 9 1 35 68.6 28.6
Elkridge Landing MS 3 18 9 1 31 67.7 32.3
Hammond MS 2 13 4 5 24 62.5 37.5
Wilde Lake MS 1 14 11 1 27 55.6 44.4
Oakland Mills MS 2 14 9 4 29 55.2 44.8
Mount View MS 1 11 9 2 24 50.0 45.8
Patuxent Valley MS 2 8 6 7 23 43.5 56.5
Clarksville MS 12 12 8 32 37.5 62.5
Glenwood MS 9 12 8 29 31.0 69.0
High 61 345 3 175 94 682 59.8 39.6
Mt. Hebron HS 11 29 2 1 43 93.0 7.0
Glenelg HS 3 25 3 4 35 80.0 20.0
Centennial HS 14 43 1 12 3 73 79.2 20.8
Hammond HS 5 36 1 9 3 55 75.9 22.2
Reservoir HS 10 37 21 6 76 61.8 35.5
Atholton HS 2 22 8 6 39 61.5 35.9
Oakland Mills HS 1 37 1 21 10 70 55.1 44.9
Wilde Lake HS 3 23 13 9 48 54.2 45.8
Marriotts Ridge HS 3 25 22 6 56 50.0 50.0
Howard HS 5 28 24 14 71 46.5 53.5
River Hill HS 4 22 23 11 60 43.3 56.7
Long Reach HS 18 17 21 56 32.1 67.9
Special 13 70 37 25 146 56.8 42.5
ARL 2 13 3 2 20 75.0 25.0
Ascend One 2 5 1 8 87.5 12.5
Cedar Lane 9 7 4 20 45.0 55.0
Central Office 6 14 10 16 46 43.5 56.5
Health Services 12 9 3 24 50.0 50.0
Homewood Center 3 12 5 20 75.0 25.0
Old Cedar Lane 5 2 8 62.5 25.0
Grand Total 349 1469 5 604 260 2698 67.5 32.1
2013-2014 HCEA Job Satisfaction Survey
7
3) I personally feel successful in my work.
Work Site Strongly Agree
Agree Does Not Apply
Disagree Strongly Disagree
Grand Total
% AGREE
% DISAGREE
Elementary 327 740 174 41 1294 82.5 16.6
Lisbon ES 9 18 1 28 96.4 3.6
Running Brook ES 5 17 1 23 95.7 4.3
Dayton Oaks ES 16 15 2 33 93.9 6.1
Forest Ridge ES 3 26 2 31 93.5 6.5
West Friendship ES 10 4 1 15 93.3 6.7
Bryant Woods ES 14 10 2 26 92.3 7.7
Triadelphia Ridge ES 9 24 2 36 91.7 5.6
Atholton ES 9 11 2 22 90.9 9.1
Hollifield Station ES 12 23 4 39 89.7 10.3
Clemens Crossing ES 10 15 3 28 89.3 10.7
Ducketts Lane ES 2 14 1 18 88.9 5.6
Talbott Springs ES 12 19 3 35 88.6 8.6
Deep Run ES 14 27 3 3 47 87.2 12.8
Clarksville ES 8 12 3 23 87.0 13.0
Ilchester ES 7 24 3 1 36 86.1 11.1
Longfellow ES 3 15 3 21 85.7 14.3
Fulton ES 5 22 4 1 32 84.4 15.6
Veterans ES 6 26 4 1 38 84.2 13.2
Guilford ES 6 14 2 1 24 83.3 12.5
Laurel Woods ES 9 16 3 1 30 83.3 13.3
Phelps Luck ES 10 14 5 29 82.8 17.2
Hammond ES 7 12 3 1 23 82.6 17.4
Gorman Crossing ES 8 20 2 2 34 82.4 11.8
Worthington ES 10 13 5 28 82.1 17.9
Cradlerock ES 5 17 3 1 27 81.5 14.8
Manor Woods ES 12 14 4 2 32 81.3 18.8
Bellows Spring ES 18 37 11 2 68 80.9 19.1
Stevens Forest ES 8 13 4 1 26 80.8 19.2
Northfield ES 8 15 4 1 29 79.3 17.2
Swansfield ES 6 32 8 2 48 79.2 20.8
Bollman Bridge ES 10 20 8 38 78.9 21.1
Rockburn ES 5 21 5 2 33 78.8 21.2
Elkridge ES 2 16 5 23 78.3 21.7
Waterloo ES 11 28 9 2 51 76.5 21.6
Bushy Park ES 6 16 6 1 29 75.9 24.1
Jeffers Hill ES 5 12 6 23 73.9 26.1
Thunder Hill ES 6 19 5 5 35 71.4 28.6
Waverly ES 6 24 9 4 43 69.8 30.2
St. John's Lane ES 8 11 9 28 67.9 32.1
Pointers Run ES 4 12 7 1 24 66.7 33.3
Centennial Lane ES 3 22 8 5 38 65.8 34.2
2013-2014 HCEA Job Satisfaction Survey
8
Work Site Strongly Agree
Agree Does Not Apply
Disagree Strongly Disagree
Grand Total
% AGREE
% DISAGREE
Middle 108 326 106 33 576 75.3 24.1
Burleigh Manor MS 9 17 1 1 28 92.9 7.1
Murray Hill MS 13 25 2 4 45 84.4 13.3
Clarksville MS 7 20 4 1 32 84.4 15.6
Mayfield Woods MS 4 23 4 1 32 84.4 15.6
Patapsco MS 5 22 3 1 32 84.4 12.5
Glenwood MS 8 16 5 29 82.8 17.2
Dunloggin MS 9 17 6 32 81.3 18.8
Folly Quarter MS 9 20 8 37 78.4 21.6
Hammond MS 4 14 5 1 24 75.0 25.0
Mount View MS 3 15 6 24 75.0 25.0
Harper's Choice MS 7 19 5 4 35 74.3 25.7
Bonnie Branch MS 3 22 5 4 34 73.5 26.5
Oakland Mills MS 6 14 7 1 29 69.0 27.6
Wilde Lake MS 1 17 8 1 27 66.7 33.3
Elkridge Landing MS 7 13 10 1 31 64.5 35.5
Ellicott Mills MS 3 13 8 1 25 64.0 36.0
Lime Kiln MS 4 10 5 3 22 63.6 36.4
Lake Elkhorn MS 3 19 8 5 35 62.9 37.1
Patuxent Valley MS 3 10 6 4 23 56.5 43.5
High 176 388 83 32 682 82.7 16.9
Reservoir HS 23 47 5 1 76 92.1 7.9
River Hill HS 21 34 4 1 60 91.7 8.3
Glenelg HS 7 25 3 35 91.4 8.6
Mt. Hebron HS 13 24 6 43 86.0 14.0
Centennial HS 26 36 9 2 73 84.9 15.1
Long Reach HS 12 34 4 6 56 82.1 17.9
Howard HS 16 42 9 3 71 81.7 16.9
Atholton HS 11 20 3 5 39 79.5 20.5
Wilde Lake HS 14 24 6 4 48 79.2 20.8
Marriotts Ridge HS 10 33 12 56 76.8 21.4
Oakland Mills HS 12 40 11 6 70 74.3 24.3
Hammond HS 11 29 11 4 55 72.7 27.3
Special 33 86 1 20 6 146 82.1 17.9
ARL 6 11 2 1 20 85.0 15.0
Ascend One 2 6 8 100.0 0.0
Cedar Lane 4 14 2 20 90.0 10.0
Central Office 9 24 8 5 46 71.7 28.3
Health Services 7 11 1 5 24 78.3 21.7
Homewood Center 2 15 3 20 85.0 15.0
Old Cedar Lane 3 5 8 100.0 0.0
Grand Total 644 1540 1 383 112 2698 81.0 18.4
2013-2014 HCEA Job Satisfaction Survey
9
4) I feel involved in decision-making at my school/worksite.
Work Site Strongly Agree
Agree Does Not Apply
Disagree Strongly Disagree
Grand Total
% AGREE
% DISAGREE
Elementary 169 572 32 364 153 1294 58.7 41.0
Manor Woods ES 6 21 1 4 32 87.1 12.9
West Friendship ES 8 5 1 1 15 86.7 13.3
Lisbon ES 4 18 1 5 28 81.5 18.5
Atholton ES 4 13 1 3 1 22 81.0 19.0
Worthington ES 8 13 2 5 28 80.8 19.2
Phelps Luck ES 8 14 1 4 2 29 78.6 21.4
Hammond ES 4 14 5 23 78.3 21.7
Jeffers Hill ES 5 13 3 2 23 78.3 21.7
Dayton Oaks ES 9 16 1 7 33 78.1 21.9
Stevens Forest ES 2 17 5 2 26 73.1 26.9
Running Brook ES 4 12 1 4 2 23 72.7 27.3
Northfield ES 5 16 6 2 29 72.4 27.6
Guilford ES 7 10 6 1 24 70.8 29.2
Pointers Run ES 4 13 5 2 24 70.8 29.2
Waterloo ES 2 32 10 7 51 66.7 33.3
Hollifield Station ES 5 19 1 9 5 39 63.2 36.8
Cradlerock ES 3 14 8 2 27 63.0 37.0
Ilchester ES 3 18 2 10 3 36 61.8 38.2
Ducketts Lane ES 1 10 6 1 18 61.1 38.9
Bellows Spring ES 11 27 5 16 9 68 60.3 39.7
Rockburn ES 2 17 1 9 4 33 59.4 40.6
Triadelphia Ridge ES 4 16 2 11 3 36 58.8 41.2
Laurel Woods ES 3 14 10 3 30 56.7 43.3
Gorman Crossing ES 6 12 2 9 5 34 56.3 43.8
Veterans ES 3 16 4 11 4 38 55.9 44.1
Deep Run ES 2 22 3 12 8 47 54.5 45.5
Thunder Hill ES 6 13 14 2 35 54.3 45.7
Bryant Woods ES 7 6 2 7 4 26 54.2 45.8
Bollman Bridge ES 3 17 11 6 38 52.6 44.7
Elkridge ES 11 8 4 23 47.8 52.2
Fulton ES 1 14 11 6 32 46.9 53.1
Talbott Springs ES 4 12 16 3 35 45.7 54.3
Forest Ridge ES 3 11 14 3 31 45.2 54.8
Swansfield ES 1 20 17 9 48 43.8 54.2
Longfellow ES 4 5 5 6 21 42.9 52.4
Clarksville ES 6 3 1 9 4 23 40.9 59.1
Centennial Lane ES 1 14 1 13 9 38 40.5 59.5
Waverly ES 3 14 19 7 43 39.5 60.5
Clemens Crossing ES 3 8 8 9 28 39.3 60.7
Bushy Park ES 3 8 13 5 29 37.9 62.1
St. John's Lane ES 1 4 15 7 28 17.9 78.6
2013-2014 HCEA Job Satisfaction Survey
10
Work Site Strongly Agree
Agree Does Not Apply
Disagree Strongly Disagree
Grand Total
% AGREE
% DISAGREE
Middle 53 250 7 176 89 576 53.3 46.6
Bonnie Branch MS 2 22 7 3 34 70.6 29.4
Folly Quarter MS 5 20 7 5 37 67.6 32.4
Burleigh Manor MS 5 13 7 3 28 64.3 35.7
Dunloggin MS 5 15 8 4 32 62.5 37.5
Patapsco MS 1 19 9 3 32 62.5 37.5
Harper's Choice MS 1 20 11 3 35 60.0 40.0
Murray Hill MS 8 18 1 14 4 45 59.1 40.9
Lake Elkhorn MS 5 15 1 9 5 35 58.8 41.2
Mayfield Woods MS 2 15 1 11 3 32 54.8 45.2
Mount View MS 1 12 6 5 24 54.2 45.8
Ellicott Mills MS 2 11 11 1 25 52.0 48.0
Elkridge Landing MS 3 12 2 8 6 31 51.7 48.3
Wilde Lake MS 3 10 13 1 27 48.1 51.9
Hammond MS 3 8 5 7 24 45.8 50.0
Oakland Mills MS 3 10 8 8 29 44.8 55.2
Lime Kiln MS 1 8 1 9 3 22 42.9 57.1
Clarksville MS 11 12 9 32 34.4 65.6
Glenwood MS 3 5 1 8 12 29 28.6 71.4
Patuxent Valley MS 6 13 4 23 26.1 73.9
High 60 246 12 229 133 682 45.7 54.0
Centennial HS 11 36 3 14 9 73 67.1 32.9
Glenelg HS 3 18 1 8 5 35 61.8 38.2
Mt. Hebron HS 7 18 1 12 5 43 59.5 40.5
Hammond HS 5 26 1 17 6 55 57.4 42.6
Atholton HS 2 16 1 12 8 39 47.4 52.6
Reservoir HS 6 28 25 17 76 44.7 55.3
Wilde Lake HS 5 15 17 11 48 41.7 58.3
River Hill HS 8 16 22 13 60 40.0 58.3
Marriotts Ridge HS 5 16 1 24 9 56 38.2 60.0
Oakland Mills HS 3 23 26 18 70 37.1 62.9
Long Reach HS 2 18 1 22 13 56 36.4 63.6
Howard HS 3 16 3 30 19 71 27.9 72.1
Special 20 58 4 42 21 146 54.9 44.4
ARL 3 10 3 3 20 65.0 30.0
Ascend One 2 6 8 100.0 0.0
Cedar Lane 2 8 9 1 20 50.0 50.0
Central Office 8 11 1 14 12 46 42.2 57.8
Health Services 8 2 10 4 24 36.4 63.6
Homewood Center 5 9 1 4 1 20 73.7 26.3
Old Cedar Lane 6 2 8 75.0 25.0
Grand Total 302 1126 55 811 396 2698 54.0 45.7
2013-2014 HCEA Job Satisfaction Survey
11
5) I want to be involved in decision-making at my school/worksite.
Work Site Strongly Agree
Agree Does Not Apply
Disagree Strongly Disagree
Grand Total
% AGREE
% DISAGREE
Elementary 372 760 42 104 11 1294 90.4 9.2
Ducketts Lane ES 5 12 1 18 100.0 0.0
Phelps Luck ES 14 12 3 29 100.0 0.0
Stevens Forest ES 7 19 26 100.0 0.0
West Friendship ES 9 6 15 100.0 0.0
Northfield ES 8 20 1 29 96.6 3.4
Lisbon ES 6 21 1 28 96.4 3.6
Clemens Crossing ES 9 17 1 1 28 96.3 3.7
Worthington ES 11 14 2 1 28 96.2 3.8
St. John's Lane ES 8 17 2 1 28 96.2 3.8
Hammond ES 11 11 1 23 95.7 4.3
Running Brook ES 10 12 1 23 95.7 4.3
Atholton ES 6 15 1 22 95.5 4.5
Elkridge ES 8 13 1 1 23 95.5 4.5
Longfellow ES 5 15 1 21 95.2 4.8
Waterloo ES 13 35 3 51 94.1 5.9
Gorman Crossing ES 9 21 2 2 34 93.8 6.3
Cradlerock ES 5 19 1 2 27 92.3 7.7
Bellows Spring ES 19 40 4 5 68 92.2 7.8
Guilford ES 9 13 1 24 91.7 4.2
Veterans ES 8 25 2 3 38 91.7 8.3
Swansfield ES 13 30 1 3 1 48 91.5 8.5
Jeffers Hill ES 6 15 2 23 91.3 8.7
Laurel Woods ES 7 20 2 30 90.0 6.7
Bollman Bridge ES 9 25 3 1 38 89.5 10.5
Deep Run ES 11 30 1 5 47 89.1 10.9
Centennial Lane ES 14 17 3 2 2 38 88.6 11.4
Thunder Hill ES 13 18 3 35 88.6 8.6
Triadelphia Ridge ES 9 22 1 3 1 36 88.6 11.4
Ilchester ES 9 19 4 4 36 87.5 12.5
Dayton Oaks ES 10 17 2 4 33 87.1 12.9
Fulton ES 4 23 1 4 32 87.1 12.9
Bushy Park ES 7 18 3 1 29 86.2 13.8
Hollifield Station ES 10 21 3 5 39 86.1 13.9
Talbott Springs ES 12 17 1 4 1 35 85.3 14.7
Manor Woods ES 8 19 5 32 84.4 15.6
Rockburn ES 7 20 1 4 1 33 84.4 15.6
Forest Ridge ES 8 17 1 5 31 83.3 16.7
Pointers Run ES 7 13 4 24 83.3 16.7
Clarksville ES 9 9 1 3 1 23 81.8 18.2
Bryant Woods ES 9 10 2 4 26 79.2 16.7
Waverly ES 10 23 1 7 1 43 78.6 19.0
2013-2014 HCEA Job Satisfaction Survey
12
Worksite Strongly Agree
Agree Does Not Apply
Disagree Strongly Disagree
Grand Total
% AGREE
% DISAGREE
Middle 132 365 15 43 15 576 88.6 10.3
Elkridge Landing MS 8 23 31 100.0 0.0
Lime Kiln MS 4 17 1 22 100.0 0.0
Patuxent Valley MS 5 17 23 95.7 0.0
Harper's Choice MS 6 27 1 1 35 94.3 5.7
Glenwood MS 12 14 1 2 29 92.9 7.1
Burleigh Manor MS 5 20 1 2 28 92.6 7.4
Hammond MS 5 17 1 24 91.7 4.2
Murray Hill MS 16 21 4 3 1 45 90.2 9.8
Mayfield Woods MS 5 22 2 1 1 32 90.0 6.7
Oakland Mills MS 8 17 1 1 1 29 89.3 7.1
Folly Quarter MS 11 22 4 37 89.2 10.8
Bonnie Branch MS 5 24 1 3 1 34 87.9 12.1
Clarksville MS 8 20 2 2 32 87.5 12.5
Dunloggin MS 10 17 1 3 1 32 87.1 12.9
Lake Elkhorn MS 9 19 2 3 1 35 84.8 12.1
Ellicott Mills MS 1 20 4 25 84.0 16.0
Mount View MS 7 12 1 3 24 82.6 13.0
Patapsco MS 3 21 5 3 32 75.0 25.0
Wilde Lake MS 4 15 7 1 27 70.4 29.6
High 171 404 18 71 14 682 86.6 12.8
Mt. Hebron HS 11 29 2 1 43 97.6 2.4
Wilde Lake HS 17 27 1 3 48 93.6 6.4
Centennial HS 24 37 7 3 2 73 92.4 7.6
Hammond HS 13 35 3 3 1 55 92.3 7.7
Glenelg HS 7 24 3 35 88.6 8.6
Atholton HS 10 24 5 39 87.2 12.8
Marriotts Ridge HS 12 36 7 56 85.7 12.5
Long Reach HS 10 36 1 8 1 56 83.6 16.4
Reservoir HS 17 45 1 9 4 76 82.7 17.3
Oakland Mills HS 16 41 1 12 70 82.6 17.4
Howard HS 18 38 2 9 4 71 81.2 18.8
River Hill HS 16 32 8 2 60 80.0 16.7
Special 54 75 3 9 4 146 90.2 9.1
ARL 4 15 20 95.0 0.0
Ascend One 3 5 8 100.0 0.0
Cedar Lane 7 11 1 1 20 90.0 10.0
Central Office 22 18 1 4 1 46 88.9 11.1
Health Services 9 10 2 2 1 24 86.4 13.6
Homewood Center 4 13 2 1 20 85.0 15.0
Old Cedar Lane 5 3 8 100.0 0.0
Grand Total 729 1604 78 227 44 2698 89.0 10.3
2013-2014 HCEA Job Satisfaction Survey
13
6) In my school/worksite, I can speak openly about important issues without fear of repercussions.
Worksite Strongly Agree
Agree Does Not Apply
Disagree Strongly Disagree
Grand Total
% AGREE
% DISAGREE
Elementary 281 624 13 255 113 1294 70.6 28.7
Worthington ES 11 14 1 1 1 28 92.6 7.4
Atholton ES 6 12 2 1 1 22 90.0 10.0
Manor Woods ES 9 18 1 2 1 32 87.1 9.7
Hammond ES 7 13 3 23 87.0 13.0
Running Brook ES 11 9 2 1 23 87.0 13.0
West Friendship ES 10 3 1 1 15 86.7 13.3
Lisbon ES 11 13 3 1 28 85.7 14.3
Ducketts Lane ES 4 11 3 18 83.3 16.7
Laurel Woods ES 7 18 2 3 30 83.3 16.7
Triadelphia Ridge ES 4 26 4 1 36 83.3 13.9
Phelps Luck ES 14 10 3 29 82.8 10.3
Veterans ES 5 26 5 2 38 81.6 18.4
Ilchester ES 8 21 6 1 36 80.6 19.4
Waterloo ES 12 28 1 5 5 51 80.0 20.0
Northfield ES 6 17 5 1 29 79.3 20.7
Pointers Run ES 5 14 3 2 24 79.2 20.8
Dayton Oaks ES 12 14 7 33 78.8 21.2
Rockburn ES 8 18 4 3 33 78.8 21.2
Deep Run ES 10 27 8 2 47 78.7 21.3
Guilford ES 7 11 1 3 2 24 78.3 21.7
Cradlerock ES 5 14 2 6 27 76.0 24.0
Gorman Crossing ES 9 16 5 4 34 73.5 26.5
Jeffers Hill ES 5 11 5 2 23 69.6 30.4
Stevens Forest ES 6 12 8 26 69.2 30.8
Forest Ridge ES 5 16 9 31 67.7 29.0
Hollifield Station ES 7 19 9 3 39 66.7 30.8
Bellows Spring ES 16 28 1 15 8 68 65.7 34.3
Bryant Woods ES 7 10 5 4 26 65.4 34.6
Clarksville ES 5 10 3 5 23 65.2 34.8
Clemens Crossing ES 7 11 5 5 28 64.3 35.7
Bushy Park ES 6 12 8 2 29 62.1 34.5
Elkridge ES 2 12 8 1 23 60.9 39.1
Longfellow ES 4 8 1 5 3 21 60.0 40.0
Bollman Bridge ES 4 18 1 10 4 38 59.5 37.8
Swansfield ES 3 24 1 11 9 48 57.4 42.6
Talbott Springs ES 5 15 11 4 35 57.1 42.9
Waverly ES 2 22 1 13 5 43 57.1 42.9
Thunder Hill ES 6 13 12 4 35 54.3 45.7
Centennial Lane ES 5 15 12 6 38 52.6 47.4
Fulton ES 3 12 10 7 32 46.9 53.1
St. John's Lane ES 2 3 14 9 28 17.9 82.1
2013-2014 HCEA Job Satisfaction Survey
14
Worksite Strongly Agree
Agree Does Not Apply
Disagree Strongly Disagree
Grand Total
% AGREE
% DISAGREE
Middle 91 273 5 134 68 576 63.7 35.4
Lake Elkhorn MS 7 22 4 1 35 82.9 14.3
Murray Hill MS 11 25 1 5 3 45 81.8 18.2
Burleigh Manor MS 4 18 4 2 28 78.6 21.4
Folly Quarter MS 12 16 6 3 37 75.7 24.3
Bonnie Branch MS 2 23 6 3 34 73.5 26.5
Mayfield Woods MS 4 19 5 4 32 71.9 28.1
Harper's Choice MS 6 18 1 8 2 35 70.6 29.4
Elkridge Landing MS 9 12 1 7 2 31 70.0 30.0
Dunloggin MS 7 15 7 3 32 68.8 31.3
Patapsco MS 6 15 1 7 3 32 67.7 32.3
Wilde Lake MS 2 15 1 8 1 27 65.4 34.6
Hammond MS 2 13 3 6 24 62.5 37.5
Lime Kiln MS 3 10 8 1 22 59.1 40.9
Mount View MS 4 9 7 3 24 54.2 41.7
Ellicott Mills MS 3 8 12 1 25 44.0 52.0
Patuxent Valley MS 3 7 7 6 23 43.5 56.5
Clarksville MS 2 11 11 8 32 40.6 59.4
Oakland Mills MS 3 8 10 7 29 37.9 58.6
Glenwood MS 1 9 9 9 29 34.5 62.1
High 102 305 5 155 112 682 60.1 39.4
Hammond HS 11 34 1 7 2 55 83.3 16.7
Mt. Hebron HS 13 22 5 2 43 81.4 16.3
Centennial HS 18 36 1 14 4 73 75.0 25.0
Glenelg HS 3 21 5 6 35 68.6 31.4
Atholton HS 7 18 1 7 5 39 65.8 31.6
Oakland Mills HS 6 38 2 14 10 70 64.7 35.3
Reservoir HS 12 31 23 10 76 56.6 43.4
Wilde Lake HS 10 17 12 9 48 56.3 43.8
Long Reach HS 4 24 10 18 56 50.0 50.0
River Hill HS 8 22 12 17 60 50.0 48.3
Marriotts Ridge HS 8 19 18 11 56 48.2 51.8
Howard HS 2 23 28 18 71 35.2 64.8
Special 24 62 4 30 24 146 60.6 38.0
ARL 4 10 1 2 2 20 73.7 21.1
Ascend One 3 5 8 100.0 0.0
Cedar Lane 1 8 7 4 20 45.0 55.0
Central Office 8 13 1 12 12 46 46.7 53.3
Health Services 1 11 2 6 4 24 54.5 45.5
Homewood Center 5 11 3 1 20 80.0 20.0
Old Cedar Lane 2 4 1 8 75.0 12.5
Grand Total 498 1264 27 574 317 2698 66.0 33.4
2013-2014 HCEA Job Satisfaction Survey
15
7) In my school/worksite, I am treated as a professional.
Worksite Strongly Agree
Agree Does Not Apply
Disagree Strongly Disagree
Grand Total
% AGREE
% DISAGREE
Elementary 427 683 2 122 53 1294 85.9 13.5
West Friendship ES 9 6 15 100.0 0.0
Veterans ES 11 26 1 38 97.4 2.6
Manor Woods ES 10 21 1 32 96.9 3.1
Bushy Park ES 9 19 1 29 96.6 3.4
Lisbon ES 13 14 1 28 96.4 3.6
Stevens Forest ES 9 16 1 26 96.2 3.8
Running Brook ES 13 9 1 23 95.7 4.3
Ducketts Lane ES 5 12 1 18 94.4 5.6
Dayton Oaks ES 19 12 2 33 93.9 6.1
Worthington ES 11 15 1 28 92.9 3.6
Cradlerock ES 7 18 2 27 92.6 7.4
Ilchester ES 14 19 3 36 91.7 8.3
Pointers Run ES 6 16 1 1 24 91.7 8.3
Talbott Springs ES 10 22 3 35 91.4 8.6
Hammond ES 10 11 2 23 91.3 8.7
Atholton ES 9 11 2 22 90.9 9.1
Rockburn ES 12 18 3 33 90.9 9.1
Laurel Woods ES 12 15 2 30 90.0 6.7
Northfield ES 11 15 3 29 89.7 10.3
Phelps Luck ES 18 8 2 1 29 89.7 10.3
Triadelphia Ridge ES 11 21 4 36 88.9 11.1
Clarksville ES 9 11 3 23 87.0 13.0
Deep Run ES 17 23 1 5 1 47 87.0 13.0
Elkridge ES 5 15 3 23 87.0 13.0
Guilford ES 8 12 1 2 1 24 87.0 13.0
Gorman Crossing ES 13 16 4 1 34 85.3 14.7
Hollifield Station ES 16 17 5 39 84.6 12.8
Bollman Bridge ES 9 23 4 2 38 84.2 15.8
Bellows Spring ES 23 34 5 6 68 83.8 16.2
Waverly ES 4 32 6 1 43 83.7 16.3
Jeffers Hill ES 10 9 1 2 23 82.6 13.0
Bryant Woods ES 9 12 1 4 26 80.8 19.2
Forest Ridge ES 11 14 3 1 31 80.6 12.9
Waterloo ES 16 24 7 4 51 78.4 21.6
Fulton ES 6 19 4 3 32 78.1 21.9
Thunder Hill ES 11 16 5 3 35 77.1 22.9
Centennial Lane ES 5 24 7 2 38 76.3 23.7
St. John's Lane ES 5 16 6 1 28 75.0 25.0
Clemens Crossing ES 7 12 3 6 28 67.9 32.1
Swansfield ES 9 23 10 5 48 66.7 31.3
Longfellow ES 5 7 6 3 21 57.1 42.9
2013-2014 HCEA Job Satisfaction Survey
16
Worksite Strongly Agree
Agree Does Not Apply
Disagree Strongly Disagree
Grand Total
% AGREE
% DISAGREE
Middle 139 319 77 37 576 79.5 19.8
Folly Quarter MS 15 20 2 37 94.6 5.4
Burleigh Manor MS 9 17 2 28 92.9 7.1
Harper's Choice MS 6 25 1 2 35 88.6 8.6
Dunloggin MS 11 17 4 32 87.5 12.5
Patapsco MS 7 21 2 2 32 87.5 12.5
Lime Kiln MS 5 14 1 2 22 86.4 13.6
Murray Hill MS 16 22 4 2 45 84.4 13.3
Mayfield Woods MS 8 19 4 1 32 84.4 15.6
Elkridge Landing MS 8 18 3 1 31 83.9 12.9
Wilde Lake MS 4 18 4 1 27 81.5 18.5
Ellicott Mills MS 6 14 5 25 80.0 20.0
Bonnie Branch MS 9 17 6 2 34 76.5 23.5
Oakland Mills MS 7 15 5 2 29 75.9 24.1
Mount View MS 7 11 4 1 24 75.0 20.8
Clarksville MS 3 20 5 4 32 71.9 28.1
Lake Elkhorn MS 10 15 6 4 35 71.4 28.6
Patuxent Valley MS 2 14 6 1 23 69.6 30.4
Hammond MS 1 12 5 6 24 54.2 45.8
Glenwood MS 5 10 8 6 29 51.7 48.3
High 159 365 2 91 60 682 77.1 22.2
Mt. Hebron HS 16 22 4 1 43 88.4 11.6
Centennial HS 22 41 1 6 2 73 87.5 11.1
Hammond HS 17 30 6 2 55 85.5 14.5
Glenelg HS 9 19 5 2 35 80.0 20.0
Reservoir HS 14 46 1 8 6 76 80.0 18.7
Howard HS 18 37 7 9 71 77.5 22.5
Atholton HS 13 17 4 5 39 76.9 23.1
River Hill HS 13 32 12 3 60 75.0 25.0
Wilde Lake HS 11 24 10 3 48 72.9 27.1
Marriotts Ridge HS 10 30 9 5 56 71.4 25.0
Oakland Mills HS 6 44 7 12 70 71.4 27.1
Long Reach HS 10 23 13 10 56 58.9 41.1
Special 38 73 2 21 11 146 77.1 22.2
ARL 5 13 2 20 90.0 10.0
Ascend One 3 4 8 87.5 0.0
Cedar Lane 3 12 3 2 20 75.0 25.0
Central Office 15 18 6 7 46 71.7 28.3
Health Services 2 14 2 4 2 24 72.7 27.3
Homewood Center 7 9 4 20 80.0 20.0
Old Cedar Lane 3 3 2 8 75.0 25.0
Grand Total 763 1440 6 311 161 2698 81.8 17.5
2013-2014 HCEA Job Satisfaction Survey
17
8) There is good teamwork among staff in my school/worksite.
Worksite Strongly Agree
Agree Does Not Apply
Disagree Strongly Disagree
Grand Total
% AGREE
% DISAGREE
Elementary 346 717 3 171 56 1294 82.3 17.6
Ducketts Lane ES 8 10 18 100.0 0.0
Elkridge ES 4 19 23 100.0 0.0
West Friendship ES 7 8 15 100.0 0.0
Triadelphia Ridge ES 11 24 1 36 97.2 2.8
Manor Woods ES 13 18 1 32 96.9 3.1
Running Brook ES 9 13 1 23 95.7 4.3
Atholton ES 7 14 1 22 95.5 4.5
Forest Ridge ES 6 22 1 2 31 93.3 6.7
Laurel Woods ES 10 18 1 1 30 93.3 6.7
Dayton Oaks ES 15 15 3 33 90.9 9.1
Northfield ES 10 16 2 1 29 89.7 10.3
Lisbon ES 5 20 3 28 89.3 10.7
Thunder Hill ES 7 24 2 2 35 88.6 11.4
Stevens Forest ES 8 15 3 26 88.5 11.5
Pointers Run ES 9 12 3 24 87.5 12.5
Hammond ES 9 11 1 2 23 87.0 13.0
Veterans ES 8 25 4 1 38 86.8 13.2
Deep Run ES 13 26 2 6 47 86.7 13.3
Phelps Luck ES 18 7 4 29 86.2 13.8
Worthington ES 12 12 4 28 85.7 14.3
Bellows Spring ES 13 44 9 2 68 83.8 16.2
Talbott Springs ES 9 20 5 1 35 82.9 17.1
Clemens Crossing ES 8 15 3 2 28 82.1 17.9
Hollifield Station ES 16 16 5 2 39 82.1 17.9
Cradlerock ES 7 15 4 1 27 81.5 18.5
Fulton ES 8 18 3 3 32 81.3 18.8
Swansfield ES 5 33 8 2 48 79.2 20.8
Clarksville ES 7 11 4 1 23 78.3 21.7
Bryant Woods ES 8 12 4 2 26 76.9 23.1
Waverly ES 4 29 6 4 43 76.7 23.3
Bushy Park ES 7 15 6 1 29 75.9 24.1
Rockburn ES 9 16 7 33 75.8 21.2
St. John's Lane ES 8 13 5 2 28 75.0 25.0
Waterloo ES 8 30 7 6 51 74.5 25.5
Jeffers Hill ES 6 11 3 3 23 73.9 26.1
Bollman Bridge ES 7 21 9 1 38 73.7 26.3
Ilchester ES 8 18 5 5 36 72.2 27.8
Guilford ES 4 13 6 1 24 70.8 29.2
Gorman Crossing ES 7 15 9 3 34 64.7 35.3
Longfellow ES 5 8 7 1 21 61.9 38.1
Centennial Lane ES 3 15 15 5 38 47.4 52.6
2013-2014 HCEA Job Satisfaction Survey
18
Worksite Strongly Agree
Agree Does Not Apply
Disagree Strongly Disagree
Grand Total
% AGREE
% DISAGREE
Middle 119 332 1 90 31 576 78.4 21.0
Lime Kiln MS 7 15 22 100.0 0.0
Ellicott Mills MS 9 14 2 25 92.0 8.0
Mayfield Woods MS 10 19 3 32 90.6 9.4
Patapsco MS 5 24 2 1 32 90.6 9.4
Oakland Mills MS 9 17 3 29 89.7 10.3
Murray Hill MS 13 25 1 4 2 45 86.4 13.6
Bonnie Branch MS 8 20 5 1 34 82.4 17.6
Dunloggin MS 8 18 5 1 32 81.3 18.8
Elkridge Landing MS 10 14 4 3 31 77.4 22.6
Lake Elkhorn MS 4 23 4 3 35 77.1 20.0
Harper's Choice MS 4 23 5 2 35 77.1 20.0
Glenwood MS 3 19 3 4 29 75.9 24.1
Patuxent Valley MS 4 13 5 1 23 73.9 26.1
Mount View MS 4 13 4 3 24 70.8 29.2
Folly Quarter MS 7 19 11 37 70.3 29.7
Hammond MS 6 10 4 4 24 66.7 33.3
Wilde Lake MS 2 16 8 1 27 66.7 33.3
Clarksville MS 3 17 7 4 32 62.5 34.4
Burleigh Manor MS 3 13 11 1 28 57.1 42.9
High 143 335 1 136 64 682 70.2 29.4
Mt. Hebron HS 13 24 6 43 86.0 14.0
Howard HS 21 40 8 2 71 85.9 14.1
Hammond HS 15 31 5 4 55 83.6 16.4
Reservoir HS 16 41 14 5 76 75.0 25.0
Glenelg HS 3 21 8 3 35 68.6 31.4
Centennial HS 18 31 20 4 73 67.1 32.9
Atholton HS 7 19 6 7 39 66.7 33.3
River Hill HS 16 24 14 6 60 66.7 33.3
Marriotts Ridge HS 11 26 13 5 56 66.1 32.1
Oakland Mills HS 12 33 11 14 70 64.3 35.7
Wilde Lake HS 6 21 1 15 3 48 57.4 38.3
Long Reach HS 5 24 16 11 56 51.8 48.2
Special 43 70 19 14 146 77.4 22.6
ARL 8 10 1 1 20 90.0 10.0
Ascend One 4 4 8 100.0 0.0
Cedar Lane 2 14 2 2 20 80.0 20.0
Central Office 18 13 6 9 46 67.4 32.6
Health Services 2 13 8 1 24 62.5 37.5
Homewood Center 8 12 20 100.0 0.0
Old Cedar Lane 1 4 2 1 8 62.5 37.5
Grand Total 651 1454 5 416 165 2698 78.2 21.6
2013-2014 HCEA Job Satisfaction Survey
19
9) Non-instructional duties are assigned on an equitable basis in my school/worksite.
Worksite Strongly Agree
Agree Does Not Apply
Disagree Strongly Disagree
Grand Total
% AGREE
% DISAGREE
Elementary 222 697 85 212 68 1294 76.0 23.2
West Friendship ES 8 7 15 100.0 0.0
Ducketts Lane ES 4 10 3 1 18 93.3 6.7
Bollman Bridge ES 6 28 1 3 38 91.9 8.1
Clarksville ES 9 11 1 2 23 90.9 9.1
Deep Run ES 7 30 5 4 1 47 88.1 11.9
Manor Woods ES 7 21 2 1 32 87.5 9.4
Atholton ES 5 13 1 2 1 22 85.7 14.3
Lisbon ES 5 17 2 4 28 84.6 15.4
Bryant Woods ES 9 12 1 3 26 84.0 12.0
Waterloo ES 5 36 2 5 3 51 83.7 16.3
Phelps Luck ES 9 14 1 4 1 29 82.1 17.9
Worthington ES 9 14 1 2 28 82.1 10.7
Elkridge ES 1 17 1 3 23 81.8 13.6
Pointers Run ES 7 11 2 4 24 81.8 18.2
Swansfield ES 2 35 2 6 3 48 80.4 19.6
Bellows Spring ES 6 41 9 9 3 68 79.7 20.3
Northfield ES 10 13 6 29 79.3 20.7
Veterans ES 7 16 9 4 2 38 79.3 20.7
Clemens Crossing ES 6 16 2 4 28 78.6 21.4
Dayton Oaks ES 6 18 2 5 1 33 77.4 19.4
Hammond ES 7 10 1 3 2 23 77.3 22.7
Talbott Springs ES 3 22 1 6 3 35 73.5 26.5
Laurel Woods ES 6 16 6 2 30 73.3 26.7
Running Brook ES 5 11 1 5 1 23 72.7 27.3
Bushy Park ES 6 12 4 5 2 29 72.0 28.0
Fulton ES 1 22 7 2 32 71.9 28.1
Forest Ridge ES 2 18 3 7 1 31 71.4 28.6
Guilford ES 3 12 3 5 1 24 71.4 28.6
Jeffers Hill ES 2 13 2 6 23 71.4 28.6
Hollifield Station ES 8 19 1 10 1 39 71.1 28.9
Waverly ES 4 24 3 9 2 43 70.0 27.5
Ilchester ES 6 16 4 6 4 36 68.8 31.3
Stevens Forest ES 4 13 1 5 3 26 68.0 32.0
Rockburn ES 5 14 5 8 1 33 67.9 32.1
Cradlerock ES 6 11 1 8 1 27 65.4 34.6
Longfellow ES 3 10 1 5 2 21 65.0 35.0
Gorman Crossing ES 9 11 3 7 3 34 64.5 32.3
Thunder Hill ES 3 17 3 9 2 35 62.5 34.4
Triadelphia Ridge ES 6 15 2 9 3 36 61.8 35.3
Centennial Lane ES 2 18 4 6 8 38 58.8 41.2
St. John's Lane ES 3 13 10 2 28 57.1 42.9
2013-2014 HCEA Job Satisfaction Survey
20
Worksite Strongly Agree
Agree Does Not Apply
Disagree Strongly Disagree
Grand Total
% AGREE
% DISAGREE
Middle 80 291 29 102 68 576 67.8 31.1
Murray Hill MS 9 27 1 6 2 45 81.8 18.2
Folly Quarter MS 10 18 2 5 2 37 80.0 20.0
Patapsco MS 4 20 2 4 2 32 80.0 20.0
Burleigh Manor MS 1 18 3 5 1 28 76.0 24.0
Ellicott Mills MS 3 16 4 2 25 76.0 24.0
Wilde Lake MS 3 14 4 3 3 27 73.9 26.1
Harper's Choice MS 3 19 5 5 3 35 73.3 26.7
Lime Kiln MS 4 12 4 2 22 72.7 27.3
Elkridge Landing MS 3 18 2 5 3 31 72.4 27.6
Dunloggin MS 7 14 2 8 1 32 70.0 30.0
Lake Elkhorn MS 5 18 2 5 4 35 69.7 27.3
Hammond MS 3 13 3 5 24 66.7 33.3
Glenwood MS 7 10 3 4 4 29 65.4 30.8
Oakland Mills MS 2 15 1 7 3 29 60.7 35.7
Mayfield Woods MS 5 14 5 8 32 59.4 40.6
Mount View MS 4 9 1 8 2 24 56.5 43.5
Patuxent Valley MS 4 9 5 5 23 56.5 43.5
Bonnie Branch MS 3 15 9 5 34 52.9 41.2
Clarksville MS 12 1 7 11 32 38.7 58.1
High 116 323 55 101 84 682 70.0 29.5
River Hill HS 21 26 4 7 2 60 83.9 16.1
Centennial HS 15 37 10 6 5 73 82.5 17.5
Reservoir HS 20 33 11 6 6 76 81.5 18.5
Atholton HS 8 22 2 7 39 76.9 23.1
Howard HS 11 37 4 12 7 71 71.6 28.4
Hammond HS 7 28 4 9 6 55 68.6 29.4
Marriotts Ridge HS 12 21 7 10 6 56 67.3 32.7
Long Reach HS 4 30 4 9 9 56 65.4 34.6
Wilde Lake HS 5 22 3 9 9 48 60.0 40.0
Mt. Hebron HS 5 18 4 9 7 43 59.0 41.0
Oakland Mills HS 4 35 3 14 13 70 58.2 40.3
Glenelg HS 4 14 1 8 7 35 52.9 44.1
Special 14 39 56 26 10 146 58.9 40.0
ARL 3 6 9 2 20 81.8 18.2
Ascend One 1 2 5 8 100.0 0.0
Cedar Lane 2 8 4 5 1 20 62.5 37.5
Central Office 5 6 20 9 6 46 42.3 57.7
Health Services 7 16 1 24 87.5 12.5
Homewood Center 2 7 9 2 20 45.0 55.0
Old Cedar Lane 1 3 2 1 8 66.7 16.7
Grand Total 432 1350 225 441 230 2698 72.1 27.1
2013-2014 HCEA Job Satisfaction Survey
21
10) My working environment (i.e. safety, cleanliness) is conducive to success.
Worksite Strongly Agree
Agree Does Not Apply
Disagree Strongly Disagree
Grand Total
% AGREE
% DISAGREE
Elementary 371 688 3 169 59 1294 82.0 17.7
Lisbon ES 13 15 28 100.0 0.0
Dayton Oaks ES 22 10 33 97.0 0.0
Laurel Woods ES 8 21 1 30 96.7 3.3
Bushy Park ES 20 8 1 29 96.6 3.4
Northfield ES 13 15 1 29 96.6 3.4
Triadelphia Ridge ES 13 21 1 1 36 94.4 5.6
Rockburn ES 17 14 2 33 93.9 6.1
Manor Woods ES 7 23 2 32 93.8 6.3
West Friendship ES 9 5 1 15 93.3 6.7
Worthington ES 12 14 2 28 92.9 7.1
Bellows Spring ES 24 39 5 68 92.6 7.4
Guilford ES 10 12 1 1 24 91.7 8.3
Atholton ES 4 15 1 2 22 90.5 9.5
Veterans ES 9 25 4 38 89.5 10.5
Deep Run ES 7 35 3 2 47 89.4 10.6
Ducketts Lane ES 6 10 2 18 88.9 11.1
Ilchester ES 20 12 2 2 36 88.9 11.1
Waverly ES 12 26 4 1 43 88.4 11.6
Hollifield Station ES 12 22 4 1 39 87.2 12.8
Elkridge ES 4 16 3 23 87.0 13.0
Fulton ES 12 15 3 1 32 84.4 12.5
Jeffers Hill ES 6 13 4 23 82.6 17.4
Bryant Woods ES 8 13 4 1 26 80.8 19.2
Thunder Hill ES 9 19 3 4 35 80.0 20.0
Pointers Run ES 2 17 5 24 79.2 20.8
Hammond ES 8 10 4 1 23 78.3 21.7
Stevens Forest ES 8 12 4 1 26 76.9 19.2
Bollman Bridge ES 6 23 6 3 38 76.3 23.7
Forest Ridge ES 7 16 7 1 31 74.2 25.8
Clarksville ES 8 9 2 4 23 73.9 26.1
Clemens Crossing ES 7 13 4 4 28 71.4 28.6
Talbott Springs ES 7 18 6 4 35 71.4 28.6
Swansfield ES 6 28 11 3 48 70.8 29.2
Waterloo ES 5 31 9 6 51 70.6 29.4
St. John's Lane ES 5 14 1 6 2 28 70.4 29.6
Longfellow ES 1 13 1 4 2 21 70.0 30.0
Running Brook ES 7 9 6 1 23 69.6 30.4
Phelps Luck ES 8 12 6 3 29 69.0 31.0
Cradlerock ES 2 16 9 27 66.7 33.3
Gorman Crossing ES 7 15 10 2 34 64.7 35.3
Centennial Lane ES 14 15 8 38 36.8 60.5
2013-2014 HCEA Job Satisfaction Survey
22
Worksite Strongly Agree
Agree Does Not Apply
Disagree Strongly Disagree
Grand Total
% AGREE
% DISAGREE
Middle 154 283 1 81 54 576 76.0 23.5
Folly Quarter MS 19 17 1 37 97.3 2.7
Harper's Choice MS 9 25 1 35 97.1 2.9
Murray Hill MS 12 29 3 1 45 91.1 8.9
Clarksville MS 6 21 2 3 32 84.4 15.6
Patapsco MS 8 19 2 3 32 84.4 15.6
Ellicott Mills MS 7 14 4 25 84.0 16.0
Hammond MS 3 17 2 2 24 83.3 16.7
Oakland Mills MS 11 13 2 2 29 82.8 13.8
Bonnie Branch MS 10 18 5 1 34 82.4 17.6
Dunloggin MS 11 15 6 32 81.3 18.8
Mayfield Woods MS 13 12 5 1 32 78.1 18.8
Lime Kiln MS 7 10 3 2 22 77.3 22.7
Burleigh Manor MS 9 12 6 1 28 75.0 25.0
Elkridge Landing MS 10 13 6 2 31 74.2 25.8
Patuxent Valley MS 3 11 6 3 23 60.9 39.1
Mount View MS 4 10 4 6 24 58.3 41.7
Wilde Lake MS 3 11 1 10 2 27 53.8 46.2
Glenwood MS 4 9 4 12 29 44.8 55.2
Lake Elkhorn MS 5 7 10 12 35 34.3 62.9
High 170 377 4 86 44 682 80.7 19.2
River Hill HS 33 21 5 1 60 90.0 10.0
Reservoir HS 33 35 6 2 76 89.5 10.5
Marriotts Ridge HS 17 31 1 4 3 56 87.3 12.7
Glenelg HS 8 22 5 35 85.7 14.3
Wilde Lake HS 6 35 4 3 48 85.4 14.6
Centennial HS 15 46 1 9 2 73 84.7 15.3
Howard HS 22 38 6 4 71 84.5 14.1
Long Reach HS 13 33 6 4 56 82.1 17.9
Mt. Hebron HS 8 26 7 2 43 79.1 20.9
Oakland Mills HS 3 44 1 11 11 70 68.1 31.9
Hammond HS 5 30 15 5 55 63.6 36.4
Atholton HS 7 16 1 8 7 39 60.5 39.5
Special 27 79 4 25 9 146 74.6 23.9
ARL 2 12 1 4 20 73.7 21.1
Ascend One 4 4 8 100.0 0.0
Cedar Lane 2 11 5 1 20 65.0 30.0
Central Office 7 21 13 5 46 60.9 39.1
Health Services 6 13 2 1 2 24 86.4 13.6
Homewood Center 4 14 2 20 90.0 10.0
Old Cedar Lane 2 4 1 1 8 85.7 14.3
Grand Total 722 1427 12 361 166 2698 80.0 19.6
2013-2014 HCEA Job Satisfaction Survey
23
11) My work performance is evaluated fairly.
Worksite Strongly Agree
Agree Does Not Apply
Disagree Strongly Disagree
Grand Total
% AGREE
% DISAGREE
Elementary 323 686 23 162 96 1294 79.4 20.3
Clarksville ES 6 16 1 23 100.0 0.0
Talbott Springs ES 6 27 1 1 35 97.1 2.9
Forest Ridge ES 6 22 1 1 1 31 93.3 6.7
West Friendship ES 9 5 15 93.3 0.0
Stevens Forest ES 10 14 2 26 92.3 7.7
Running Brook ES 10 10 1 1 1 23 90.9 9.1
Worthington ES 9 14 2 3 28 88.5 11.5
Cradlerock ES 2 20 2 2 1 27 88.0 12.0
Laurel Woods ES 12 14 2 2 30 86.7 13.3
Phelps Luck ES 15 10 2 2 29 86.2 13.8
Ilchester ES 12 19 2 3 36 86.1 13.9
Triadelphia Ridge ES 8 23 2 3 36 86.1 13.9
Deep Run ES 11 28 1 5 2 47 84.8 15.2
Bryant Woods ES 7 14 1 2 2 26 84.0 16.0
Bollman Bridge ES 6 25 1 5 1 38 83.8 16.2
Hammond ES 10 9 3 1 23 82.6 17.4
Waterloo ES 22 20 4 5 51 82.4 17.6
Northfield ES 10 13 1 3 2 29 82.1 17.9
Hollifield Station ES 8 24 6 1 39 82.1 17.9
Atholton ES 5 13 3 1 22 81.8 18.2
Veterans ES 6 25 4 3 38 81.6 18.4
Rockburn ES 9 17 2 5 33 78.8 21.2
Guilford ES 6 12 1 1 4 24 78.3 21.7
Jeffers Hill ES 8 10 3 2 23 78.3 21.7
Fulton ES 5 20 5 2 32 78.1 21.9
Ducketts Lane ES 5 9 4 18 77.8 22.2
Swansfield ES 3 34 9 1 48 77.1 20.8
Gorman Crossing ES 12 14 4 3 34 76.5 20.6
Waverly ES 4 28 1 8 2 43 76.2 23.8
Clemens Crossing ES 8 13 5 2 28 75.0 25.0
Lisbon ES 8 13 4 3 28 75.0 25.0
Pointers Run ES 4 11 4 3 2 24 75.0 25.0
Dayton Oaks ES 12 12 9 33 72.7 27.3
Longfellow ES 4 11 3 3 21 71.4 28.6
St. John's Lane ES 3 16 1 6 1 28 70.4 25.9
Bushy Park ES 5 15 4 5 29 69.0 31.0
Elkridge ES 5 10 1 6 1 23 68.2 31.8
Bellows Spring ES 12 32 2 12 10 68 66.7 33.3
Thunder Hill ES 6 16 8 5 35 62.9 37.1
Manor Woods ES 9 11 6 6 32 62.5 37.5
Centennial Lane ES 5 17 1 8 7 38 59.5 40.5
2013-2014 HCEA Job Satisfaction Survey
24
Worksite Strongly Agree
Agree Does Not Apply
Disagree Strongly Disagree
Grand Total
% AGREE
% DISAGREE
Middle 81 294 8 126 64 576 66.0 33.5
Harper's Choice MS 4 26 3 1 35 85.7 11.4
Dunloggin MS 6 19 3 4 32 78.1 21.9
Patapsco MS 4 21 6 1 32 78.1 21.9
Murray Hill MS 10 23 1 9 2 45 75.0 25.0
Ellicott Mills MS 2 16 6 1 25 72.0 28.0
Lake Elkhorn MS 4 20 1 5 4 35 70.6 26.5
Patuxent Valley MS 3 13 6 1 23 69.6 30.4
Wilde Lake MS 3 15 1 7 1 27 69.2 30.8
Glenwood MS 5 15 5 4 29 69.0 31.0
Bonnie Branch MS 4 19 7 4 34 67.6 32.4
Burleigh Manor MS 6 12 1 6 3 28 66.7 33.3
Clarksville MS 3 18 8 3 32 65.6 34.4
Mount View MS 4 11 1 6 2 24 65.2 34.8
Elkridge Landing MS 7 11 7 6 31 58.1 41.9
Lime Kiln MS 4 8 6 4 22 54.5 45.5
Folly Quarter MS 6 12 1 11 7 37 50.0 50.0
Hammond MS 12 8 4 24 50.0 50.0
Oakland Mills MS 1 13 1 6 7 29 50.0 46.4
Mayfield Woods MS 5 10 1 11 5 32 48.4 51.6
High 101 330 8 137 100 682 63.9 35.2
Howard HS 12 39 13 7 71 71.8 28.2
Mt. Hebron HS 8 22 6 7 43 69.8 30.2
Reservoir HS 13 39 1 15 8 76 69.3 30.7
Hammond HS 8 30 9 6 55 69.1 27.3
River Hill HS 14 27 11 6 60 68.3 28.3
Glenelg HS 2 21 1 9 2 35 67.6 32.4
Centennial HS 12 36 1 11 13 73 66.7 33.3
Wilde Lake HS 5 26 12 4 48 64.6 33.3
Long Reach HS 6 26 2 9 13 56 59.3 40.7
Atholton HS 5 17 10 7 39 56.4 43.6
Oakland Mills HS 6 31 2 15 15 70 54.4 44.1
Marriotts Ridge HS 10 16 1 17 12 56 47.3 52.7
Special 33 74 12 14 11 146 79.9 18.7
ARL 4 13 1 1 1 20 89.5 10.5
Ascend One 5 3 8 100.0 0.0
Cedar Lane 4 16 20 100.0 0.0
Central Office 9 17 6 8 5 46 65.0 32.5
Health Services 2 12 4 3 3 24 70.0 30.0
Homewood Center 7 8 1 1 2 20 78.9 15.8
Old Cedar Lane 2 5 1 8 87.5 12.5
Grand Total 538 1384 51 439 271 2698 72.6 26.8
2013-2014 HCEA Job Satisfaction Survey
25
12) I am provided adequate time during the workday to plan, prepare for and do my job.
Worksite Strongly Agree
Agree Does Not Apply
Disagree Strongly Disagree
Grand Total
% AGREE
% DISAGREE
Elementary 100 438 13 375 365 1294 42.0 57.8
Bryant Woods ES 8 10 5 3 26 69.2 30.8
Laurel Woods ES 2 18 1 5 4 30 69.0 31.0
Jeffers Hill ES 1 14 3 5 23 65.2 34.8
Worthington ES 1 16 1 6 3 28 63.0 33.3
Hammond ES 4 10 6 3 23 60.9 39.1
Cradlerock ES 3 13 7 4 27 59.3 40.7
Forest Ridge ES 3 14 10 4 31 54.8 45.2
Clemens Crossing ES 4 11 5 8 28 53.6 46.4
West Friendship ES 6 2 4 2 15 53.3 40.0
Clarksville ES 2 10 6 5 23 52.2 47.8
Rockburn ES 3 14 5 11 33 51.5 48.5
Running Brook ES 5 6 7 5 23 47.8 52.2
Triadelphia Ridge ES 1 16 11 8 36 47.2 52.8
Swansfield ES 22 1 12 13 48 46.8 53.2
Phelps Luck ES 7 6 1 10 5 29 46.4 53.6
Atholton ES 1 9 4 8 22 45.5 54.5
Ilchester ES 2 14 4 16 36 44.4 55.6
Lisbon ES 2 10 1 10 5 28 44.4 55.6
Fulton ES 2 12 10 8 32 43.8 56.3
Bellows Spring ES 6 22 2 24 14 68 42.4 57.6
Deep Run ES 4 15 2 16 10 47 42.2 57.8
Dayton Oaks ES 2 11 2 10 8 33 41.9 58.1
Gorman Crossing ES 2 12 12 8 34 41.2 58.8
Veterans ES 1 14 1 10 12 38 40.5 59.5
Stevens Forest ES 2 8 14 2 26 38.5 61.5
Longfellow ES 2 6 7 6 21 38.1 61.9
Northfield ES 3 8 10 8 29 37.9 62.1
Guilford ES 9 6 9 24 37.5 62.5
Bollman Bridge ES 3 10 1 13 11 38 35.1 64.9
Centennial Lane ES 13 7 17 38 34.2 63.2
Ducketts Lane ES 6 7 5 18 33.3 66.7
Hollifield Station ES 3 10 10 16 39 33.3 66.7
Waterloo ES 6 11 18 16 51 33.3 66.7
Waverly ES 3 11 11 18 43 32.6 67.4
Talbott Springs ES 11 14 10 35 31.4 68.6
Manor Woods ES 2 8 10 12 32 31.3 68.8
Pointers Run ES 7 5 12 24 29.2 70.8
Thunder Hill ES 8 11 16 35 22.9 77.1
Elkridge ES 2 3 9 9 23 21.7 78.3
St. John's Lane ES 1 4 11 12 28 17.9 82.1
Bushy Park ES 1 4 10 14 29 17.2 82.8
2013-2014 HCEA Job Satisfaction Survey
26
Worksite Strongly Agree
Agree Does Not Apply
Disagree Strongly Disagree
Grand Total
% AGREE
% DISAGREE
Middle 39 162 10 137 225 576 35.5 64.0
Burleigh Manor MS 1 15 2 2 8 28 61.5 38.5
Harper's Choice MS 5 15 1 7 5 35 58.8 35.3
Murray Hill MS 2 22 11 10 45 53.3 46.7
Folly Quarter MS 4 13 1 8 11 37 47.2 52.8
Dunloggin MS 10 4 10 8 32 43.8 56.3
Glenwood MS 3 8 6 12 29 37.9 62.1
Mayfield Woods MS 1 11 5 15 32 37.5 62.5
Mount View MS 9 5 10 24 37.5 62.5
Wilde Lake MS 2 8 7 10 27 37.0 63.0
Lime Kiln MS 8 7 7 22 36.4 63.6
Patapsco MS 1 9 1 9 12 32 32.3 67.7
Lake Elkhorn MS 3 7 1 10 13 35 29.4 67.6
Hammond MS 7 6 11 24 29.2 70.8
Clarksville MS 2 6 1 6 17 32 25.8 74.2
Patuxent Valley MS 5 1 4 13 23 22.7 77.3
Oakland Mills MS 6 11 12 29 20.7 79.3
Elkridge Landing MS 3 3 1 7 17 31 20.0 80.0
Bonnie Branch MS 1 4 1 10 18 34 15.2 84.8
Ellicott Mills MS 1 2 6 16 25 12.0 88.0
High 61 210 9 182 216 682 40.3 59.1
River Hill HS 8 22 12 17 60 50.0 48.3
Long Reach HS 5 22 1 15 13 56 49.1 50.9
Oakland Mills HS 2 30 3 10 25 70 47.8 52.2
Reservoir HS 11 24 1 18 21 76 46.7 52.0
Howard HS 9 21 1 22 17 71 42.9 55.7
Marriotts Ridge HS 2 19 11 24 56 37.5 62.5
Atholton HS 3 11 1 10 14 39 36.8 63.2
Mt. Hebron HS 3 12 1 15 12 43 35.7 64.3
Centennial HS 9 16 27 21 73 34.2 65.8
Wilde Lake HS 3 13 14 18 48 33.3 66.7
Glenelg HS 2 9 14 9 35 31.4 65.7
Hammond HS 4 11 1 14 25 55 27.8 72.2
Special 23 63 9 30 19 146 62.8 35.8
ARL 3 5 3 5 3 20 47.1 47.1
Ascend One 4 2 2 8 75.0 25.0
Cedar Lane 2 13 2 3 20 83.3 16.7
Central Office 10 20 1 8 6 46 66.7 31.1
Health Services 15 3 6 24 62.5 37.5
Homewood Center 3 5 1 7 4 20 42.1 57.9
Old Cedar Lane 1 3 2 2 8 66.7 33.3
Grand Total 223 873 41 724 825 2698 41.2 58.3
2013-2014 HCEA Job Satisfaction Survey
27
13) I am provided adequate work and storage space to prepare for and do my job.
Worksite Strongly Agree
Agree Does Not Apply
Disagree Strongly Disagree
Grand Total
% AGREE
% DISAGREE
Elementary 271 726 9 200 78 1294 77.6 21.6
Clemens Crossing ES 11 17 28 100.0 0.0
Rockburn ES 11 21 1 33 97.0 3.0
Lisbon ES 7 20 1 28 96.4 3.6
West Friendship ES 8 5 1 15 92.9 0.0
Hammond ES 11 10 2 23 91.3 8.7
Bushy Park ES 4 22 3 29 89.7 10.3
Bellows Spring ES 16 43 1 5 3 68 88.1 11.9
Dayton Oaks ES 13 16 2 1 33 87.9 9.1
Clarksville ES 5 15 3 23 87.0 13.0
Laurel Woods ES 7 19 4 30 86.7 13.3
Talbott Springs ES 5 25 3 1 35 85.7 11.4
Manor Woods ES 5 22 3 2 32 84.4 15.6
Bollman Bridge ES 9 22 1 5 1 38 83.8 16.2
Veterans ES 7 24 1 5 38 83.8 13.5
Ducketts Lane ES 6 9 3 18 83.3 16.7
Pointers Run ES 6 14 1 2 24 83.3 12.5
Northfield ES 6 18 2 3 29 82.8 17.2
Jeffers Hill ES 4 15 3 23 82.6 13.0
Gorman Crossing ES 7 21 3 2 34 82.4 14.7
Worthington ES 9 14 3 1 28 82.1 14.3
Ilchester ES 9 20 1 6 36 80.6 19.4
Phelps Luck ES 11 12 4 2 29 79.3 20.7
Elkridge ES 8 10 2 3 23 78.3 21.7
Thunder Hill ES 9 18 6 2 35 77.1 22.9
Bryant Woods ES 9 11 6 26 76.9 23.1
Waterloo ES 9 30 10 2 51 76.5 23.5
Triadelphia Ridge ES 3 24 6 3 36 75.0 25.0
Waverly ES 6 26 8 3 43 74.4 25.6
Atholton ES 4 12 4 2 22 72.7 27.3
Running Brook ES 5 11 1 3 3 23 72.7 27.3
Fulton ES 5 18 5 4 32 71.9 28.1
Cradlerock ES 4 15 6 2 27 70.4 29.6
Longfellow ES 5 9 4 3 21 66.7 33.3
Swansfield ES 2 29 1 13 3 48 66.0 34.0
Forest Ridge ES 4 15 1 8 3 31 63.3 36.7
Centennial Lane ES 3 21 7 6 38 63.2 34.2
Guilford ES 2 13 5 4 24 62.5 37.5
Hollifield Station ES 6 17 14 2 39 59.0 41.0
Deep Run ES 3 23 1 18 2 47 56.5 43.5
St. John's Lane ES 2 12 1 9 4 28 51.9 48.1
Stevens Forest ES 5 8 9 3 26 50.0 46.2
2013-2014 HCEA Job Satisfaction Survey
28
Worksite Strongly Agree
Agree Does Not Apply
Disagree Strongly Disagree
Grand Total
% AGREE
% DISAGREE
Middle 132 339 70 31 576 81.8 17.5
Folly Quarter MS 14 22 1 37 97.3 2.7
Hammond MS 5 18 1 24 95.8 4.2
Elkridge Landing MS 12 16 1 1 31 90.3 6.5
Oakland Mills MS 1 25 1 2 29 89.7 10.3
Burleigh Manor MS 7 18 2 1 28 89.3 10.7
Mayfield Woods MS 10 18 1 3 32 87.5 12.5
Patapsco MS 6 22 3 1 32 87.5 12.5
Harper's Choice MS 10 20 5 35 85.7 14.3
Dunloggin MS 10 17 4 1 32 84.4 15.6
Patuxent Valley MS 5 14 1 3 23 82.6 17.4
Lime Kiln MS 3 15 3 1 22 81.8 18.2
Murray Hill MS 8 27 8 2 45 77.8 22.2
Bonnie Branch MS 7 19 4 4 34 76.5 23.5
Ellicott Mills MS 3 16 3 3 25 76.0 24.0
Mount View MS 6 12 6 24 75.0 25.0
Glenwood MS 8 13 7 1 29 72.4 27.6
Clarksville MS 8 15 6 2 32 71.9 25.0
Lake Elkhorn MS 8 17 5 3 35 71.4 22.9
Wilde Lake MS 1 15 9 2 27 59.3 40.7
High 192 364 2 78 41 682 81.8 17.5
Marriotts Ridge HS 24 27 3 2 56 91.1 8.9
Reservoir HS 23 46 6 1 76 90.8 9.2
Centennial HS 18 46 7 1 73 87.7 11.0
Long Reach HS 11 38 6 1 56 87.5 12.5
Oakland Mills HS 18 41 1 4 6 70 85.5 14.5
Mt. Hebron HS 21 15 5 1 43 83.7 14.0
River Hill HS 27 23 6 3 60 83.3 15.0
Glenelg HS 7 20 7 1 35 77.1 22.9
Howard HS 14 39 11 6 71 74.6 23.9
Atholton HS 12 17 5 4 39 74.4 23.1
Hammond HS 10 27 1 11 6 55 68.5 31.5
Wilde Lake HS 7 25 7 9 48 66.7 33.3
Special 40 82 1 17 6 146 84.1 15.9
ARL 5 11 1 3 20 84.2 15.8
Ascend One 6 2 8 100.0 0.0
Cedar Lane 5 14 1 20 95.0 5.0
Central Office 11 25 9 1 46 78.3 21.7
Health Services 17 2 5 24 70.8 29.2
Homewood Center 10 9 1 20 95.0 5.0
Old Cedar Lane 3 4 1 8 87.5 12.5
Grand Total 635 1511 12 365 156 2698 79.9 19.4
2013-2014 HCEA Job Satisfaction Survey
29
14) My administrators/supervisors respect the negotiated contracts.
Worksite Strongly Agree
Agree Does Not Apply
Disagree Strongly Disagree
Grand Total
% AGREE
% DISAGREE
Elementary 415 751 14 77 26 1294 91.1 8.0
Clarksville ES 9 14 23 100.0 0.0
Lisbon ES 10 18 28 100.0 0.0
Manor Woods ES 14 18 32 100.0 0.0
Worthington ES 13 15 28 100.0 0.0
Forest Ridge ES 11 17 2 1 31 96.6 3.4
Laurel Woods ES 11 17 1 1 30 96.6 3.4
Phelps Luck ES 17 11 1 29 96.6 3.4
Bryant Woods ES 9 16 1 26 96.2 3.8
Stevens Forest ES 9 16 1 26 96.2 3.8
Pointers Run ES 5 18 1 24 95.8 4.2
Hammond ES 13 9 1 23 95.7 4.3
Atholton ES 10 11 1 22 95.5 4.5
Bollman Bridge ES 10 26 2 38 94.7 5.3
Veterans ES 8 28 1 38 94.7 2.6
Dayton Oaks ES 14 17 2 33 93.9 6.1
West Friendship ES 12 2 15 93.3 0.0
St. John's Lane ES 4 21 1 1 1 28 92.6 7.4
Triadelphia Ridge ES 11 22 1 36 91.7 2.8
Thunder Hill ES 10 22 1 2 35 91.4 8.6
Deep Run ES 12 30 1 4 47 91.3 8.7
Elkridge ES 5 16 2 23 91.3 8.7
Jeffers Hill ES 11 10 1 1 23 91.3 8.7
Running Brook ES 10 11 1 23 91.3 4.3
Waterloo ES 15 31 5 51 90.2 9.8
Northfield ES 12 14 3 29 89.7 10.3
Hollifield Station ES 10 24 1 4 39 89.5 10.5
Bushy Park ES 9 16 1 2 1 29 89.3 10.7
Cradlerock ES 6 18 1 2 27 88.9 11.1
Ducketts Lane ES 8 8 1 18 88.9 5.6
Ilchester ES 13 19 2 2 36 88.9 11.1
Talbott Springs ES 7 24 3 35 88.6 8.6
Bellows Spring ES 17 42 1 5 2 68 88.1 10.4
Gorman Crossing ES 17 12 1 1 2 34 87.9 9.1
Guilford ES 11 10 2 1 24 87.5 12.5
Longfellow ES 5 13 1 1 21 85.7 9.5
Swansfield ES 7 34 4 3 48 85.4 14.6
Clemens Crossing ES 9 14 1 3 1 28 85.2 14.8
Fulton ES 5 21 1 4 1 32 83.9 16.1
Centennial Lane ES 7 23 2 4 1 38 83.3 13.9
Waverly ES 10 25 1 5 2 43 83.3 16.7
Rockburn ES 9 18 5 1 33 81.8 18.2
2013-2014 HCEA Job Satisfaction Survey
30
Worksite Strongly Agree
Agree Does Not Apply
Disagree Strongly Disagree
Grand Total
% AGREE
% DISAGREE
Middle 163 350 8 36 15 576 90.3 9.0
Murray Hill MS 16 26 2 1 45 97.7 2.3
Folly Quarter MS 18 18 1 37 97.3 2.7
Bonnie Branch MS 13 20 1 34 97.1 2.9
Harper's Choice MS 13 20 1 1 35 97.1 2.9
Patapsco MS 10 20 1 1 32 93.8 6.3
Dunloggin MS 6 23 1 2 32 93.5 6.5
Burleigh Manor MS 12 14 2 28 92.9 7.1
Ellicott Mills MS 3 20 2 25 92.0 8.0
Mount View MS 9 13 1 1 24 91.7 8.3
Lime Kiln MS 7 13 1 22 90.9 4.5
Lake Elkhorn MS 11 20 3 35 88.6 8.6
Hammond MS 5 16 2 1 24 87.5 12.5
Patuxent Valley MS 2 18 2 1 23 87.0 13.0
Elkridge Landing MS 9 17 1 2 2 31 86.7 13.3
Oakland Mills MS 5 20 3 1 29 86.2 13.8
Mayfield Woods MS 10 17 3 2 32 84.4 15.6
Glenwood MS 7 17 3 1 29 82.8 13.8
Wilde Lake MS 3 18 1 4 1 27 80.8 19.2
Clarksville MS 4 20 2 4 1 32 80.0 16.7
High 146 428 8 65 29 682 85.2 13.9
Centennial HS 21 46 2 1 2 73 94.4 4.2
Mt. Hebron HS 19 21 2 43 93.0 4.7
Reservoir HS 20 47 1 6 76 89.3 8.0
Hammond HS 10 39 4 2 55 89.1 10.9
River Hill HS 16 37 4 3 60 88.3 11.7
Atholton HS 10 23 2 4 39 84.6 15.4
Glenelg HS 5 23 1 4 2 35 82.4 17.6
Marriotts Ridge HS 13 33 5 3 56 82.1 14.3
Oakland Mills HS 10 44 3 10 3 70 80.6 19.4
Howard HS 8 49 10 4 71 80.3 19.7
Long Reach HS 6 37 1 8 4 56 78.2 21.8
Wilde Lake HS 8 29 9 2 48 77.1 22.9
Special 42 78 7 12 7 146 86.3 13.7
ARL 6 12 1 1 20 94.7 5.3
Ascend One 6 1 1 8 85.7 14.3
Cedar Lane 5 13 1 1 20 90.0 10.0
Central Office 13 19 3 6 5 46 74.4 25.6
Health Services 4 16 1 2 1 24 87.0 13.0
Homewood Center 5 15 20 100.0 0.0
Old Cedar Lane 3 3 1 1 8 85.7 14.3
Grand Total 766 1607 37 190 77 2698 89.2 10.0
2013-2014 HCEA Job Satisfaction Survey
31
15) My planning time is respected by my school administrations/supervisors.
Worksite Strongly Agree
Agree Does Not Apply
Disagree Strongly Disagree
Grand Total
% AGREE
% DISAGREE
Elementary 280 632 134 162 78 1294 78.6 20.7
Manor Woods ES 12 17 2 1 32 96.7 3.3
Worthington ES 10 13 4 1 28 95.8 4.2
Ducketts Lane ES 3 13 1 1 18 94.1 5.9
Dayton Oaks ES 11 14 6 2 33 92.6 7.4
West Friendship ES 9 3 2 15 92.3 0.0
Phelps Luck ES 15 8 4 1 1 29 92.0 8.0
Running Brook ES 7 13 1 2 23 90.9 9.1
Triadelphia Ridge ES 9 21 3 3 36 90.9 9.1
Hammond ES 10 9 2 2 23 90.5 9.5
Ilchester ES 10 16 7 3 36 89.7 10.3
Lisbon ES 5 18 2 3 28 88.5 11.5
Cradlerock ES 3 17 4 1 2 27 87.0 13.0
Atholton ES 8 11 1 2 22 86.4 13.6
Clarksville ES 7 11 2 3 23 85.7 14.3
Laurel Woods ES 4 18 4 2 2 30 84.6 15.4
Gorman Crossing ES 10 17 2 2 3 34 84.4 15.6
Bellows Spring ES 10 35 13 5 5 68 81.8 18.2
Jeffers Hill ES 7 11 1 3 1 23 81.8 18.2
Northfield ES 8 14 2 3 2 29 81.5 18.5
Bryant Woods ES 5 12 5 4 26 81.0 19.0
Centennial Lane ES 3 26 2 7 38 80.6 19.4
Waterloo ES 12 25 5 5 4 51 80.4 19.6
Bollman Bridge ES 7 17 8 5 1 38 80.0 20.0
Veterans ES 4 22 5 6 1 38 78.8 21.2
Forest Ridge ES 7 14 4 4 1 31 77.8 18.5
Deep Run ES 5 26 7 7 2 47 77.5 22.5
Guilford ES 4 13 2 3 2 24 77.3 22.7
Pointers Run ES 4 13 2 3 2 24 77.3 22.7
Waverly ES 8 23 1 9 1 43 73.8 23.8
Longfellow ES 6 8 2 3 2 21 73.7 26.3
Swansfield ES 8 21 8 5 6 48 72.5 27.5
Rockburn ES 8 15 1 5 2 33 71.9 21.9
Clemens Crossing ES 8 11 1 5 3 28 70.4 29.6
Stevens Forest ES 5 12 1 6 2 26 68.0 32.0
Talbott Springs ES 6 15 4 8 2 35 67.7 32.3
Thunder Hill ES 7 15 2 8 3 35 66.7 33.3
Bushy Park ES 4 13 2 4 6 29 63.0 37.0
Hollifield Station ES 5 17 4 5 8 39 62.9 37.1
Elkridge ES 4 10 7 2 23 60.9 39.1
Fulton ES 15 3 12 2 32 51.7 48.3
St. John's Lane ES 2 10 3 7 3 28 48.0 40.0
2013-2014 HCEA Job Satisfaction Survey
32
Worksite Strongly Agree
Agree Does Not Apply
Disagree Strongly Disagree
Grand Total
% AGREE
% DISAGREE
Middle 127 288 59 76 23 576 80.3 19.1
Lime Kiln MS 6 15 22 95.5 0.0
Folly Quarter MS 17 16 2 1 1 37 94.3 5.7
Murray Hill MS 14 22 6 2 1 45 92.3 7.7
Burleigh Manor MS 10 12 4 2 28 91.7 8.3
Mount View MS 7 13 2 2 24 90.9 9.1
Harper's Choice MS 12 14 6 3 35 89.7 10.3
Dunloggin MS 7 19 2 4 32 86.7 13.3
Bonnie Branch MS 7 18 5 2 2 34 86.2 13.8
Patapsco MS 5 19 4 4 32 85.7 14.3
Hammond MS 3 15 1 2 3 24 78.3 21.7
Mayfield Woods MS 7 17 1 4 3 32 77.4 22.6
Lake Elkhorn MS 6 15 6 3 4 35 72.4 24.1
Ellicott Mills MS 3 15 7 25 72.0 28.0
Elkridge Landing MS 6 14 3 7 1 31 71.4 28.6
Glenwood MS 5 12 5 5 2 29 70.8 29.2
Patuxent Valley MS 2 12 3 5 1 23 70.0 30.0
Oakland Mills MS 5 14 1 8 29 67.9 28.6
Clarksville MS 4 14 3 7 4 32 62.1 37.9
Wilde Lake MS 1 12 5 8 1 27 59.1 40.9
High 127 332 71 98 45 682 75.1 23.4
Mt. Hebron HS 14 19 5 3 2 43 86.8 13.2
Reservoir HS 23 34 9 7 1 76 85.1 11.9
Centennial HS 13 41 6 11 2 73 80.6 19.4
Howard HS 8 42 8 7 4 71 79.4 17.5
Oakland Mills HS 15 31 12 8 4 70 79.3 20.7
River Hill HS 13 32 3 5 5 60 78.9 17.5
Glenelg HS 4 20 4 6 1 35 77.4 22.6
Atholton HS 10 15 5 3 6 39 73.5 26.5
Long Reach HS 5 32 5 11 3 56 72.5 27.5
Wilde Lake HS 5 25 5 8 4 48 69.8 27.9
Marriotts Ridge HS 11 20 3 13 8 56 58.5 39.6
Hammond HS 6 21 6 16 5 55 55.1 42.9
Special 17 32 79 15 3 146 73.1 26.9
ARL 5 3 12 20 100.0 0.0
Ascend One 1 6 1 8 50.0 50.0
Cedar Lane 4 10 4 2 20 87.5 12.5
Central Office 5 5 34 2 46 83.3 16.7
Health Services 4 16 3 1 24 50.0 50.0
Homewood Center 1 8 3 6 2 20 52.9 47.1
Old Cedar Lane 1 2 4 1 8 75.0 25.0
Grand Total 551 1284 343 351 149 2698 77.9 21.2
2013-2014 HCEA Job Satisfaction Survey
33
16) In my school, administrators/supervisors support me in enforcing discipline.
Worksite Strongly Agree
Agree Does Not Apply
Disagree Strongly Disagree
Grand Total
% AGREE
% DISAGREE
Elementary 323 656 81 160 68 1294 80.7 18.8
Northfield ES 10 18 1 29 100.0 0.0
Phelps Luck ES 17 11 1 29 100.0 0.0
Running Brook ES 6 16 1 23 100.0 0.0
Laurel Woods ES 11 17 1 1 30 96.6 3.4
Lisbon ES 14 12 1 1 28 96.3 3.7
Ducketts Lane ES 4 11 2 1 18 93.8 6.3
Manor Woods ES 8 20 2 1 32 93.3 3.3
West Friendship ES 11 3 15 93.3 0.0
Pointers Run ES 6 15 1 2 24 91.3 8.7
Atholton ES 9 11 2 22 90.9 9.1
Talbott Springs ES 10 20 2 3 35 90.9 9.1
Waverly ES 5 31 3 2 2 43 90.0 10.0
Bryant Woods ES 12 10 1 1 1 26 88.0 8.0
Stevens Forest ES 7 15 1 3 26 88.0 12.0
Worthington ES 10 12 3 2 1 28 88.0 12.0
Clarksville ES 6 14 3 23 87.0 13.0
Hollifield Station ES 13 19 2 5 39 86.5 13.5
Thunder Hill ES 8 21 1 4 1 35 85.3 14.7
Longfellow ES 6 11 1 3 21 85.0 15.0
Deep Run ES 12 24 4 5 2 47 83.7 16.3
Bellows Spring ES 13 37 8 6 4 68 83.3 16.7
Forest Ridge ES 7 16 3 4 1 31 82.1 17.9
Elkridge ES 3 15 1 3 1 23 81.8 18.2
Triadelphia Ridge ES 6 20 4 4 1 36 81.3 15.6
Cradlerock ES 3 18 1 5 27 80.8 19.2
Ilchester ES 8 19 2 4 3 36 79.4 20.6
Dayton Oaks ES 11 12 4 6 33 79.3 20.7
Guilford ES 5 14 4 1 24 79.2 20.8
Gorman Crossing ES 10 15 2 2 5 34 78.1 21.9
Rockburn ES 11 13 2 3 3 33 77.4 19.4
Veterans ES 5 18 7 7 1 38 74.2 25.8
Hammond ES 11 6 4 2 23 73.9 26.1
Jeffers Hill ES 6 10 1 5 1 23 72.7 27.3
Waterloo ES 10 24 4 6 7 51 72.3 27.7
Bollman Bridge ES 8 18 2 8 2 38 72.2 27.8
Bushy Park ES 4 16 1 7 1 29 71.4 28.6
Clemens Crossing ES 7 11 5 4 28 64.3 32.1
Fulton ES 2 17 1 9 3 32 61.3 38.7
Swansfield ES 2 22 5 9 10 48 55.8 44.2
St. John's Lane ES 3 11 1 8 5 28 51.9 48.1
Centennial Lane ES 3 13 4 12 6 38 47.1 52.9
2013-2014 HCEA Job Satisfaction Survey
34
Worksite Strongly Agree
Agree Does Not Apply
Disagree Strongly Disagree
Grand Total
% AGREE
% DISAGREE
Middle 102 294 25 97 53 576 71.9 27.2
Folly Quarter MS 15 19 1 2 37 94.4 5.6
Bonnie Branch MS 11 20 3 34 91.2 8.8
Murray Hill MS 8 30 1 5 1 45 86.4 13.6
Burleigh Manor MS 9 13 2 3 1 28 84.6 15.4
Patapsco MS 8 19 4 1 32 84.4 15.6
Mount View MS 4 13 3 2 2 24 81.0 19.0
Dunloggin MS 7 18 1 6 32 80.6 19.4
Elkridge Landing MS 8 17 5 1 31 80.6 19.4
Ellicott Mills MS 2 18 3 1 25 80.0 16.0
Clarksville MS 5 16 5 4 2 32 77.8 22.2
Hammond MS 3 14 1 4 2 24 73.9 26.1
Harper's Choice MS 4 19 1 8 3 35 67.6 32.4
Lime Kiln MS 13 1 3 4 22 61.9 33.3
Mayfield Woods MS 3 16 6 6 32 59.4 37.5
Glenwood MS 5 9 4 5 5 29 56.0 40.0
Oakland Mills MS 3 12 2 9 3 29 55.6 44.4
Lake Elkhorn MS 5 12 1 11 5 35 50.0 47.1
Wilde Lake MS 1 10 2 8 6 27 44.0 56.0
Patuxent Valley MS 1 6 6 10 23 30.4 69.6
High 115 319 54 118 70 682 69.1 29.9
Howard HS 21 40 4 3 3 71 91.0 9.0
Centennial HS 19 37 10 7 73 88.9 11.1
Marriotts Ridge HS 14 27 2 6 7 56 75.9 24.1
Wilde Lake HS 10 21 3 9 5 48 68.9 31.1
Reservoir HS 13 33 8 14 8 76 67.6 32.4
Oakland Mills HS 6 36 6 13 8 70 65.6 32.8
Atholton HS 5 20 5 8 39 64.1 33.3
Mt. Hebron HS 4 19 6 8 4 43 62.2 32.4
River Hill HS 11 24 3 16 5 60 61.4 36.8
Hammond HS 5 25 5 11 9 55 60.0 40.0
Glenelg HS 1 18 2 11 3 35 57.6 42.4
Long Reach HS 6 19 5 15 10 56 49.0 49.0
Special 12 40 82 8 2 146 81.3 15.6
ARL 1 9 9 20 90.9 0.0
Ascend One 1 7 8 100.0 0.0
Cedar Lane 1 9 8 2 20 83.3 16.7
Central Office 2 1 41 2 46 60.0 40.0
Health Services 3 7 10 4 24 71.4 28.6
Homewood Center 4 13 2 20 85.0 10.0
Old Cedar Lane 1 7 8 100.0 0.0
Grand Total 552 1309 242 383 193 2698 75.8 23.5
2013-2014 HCEA Job Satisfaction Survey
35
17) In my school, student misbehavior interferes with learning.
Worksite Strongly Agree
Agree Does Not Apply
Disagree Strongly Disagree
Grand Total
% AGREE
% DISAGREE
Elementary 183 429 59 448 174 1294 49.6 50.4
Swansfield ES 22 20 6 48 87.5 12.5
Longfellow ES 5 11 2 3 21 84.2 15.8
Elkridge ES 5 14 4 23 82.6 17.4
Running Brook ES 8 11 2 2 23 82.6 17.4
Waterloo ES 25 17 5 4 51 82.4 17.6
Bryant Woods ES 10 9 1 4 2 26 76.0 24.0
Stevens Forest ES 6 13 1 5 1 26 76.0 24.0
Guilford ES 5 13 4 2 24 75.0 25.0
Forest Ridge ES 4 16 3 8 31 71.4 28.6
St. John's Lane ES 8 12 5 3 28 71.4 28.6
Bollman Bridge ES 11 15 9 3 38 68.4 31.6
Laurel Woods ES 4 16 8 2 30 66.7 33.3
Hollifield Station ES 5 20 1 11 2 39 65.8 34.2
Ducketts Lane ES 1 10 1 5 1 18 64.7 35.3
Gorman Crossing ES 5 15 2 9 3 34 62.5 37.5
Hammond ES 5 9 7 2 23 60.9 39.1
Phelps Luck ES 6 11 1 8 3 29 60.7 39.3
Jeffers Hill ES 5 8 10 23 56.5 43.5
Talbott Springs ES 6 13 15 1 35 54.3 45.7
Cradlerock ES 3 11 1 10 2 27 53.8 46.2
Thunder Hill ES 6 11 2 13 3 35 51.5 48.5
Deep Run ES 3 17 1 20 5 47 43.5 54.3
Veterans ES 5 9 5 15 4 38 42.4 57.6
Pointers Run ES 1 8 1 13 1 24 39.1 60.9
Bellows Spring ES 1 22 8 30 7 68 38.3 61.7
Fulton ES 2 10 17 3 32 37.5 62.5
Triadelphia Ridge ES 2 9 5 11 9 36 35.5 64.5
Dayton Oaks ES 10 3 11 9 33 33.3 66.7
Bushy Park ES 3 5 3 15 3 29 30.8 69.2
Clemens Crossing ES 1 7 2 7 11 28 30.8 69.2
Lisbon ES 1 7 1 11 8 28 29.6 70.4
Rockburn ES 9 1 15 8 33 28.1 71.9
Ilchester ES 1 8 18 9 36 25.0 75.0
Worthington ES 2 5 16 5 28 25.0 75.0
Northfield ES 2 4 4 12 7 29 24.0 76.0
Waverly ES 3 7 21 12 43 23.3 76.7
Atholton ES 1 4 13 4 22 22.7 77.3
Manor Woods ES 5 3 15 9 32 17.2 82.8
Centennial Lane ES 6 3 20 9 38 17.1 82.9
Clarksville ES 2 1 10 10 23 9.1 90.9
West Friendship 3 7 5 15 0.0 100.0
2013-2014 HCEA Job Satisfaction Survey
36
Worksite Strongly Agree
Agree Does Not Apply
Disagree Strongly Disagree
Grand Total
% AGREE
% DISAGREE
Middle 119 166 25 166 100 576 51.7 48.3
Patuxent Valley MS 16 7 23 100.0 0.0
Lake Elkhorn MS 28 5 1 1 35 97.1 2.9
Wilde Lake MS 16 9 1 1 27 96.2 3.8
Harper's Choice MS 17 15 1 2 35 94.1 5.9
Mayfield Woods MS 9 17 4 2 32 81.3 18.8
Oakland Mills MS 10 12 1 6 29 78.6 21.4
Murray Hill MS 9 25 1 8 2 45 77.3 22.7
Bonnie Branch MS 4 15 1 13 1 34 57.6 42.4
Ellicott Mills MS 2 11 1 8 3 25 54.2 45.8
Hammond MS 1 9 9 5 24 41.7 58.3
Elkridge Landing MS 2 9 15 5 31 35.5 64.5
Lime Kiln MS 1 6 1 9 5 22 33.3 66.7
Dunloggin MS 1 7 18 6 32 25.0 75.0
Patapsco MS 6 2 17 7 32 20.0 80.0
Burleigh Manor MS 4 3 7 14 28 16.0 84.0
Folly Quarter MS 1 4 1 16 15 37 13.9 86.1
Mount View MS 1 2 11 10 24 12.5 87.5
Glenwood MS 2 5 11 11 29 8.3 91.7
Clarksville MS 1 1 6 11 13 32 7.7 92.3
High 97 187 48 222 128 682 44.8 55.2
Hammond HS 22 24 2 4 3 55 86.8 13.2
Oakland Mills HS 26 27 6 8 3 70 82.8 17.2
Long Reach HS 13 26 3 10 4 56 73.6 26.4
Wilde Lake HS 9 23 3 9 4 48 71.1 28.9
Reservoir HS 9 29 6 28 4 76 54.3 45.7
Atholton HS 6 9 3 15 6 39 41.7 58.3
Mt. Hebron HS 4 9 6 13 11 43 35.1 64.9
Glenelg HS 2 7 2 20 4 35 27.3 72.7
River Hill HS 1 11 5 16 27 60 21.8 78.2
Marriotts Ridge HS 2 8 1 21 24 56 18.2 81.8
Howard HS 2 9 4 37 19 71 16.4 83.6
Centennial HS 1 5 7 41 19 73 9.1 90.9
Special 20 19 90 9 7 145 70.9 29.1
ARL 1 3 9 2 5 20 36.4 63.6
Ascend One 7 1 8 0.0 100.0
Cedar Lane 1 8 7 3 1 20 69.2 30.8
Central Office 1 44 1 46 50.0 50.0
Health Services 5 16 1 1 23 71.4 28.6
Homewood Center 18 2 20 100.0 0.0
Old Cedar Lane 7 1 8 0.0 100.0
Grand Total 419 801 222 845 409 2697 49.3 50.7
2013-2014 HCEA Job Satisfaction Survey
37
18) Too much instructional time is spent administering assessments.
Worksite Strongly Agree
Agree Does Not Apply
Disagree Strongly Disagree
Grand Total
% AGREE
% DISAGREE
Elementary 272 454 136 358 63 1294 62.7 36.4
Thunder Hill ES 19 13 1 2 35 94.1 5.9
Ilchester ES 9 20 2 5 36 85.3 14.7
Bushy Park ES 13 9 3 3 1 29 84.6 15.4
Hollifield Station ES 18 10 5 4 2 39 82.4 17.6
Waverly ES 16 14 6 4 3 43 81.1 18.9
Waterloo ES 12 22 8 8 1 51 79.1 20.9
Talbott Springs ES 9 17 2 7 35 78.8 21.2
Dayton Oaks ES 13 8 5 5 2 33 75.0 25.0
Lisbon ES 3 16 2 4 1 28 73.1 19.2
Clarksville ES 4 9 5 4 1 23 72.2 27.8
Ducketts Lane ES 8 5 4 18 72.2 22.2
Longfellow ES 6 8 1 6 21 70.0 30.0
Worthington ES 7 10 3 4 3 28 68.0 28.0
St. John's Lane ES 11 6 3 6 2 28 68.0 32.0
Northfield ES 7 12 1 9 29 67.9 32.1
Clemens Crossing ES 3 13 4 6 2 28 66.7 33.3
Deep Run ES 6 22 5 12 2 47 66.7 33.3
Triadelphia Ridge ES 7 12 7 8 2 36 65.5 34.5
Centennial Lane ES 9 15 1 11 2 38 64.9 35.1
Swansfield ES 10 19 2 16 1 48 63.0 37.0
Manor Woods ES 9 10 1 9 3 32 61.3 38.7
Phelps Luck ES 3 12 3 9 2 29 57.7 42.3
Running Brook ES 5 7 2 6 2 23 57.1 38.1
Elkridge ES 6 7 8 2 23 56.5 43.5
Jeffers Hill ES 1 9 5 8 23 55.6 44.4
Cradlerock ES 4 8 5 8 27 54.5 36.4
Guilford ES 3 10 7 3 24 54.2 41.7
Laurel Woods ES 2 13 2 11 2 30 53.6 46.4
Hammond ES 2 8 4 5 3 23 52.6 42.1
Stevens Forest ES 2 11 1 12 26 52.0 48.0
Bellows Spring ES 13 17 10 23 5 68 51.7 48.3
Fulton ES 4 11 1 15 1 32 48.4 51.6
Gorman Crossing ES 5 10 3 14 2 34 48.4 51.6
Forest Ridge ES 5 9 2 14 31 48.3 48.3
Bollman Bridge ES 4 12 4 15 3 38 47.1 52.9
Rockburn ES 2 12 3 13 3 33 46.7 53.3
West Friendship ES 3 3 2 6 1 15 46.2 53.8
Veterans ES 3 9 11 15 38 44.4 55.6
Pointers Run ES 5 4 3 7 5 24 42.9 57.1
Atholton ES 1 7 13 1 22 36.4 63.6
Bryant Woods ES 5 8 12 26 27.8 66.7
2013-2014 HCEA Job Satisfaction Survey
38
Worksite Strongly Agree
Agree Does Not Apply
Disagree Strongly Disagree
Grand Total
% AGREE
% DISAGREE
Middle 228 193 44 96 13 576 79.1 20.5
Ellicott Mills MS 14 9 2 25 92.0 8.0
Murray Hill MS 26 10 4 5 45 87.8 12.2
Lime Kiln MS 11 6 2 2 1 22 85.0 15.0
Burleigh Manor MS 12 10 2 4 28 84.6 15.4
Elkridge Landing MS 12 12 2 5 31 82.8 17.2
Patapsco MS 10 14 3 5 32 82.8 17.2
Folly Quarter MS 15 13 3 6 37 82.4 17.6
Oakland Mills MS 17 6 1 4 1 29 82.1 17.9
Patuxent Valley MS 8 10 1 2 2 23 81.8 18.2
Glenwood MS 12 8 4 4 1 29 80.0 20.0
Bonnie Branch MS 12 14 1 6 1 34 78.8 21.2
Lake Elkhorn MS 10 15 3 6 1 35 78.1 21.9
Clarksville MS 14 7 4 7 32 75.0 25.0
Mount View MS 9 8 1 6 24 73.9 26.1
Dunloggin MS 9 12 3 6 1 32 72.4 24.1
Wilde Lake MS 9 9 2 6 1 27 72.0 28.0
Hammond MS 7 10 5 2 24 70.8 29.2
Harper's Choice MS 10 11 5 7 2 35 70.0 30.0
Mayfield Woods MS 11 9 3 8 32 69.0 27.6
High 212 228 70 144 23 682 71.9 27.3
Oakland Mills HS 29 19 12 7 2 70 82.8 15.5
Glenelg HS 16 10 3 5 1 35 81.3 18.8
Wilde Lake HS 23 14 1 9 1 48 78.7 21.3
Hammond HS 18 22 4 10 1 55 78.4 21.6
Marriotts Ridge HS 19 24 1 10 1 56 78.2 20.0
River Hill HS 20 21 7 8 4 60 77.4 22.6
Centennial HS 17 25 15 15 73 72.4 25.9
Long Reach HS 13 22 5 12 3 56 68.6 29.4
Atholton HS 13 13 1 10 2 39 68.4 31.6
Howard HS 20 23 5 19 3 71 65.2 33.3
Reservoir HS 15 23 11 24 3 76 58.5 41.5
Mt. Hebron HS 9 12 5 15 2 43 55.3 44.7
Special 15 23 88 14 2 146 65.5 27.6
ARL 4 3 7 2 2 20 53.8 30.8
Ascend One 1 3 3 1 8 80.0 20.0
Cedar Lane 4 7 5 4 20 73.3 26.7
Central Office 3 2 40 46 83.3 0.0
Health Services 24 24
Homewood Center 3 8 2 7 20 61.1 38.9
Old Cedar Lane 7 8 0.0 0.0
Grand Total 727 898 338 612 101 2698 68.9 30.2
2013-2014 HCEA Job Satisfaction Survey
39
19) HCPSS professional development experiences are meaningful and worthwhile.
Worksite Strongly Agree
Agree Does Not Apply
Disagree Strongly Disagree
Grand Total
% AGREE
% DISAGREE
Elementary 64 593 38 394 189 1294 52.3 46.4
Hammond ES 4 13 3 3 23 85.0 15.0
Cradlerock ES 3 19 1 2 1 27 84.6 11.5
West Friendship ES 1 10 1 3 15 78.6 21.4
Jeffers Hill ES 1 17 5 23 78.3 21.7
Worthington ES 3 16 1 5 3 28 70.4 29.6
Running Brook ES 1 15 4 3 23 69.6 30.4
Stevens Forest ES 1 16 1 5 2 26 68.0 28.0
Deep Run ES 4 25 3 13 2 47 65.9 34.1
Triadelphia Ridge ES 1 22 1 7 5 36 65.7 34.3
Bryant Woods ES 5 11 1 8 1 26 64.0 36.0
Bollman Bridge ES 2 22 9 4 38 63.2 34.2
Pointers Run ES 2 13 5 4 24 62.5 37.5
Atholton ES 2 11 1 5 3 22 61.9 38.1
Ducketts Lane ES 1 10 6 1 18 61.1 38.9
Elkridge ES 1 13 8 1 23 60.9 39.1
Phelps Luck ES 2 15 1 7 2 29 60.7 32.1
Fulton ES 18 1 10 3 32 58.1 41.9
Northfield ES 2 14 1 10 2 29 57.1 42.9
Waverly ES 2 22 12 6 43 55.8 41.9
Clarksville ES 2 10 1 6 4 23 54.5 45.5
Talbott Springs ES 3 16 12 3 35 54.3 42.9
St. John's Lane ES 3 12 6 6 28 53.6 42.9
Waterloo ES 1 25 1 17 5 51 52.0 44.0
Manor Woods ES 1 15 1 13 2 32 51.6 48.4
Centennial Lane ES 1 17 2 11 6 38 50.0 47.2
Forest Ridge ES 2 13 1 8 6 31 50.0 46.7
Gorman Crossing ES 2 14 2 10 5 34 50.0 46.9
Guilford ES 1 11 5 6 24 50.0 45.8
Hollifield Station ES 1 16 2 15 5 39 45.9 54.1
Longfellow ES 2 7 1 8 3 21 45.0 55.0
Rockburn ES 14 1 14 4 33 43.8 56.3
Swansfield ES 20 20 7 48 41.7 56.3
Laurel Woods ES 12 1 11 6 30 41.4 58.6
Thunder Hill ES 1 13 1 16 4 35 41.2 58.8
Bellows Spring ES 4 21 3 22 18 68 38.5 61.5
Bushy Park ES 2 9 7 11 29 37.9 62.1
Veterans ES 13 1 17 7 38 35.1 64.9
Dayton Oaks ES 11 1 11 10 33 34.4 65.6
Ilchester ES 10 1 14 10 36 28.6 68.6
Lisbon ES 7 1 13 7 28 25.9 74.1
Clemens Crossing ES 5 1 14 8 28 18.5 81.5
2013-2014 HCEA Job Satisfaction Survey
40
Worksite Strongly Agree
Agree Does Not Apply
Disagree Strongly Disagree
Grand Total
% AGREE
% DISAGREE
Middle 27 241 14 175 114 576 47.7 51.4
Bonnie Branch MS 3 24 5 2 34 79.4 20.6
Mount View MS 3 13 2 6 24 66.7 33.3
Murray Hill MS 3 24 2 12 3 45 62.8 34.9
Patuxent Valley MS 1 13 8 1 23 60.9 39.1
Wilde Lake MS 2 13 1 10 1 27 57.7 42.3
Patapsco MS 1 17 9 5 32 56.3 43.8
Lake Elkhorn MS 4 14 1 8 7 35 52.9 44.1
Mayfield Woods MS 1 14 1 6 10 32 48.4 51.6
Hammond MS 11 6 7 24 45.8 54.2
Harper's Choice MS 2 13 2 14 4 35 45.5 54.5
Dunloggin MS 1 13 1 11 6 32 45.2 54.8
Oakland Mills MS 1 11 1 10 5 29 42.9 53.6
Glenwood MS 1 9 2 8 9 29 37.0 63.0
Ellicott Mills MS 9 10 6 25 36.0 64.0
Burleigh Manor MS 10 13 5 28 35.7 64.3
Elkridge Landing MS 2 8 1 8 12 31 33.3 66.7
Folly Quarter MS 12 12 13 37 32.4 67.6
Clarksville MS 2 7 2 14 6 32 30.0 66.7
Lime Kiln MS 6 9 6 22 27.3 68.2
High 27 167 31 242 209 682 29.8 69.3
Mt. Hebron HS 2 15 4 14 7 43 43.6 53.8
Long Reach HS 2 18 4 18 14 56 38.5 61.5
Reservoir HS 6 22 2 25 20 76 37.8 60.8
Glenelg HS 1 10 1 12 11 35 32.4 67.6
River Hill HS 3 15 1 24 17 60 30.5 69.5
Howard HS 3 16 6 24 22 71 29.2 70.8
Centennial HS 2 18 4 27 22 73 29.0 71.0
Marriotts Ridge HS 4 12 21 18 56 28.6 69.6
Atholton HS 1 10 10 17 39 28.2 69.2
Hammond HS 2 12 1 29 11 55 25.9 74.1
Oakland Mills HS 12 6 20 31 70 18.8 79.7
Wilde Lake HS 1 7 2 18 19 48 17.4 80.4
Special 16 58 23 31 18 146 60.2 39.8
ARL 3 8 2 4 3 20 61.1 38.9
Ascend One 6 1 1 8 85.7 14.3
Cedar Lane 1 11 7 1 20 60.0 40.0
Central Office 8 14 16 2 6 46 73.3 26.7
Health Services 2 9 1 8 4 24 47.8 52.2
Homewood Center 1 7 1 8 3 20 42.1 57.9
Old Cedar Lane 1 3 2 1 1 8 66.7 33.3
Grand Total 134 1059 106 842 530 2698 46.0 52.9
2013-2014 HCEA Job Satisfaction Survey
41
20) Increased workload has contributed to a decline in my morale.
Worksite Strongly Agree
Agree Does Not Apply
Disagree Strongly Disagree
Grand Total
% AGREE
% DISAGREE
Elementary 472 443 31 266 77 1294 72.4 27.2
Thunder Hill ES 22 11 2 35 94.3 5.7
Bushy Park ES 21 6 1 1 29 93.1 6.9
Centennial Lane ES 26 9 2 1 38 92.1 7.9
Manor Woods ES 17 11 4 32 87.5 12.5
Pointers Run ES 12 7 2 1 2 24 86.4 13.6
Talbott Springs ES 20 9 1 5 35 85.3 14.7
Stevens Forest ES 5 16 1 2 2 26 84.0 16.0
Clemens Crossing ES 11 11 1 4 1 28 81.5 18.5
St. John's Lane ES 15 7 1 4 1 28 81.5 18.5
Bollman Bridge ES 17 13 6 2 38 78.9 21.1
Jeffers Hill ES 5 13 5 23 78.3 21.7
Waverly ES 21 9 4 6 3 43 76.9 23.1
Swansfield ES 16 20 1 9 2 48 76.6 23.4
Hollifield Station ES 20 9 1 8 1 39 76.3 23.7
Gorman Crossing ES 10 15 1 6 2 34 75.8 24.2
Veterans ES 9 19 1 8 1 38 75.7 24.3
Ilchester ES 15 12 7 2 36 75.0 25.0
Triadelphia Ridge ES 9 18 8 36 75.0 22.2
Forest Ridge ES 12 11 7 1 31 74.2 25.8
Fulton ES 14 9 1 6 1 32 74.2 22.6
Rockburn ES 13 10 2 6 1 33 74.2 22.6
Elkridge ES 9 8 5 1 23 73.9 26.1
Worthington ES 9 10 2 6 28 73.1 23.1
Ducketts Lane ES 2 10 1 4 1 18 70.6 29.4
Clarksville ES 6 9 1 6 1 23 68.2 31.8
Lisbon ES 7 12 7 2 28 67.9 32.1
Bellows Spring ES 24 22 16 6 68 67.6 32.4
Dayton Oaks ES 10 12 9 2 33 66.7 33.3
Waterloo ES 17 16 1 10 7 51 66.0 34.0
Cradlerock ES 6 11 1 9 27 65.4 34.6
Hammond ES 7 8 6 2 23 65.2 34.8
Running Brook ES 8 7 5 3 23 65.2 34.8
Atholton ES 5 9 4 4 22 63.6 36.4
Deep Run ES 16 12 2 11 6 47 62.2 37.8
Guilford ES 7 7 1 6 3 24 60.9 39.1
Northfield ES 7 10 1 9 2 29 60.7 39.3
Phelps Luck ES 4 10 3 9 3 29 53.8 46.2
Longfellow ES 7 4 7 2 21 52.4 42.9
Laurel Woods ES 6 9 13 2 30 50.0 50.0
Bryant Woods ES 3 8 1 10 4 26 44.0 56.0
West Friendship ES 2 4 7 2 15 40.0 60.0
2013-2014 HCEA Job Satisfaction Survey
42
Worksite Strongly Agree
Agree Does Not Apply
Disagree Strongly Disagree
Grand Total
% AGREE
% DISAGREE
Middle 257 170 18 101 26 576 76.5 22.8
Mount View MS 13 10 1 24 95.8 4.2
Hammond MS 14 6 2 2 24 90.9 9.1
Patuxent Valley MS 14 6 1 1 1 23 90.9 9.1
Ellicott Mills MS 16 6 1 2 25 88.0 12.0
Folly Quarter MS 22 9 1 2 2 37 86.1 11.1
Mayfield Woods MS 15 11 1 3 2 32 83.9 16.1
Patapsco MS 15 8 4 3 1 32 82.1 14.3
Lime Kiln MS 12 6 4 22 81.8 18.2
Wilde Lake MS 11 11 5 27 81.5 18.5
Clarksville MS 17 8 1 5 1 32 80.6 19.4
Elkridge Landing MS 17 6 2 5 1 31 79.3 20.7
Bonnie Branch MS 13 13 7 1 34 76.5 23.5
Oakland Mills MS 13 9 5 1 29 75.9 20.7
Glenwood MS 16 5 1 4 3 29 75.0 25.0
Burleigh Manor MS 8 12 6 2 28 71.4 28.6
Dunloggin MS 7 13 2 8 2 32 66.7 33.3
Murray Hill MS 13 14 1 16 1 45 61.4 38.6
Lake Elkhorn MS 12 7 1 10 4 35 55.9 41.2
Harper's Choice MS 9 10 1 14 1 35 55.9 44.1
High 301 213 22 101 44 682 77.9 22.0
Marriotts Ridge HS 35 11 1 8 1 56 83.6 16.4
Hammond HS 25 19 1 5 5 55 81.5 18.5
River Hill HS 30 18 1 7 4 60 81.4 18.6
Mt. Hebron HS 18 15 2 4 4 43 80.5 19.5
Glenelg HS 12 15 1 5 2 35 79.4 20.6
Oakland Mills HS 34 20 2 11 3 70 79.4 20.6
Atholton HS 18 12 1 6 2 39 78.9 21.1
Howard HS 33 22 1 9 5 71 78.6 20.0
Wilde Lake HS 23 13 2 7 3 48 78.3 21.7
Centennial HS 29 24 5 10 5 73 77.9 22.1
Long Reach HS 19 20 1 12 4 56 70.9 29.1
Reservoir HS 25 24 4 17 6 76 68.1 31.9
Special 21 40 16 51 17 145 47.3 52.7
ARL 3 8 2 6 1 20 61.1 38.9
Ascend One 3 2 3 8 37.5 62.5
Cedar Lane 3 8 1 6 2 20 57.9 42.1
Central Office 8 9 9 12 8 46 45.9 54.1
Health Services 1 4 2 14 2 23 23.8 76.2
Homewood Center 5 6 1 8 20 57.9 42.1
Old Cedar Lane 1 2 1 3 1 8 42.9 57.1
Grand Total 1051 866 87 519 164 2697 73.4 26.2
2013-2014 HCEA Job Satisfaction Survey
43
21) I am paid fairly.
Worksite Strongly Agree
Agree Does Not Apply
Disagree Strongly Disagree
Grand Total
% AGREE
% DISAGREE
Elementary 22 251 490 524 1294 21.1 78.4
Jeffers Hill ES 2 9 6 6 23 47.8 52.2
Bryant Woods ES 1 8 10 7 26 34.6 65.4
Cradlerock ES 9 12 6 27 33.3 66.7
Guilford ES 2 6 8 8 24 33.3 66.7
Dayton Oaks ES 10 10 13 33 30.3 69.7
Deep Run ES 14 20 13 47 29.8 70.2
Veterans ES 11 10 17 38 28.9 71.1
Clemens Crossing ES 1 7 11 9 28 28.6 71.4
Waterloo ES 1 13 20 17 51 27.5 72.5
Rockburn ES 1 8 15 9 33 27.3 72.7
Laurel Woods ES 1 7 14 8 30 26.7 73.3
Bollman Bridge ES 10 9 19 38 26.3 73.7
Clarksville ES 6 5 12 23 26.1 73.9
Elkridge ES 6 7 10 23 26.1 73.9
Lisbon ES 7 10 11 28 25.0 75.0
Triadelphia Ridge ES 9 17 10 36 25.0 75.0
Longfellow ES 1 4 8 8 21 23.8 76.2
Stevens Forest ES 1 5 10 10 26 23.1 76.9
Fulton ES 1 6 11 13 32 21.9 75.0
Manor Woods ES 7 11 14 32 21.9 78.1
Running Brook ES 5 7 11 23 21.7 78.3
Worthington ES 2 4 10 12 28 21.4 78.6
Waverly ES 1 8 18 16 43 20.9 79.1
Pointers Run ES 5 7 12 24 20.8 79.2
West Friendship ES 3 7 4 15 20.0 73.3
Atholton ES 4 10 8 22 18.2 81.8
St. John's Lane ES 2 3 10 13 28 17.9 82.1
Phelps Luck ES 1 4 13 11 29 17.2 82.8
Ducketts Lane ES 1 2 7 8 18 16.7 83.3
Swansfield ES 8 22 17 48 16.7 81.3
Hollifield Station ES 6 14 19 39 15.4 84.6
Bellows Spring ES 10 31 27 68 14.7 85.3
Ilchester ES 5 19 11 36 13.9 83.3
Forest Ridge ES 4 10 17 31 12.9 87.1
Gorman Crossing ES 1 3 10 20 34 11.8 88.2
Bushy Park ES 1 2 12 14 29 10.3 89.7
Northfield ES 1 2 17 9 29 10.3 89.7
Hammond ES 2 10 10 23 8.7 87.0
Talbott Springs ES 3 10 22 35 8.6 91.4
Thunder Hill ES 3 12 20 35 8.6 91.4
Centennial Lane ES 3 10 23 38 7.9 86.8
2013-2014 HCEA Job Satisfaction Survey
44
Worksite Strongly Agree
Agree Does Not Apply
Disagree Strongly Disagree
Grand Total
% AGREE
% DISAGREE
Middle 12 130 190 236 576 24.7 74.0
Lake Elkhorn MS 2 15 8 9 35 48.6 48.6
Patapsco MS 13 10 9 32 40.6 59.4
Patuxent Valley MS 1 7 6 9 23 34.8 65.2
Harper's Choice MS 12 14 9 35 34.3 65.7
Wilde Lake MS 1 8 6 12 27 33.3 66.7
Dunloggin MS 2 8 9 12 32 31.3 65.6
Murray Hill MS 1 12 16 16 45 28.9 71.1
Glenwood MS 1 6 9 10 29 24.1 65.5
Bonnie Branch MS 8 9 17 34 23.5 76.5
Elkridge Landing MS 2 4 12 13 31 19.4 80.6
Lime Kiln MS 1 3 7 10 22 18.2 77.3
Oakland Mills MS 5 8 15 29 17.2 79.3
Hammond MS 1 3 10 10 24 16.7 83.3
Mount View MS 4 7 12 24 16.7 79.2
Folly Quarter MS 6 11 20 37 16.2 83.8
Ellicott Mills MS 4 12 9 25 16.0 84.0
Mayfield Woods MS 5 10 17 32 15.6 84.4
Burleigh Manor MS 4 12 12 28 14.3 85.7
Clarksville MS 3 14 15 32 9.4 90.6
High 14 136 241 289 682 22.0 77.7
Glenelg HS 1 11 15 8 35 34.3 65.7
Long Reach HS 3 16 27 9 56 33.9 64.3
Wilde Lake HS 3 10 16 18 48 27.1 70.8
Howard HS 1 16 20 34 71 23.9 76.1
Reservoir HS 1 17 22 36 76 23.7 76.3
Hammond HS 13 17 25 55 23.6 76.4
Atholton HS 1 7 14 17 39 20.5 79.5
Centennial HS 1 13 30 29 73 19.2 80.8
Mt. Hebron HS 8 15 20 43 18.6 81.4
Oakland Mills HS 1 12 20 37 70 18.6 81.4
River Hill HS 1 8 24 27 60 15.0 85.0
Marriotts Ridge HS 1 5 21 29 56 10.7 89.3
Special 10 57 47 32 146 45.9 54.1
ARL 2 9 4 5 20 55.0 45.0
Ascend One 4 3 1 8 50.0 50.0
Cedar Lane 2 6 7 5 20 40.0 60.0
Central Office 1 18 14 13 46 41.3 58.7
Health Services 1 8 12 3 24 37.5 62.5
Homewood Center 3 7 5 5 20 50.0 50.0
Old Cedar Lane 1 5 2 8 75.0 25.0
Grand Total 58 574 968 1081 2698 23.4 75.9
2013-2014 HCEA Job Satisfaction Survey
45
22) I have confidence in the leadership exhibited by the HCPSS Superintendent.
Worksite Strongly Agree
Agree Does Not Apply
Disagree Strongly Disagree
Grand Total
% AGREE
% DISAGREE
Elementary 57 554 34 363 261 1294 48.5 49.5
Bryant Woods ES 6 16 2 2 26 84.6 15.4
Stevens Forest ES 2 19 4 26 80.8 15.4
Lisbon ES 2 20 5 28 78.6 17.9
Atholton ES 2 15 2 3 22 77.3 22.7
Swansfield ES 2 35 6 5 48 77.1 22.9
Jeffers Hill ES 2 13 1 3 3 23 68.2 27.3
Phelps Luck ES 3 16 1 5 4 29 67.9 32.1
Fulton ES 1 20 4 7 32 65.6 34.4
Cradlerock ES 3 14 9 1 27 63.0 37.0
Longfellow ES 2 11 5 3 21 61.9 38.1
Hammond ES 3 11 5 3 23 60.9 34.8
Hollifield Station ES 22 2 11 4 39 59.5 40.5
Veterans ES 21 12 5 38 55.3 44.7
Elkridge ES 2 10 1 8 2 23 54.5 45.5
Rockburn ES 17 1 12 3 33 53.1 46.9
Bellows Spring ES 2 33 2 15 15 68 53.0 45.5
Waverly ES 2 18 5 14 3 43 52.6 44.7
Clarksville ES 12 4 6 23 52.2 43.5
Dayton Oaks ES 2 15 6 9 33 51.5 45.5
Laurel Woods ES 15 9 6 30 50.0 50.0
St. John's Lane ES 2 11 1 10 3 28 48.1 48.1
Running Brook ES 1 9 2 9 2 23 47.6 52.4
Ilchester ES 1 15 2 8 7 36 47.1 44.1
Waterloo ES 2 21 1 18 8 51 46.0 52.0
Pointers Run ES 11 9 3 24 45.8 50.0
Ducketts Lane ES 8 7 3 18 44.4 55.6
Clemens Crossing ES 2 9 3 8 6 28 44.0 56.0
Worthington ES 3 9 6 9 28 42.9 53.6
Triadelphia Ridge ES 1 14 13 7 36 41.7 55.6
Gorman Crossing ES 3 10 2 11 8 34 40.6 59.4
Northfield ES 1 9 2 10 7 29 37.0 63.0
Bollman Bridge ES 14 14 9 38 36.8 60.5
West Friendship ES 5 1 4 4 15 35.7 57.1
Deep Run ES 2 14 1 22 8 47 34.8 65.2
Forest Ridge ES 10 2 10 7 31 34.5 58.6
Talbott Springs ES 11 1 13 10 35 32.4 67.6
Manor Woods ES 1 8 1 9 11 32 29.0 64.5
Guilford ES 2 4 11 6 24 25.0 70.8
Bushy Park ES 4 1 11 12 29 14.3 82.1
Thunder Hill ES 3 1 8 22 35 8.8 88.2
Centennial Lane ES 2 11 25 38 5.3 94.7
2013-2014 HCEA Job Satisfaction Survey
46
Worksite Strongly Agree
Agree Does Not Apply
Disagree Strongly Disagree
Grand Total
% AGREE
% DISAGREE
Middle 18 240 19 183 108 576 46.3 52.2
Murray Hill MS 2 34 8 1 45 80.0 20.0
Harper's Choice MS 3 17 2 13 35 60.6 39.4
Burleigh Manor MS 3 13 1 7 4 28 59.3 40.7
Wilde Lake MS 1 12 3 11 27 54.2 45.8
Dunloggin MS 2 14 2 11 3 32 53.3 46.7
Lime Kiln MS 11 1 5 5 22 52.4 47.6
Patuxent Valley MS 1 11 8 3 23 52.2 47.8
Oakland Mills MS 15 8 6 29 51.7 48.3
Lake Elkhorn MS 1 17 13 2 35 51.4 42.9
Patapsco MS 15 2 10 4 32 50.0 46.7
Bonnie Branch MS 16 7 11 34 47.1 52.9
Elkridge Landing MS 2 11 1 8 8 31 43.3 53.3
Hammond MS 1 8 2 7 4 24 40.9 50.0
Clarksville MS 11 1 10 10 32 35.5 64.5
Ellicott Mills MS 8 9 7 25 32.0 64.0
Mayfield Woods MS 10 10 11 32 31.3 65.6
Glenwood MS 1 7 1 10 10 29 28.6 71.4
Mount View MS 5 15 4 24 20.8 79.2
Folly Quarter MS 1 5 3 13 15 37 17.6 82.4
High 18 239 23 246 147 682 39.0 59.6
Long Reach HS 1 28 17 10 56 51.8 48.2
Mt. Hebron HS 1 19 1 15 6 43 47.6 50.0
Reservoir HS 2 28 1 30 14 76 40.0 58.7
Howard HS 4 23 2 31 11 71 39.1 60.9
Hammond HS 20 3 21 10 55 38.5 59.6
River Hill HS 1 22 20 17 60 38.3 61.7
Centennial HS 26 4 27 14 73 37.7 59.4
Oakland Mills HS 2 22 4 25 16 70 36.4 62.1
Atholton HS 1 12 3 11 11 39 36.1 61.1
Wilde Lake HS 16 2 15 13 48 34.8 60.9
Marriotts Ridge HS 5 14 18 19 56 33.9 66.1
Glenelg HS 1 9 3 16 6 35 31.3 68.8
Special 14 71 12 35 13 146 63.4 35.8
ARL 8 2 8 2 20 44.4 55.6
Ascend One 3 4 1 8 37.5 62.5
Cedar Lane 12 5 2 1 20 80.0 20.0
Central Office 4 22 1 13 5 46 57.8 40.0
Health Services 4 14 4 1 1 24 90.0 10.0
Homewood Center 3 9 5 3 20 60.0 40.0
Old Cedar Lane 3 3 2 8 75.0 25.0
Grand Total 107 1104 88 827 529 2698 46.4 52.0
2013-2014 HCEA Job Satisfaction Survey
47
23) I have confidence in the leadership exhibited by the Howard County Board of Education.
Worksite Strongly Agree
Agree Does Not Apply
Disagree Strongly Disagree
Grand Total
% AGREE
% DISAGREE
Elementary 27 359 29 470 386 1294 30.5 67.7
Bryant Woods ES 1 16 4 5 26 65.4 34.6
Rockburn ES 17 1 9 6 33 53.1 46.9
Atholton ES 1 10 1 6 4 22 52.4 47.6
West Friendship ES 7 4 2 15 46.7 40.0
Stevens Forest ES 1 10 2 10 2 26 45.8 50.0
Jeffers Hill ES 10 1 6 5 23 45.5 50.0
Phelps Luck ES 12 2 11 4 29 44.4 55.6
Hammond ES 2 8 6 6 23 43.5 52.2
Dayton Oaks ES 1 13 10 8 33 42.4 54.5
Fulton ES 1 12 10 9 32 40.6 59.4
Swansfield ES 2 17 1 19 8 48 40.4 57.4
Clemens Crossing ES 2 8 3 4 10 28 40.0 56.0
Laurel Woods ES 1 11 11 7 30 40.0 60.0
Cradlerock ES 3 7 12 5 27 37.0 63.0
Veterans ES 14 11 13 38 36.8 63.2
Gorman Crossing ES 2 10 1 11 10 34 36.4 63.6
Triadelphia Ridge ES 13 16 6 36 36.1 61.1
Clarksville ES 8 8 5 23 34.8 56.5
Lisbon ES 1 8 11 8 28 32.1 67.9
Deep Run ES 15 24 8 47 31.9 68.1
Hollifield Station ES 12 1 15 11 39 31.6 68.4
Bellows Spring ES 1 19 3 22 21 68 30.8 66.2
Waterloo ES 15 1 20 13 51 30.0 66.0
Guilford ES 2 5 10 7 24 29.2 70.8
Northfield ES 1 7 12 9 29 27.6 72.4
Bollman Bridge ES 10 12 15 38 26.3 71.1
Elkridge ES 6 10 7 23 26.1 73.9
Manor Woods ES 8 9 14 32 25.0 71.9
Pointers Run ES 6 11 7 24 25.0 75.0
Longfellow ES 2 3 9 7 21 23.8 76.2
Ducketts Lane ES 4 11 3 18 22.2 77.8
Waverly ES 2 6 2 19 12 43 19.5 75.6
Worthington ES 5 1 13 9 28 18.5 81.5
Ilchester ES 6 3 16 9 36 18.2 75.8
Forest Ridge ES 5 1 12 13 31 16.7 83.3
Running Brook ES 3 2 11 7 23 14.3 85.7
St. John's Lane ES 1 3 16 8 28 14.3 85.7
Talbott Springs ES 4 2 10 18 35 12.1 84.8
Bushy Park ES 3 1 8 16 29 10.7 85.7
Centennial Lane ES 2 10 26 38 5.3 94.7
Thunder Hill ES 1 11 23 35 2.9 97.1
2013-2014 HCEA Job Satisfaction Survey
48
Worksite Strongly Agree
Agree Does Not Apply
Disagree Strongly Disagree
Grand Total
% AGREE
% DISAGREE
Middle 8 132 16 212 199 576 25.0 73.4
Murray Hill MS 1 18 2 20 4 45 44.2 55.8
Harper's Choice MS 2 11 2 14 6 35 39.4 60.6
Patuxent Valley MS 8 9 6 23 34.8 65.2
Lake Elkhorn MS 12 14 6 35 34.3 57.1
Burleigh Manor MS 9 1 12 6 28 33.3 66.7
Oakland Mills MS 9 9 10 29 31.0 65.5
Patapsco MS 2 7 3 11 9 32 31.0 69.0
Wilde Lake MS 1 7 1 13 5 27 30.8 69.2
Dunloggin MS 9 14 9 32 28.1 71.9
Hammond MS 6 2 6 9 24 27.3 68.2
Glenwood MS 1 6 1 7 12 29 25.0 67.9
Ellicott Mills MS 6 9 10 25 24.0 76.0
Mayfield Woods MS 6 12 14 32 18.8 81.3
Lime Kiln MS 4 12 6 22 18.2 81.8
Bonnie Branch MS 5 9 19 34 14.7 82.4
Elkridge Landing MS 1 3 9 18 31 12.9 87.1
Clarksville MS 4 8 19 32 12.5 84.4
Folly Quarter MS 2 3 11 21 37 5.9 94.1
Mount View MS 1 13 10 24 0.0 100.0
High 6 137 19 272 234 682 21.6 76.3
Long Reach HS 1 25 18 11 56 46.4 51.8
Atholton HS 1 10 3 10 14 39 30.6 66.7
River Hill HS 15 1 27 17 60 25.4 74.6
Mt. Hebron HS 9 2 18 14 43 22.0 78.0
Glenelg HS 7 2 12 14 35 21.2 78.8
Centennial HS 14 3 27 25 73 20.0 74.3
Oakland Mills HS 13 4 27 25 70 19.7 78.8
Reservoir HS 1 13 1 34 24 76 18.7 77.3
Wilde Lake HS 8 2 16 21 48 17.4 80.4
Howard HS 1 11 1 36 22 71 17.1 82.9
Hammond HS 8 25 19 55 14.5 80.0
Marriotts Ridge HS 2 4 22 28 56 10.7 89.3
Special 8 62 9 40 25 145 51.5 47.8
ARL 7 2 7 4 20 38.9 61.1
Ascend One 3 4 1 8 37.5 62.5
Cedar Lane 1 7 6 4 2 20 57.1 42.9
Central Office 1 24 15 6 46 54.3 45.7
Health Services 2 9 1 7 4 23 50.0 50.0
Homewood Center 1 10 2 7 20 55.0 45.0
Old Cedar Lane 3 2 1 1 8 62.5 25.0
Grand Total 49 690 73 994 844 2697 28.2 70.0
2013-2014 HCEA Job Satisfaction Survey
49
24) I have confidence in the leadership exhibited by the Howard County Education Assn. (HCEA).
Worksite Strongly Agree
Agree Does Not Apply
Disagree Strongly Disagree
Grand Total
% AGREE
% DISAGREE
Elementary 456 709 27 70 22 1294 91.9 7.3
Atholton ES 9 13 22 100.0 0.0
Cradlerock ES 10 17 27 100.0 0.0
Ducketts Lane ES 5 13 18 100.0 0.0
Elkridge ES 12 11 23 100.0 0.0
Laurel Woods ES 8 22 30 100.0 0.0
Pointers Run ES 12 12 24 100.0 0.0
Running Brook ES 10 10 3 23 100.0 0.0
Talbott Springs ES 19 16 35 100.0 0.0
Veterans ES 15 23 38 100.0 0.0
Fulton ES 12 18 1 1 32 96.8 3.2
Bushy Park ES 13 14 1 29 96.4 0.0
Worthington ES 19 8 1 28 96.4 3.6
Clemens Crossing ES 11 15 1 1 28 96.3 3.7
Thunder Hill ES 14 19 1 1 35 94.3 5.7
Waterloo ES 14 32 2 3 51 93.9 6.1
Bellows Spring ES 23 38 3 2 2 68 93.8 6.2
Manor Woods ES 17 13 1 32 93.8 3.1
Rockburn ES 10 20 1 2 33 93.8 6.3
Forest Ridge ES 10 19 1 1 31 93.5 6.5
Deep Run ES 21 22 1 3 47 93.5 6.5
West Friendship ES 2 12 15 93.3 0.0
Lisbon ES 14 11 1 2 28 92.6 7.4
Centennial Lane ES 17 18 2 1 38 92.1 7.9
Guilford ES 9 13 1 1 24 91.7 8.3
Swansfield ES 12 31 1 4 48 91.5 8.5
Hammond ES 8 13 1 23 91.3 4.3
Jeffers Hill ES 5 16 1 23 91.3 4.3
Dayton Oaks ES 10 20 1 1 33 90.9 6.1
Gorman Crossing ES 15 15 1 2 1 34 90.9 9.1
Northfield ES 5 20 1 3 29 89.3 10.7
Hollifield Station ES 13 20 2 2 2 39 89.2 10.8
Phelps Luck ES 7 17 2 2 1 29 88.9 11.1
Triadelphia Ridge ES 11 21 4 36 88.9 11.1
Bryant Woods ES 8 15 2 1 26 88.5 11.5
Stevens Forest ES 10 13 2 1 26 88.5 11.5
Clarksville ES 5 15 1 1 23 87.0 8.7
St. John's Lane ES 14 9 3 2 28 82.1 17.9
Longfellow ES 4 13 3 1 21 81.0 19.0
Waverly ES 7 27 1 4 3 43 81.0 16.7
Bollman Bridge ES 10 20 6 1 38 78.9 18.4
Ilchester ES 6 15 5 8 1 36 67.7 29.0
2013-2014 HCEA Job Satisfaction Survey
50
Worksite Strongly Agree
Agree Does Not Apply
Disagree Strongly Disagree
Grand Total
% AGREE
% DISAGREE
Middle 189 308 12 48 9 576 88.1 10.1
Bonnie Branch MS 16 17 34 97.1 0.0
Harper's Choice MS 16 17 1 1 35 97.1 2.9
Lake Elkhorn MS 9 22 2 1 35 93.9 3.0
Dunloggin MS 13 17 1 1 32 93.8 6.3
Ellicott Mills MS 6 17 2 25 92.0 8.0
Folly Quarter MS 19 12 3 3 37 91.2 8.8
Burleigh Manor MS 7 18 3 28 89.3 10.7
Oakland Mills MS 8 17 1 2 1 29 89.3 10.7
Wilde Lake MS 7 17 1 1 27 88.9 7.4
Mount View MS 11 10 2 24 87.5 8.3
Patuxent Valley MS 4 16 3 23 87.0 13.0
Hammond MS 6 13 2 2 24 86.4 9.1
Lime Kiln MS 7 12 2 1 22 86.4 13.6
Murray Hill MS 9 28 2 5 45 86.0 11.6
Clarksville MS 16 11 1 1 32 84.4 6.3
Elkridge Landing MS 11 15 4 1 31 83.9 16.1
Patapsco MS 9 17 1 5 32 83.9 16.1
Mayfield Woods MS 5 20 3 3 32 78.1 18.8
Glenwood MS 10 12 7 29 75.9 24.1
High 209 367 10 62 26 682 85.7 13.1
River Hill HS 22 35 1 1 60 95.0 3.3
Howard HS 20 45 5 1 71 91.5 8.5
Reservoir HS 26 42 5 3 76 89.5 10.5
Marriotts Ridge HS 27 23 5 1 56 89.3 10.7
Hammond HS 20 29 4 1 55 89.1 9.1
Wilde Lake HS 17 24 1 3 1 48 87.2 8.5
Long Reach HS 12 34 2 5 3 56 85.2 14.8
Centennial HS 23 36 3 9 1 73 84.3 14.3
Mt. Hebron HS 11 23 1 5 3 43 81.0 19.0
Oakland Mills HS 18 36 1 9 5 70 78.3 20.3
Atholton HS 7 21 1 3 6 39 73.7 23.7
Glenelg HS 6 19 1 8 35 73.5 23.5
Special 38 79 9 15 3 145 86.0 13.2
ARL 3 13 2 2 20 88.9 11.1
Ascend One 3 3 2 8 75.0 25.0
Cedar Lane 6 13 1 20 100.0 0.0
Central Office 8 22 3 10 3 46 69.8 30.2
Health Services 9 12 2 23 100.0 0.0
Homewood Center 6 13 1 20 95.0 5.0
Old Cedar Lane 3 3 1 8 85.7 0.0
Grand Total 892 1463 58 195 60 2697 89.2 9.7
2013-2014 HCEA Job Satisfaction Survey
51
25) I feel that HCPSS offers me the possibility of advancing professionally in the field of education.
Worksite Strongly Agree
Agree Does Not Apply
Disagree Strongly Disagree
Grand Total
% AGREE
% DISAGREE
Elementary 136 762 75 235 78 1294 73.7 25.7
Worthington ES 8 16 2 2 28 92.3 7.7
Hammond ES 4 15 2 2 23 90.5 9.5
Jeffers Hill ES 5 15 2 1 23 87.0 13.0
Running Brook ES 2 18 2 1 23 87.0 13.0
Rockburn ES 2 24 3 3 1 33 86.7 13.3
Lisbon ES 3 20 1 2 2 28 85.2 14.8
Bryant Woods ES 5 16 1 3 26 84.0 12.0
Hollifield Station ES 5 25 3 4 2 39 83.3 16.7
Manor Woods ES 3 21 3 3 2 32 82.8 17.2
Atholton ES 3 15 4 22 81.8 18.2
Bollman Bridge ES 6 25 7 38 81.6 18.4
West Friendship ES 2 10 1 2 15 80.0 20.0
Gorman Crossing ES 4 22 1 4 3 34 78.8 21.2
Veterans ES 26 5 6 1 38 78.8 21.2
Elkridge ES 1 17 5 23 78.3 21.7
Swansfield ES 5 31 2 6 4 48 78.3 21.7
Phelps Luck ES 2 19 2 4 2 29 77.8 22.2
Ilchester ES 6 18 5 4 1 36 77.4 16.1
Stevens Forest ES 2 17 1 6 26 76.0 24.0
Laurel Woods ES 6 15 2 5 2 30 75.0 25.0
Talbott Springs ES 4 22 5 4 35 74.3 25.7
Pointers Run ES 3 14 1 6 24 73.9 26.1
Bellows Spring ES 5 42 2 12 6 68 71.2 27.3
Clemens Crossing ES 2 15 4 5 1 28 70.8 25.0
Deep Run ES 4 27 3 12 1 47 70.5 29.5
Bushy Park ES 2 17 2 6 2 29 70.4 29.6
Cradlerock ES 4 15 6 2 27 70.4 29.6
Forest Ridge ES 2 17 4 6 1 31 70.4 25.9
Ducketts Lane ES 3 8 2 4 18 68.8 25.0
Waverly ES 4 24 2 10 3 43 68.3 31.7
Waterloo ES 2 29 5 11 4 51 67.4 32.6
Guilford ES 3 13 5 3 24 66.7 33.3
Longfellow ES 2 12 6 1 21 66.7 33.3
Triadelphia Ridge ES 2 20 3 8 3 36 66.7 33.3
Dayton Oaks ES 7 14 1 7 3 33 65.6 31.3
St. John's Lane ES 2 15 2 6 3 28 65.4 34.6
Clarksville ES 3 11 7 2 23 60.9 39.1
Fulton ES 2 16 2 10 2 32 60.0 40.0
Northfield ES 3 13 1 7 5 29 57.1 42.9
Thunder Hill ES 3 15 3 9 5 35 56.3 43.8
Centennial Lane ES 18 5 12 3 38 54.5 45.5
2013-2014 HCEA Job Satisfaction Survey
52
Worksite Strongly Agree
Agree Does Not Apply
Disagree Strongly Disagree
Grand Total
% AGREE
% DISAGREE
Middle 45 301 23 147 53 576 62.6 36.2
Lime Kiln MS 1 16 1 1 3 22 81.0 19.0
Patapsco MS 4 21 1 5 1 32 80.6 19.4
Murray Hill MS 4 28 1 8 4 45 72.7 27.3
Lake Elkhorn MS 3 21 1 9 35 70.6 26.5
Bonnie Branch MS 2 21 1 7 2 34 69.7 27.3
Dunloggin MS 3 16 4 8 1 32 67.9 32.1
Hammond MS 3 12 1 4 3 24 65.2 30.4
Wilde Lake MS 1 16 9 1 27 63.0 37.0
Burleigh Manor MS 2 14 2 8 2 28 61.5 38.5
Patuxent Valley MS 1 13 7 2 23 60.9 39.1
Glenwood MS 3 14 1 8 2 29 60.7 35.7
Harper's Choice MS 3 17 2 8 5 35 60.6 39.4
Mount View MS 3 10 2 8 1 24 59.1 40.9
Ellicott Mills MS 14 1 5 5 25 58.3 41.7
Oakland Mills MS 2 14 1 10 2 29 57.1 42.9
Mayfield Woods MS 1 16 9 5 32 53.1 43.8
Elkridge Landing MS 5 10 2 10 4 31 51.7 48.3
Clarksville MS 2 13 1 9 5 32 48.4 45.2
Folly Quarter MS 2 15 1 14 5 37 47.2 52.8
High 51 361 26 167 67 682 62.8 35.7
Marriotts Ridge HS 6 33 3 13 1 56 73.6 26.4
Mt. Hebron HS 6 23 1 8 5 43 69.0 31.0
Reservoir HS 8 44 12 9 76 68.4 27.6
Glenelg HS 2 21 1 7 4 35 67.6 32.4
Howard HS 7 37 4 18 5 71 65.7 34.3
Long Reach HS 1 33 4 12 6 56 65.4 34.6
Centennial HS 1 43 4 17 4 73 63.8 30.4
Wilde Lake HS 3 25 3 12 4 48 62.2 35.6
River Hill HS 8 29 17 4 60 61.7 35.0
Atholton HS 4 18 3 8 6 39 61.1 38.9
Oakland Mills HS 3 34 3 21 9 70 55.2 44.8
Hammond HS 2 21 22 10 55 41.8 58.2
Special 13 68 6 39 19 146 57.9 41.4
ARL 12 2 5 1 20 66.7 33.3
Ascend One 1 5 1 1 8 75.0 25.0
Cedar Lane 1 12 1 5 1 20 68.4 31.6
Central Office 4 18 1 12 10 46 48.9 48.9
Health Services 2 6 1 10 5 24 34.8 65.2
Homewood Center 4 11 1 3 1 20 78.9 21.1
Old Cedar Lane 1 4 3 8 62.5 37.5
Grand Total 245 1492 130 588 217 2698 67.6 31.3
2013-2014 HCEA Job Satisfaction Survey
53
26) In my position, I receive appropriate and adequate support and training.
Worksite Strongly Agree
Agree Does Not Apply
Disagree Strongly Disagree
Grand Total
% AGREE
% DISAGREE
Elementary 176 751 7 262 90 1294 72.0 27.4
Running Brook ES 4 17 1 1 23 91.3 8.7
Jeffers Hill ES 2 18 2 1 23 87.0 13.0
Laurel Woods ES 8 17 3 1 30 83.3 13.3
Atholton ES 5 13 2 2 22 81.8 18.2
Dayton Oaks ES 7 20 6 33 81.8 18.2
Cradlerock ES 2 20 3 2 27 81.5 18.5
Swansfield ES 5 34 6 3 48 81.3 18.8
Bryant Woods ES 9 12 4 1 26 80.8 19.2
Stevens Forest ES 2 19 3 2 26 80.8 19.2
West Friendship ES 6 6 2 1 15 80.0 20.0
Gorman Crossing ES 7 20 6 1 34 79.4 20.6
Guilford ES 5 14 5 24 79.2 20.8
Veterans ES 30 6 2 38 78.9 21.1
Deep Run ES 7 29 1 7 3 47 78.3 21.7
Hammond ES 5 13 3 23 78.3 13.0
Bollman Bridge ES 5 24 9 38 76.3 23.7
Longfellow ES 2 14 5 21 76.2 23.8
Forest Ridge ES 3 19 2 5 1 31 75.9 20.7
Northfield ES 3 19 6 1 29 75.9 24.1
Lisbon ES 21 5 2 28 75.0 25.0
Phelps Luck ES 4 17 1 4 2 29 75.0 21.4
Triadelphia Ridge ES 5 22 7 2 36 75.0 25.0
Hollifield Station ES 5 24 7 3 39 74.4 25.6
Clarksville ES 3 14 4 2 23 73.9 26.1
Waterloo ES 8 29 12 2 51 72.5 27.5
Ducketts Lane ES 2 11 4 18 72.2 22.2
Clemens Crossing ES 5 15 5 2 28 71.4 25.0
Worthington ES 5 14 1 6 2 28 70.4 29.6
Elkridge ES 1 15 5 2 23 69.6 30.4
Fulton ES 4 18 9 1 32 68.8 31.3
Pointers Run ES 3 13 7 1 24 66.7 33.3
Rockburn ES 5 17 9 2 33 66.7 33.3
Ilchester ES 2 21 1 9 3 36 65.7 34.3
Talbott Springs ES 8 15 9 3 35 65.7 34.3
Bushy Park ES 2 16 7 4 29 62.1 37.9
Waverly ES 7 19 1 13 3 43 61.9 38.1
Bellows Spring ES 7 35 17 9 68 61.8 38.2
Manor Woods ES 5 14 9 3 32 59.4 37.5
Thunder Hill ES 5 15 9 6 35 57.1 42.9
St. John's Lane ES 2 13 10 3 28 53.6 46.4
Centennial Lane ES 1 15 14 8 38 42.1 57.9
2013-2014 HCEA Job Satisfaction Survey
54
Worksite Strongly Agree
Agree Does Not Apply
Disagree Strongly Disagree
Grand Total
% AGREE
% DISAGREE
Middle 72 341 2 114 39 576 72.0 26.7
Patapsco MS 4 22 5 1 32 81.3 18.8
Lake Elkhorn MS 4 24 5 1 35 80.0 17.1
Burleigh Manor MS 3 18 1 6 28 77.8 22.2
Bonnie Branch MS 4 22 5 3 34 76.5 23.5
Clarksville MS 1 23 4 3 32 75.0 21.9
Harper's Choice MS 4 22 5 3 35 74.3 22.9
Elkridge Landing MS 6 17 6 2 31 74.2 25.8
Wilde Lake MS 1 19 7 27 74.1 25.9
Patuxent Valley MS 4 13 5 1 23 73.9 26.1
Murray Hill MS 11 22 10 1 45 73.3 24.4
Lime Kiln MS 1 15 3 1 22 72.7 18.2
Mount View MS 4 13 5 2 24 70.8 29.2
Folly Quarter MS 5 21 8 3 37 70.3 29.7
Dunloggin MS 6 16 9 1 32 68.8 31.3
Glenwood MS 5 14 5 4 29 65.5 31.0
Oakland Mills MS 3 15 1 7 3 29 64.3 35.7
Ellicott Mills MS 2 14 8 1 25 64.0 36.0
Hammond MS 3 12 6 3 24 62.5 37.5
Mayfield Woods MS 1 19 5 6 32 62.5 34.4
High 77 385 3 151 60 682 68.0 31.1
Reservoir HS 14 48 9 4 76 81.6 17.1
River Hill HS 11 34 10 4 60 75.0 23.3
Centennial HS 9 44 2 11 7 73 74.6 25.4
Howard HS 5 48 14 3 71 74.6 23.9
Mt. Hebron HS 7 25 8 3 43 74.4 25.6
Marriotts Ridge HS 5 34 16 1 56 69.6 30.4
Atholton HS 6 19 10 3 39 64.1 33.3
Wilde Lake HS 6 24 11 5 48 62.5 33.3
Oakland Mills HS 3 40 15 12 70 61.4 38.6
Glenelg HS 1 19 12 3 35 57.1 42.9
Long Reach HS 3 28 1 15 9 56 56.4 43.6
Hammond HS 7 22 20 6 55 52.7 47.3
Special 18 76 3 37 10 146 65.7 32.9
ARL 4 6 1 7 1 20 52.6 42.1
Ascend One 8 8 100.0 0.0
Cedar Lane 2 12 4 1 20 70.0 25.0
Central Office 5 20 1 13 7 46 55.6 44.4
Health Services 1 14 9 24 62.5 37.5
Homewood Center 4 12 1 3 20 84.2 15.8
Old Cedar Lane 2 4 1 1 8 75.0 25.0
Grand Total 343 1553 15 564 199 2698 70.7 28.4
2013-2014 HCEA Job Satisfaction Survey
55
27) In the last 12 months, I have experienced harassing behavior from colleagues.
Worksite Strongly Agree
Agree Does Not Apply
Disagree Strongly Disagree
Grand Total
% AGREE
% DISAGREE
Elementary 41 122 55 423 649 1294 13.2 86.5
Clarksville ES 2 5 2 7 7 23 33.3 66.7
Gorman Crossing ES 4 7 1 9 13 34 33.3 66.7
Guilford ES 1 5 3 7 8 24 28.6 71.4
Longfellow ES 2 4 8 7 21 28.6 71.4
Centennial Lane ES 3 7 16 12 38 26.3 73.7
Ilchester ES 3 6 1 11 14 36 25.7 71.4
Forest Ridge ES 6 5 8 12 31 23.1 76.9
Bollman Bridge ES 2 6 3 12 15 38 22.9 77.1
Fulton ES 1 5 1 10 15 32 19.4 80.6
Hollifield Station ES 7 1 13 18 39 18.4 81.6
Waterloo ES 3 6 2 14 26 51 18.4 81.6
Worthington ES 3 2 10 13 28 17.9 82.1
Bushy Park ES 5 10 14 29 17.2 82.8
Bryant Woods ES 1 3 2 10 10 26 16.7 83.3
Cradlerock ES 4 1 8 14 27 15.4 84.6
Waverly ES 3 3 4 14 19 43 15.4 84.6
Clemens Crossing ES 2 2 1 12 11 28 14.8 85.2
Thunder Hill ES 5 1 11 18 35 14.7 85.3
Running Brook ES 1 2 1 2 17 23 13.6 86.4
Swansfield ES 6 19 23 48 12.5 87.5
Talbott Springs ES 1 3 14 16 35 11.4 85.7
Northfield ES 3 2 8 16 29 11.1 88.9
Hammond ES 2 2 7 12 23 9.5 90.5
Triadelphia Ridge ES 1 2 3 10 20 36 9.1 90.9
Jeffers Hill ES 1 1 5 16 23 8.7 91.3
St. John's Lane ES 2 3 9 14 28 8.0 92.0
Stevens Forest ES 1 1 10 13 26 7.7 88.5
Lisbon ES 1 1 11 15 28 7.1 92.9
Phelps Luck ES 2 1 8 18 29 7.1 92.9
Dayton Oaks ES 2 3 9 19 33 6.7 93.3
Deep Run ES 1 2 2 18 24 47 6.7 93.3
Veterans ES 2 2 18 16 38 5.6 94.4
Elkridge ES 1 2 8 12 23 4.8 95.2
Atholton ES 1 4 17 22 4.5 95.5
Bellows Spring ES 1 2 1 26 38 68 4.5 95.5
Laurel Woods ES 1 8 21 30 3.3 96.7
Manor Woods ES 1 1 9 20 32 3.2 93.5
Ducketts Lane ES 1 6 11 18 0.0 100.0
Pointers Run ES 6 18 24 0.0 100.0
Rockburn ES 2 14 17 33 0.0 100.0
West Friendship ES 1 4 10 15 0.0 100.0
2013-2014 HCEA Job Satisfaction Survey
56
Worksite Strongly Agree
Agree Does Not Apply
Disagree Strongly Disagree
Grand Total
% AGREE
% DISAGREE
Middle 20 51 33 188 280 576 13.1 86.2
Patuxent Valley MS 1 7 1 4 10 23 36.4 63.6
Clarksville MS 4 4 1 13 10 32 25.8 74.2
Wilde Lake MS 6 2 9 9 27 24.0 72.0
Dunloggin MS 2 5 2 6 17 32 23.3 76.7
Harper's Choice MS 2 5 2 15 11 35 21.2 78.8
Hammond MS 2 2 2 11 7 24 18.2 81.8
Mount View MS 2 2 8 12 24 16.7 83.3
Burleigh Manor MS 4 2 10 12 28 15.4 84.6
Murray Hill MS 2 3 3 17 20 45 11.9 88.1
Oakland Mills MS 1 2 2 11 13 29 11.1 88.9
Glenwood MS 3 1 8 17 29 10.7 89.3
Folly Quarter MS 1 2 2 7 25 37 8.6 91.4
Bonnie Branch MS 2 2 13 17 34 6.3 93.8
Mayfield Woods MS 2 10 20 32 6.3 93.8
Patapsco MS 1 1 12 18 32 6.3 93.8
Ellicott Mills MS 1 2 6 16 25 4.3 95.7
Elkridge Landing MS 1 3 8 17 31 3.6 89.3
Lake Elkhorn MS 1 2 12 19 35 3.0 93.9
Lime Kiln MS 4 8 10 22 0.0 100.0
High 35 61 32 229 321 682 14.8 84.6
Long Reach HS 4 11 1 20 20 56 27.3 72.7
Wilde Lake HS 2 9 4 17 15 48 25.0 72.7
River Hill HS 6 6 6 16 26 60 22.2 77.8
Atholton HS 6 1 4 11 17 39 20.0 80.0
Centennial HS 3 9 3 28 30 73 17.1 82.9
Hammond HS 4 4 2 23 22 55 15.1 84.9
Glenelg HS 2 3 18 12 35 14.3 85.7
Reservoir HS 3 5 3 29 35 76 11.0 87.7
Oakland Mills HS 2 5 2 22 38 70 10.3 88.2
Howard HS 2 4 4 22 38 71 9.0 89.6
Marriotts Ridge HS 1 2 1 12 40 56 5.5 94.5
Mt. Hebron HS 2 2 11 28 43 4.9 95.1
Special 11 22 8 36 68 146 23.9 75.4
ARL 1 3 1 2 12 20 21.1 73.7
Ascend One 1 7 8 0.0 100.0
Cedar Lane 3 6 1 4 6 20 47.4 52.6
Central Office 3 9 3 11 20 46 27.9 72.1
Health Services 2 1 1 11 9 24 13.0 87.0
Homewood Center 1 2 2 6 9 20 16.7 83.3
Old Cedar Lane 1 1 1 5 8 25.0 75.0
Grand Total 107 256 128 876 1318 2698 14.1 85.4
2013-2014 HCEA Job Satisfaction Survey
57
28) In the last 12 months, I have experienced harassing behavior from administrators/supervisors.
Worksite Strongly Agree
Agree Does Not Apply
Disagree Strongly Disagree
Grand Total
% AGREE
% DISAGREE
Elementary 32 68 63 425 696 1294 8.1 91.1
Worthington ES 3 3 7 15 28 21.4 78.6
St. John's Lane ES 1 4 3 11 9 28 20.0 80.0
Centennial Lane ES 3 4 16 15 38 18.4 81.6
Gorman Crossing ES 1 5 1 9 18 34 18.2 81.8
Fulton ES 3 2 2 11 14 32 16.7 83.3
Waverly ES 4 2 4 16 17 43 15.4 84.6
Bellows Spring ES 3 7 1 22 35 68 14.9 85.1
Elkridge ES 1 2 2 6 12 23 14.3 85.7
Longfellow ES 1 2 11 7 21 14.3 85.7
West Friendship ES 1 1 1 2 10 15 14.3 85.7
Clemens Crossing ES 1 2 1 10 14 28 11.1 88.9
Swansfield ES 5 20 22 48 10.4 87.5
Waterloo ES 1 4 3 12 31 51 10.4 89.6
Guilford ES 1 1 4 8 10 24 10.0 90.0
Hammond ES 1 1 1 9 11 23 9.1 90.9
Running Brook ES 1 1 1 3 16 23 9.1 86.4
Bryant Woods ES 1 1 3 11 10 26 8.7 91.3
Talbott Springs ES 3 15 15 35 8.6 85.7
Pointers Run ES 2 3 19 24 8.3 91.7
Triadelphia Ridge ES 2 3 10 20 36 6.1 90.9
Bollman Bridge ES 2 4 12 20 38 5.9 94.1
Thunder Hill ES 2 1 14 18 35 5.9 94.1
Veterans ES 1 1 3 16 16 38 5.7 91.4
Hollifield Station ES 2 1 16 20 39 5.3 94.7
Clarksville ES 1 2 9 11 23 4.8 95.2
Atholton ES 1 4 17 22 4.5 95.5
Jeffers Hill ES 1 5 17 23 4.3 95.7
Cradlerock ES 1 2 9 15 27 4.0 96.0
Stevens Forest ES 1 1 12 12 26 4.0 96.0
Forest Ridge ES 1 4 9 17 31 3.7 96.3
Northfield ES 1 2 9 17 29 3.7 96.3
Lisbon ES 1 10 16 28 3.6 92.9
Bushy Park ES 1 10 18 29 3.4 96.6
Phelps Luck ES 1 8 19 29 3.4 93.1
Deep Run ES 1 2 19 25 47 2.2 97.8
Dayton Oaks ES 4 7 22 33 0.0 100.0
Ducketts Lane ES 1 5 12 18 0.0 100.0
Ilchester ES 2 12 21 36 0.0 97.1
Laurel Woods ES 9 21 30 0.0 100.0
Manor Woods ES 2 8 22 32 0.0 100.0
Rockburn ES 2 10 20 33 0.0 96.8
2013-2014 HCEA Job Satisfaction Survey
58
Worksite Strongly Agree
Agree Does Not Apply
Disagree Strongly Disagree
Grand Total
% AGREE
% DISAGREE
Middle 16 32 33 212 276 576 8.8 89.9
Clarksville MS 3 3 1 14 10 32 19.4 77.4
Hammond MS 2 2 2 11 7 24 18.2 81.8
Dunloggin MS 3 2 2 10 15 32 16.7 83.3
Mount View MS 3 7 14 24 12.5 87.5
Wilde Lake MS 1 2 3 11 10 27 12.5 87.5
Murray Hill MS 3 2 3 18 19 45 11.9 88.1
Oakland Mills MS 3 2 11 12 29 11.1 85.2
Mayfield Woods MS 1 2 9 20 32 9.4 90.6
Patuxent Valley MS 1 1 1 9 11 23 9.1 90.9
Ellicott Mills MS 2 1 10 12 25 8.3 91.7
Glenwood MS 2 1 10 16 29 7.1 92.9
Bonnie Branch MS 2 2 15 15 34 6.3 93.8
Patapsco MS 2 11 19 32 6.3 93.8
Lake Elkhorn MS 1 1 2 13 16 35 6.1 87.9
Harper's Choice MS 2 2 18 12 35 6.1 90.9
Elkridge Landing MS 1 2 9 17 31 3.4 89.7
Folly Quarter MS 1 2 7 27 37 2.9 97.1
Burleigh Manor MS 3 10 15 28 0.0 100.0
Lime Kiln MS 4 9 9 22 0.0 100.0
High 39 64 33 241 303 682 15.9 83.8
Long Reach HS 6 12 1 21 16 56 32.7 67.3
Howard HS 5 11 5 22 28 71 24.2 75.8
River Hill HS 6 6 5 20 22 60 21.8 76.4
Wilde Lake HS 2 7 4 17 17 48 20.5 77.3
Glenelg HS 4 2 17 12 35 17.1 82.9
Oakland Mills HS 4 5 2 23 36 70 13.2 86.8
Centennial HS 2 7 3 26 35 73 12.9 87.1
Marriotts Ridge HS 4 3 1 17 31 56 12.7 87.3
Hammond HS 3 3 2 24 23 55 11.3 88.7
Reservoir HS 1 5 3 33 34 76 8.2 91.8
Mt. Hebron HS 3 3 10 27 43 7.5 92.5
Atholton HS 2 4 11 22 39 5.7 94.3
Special 6 15 7 46 69 146 15.1 82.7
ARL 1 7 11 20 5.0 90.0
Ascend One 1 7 8 0.0 100.0
Cedar Lane 2 1 8 8 20 10.5 84.2
Central Office 4 6 3 13 20 46 23.3 76.7
Health Services 2 4 1 11 6 24 26.1 73.9
Homewood Center 2 2 5 11 20 11.1 88.9
Old Cedar Lane 1 6 8 0.0 87.5
Grand Total 93 179 136 924 1344 2698 10.6 88.5
2013-2014 HCEA Job Satisfaction Survey
59
29) In the last 12 months, I have experienced harassing behavior from parents.
Worksite Strongly Agree
Agree Does Not Apply
Disagree Strongly Disagree
Grand Total
% AGREE
% DISAGREE
Elementary 56 205 49 504 475 1294 21.0 78.6
Hollifield Station ES 4 12 1 11 11 39 42.1 57.9
Gorman Crossing ES 4 8 1 10 11 34 36.4 63.6
Ilchester ES 5 6 2 13 9 36 32.4 64.7
Cradlerock ES 8 1 8 10 27 30.8 69.2
Guilford ES 1 5 4 7 7 24 30.0 70.0
Centennial Lane ES 2 9 16 11 38 28.9 71.1
Elkridge ES 1 5 2 6 9 23 28.6 71.4
Worthington ES 4 4 8 12 28 28.6 71.4
Forest Ridge ES 1 6 5 10 8 31 26.9 69.2
Pointers Run ES 6 1 10 7 24 26.1 73.9
Waterloo ES 3 10 1 19 18 51 26.0 74.0
Northfield ES 1 6 2 11 9 29 25.9 74.1
Running Brook ES 2 3 2 7 8 23 23.8 71.4
Laurel Woods ES 1 6 11 12 30 23.3 76.7
St. John's Lane ES 6 2 12 8 28 23.1 76.9
Triadelphia Ridge ES 3 5 1 10 17 36 22.9 77.1
Hammond ES 5 1 11 6 23 22.7 77.3
Manor Woods ES 2 5 1 14 10 32 22.6 77.4
Dayton Oaks ES 3 4 1 15 10 33 21.9 78.1
Fulton ES 1 6 11 14 32 21.9 78.1
Waverly ES 1 7 4 14 17 43 20.5 79.5
Talbott Springs ES 2 5 13 15 35 20.0 80.0
Bellows Spring ES 2 11 2 22 31 68 19.7 80.3
Longfellow ES 1 3 10 7 21 19.0 81.0
Clemens Crossing ES 1 4 1 16 6 28 18.5 81.5
Clarksville ES 4 1 10 8 23 18.2 81.8
Lisbon ES 5 11 12 28 17.9 82.1
Bryant Woods ES 1 3 3 10 9 26 17.4 82.6
Jeffers Hill ES 1 3 8 11 23 17.4 82.6
Bushy Park ES 1 4 12 12 29 17.2 82.8
Veterans ES 1 5 3 14 14 38 17.1 80.0
Bollman Bridge ES 3 3 1 15 16 38 16.2 83.8
Swansfield ES 1 6 28 13 48 14.6 85.4
Phelps Luck ES 4 1 10 14 29 14.3 85.7
West Friendship ES 2 1 6 6 15 14.3 85.7
Stevens Forest ES 3 11 12 26 11.5 88.5
Thunder Hill ES 1 3 16 15 35 11.4 88.6
Ducketts Lane ES 2 8 8 18 11.1 88.9
Deep Run ES 4 2 25 16 47 8.9 91.1
Rockburn ES 1 2 14 15 33 3.2 93.5
Atholton ES 11 11 22 0.0 100.0
2013-2014 HCEA Job Satisfaction Survey
60
Worksite Strongly Agree
Agree Does Not Apply
Disagree Strongly Disagree
Grand Total
% AGREE
% DISAGREE
Middle 57 145 24 211 132 576 36.6 62.1
Ellicott Mills MS 4 10 1 9 1 25 58.3 41.7
Mount View MS 6 6 7 5 24 50.0 50.0
Folly Quarter MS 7 9 1 9 10 37 44.4 52.8
Clarksville MS 4 10 12 6 32 43.8 56.3
Patapsco MS 3 10 1 12 6 32 41.9 58.1
Bonnie Branch MS 2 11 2 12 7 34 40.6 59.4
Dunloggin MS 3 10 13 5 32 40.6 56.3
Glenwood MS 7 4 1 9 8 29 39.3 60.7
Mayfield Woods MS 3 9 12 8 32 37.5 62.5
Patuxent Valley MS 4 4 1 8 6 23 36.4 63.6
Hammond MS 1 7 1 14 1 24 34.8 65.2
Burleigh Manor MS 3 6 1 10 8 28 33.3 66.7
Wilde Lake MS 3 5 3 8 8 27 33.3 66.7
Elkridge Landing MS 3 6 3 7 12 31 32.1 67.9
Harper's Choice MS 2 8 3 15 6 35 31.3 65.6
Lime Kiln MS 6 2 9 5 22 30.0 70.0
Oakland Mills MS 1 7 1 12 8 29 28.6 71.4
Lake Elkhorn MS 9 1 14 9 35 26.5 67.6
Murray Hill MS 1 8 2 19 13 45 20.9 74.4
High 84 173 22 228 171 682 38.9 60.5
Mt. Hebron HS 7 14 1 11 10 43 50.0 50.0
River Hill HS 11 19 16 14 60 50.0 50.0
Marriotts Ridge HS 6 20 2 13 15 56 48.1 51.9
Atholton HS 5 10 3 9 11 39 41.7 55.6
Reservoir HS 9 21 1 28 16 76 40.0 58.7
Glenelg HS 6 7 1 14 7 35 38.2 61.8
Howard HS 11 15 3 25 17 71 38.2 61.8
Centennial HS 6 19 5 22 21 73 36.8 63.2
Hammond HS 7 12 1 21 14 55 35.2 64.8
Long Reach HS 4 15 1 24 12 56 34.5 65.5
Wilde Lake HS 6 8 3 19 10 48 31.1 64.4
Oakland Mills HS 6 13 1 26 24 70 27.5 72.5
Special 10 17 39 41 38 146 25.2 73.8
ARL 3 5 3 9 20 20.0 80.0
Ascend One 1 2 3 2 8 16.7 83.3
Cedar Lane 2 6 1 7 4 20 42.1 57.9
Central Office 1 1 28 9 7 46 11.1 88.9
Health Services 3 4 1 11 5 24 30.4 69.6
Homewood Center 1 3 1 6 9 20 21.1 78.9
Old Cedar Lane 2 1 2 2 8 28.6 57.1
Grand Total 207 540 134 984 816 2698 29.1 70.2
2013-2014 HCEA Job Satisfaction Survey
61
Level (All)
HCEA Member (All)
Profession (All)
Years in Education (All)
Years with HCPSS (All)
Questions Strongly
Agree Agree Disagree Strongly
Disagree Does Not Apply
Grand Total
1. Overall, morale at my school/worksite is good. 298 1306 663 427 2 2698
11.1% 48.4% 24.6% 15.8%
2. There is an atmosphere of open communication and trust in my school/worksite.
349 1469 604 260 5 2698
13.0% 54.5% 22.4% 9.7%
3. I personally feel successful in my work. 644 1540 383 113 2698
23.9% 57.1% 14.2% 4.2%
4. I feel involved in decision-making at my school/worksite.
302 1126 811 396 55 2698
11.4% 42.6% 30.7% 15.0%
5. I want to be involved in decision-making at my school/worksite.
729 1604 227 44 78 2698
27.8% 61.2% 8.7% 1.7%
6. In my school/worksite, I can speak openly about important issues without fear of repercussions.
498 1264 574 317 27 2698
18.6% 47.3% 21.5% 11.9%
7. In my school/worksite, I am treated as a professional.
763 1440 311 161 6 2698
28.3% 53.5% 11.6% 6.0%
8. There is good teamwork among staff in my school/worksite.
651 1454 416 165 5 2698
24.2% 54.0% 15.4% 6.1%
9. Non-instructional duties are assigned on an equitable basis in my school/worksite.
432 1350 441 230 225 2698
17.5% 54.6% 17.8% 9.3%
10. My working environment (i.e. safety, cleanliness. is conducive to success.
722 1427 361 166 12 2698
26.9% 53.1% 13.4% 6.2%
11. My work performance is evaluated fairly. 538 1384 439 271 52 2698
20.3% 52.3% 16.6% 10.2%
12. I am provided adequate time during the workday to plan, prepare for and do my job.
223 873 724 825 41 2698
8.4% 32.9% 27.2% 31.1%
13. I am provided adequate work and storage space to prepare for and do my job.
637 1512 367 151 12 2698
23.7% 56.3% 13.7% 5.6%
14. My administrators/supervisors respect the negotiated contracts.
766 1607 190 77 37 2698
28.8% 60.4% 7.1% 2.9%
2013-2014 HCEA Job Satisfaction Survey
62
15. My planning time is respected by my school administrations/supervisors.
551 1284 351 149 343 2698
23.4% 54.5% 14.9% 6.3%
16. In my school, administrators/supervisors support me in enforcing discipline.
552 1309 383 193 242 2698
22.5% 53.3% 15.6% 7.9%
17. In my school, student misbehavior interferes with learning.
419 801 845 409 193 2698
16.7% 32.0% 33.7% 16.3%
18. Too much instructional time is spent administering assessments.
727 898 612 101 329 2698
30.7% 37.9% 25.8% 4.3%
19. HCPSS professional development experiences are meaningful and worthwhile.
134 1059 842 530 104 2698
5.2% 40.8% 32.5% 20.4%
20. Increased workload has contributed to a decline in my morale.
1051 866 519 164 87 2698
40.3% 33.2% 19.9% 6.3%
21. I am paid fairly 58 574 968 1081 2698
2.1% 21.3% 35.9% 40.1%
22. I have confidence in the leadership exhibited by the HCPSS Superintendent.
107 1104 827 529 88 2698
4.1% 42.3% 31.7% 20.3%
23. I have confidence in the leadership exhibited by the Howard County Board of Education.
49 690 994 844 74 2698
1.9% 26.3% 37.9% 32.2%
24. I have confidence in the leadership exhibited by the Howard County Education Assn. (HCEA..
892 1463 195 60 59 2698
33.8% 55.4% 7.4% 2.3%
25. I feel that HCPSS offers me the possibility of advancing professionally in the field of education.
245 1492 588 217 131 2698
9.5% 58.1% 22.9% 8.5%
26. In my position, I receive appropriate and adequate support and training.
343 1553 564 199 15 2698
12.8% 57.9% 21.0% 7.4%
27. In the last 12 months, I have experienced harassing behavior from colleagues.
107 256 876 1318 128 2698
4.2% 10.0% 34.1% 51.3%
28. In the last 12 months, I have experienced harassing behavior from administrators/supervisors.
93 179 924 1344 136 2698
3.6% 7.0% 36.1% 52.5%
29. In the last 12 months, I have experienced harassing behavior from parents.
207 540 984 816 134 2698
8.1% 21.1% 38.4% 31.8%
2013-2014 HCEA Job Satisfaction Survey
63
Level (All)
HCEA Member (All)
Profession Teacher
Years in Education less than 5
Years with HCPSS (All)
Questions Strongly
Agree Agree Disagree Strongly
Disagree Does Not Apply
Grand Total
1. Overall, morale at my school/worksite is good. 26 117 50 22 215
12.1% 54.4% 23.3% 10.2%
2. There is an atmosphere of open communication and trust in my school/worksite.
20 131 42 19 215
9.3% 60.9% 19.5% 8.8%
3. I personally feel successful in my work. 33 142 36 3 215
15.3% 66.0% 16.7% 1.4%
4. I feel involved in decision-making at my school/worksite.
10 101 73 26 4 215
4.7% 47.9% 34.6% 12.3%
5. I want to be involved in decision-making at my school/worksite.
57 127 20 4 6 215
27.3% 60.8% 9.6% 1.9%
6. In my school/worksite, I can speak openly about important issues without fear of repercussions.
36 111 41 24 3 215
17.0% 52.4% 19.3% 11.3%
7. In my school/worksite, I am treated as a professional.
66 115 30 3 215
30.7% 53.5% 14.0% 1.4%
8. There is good teamwork among staff in my school/worksite.
59 108 33 15 215
27.4% 50.2% 15.3% 7.0%
9. Non-instructional duties are assigned on an equitable basis in my school/worksite.
31 124 30 16 14 215
15.4% 61.7% 14.9% 8.0%
10. My working environment (i.e. safety, cleanliness. is conducive to success.
72 110 21 10 1 215
33.6% 51.4% 9.8% 4.7%
11. My work performance is evaluated fairly. 42 121 36 15 1 215
19.6% 56.5% 16.8% 7.0%
12. I am provided adequate time during the workday to plan, prepare for and do my job.
10 78 73 53 215
4.7% 36.3% 34.0% 24.7%
13. I am provided adequate work and storage space to prepare for and do my job.
50 125 27 13 215
23.3% 58.1% 12.6% 6.0%
14. My administrators/supervisors respect the negotiated contracts.
66 130 14 1 1 215
30.8% 60.7% 6.5% 0.5%
2013-2014 HCEA Job Satisfaction Survey
64
15. My planning time is respected by my school administrations/supervisors.
52 112 41 9 1 215
24.3% 52.3% 19.2% 4.2%
16. In my school, administrators/supervisors support me in enforcing discipline.
46 121 31 14 3 215
21.7% 57.1% 14.6% 6.6%
17. In my school, student misbehavior interferes with learning.
34 78 73 23 5 215
16.2% 37.1% 34.8% 11.0%
18. Too much instructional time is spent administering assessments.
43 72 85 7 8 215
20.8% 34.8% 41.1% 3.4%
19. HCPSS professional development experiences are meaningful and worthwhile.
5 92 81 33 3 215
2.4% 43.4% 38.2% 15.6%
20. Increased workload has contributed to a decline in my morale.
66 82 47 11 9 215
32.0% 39.8% 22.8% 5.3%
21. I am paid fairly 5 42 87 80 215
2.3% 19.5% 40.5% 37.2%
22. I have confidence in the leadership exhibited by the HCPSS Superintendent.
6 108 62 30 7 215
2.9% 51.9% 29.8% 14.4%
23. I have confidence in the leadership exhibited by the Howard County Board of Education.
5 69 72 55 11 215
2.5% 33.8% 35.3% 27.0%
24. I have confidence in the leadership exhibited by the Howard County Education Assn. (HCEA)
62 131 13 3 5 215
29.5% 62.4% 6.2% 1.4%
25. I feel that HCPSS offers me the possibility of advancing professionally in the field of education.
27 139 39 5 3 215
12.7% 65.6% 18.4% 2.4%
26. In my position, I receive appropriate and adequate support and training.
22 137 44 11 1 215
10.3% 64.0% 20.6% 5.1%
27. In the last 12 months, I have experienced harassing behavior from colleagues.
4 15 54 128 14 215
2.0% 7.5% 26.9% 63.7%
28. In the last 12 months, I have experienced harassing behavior from administrators/supervisors.
5 12 61 123 13 215
2.5% 5.9% 30.2% 60.9%
29. In the last 12 months, I have experienced harassing behavior from parents.
12 43 73 74 13 215
5.9% 21.3% 36.1% 36.6%
2013-2014 HCEA Job Satisfaction Survey
65
Level (All)
HCEA Member (All)
Profession Teacher
Years in Education 5 to 10
Years with HCPSS (All)
Questions Strongly
Agree Agree Disagree Strongly
Disagree Does Not Apply
Grand Total
1. Overall, morale at my school/worksite is good. 41 231 114 58 444
9.2% 52.0% 25.7% 13.1%
2. There is an atmosphere of open communication and trust in my school/worksite.
53 247 107 35 444
11.9% 55.6% 24.1% 7.9%
3. I personally feel successful in my work. 96 255 70 18 444
21.6% 57.4% 15.8% 4.1%
4. I feel involved in decision-making at my school/worksite.
46 196 134 60 6 444
10.5% 44.7% 30.6% 13.7%
5. I want to be involved in decision-making at my school/worksite.
114 276 37 7 7 444
26.1% 63.2% 8.5% 1.6%
6. In my school/worksite, I can speak openly about important issues without fear of repercussions.
77 214 105 41 3 444
17.5% 48.5% 23.8% 9.3%
7. In my school/worksite, I am treated as a professional.
120 259 38 24 1 444
27.1% 58.5% 8.6% 5.4%
8. There is good teamwork among staff in my school/worksite.
107 249 70 17 444
24.1% 56.1% 15.8% 3.8%
9. Non-instructional duties are assigned on an equitable basis in my school/worksite.
70 242 73 38 20 444
16.5% 57.1% 17.2% 9.0%
10. My working environment (i.e. safety, cleanliness. is conducive to success.
111 242 64 26 444
25.0% 54.5% 14.4% 5.9%
11. My work performance is evaluated fairly. 87 218 70 60 9 444
20.0% 50.1% 16.1% 13.8%
12. I am provided adequate time during the workday to plan, prepare for and do my job.
31 120 118 173 2 444
7.0% 27.1% 26.7% 39.1%
13. I am provided adequate work and storage space to prepare for and do my job.
113 230 71 24 1 444
25.5% 51.9% 16.0% 5.4%
14. My administrators/supervisors respect the negotiated contracts.
129 277 23 10 2 444
2013-2014 HCEA Job Satisfaction Survey
66
29.2% 62.7% 5.2% 2.3%
15. My planning time is respected by my school administrations/supervisors.
102 241 66 28 4 444
23.2% 54.8% 15.0% 6.4%
16. In my school, administrators/supervisors support me in enforcing discipline.
99 220 79 30 15 444
23.1% 51.3% 18.4% 7.0%
17. In my school, student misbehavior interferes with learning.
76 122 150 87 6 444
17.4% 27.9% 34.2% 19.9%
18. Too much instructional time is spent administering assessments.
98 151 152 18 20 444
23.1% 35.6% 35.8% 4.2%
19. HCPSS professional development experiences are meaningful and worthwhile.
17 168 156 95 4 444
3.9% 38.2% 35.5% 21.6%
20. Increased workload has contributed to a decline in my morale.
202 164 59 13 4 444
45.9% 37.3% 13.4% 3.0%
21. I am paid fairly 4 82 137 221 444
0.9% 18.5% 30.9% 49.8%
22. I have confidence in the leadership exhibited by the HCPSS Superintendent.
20 173 147 90 10 444
4.6% 39.9% 33.9% 20.7%
23. I have confidence in the leadership exhibited by the Howard County Board of Education.
3 97 170 164 6 444
0.7% 22.1% 38.8% 37.4%
24. I have confidence in the leadership exhibited by the Howard County Education Assn. (HCEA)
168 237 19 13 5 444
38.3% 54.0% 4.3% 3.0%
25. I feel that HCPSS offers me the possibility of advancing professionally in the field of education.
52 249 100 28 11 444
12.0% 57.5% 23.1% 6.5%
26. In my position, I receive appropriate and adequate support and training.
50 270 87 32 2 444
11.3% 61.1% 19.7% 7.2%
27. In the last 12 months, I have experienced harassing behavior from colleagues.
15 41 144 233 10 444
3.5% 9.4% 33.2% 53.7%
28. In the last 12 months, I have experienced harassing behavior from administrators/supervisors.
18 32 156 222 14 444
4.2% 7.4% 36.3% 51.6%
29. In the last 12 months, I have experienced harassing behavior from parents.
46 105 161 124 6 444
10.5% 24.0% 36.8% 28.3%
2013-2014 HCEA Job Satisfaction Survey
67
Level (All)
HCEA Member (All)
Profession Teacher
Years in Education More than 10
Years with HCPSS (All)
Questions Strongly
Agree Agree Disagree Strongly
Disagree Does Not Apply
Grand Total
1. Overall, morale at my school/worksite is good. 119 577 345 269 1 1312
9.1% 44.0% 26.3% 20.5%
2. There is an atmosphere of open communication and trust in my school/worksite.
160 717 294 135 3 1312
12.2% 54.8% 22.5% 10.3%
3. I personally feel successful in my work. 324 717 196 65 1312
24.7% 54.6% 14.9% 5.0%
4. I feel involved in decision-making at my school/worksite.
160 542 395 205 9 1312
12.3% 41.6% 30.3% 15.7%
5. I want to be involved in decision-making at my school/worksite.
392 767 102 22 24 1312
30.4% 59.5% 7.9% 1.7%
6. In my school/worksite, I can speak openly about important issues without fear of repercussions.
247 598 276 173 9 1312
19.0% 45.9% 21.2% 13.3%
7. In my school/worksite, I am treated as a professional.
372 689 146 91 2 1312
28.4% 52.6% 11.1% 6.9%
8. There is good teamwork among staff in my school/worksite.
315 714 187 93 2 1312
24.0% 54.5% 14.3% 7.1%
9. Non-instructional duties are assigned on an equitable basis in my school/worksite.
243 649 225 116 69 1312
19.5% 52.2% 18.1% 9.3%
10. My working environment (i.e. safety, cleanliness. is conducive to success.
361 683 170 90 3 1312
27.6% 52.2% 13.0% 6.9%
11. My work performance is evaluated fairly. 238 650 252 146 19 1312
18.4% 50.3% 19.5% 11.3%
12. I am provided adequate time during the workday to plan, prepare for and do my job.
87 344 379 495 1 1312
6.6% 26.2% 28.9% 37.8%
13. I am provided adequate work and storage space to prepare for and do my job.
309 721 184 88 1312
23.6% 55.0% 14.0% 6.7%
14. My administrators/supervisors respect the negotiated contracts.
379 790 89 39 9 1312
2013-2014 HCEA Job Satisfaction Survey
68
29.1% 60.6% 6.8% 3.0%
15. My planning time is respected by my school administrations/supervisors.
322 708 174 80 16 1312
24.8% 54.6% 13.4% 6.2%
16. In my school, administrators/supervisors support me in enforcing discipline.
275 663 190 111 62 1312
22.0% 53.0% 15.2% 8.9%
17. In my school, student misbehavior interferes with learning.
195 371 455 231 42 1312
15.4% 29.2% 35.8% 18.2%
18. Too much instructional time is spent administering assessments.
466 467 253 55 57 1312
37.1% 37.2% 20.2% 4.4%
19. HCPSS professional development experiences are meaningful and worthwhile.
69 486 417 307 15 1312
5.3% 37.5% 32.2% 23.7%
20. Increased workload has contributed to a decline in my morale.
656 419 153 67 12 1312
50.5% 32.2% 11.8% 5.2%
21. I am paid fairly 33 268 482 519 1312
2.5% 20.4% 36.7% 39.6%
22. I have confidence in the leadership exhibited by the HCPSS Superintendent.
37 436 459 322 41 1312
2.9% 34.3% 36.1% 25.3%
23. I have confidence in the leadership exhibited by the Howard County Board of Education.
16 248 500 492 36 1312
1.3% 19.4% 39.2% 38.6%
24. I have confidence in the leadership exhibited by the Howard County Education Assn. (HCEA)
491 659 100 29 21 1312
38.0% 51.0% 7.7% 2.2%
25. I feel that HCPSS offers me the possibility of advancing professionally in the field of education.
115 718 274 126 69 1312
9.3% 57.8% 22.0% 10.1%
26. In my position, I receive appropriate and adequate support and training.
161 734 293 104 6 1312
12.3% 56.2% 22.4% 8.0%
27. In the last 12 months, I have experienced harassing behavior from colleagues.
52 138 423 628 64 1312
4.2% 11.1% 33.9% 50.3%
28. In the last 12 months, I have experienced harassing behavior from administrators/supervisors.
46 92 445 653 65 1312
3.7% 7.4% 35.7% 52.4%
29. In the last 12 months, I have experienced harassing behavior from parents.
107 287 469 402 39 1312
8.4% 22.5% 36.8% 31.6%
2013-2014 HCEA Job Satisfaction Survey
69
Level Elementary
HCEA Member (All)
Profession Teacher
Years in Education (All)
Years with HCPSS (All)
Questions Strongly
Agree Agree Disagree Strongly
Disagree Does Not Apply
Grand Total
1. Overall, morale at my school/worksite is good. 113 454 219 127 913
12.4% 49.7% 24.0% 13.9%
2. There is an atmosphere of open communication and trust in my school/worksite.
148 514 180 67 1 913
16.2% 56.4% 19.7% 7.3%
3. I personally feel successful in my work. 219 523 132 29 913
24.0% 57.3% 14.5% 3.2%
4. I feel involved in decision-making at my school/worksite.
122 419 252 108 10 913
13.5% 46.4% 27.9% 12.0%
5. I want to be involved in decision-making at my school/worksite.
294 533 60 7 16 913
32.8% 59.4% 6.7% 0.8%
6. In my school/worksite, I can speak openly about important issues without fear of repercussions.
198 443 170 88 8 913
21.9% 49.0% 18.8% 9.7%
7. In my school/worksite, I am treated as a professional.
303 492 76 35 1 913
33.2% 53.9% 8.3% 3.8%
8. There is good teamwork among staff in my school/worksite.
243 519 108 42 1 913
26.6% 56.9% 11.8% 4.6%
9. Non-instructional duties are assigned on an equitable basis in my school/worksite.
169 493 139 43 62 913
19.9% 57.9% 16.3% 5.1%
10. My working environment (i.e. safety, cleanliness. is conducive to success.
260 485 118 44 2 913
28.5% 53.2% 13.0% 4.8%
11. My work performance is evaluated fairly. 222 472 126 74 17 913
24.8% 52.7% 14.1% 8.3%
12. I am provided adequate time during the workday to plan, prepare for and do my job.
58 257 283 311 1 913
6.4% 28.2% 31.0% 34.1%
13. I am provided adequate work and storage space to prepare for and do my job.
188 502 151 62 1 913
20.6% 55.0% 16.6% 6.8%
14. My administrators/supervisors respect the negotiated contracts.
306 534 46 16 6 913
2013-2014 HCEA Job Satisfaction Survey
70
33.7% 58.9% 5.1% 1.8%
15. My planning time is respected by my school administrations/supervisors.
232 486 124 59 5 913
25.6% 53.5% 13.7% 6.5%
16. In my school, administrators/supervisors support me in enforcing discipline.
233 485 113 44 33 913
26.5% 55.1% 12.8% 5.0%
17. In my school, student misbehavior interferes with learning.
113 296 337 137 20 913
12.7% 33.1% 37.7% 15.3%
18. Too much instructional time is spent administering assessments.
213 317 279 48 47 913
24.6% 36.6% 32.2% 5.5%
19. HCPSS professional development experiences are meaningful and worthwhile.
42 410 295 143 8 913
4.6% 45.3% 32.6% 15.8%
20. Increased workload has contributed to a decline in my morale.
391 338 132 39 9 913
43.3% 37.4% 14.6% 4.3%
21. I am paid fairly 19 161 349 379 913
2.1% 17.6% 38.2% 41.5%
22. I have confidence in the leadership exhibited by the HCPSS Superintendent.
38 350 282 208 24 913
4.3% 39.4% 31.7% 23.4%
23. I have confidence in the leadership exhibited by the Howard County Board of Education.
14 222 335 310 21 913
1.6% 24.9% 37.6% 34.8%
24. I have confidence in the leadership exhibited by the Howard County Education Assn. (HCEA)
360 479 40 13 16 913
40.1% 53.4% 4.5% 1.4%
25. I feel that HCPSS offers me the possibility of advancing professionally in the field of education.
109 540 162 57 41 913
12.5% 61.9% 18.6% 6.5%
26. In my position, I receive appropriate and adequate support and training.
120 522 200 60 5 913
13.2% 57.5% 22.0% 6.6%
27. In the last 12 months, I have experienced harassing behavior from colleagues.
27 91 289 467 38 913
3.1% 10.4% 33.0% 53.4%
28. In the last 12 months, I have experienced harassing behavior from administrators/supervisors.
23 49 295 497 43 913
2.6% 5.6% 33.9% 57.1%
29. In the last 12 months, I have experienced harassing behavior from parents.
40 162 349 332 28 913
4.5% 18.3% 39.4% 37.5%
2013-2014 HCEA Job Satisfaction Survey
71
Level Middle
HCEA Member (All)
Profession Teacher
Years in Education (All)
Years with HCPSS (All)
Questions Strongly
Agree Agree Disagree Strongly
Disagree Does Not Apply
Grand Total
1. Overall, morale at my school/worksite is good. 31 204 123 100 459
6.8% 44.4% 26.8% 21.8%
2. There is an atmosphere of open communication and trust in my school/worksite.
38 274 105 41 459
8.3% 59.7% 22.9% 8.9%
3. I personally feel successful in my work. 84 250 93 29 459
18.3% 54.5% 20.3% 6.3%
4. I feel involved in decision-making at my school/worksite.
41 202 143 71 2 459
9.0% 44.2% 31.3% 15.5%
5. I want to be involved in decision-making at my school/worksite.
110 283 38 13 10 459
24.5% 63.0% 8.5% 2.9%
6. In my school/worksite, I can speak openly about important issues without fear of repercussions.
75 216 108 55 2 459
16.4% 47.3% 23.6% 12.0%
7. In my school/worksite, I am treated as a professional.
116 251 59 30 459
25.3% 54.7% 12.9% 6.5%
8. There is good teamwork among staff in my school/worksite.
103 261 67 27 459
22.4% 56.9% 14.6% 5.9%
9. Non-instructional duties are assigned on an equitable basis in my school/worksite.
68 242 85 52 10 459
15.1% 53.9% 18.9% 11.6%
10. My working environment (i.e. safety, cleanliness. is conducive to success.
131 213 68 45 459
28.5% 46.4% 14.8% 9.8%
11. My work performance is evaluated fairly. 60 224 116 55 4 459
13.2% 49.2% 25.5% 12.1%
12. I am provided adequate time during the workday to plan, prepare for and do my job.
27 111 115 205 1 459
5.9% 24.2% 25.1% 44.8%
13. I am provided adequate work and storage space to prepare for and do my job.
114 257 59 27 459
24.8% 56.0% 12.9% 5.9%
14. My administrators/supervisors respect the negotiated contracts.
140 276 29 10 2 459
2013-2014 HCEA Job Satisfaction Survey
72
30.6% 60.4% 6.3% 2.2%
15. My planning time is respected by my school administrations/supervisors.
117 253 65 20 3 459
25.7% 55.5% 14.3% 4.4%
16. In my school, administrators/supervisors support me in enforcing discipline.
85 235 80 46 10 459
18.9% 52.3% 17.8% 10.2%
17. In my school, student misbehavior interferes with learning.
102 122 135 90 6 459
22.5% 26.9% 29.8% 19.9%
18. Too much instructional time is spent administering assessments.
202 159 75 11 10 459
45.0% 35.4% 16.7% 2.4%
19. HCPSS professional development experiences are meaningful and worthwhile.
25 187 144 99 2 459
5.5% 40.9% 31.5% 21.7%
20. Increased workload has contributed to a decline in my morale.
243 137 53 18 6 459
53.6% 30.2% 11.7% 4.0%
21. I am paid fairly 9 100 150 196 459
2.0% 21.8% 32.7% 42.7%
22. I have confidence in the leadership exhibited by the HCPSS Superintendent.
13 171 156 101 12 459
2.9% 38.3% 34.9% 22.6%
23. I have confidence in the leadership exhibited by the Howard County Board of Education.
6 87 166 184 11 459
1.3% 19.4% 37.1% 41.1%
24. I have confidence in the leadership exhibited by the Howard County Education Assn. (HCEA)
166 238 36 9 5 459
36.6% 52.4% 7.9% 2.0%
25. I feel that HCPSS offers me the possibility of advancing professionally in the field of education.
40 241 115 42 18 459
9.1% 54.6% 26.1% 9.5%
26. In my position, I receive appropriate and adequate support and training.
55 271 89 36 2 459
12.0% 59.3% 19.5% 7.9%
27. In the last 12 months, I have experienced harassing behavior from colleagues.
15 44 141 233 23 459
3.4% 10.1% 32.3% 53.4%
28. In the last 12 months, I have experienced harassing behavior from administrators/supervisors.
11 27 165 228 23 459
2.5% 6.2% 37.8% 52.3%
29. In the last 12 months, I have experienced harassing behavior from parents.
49 120 160 111 15 459
11.0% 27.0% 36.0% 25.0%
2013-2014 HCEA Job Satisfaction Survey
73
Level High
HCEA Member (All)
Profession Teacher
Years in Education (All)
Years with HCPSS (All)
Questions Strongly
Agree Agree Disagree Strongly
Disagree Does Not Apply
Grand Total
1. Overall, morale at my school/worksite is good. 38 240 155 119 1 553
6.9% 43.5% 28.1% 21.6%
2. There is an atmosphere of open communication and trust in my school/worksite.
44 282 144 77 2 553
8.0% 51.2% 26.1% 14.0%
3. I personally feel successful in my work. 142 308 72 28 553
25.7% 55.7% 13.0% 5.1%
4. I feel involved in decision-making at my school/worksite.
48 192 195 110 7 553
8.8% 35.2% 35.7% 20.1%
5. I want to be involved in decision-making at my school/worksite.
140 330 59 12 11 553
25.8% 60.9% 10.9% 2.2%
6. In my school/worksite, I can speak openly about important issues without fear of repercussions.
80 241 132 92 5 553
14.6% 44.0% 24.1% 16.8%
7. In my school/worksite, I am treated as a professional.
128 294 73 51 2 553
23.2% 53.4% 13.2% 9.3%
8. There is good teamwork among staff in my school/worksite.
122 261 113 55 1 553
22.1% 47.3% 20.5% 10.0%
9. Non-instructional duties are assigned on an equitable basis in my school/worksite.
100 265 88 74 24 553
18.9% 50.1% 16.6% 14.0%
10. My working environment (i.e. safety, cleanliness. is conducive to success.
142 309 63 36 2 553
25.8% 56.1% 11.4% 6.5%
11. My work performance is evaluated fairly. 76 264 113 89 6 553
13.9% 48.3% 20.7% 16.3%
12. I am provided adequate time during the workday to plan, prepare for and do my job.
36 154 159 200 1 553
6.5% 27.9% 28.8% 36.2%
13. I am provided adequate work and storage space to prepare for and do my job.
154 292 67 36 553
27.8% 52.8% 12.1% 6.5%
14. My administrators/supervisors respect the negotiated contracts.
114 358 50 23 3 553
20.7% 65.1% 9.1% 4.2%
2013-2014 HCEA Job Satisfaction Survey
74
15. My planning time is respected by my school administrations/supervisors.
116 302 86 37 5 553
21.2% 55.1% 15.7% 6.8%
16. In my school, administrators/supervisors support me in enforcing discipline.
97 264 104 65 19 553
18.2% 49.4% 19.5% 12.2%
17. In my school, student misbehavior interferes with learning.
79 146 200 110 9 553
14.5% 26.8% 36.8% 20.2%
18. Too much instructional time is spent administering assessments.
185 197 126 19 19 553
34.6% 36.9% 23.6% 3.6%
19. HCPSS professional development experiences are meaningful and worthwhile.
15 129 204 189 10 553
2.8% 23.8% 37.6% 34.8%
20. Increased workload has contributed to a decline in my morale.
280 173 61 29 9 553
51.5% 31.8% 11.2% 5.3%
21. I am paid fairly 11 110 196 234 553
2.0% 19.9% 35.4% 42.3%
22. I have confidence in the leadership exhibited by the HCPSS Superintendent.
9 174 216 129 19 553
1.7% 32.6% 40.4% 24.2%
23. I have confidence in the leadership exhibited by the Howard County Board of Education.
3 85 228 209 17 553
0.6% 15.9% 42.5% 39.0%
24. I have confidence in the leadership exhibited by the Howard County Education Assn. (HCEA)
182 285 51 22 8 553
33.4% 52.3% 9.4% 4.0%
25. I feel that HCPSS offers me the possibility of advancing professionally in the field of education.
42 295 127 59 21 553
7.9% 55.5% 23.9% 11.1%
26. In my position, I receive appropriate and adequate support and training.
53 319 124 50 2 553
9.6% 57.9% 22.5% 9.1%
27. In the last 12 months, I have experienced harassing behavior from colleagues.
26 52 178 268 25 553
4.9% 9.8% 33.7% 50.8%
28. In the last 12 months, I have experienced harassing behavior from administrators/supervisors.
35 58 184 250 24 553
6.6% 11.0% 34.8% 47.3%
29. In the last 12 months, I have experienced harassing behavior from parents.
75 146 177 139 12 553
13.9% 27.0% 32.7% 25.7%
2013-2014 HCEA Job Satisfaction Survey
75
Level Elementary
HCEA Member (All)
Profession All ESP
Years in Education (All)
Years with HCPSS (All)
Questions Strongly
Agree Agree Disagree Strongly
Disagree Does Not Apply
Grand Total
1. Overall, morale at my school/worksite is good. 55 156 56 25 292
18.8% 53.4% 19.2% 8.6%
2. There is an atmosphere of open communication and trust in my school/worksite.
57 147 65 22 292
19.5% 50.3% 22.3% 7.5%
3. I personally feel successful in my work. 81 171 29 9 292
27.7% 58.6% 9.9% 3.1%
4. I feel involved in decision-making at my school/worksite.
32 108 90 40 20 292
11.8% 39.7% 33.1% 14.7%
5. I want to be involved in decision-making at my school/worksite.
52 176 36 2 24 292
19.4% 65.7% 13.4% 0.7%
6. In my school/worksite, I can speak openly about important issues without fear of repercussions.
55 135 75 20 5 292
19.2% 47.0% 26.1% 7.0%
7. In my school/worksite, I am treated as a professional.
79 156 40 15 1 292
27.1% 53.6% 13.7% 5.2%
8. There is good teamwork among staff in my school/worksite.
77 147 53 12 2 292
26.6% 50.7% 18.3% 4.1%
9. Non-instructional duties are assigned on an equitable basis in my school/worksite.
35 150 62 24 18 292
12.8% 54.7% 22.6% 8.8%
10. My working environment (i.e. safety, cleanliness. is conducive to success.
76 161 43 11 1 292
26.1% 55.3% 14.8% 3.8%
11. My work performance is evaluated fairly. 74 167 32 13 4 292
25.7% 58.0% 11.1% 4.5%
12. I am provided adequate time during the workday to plan, prepare for and do my job.
39 142 66 33 12 292
13.9% 50.7% 23.6% 11.8%
13. I am provided adequate work and storage space to prepare for and do my job.
58 177 36 13 8 292
20.4% 62.3% 12.7% 4.6%
14. My administrators/supervisors respect the negotiated contracts.
73 171 28 9 8 292
2013-2014 HCEA Job Satisfaction Survey
76
25.7% 60.2% 9.9% 3.2%
15. My planning time is respected by my school administrations/supervisors.
33 95 30 13 120 292
19.2% 55.2% 17.4% 7.6%
16. In my school, administrators/supervisors support me in enforcing discipline.
66 128 42 22 33 292
25.5% 49.4% 16.2% 8.5%
17. In my school, student misbehavior interferes with learning.
59 105 84 24 19 292
21.6% 38.5% 30.8% 8.8%
18. Too much instructional time is spent administering assessments.
43 101 65 12 67 292
19.1% 44.9% 28.9% 5.3%
19. HCPSS professional development experiences are meaningful and worthwhile.
16 133 75 39 27 292
6.0% 50.2% 28.3% 14.7%
20. Increased workload has contributed to a decline in my morale.
58 71 109 33 21 292
21.4% 26.2% 40.2% 12.2%
21. I am paid fairly 1 62 108 119 292
0.3% 21.2% 37.0% 40.8%
22. I have confidence in the leadership exhibited by the HCPSS Superintendent.
16 160 54 44 7 292
5.6% 56.1% 18.9% 15.4%
23. I have confidence in the leadership exhibited by the Howard County Board of Education.
11 110 100 57 6 292
3.8% 38.5% 35.0% 19.9%
24. I have confidence in the leadership exhibited by the Howard County Education Assn. (HCEA)
70 175 24 9 10 292
24.8% 62.1% 8.5% 3.2%
25. I feel that HCPSS offers me the possibility of advancing professionally in the field of education.
23 168 51 14 32 292
8.8% 64.6% 19.6% 5.4%
26. In my position, I receive appropriate and adequate support and training.
35 173 53 27 2 292
12.1% 59.7% 18.3% 9.3%
27. In the last 12 months, I have experienced harassing behavior from colleagues.
11 22 104 140 13 292
3.9% 7.9% 37.3% 50.2%
28. In the last 12 months, I have experienced harassing behavior from administrators/supervisors.
8 16 101 148 15 292
2.9% 5.8% 36.5% 53.4%
29. In the last 12 months, I have experienced harassing behavior from parents.
11 33 117 110 18 292
4.0% 12.0% 42.7% 40.1%
2013-2014 HCEA Job Satisfaction Survey
77
Level Middle
HCEA Member (All)
Profession All ESP
Years in Education (All)
Years with HCPSS (All)
Questions Strongly
Agree Agree Disagree Strongly
Disagree Does Not Apply
Grand Total
1. Overall, morale at my school/worksite is good. 7 48 16 8 79
8.9% 60.8% 20.3% 10.1%
2. There is an atmosphere of open communication and trust in my school/worksite.
6 45 22 5 79
7.6% 57.0% 27.8% 6.3%
3. I personally feel successful in my work. 17 50 10 2 79
21.5% 63.3% 12.7% 2.5%
4. I feel involved in decision-making at my school/worksite.
4 33 22 15 4 79
5.3% 44.0% 29.3% 20.0%
5. I want to be involved in decision-making at my school/worksite.
10 61 3 1 4 79
13.3% 81.3% 4.0% 1.3%
6. In my school/worksite, I can speak openly about important issues without fear of repercussions.
8 40 20 8 2 79
10.4% 51.9% 26.0% 10.4%
7. In my school/worksite, I am treated as a professional.
12 46 15 5 79
15.2% 58.2% 19.0% 6.3%
8. There is good teamwork among staff in my school/worksite.
10 51 16 2 79
12.7% 64.6% 20.3% 2.5%
9. Non-instructional duties are assigned on an equitable basis in my school/worksite.
5 34 14 11 14 79
7.7% 52.3% 21.5% 16.9%
10. My working environment (i.e. safety, cleanliness. is conducive to success.
13 50 10 5 1 79
16.7% 64.1% 12.8% 6.4%
11. My work performance is evaluated fairly. 14 52 7 5 79
17.7% 65.8% 8.9% 6.3%
12. I am provided adequate time during the workday to plan, prepare for and do my job.
10 32 12 15 8 79
14.1% 45.1% 16.9% 21.1%
13. I am provided adequate work and storage space to prepare for and do my job.
13 53 8 4 79
16.5% 67.1% 10.1% 5.1%
14. My administrators/supervisors respect the negotiated contracts.
14 51 6 2 5 79
2013-2014 HCEA Job Satisfaction Survey
78
18.9% 68.9% 8.1% 2.7%
15. My planning time is respected by my school administrations/supervisors.
6 21 7 2 43 79
16.7% 58.3% 19.4% 5.6%
16. In my school, administrators/supervisors support me in enforcing discipline.
8 47 8 6 9 79
11.4% 67.1% 11.4% 8.6%
17. In my school, student misbehavior interferes with learning.
13 31 20 5 7 79
18.1% 43.1% 27.8% 6.9%
18. Too much instructional time is spent administering assessments.
17 24 13 2 23 79
30.4% 42.9% 23.2% 3.6%
19. HCPSS professional development experiences are meaningful and worthwhile.
1 34 19 13 12 79
1.5% 50.7% 28.4% 19.4%
20. Increased workload has contributed to a decline in my morale.
7 25 32 5 9 79
10.0% 35.7% 45.7% 7.1%
21. I am paid fairly 2 16 31 28 79
2.5% 20.3% 39.2% 35.4%
22. I have confidence in the leadership exhibited by the HCPSS Superintendent.
3 48 18 4 5 79
4.1% 64.9% 24.3% 5.4%
23. I have confidence in the leadership exhibited by the Howard County Board of Education.
2 29 36 6 4 79
2.7% 38.7% 48.0% 8.0%
24. I have confidence in the leadership exhibited by the Howard County Education Assn. (HCEA)
13 50 8 6 79
17.8% 68.5% 11.0% 0.0%
25. I feel that HCPSS offers me the possibility of advancing professionally in the field of education.
3 39 25 6 4 79
4.0% 52.0% 33.3% 8.0%
26. In my position, I receive appropriate and adequate support and training.
8 51 18 1 79
10.1% 64.6% 22.8% 1.3%
27. In the last 12 months, I have experienced harassing behavior from colleagues.
2 5 31 36 5 79
2.7% 6.8% 41.9% 48.6%
28. In the last 12 months, I have experienced harassing behavior from administrators/supervisors.
2 3 33 36 5 79
2.7% 4.1% 44.6% 48.6%
29. In the last 12 months, I have experienced harassing behavior from parents.
4 15 38 15 5 79
5.4% 20.3% 51.4% 20.3%
2013-2014 HCEA Job Satisfaction Survey
79
Level High
HCEA Member (All)
Profession All ESP
Years in Education (All)
Years with HCPSS (All)
Questions Strongly
Agree Agree Disagree Strongly
Disagree Does Not Apply
Grand Total
1. Overall, morale at my school/worksite is good. 10 49 17 9 85
11.8% 57.6% 20.0% 10.6%
2. There is an atmosphere of open communication and trust in my school/worksite.
13 41 21 10 85
15.3% 48.2% 24.7% 11.8%
3. I personally feel successful in my work. 22 55 7 1 85
25.9% 64.7% 8.2% 1.2%
4. I feel involved in decision-making at my school/worksite.
6 29 29 15 5 85
7.5% 36.3% 36.3% 18.8%
5. I want to be involved in decision-making at my school/worksite.
16 49 9 2 7 85
20.5% 62.8% 11.5% 2.6%
6. In my school/worksite, I can speak openly about important issues without fear of repercussions.
13 42 18 12 85
15.3% 49.4% 21.2% 14.1%
7. In my school/worksite, I am treated as a professional.
17 48 14 6 85
20.0% 56.5% 16.5% 7.1%
8. There is good teamwork among staff in my school/worksite.
13 46 19 6 85
15.3% 54.1% 22.4% 7.1%
9. Non-instructional duties are assigned on an equitable basis in my school/worksite.
8 39 9 7 22 85
12.7% 61.9% 14.3% 11.1%
10. My working environment (i.e. safety, cleanliness. is conducive to success.
17 48 16 4 85
20.0% 56.5% 18.8% 4.7%
11. My work performance is evaluated fairly. 16 44 16 6 2 85
19.3% 53.0% 19.3% 7.2%
12. I am provided adequate time during the workday to plan, prepare for and do my job.
19 38 14 8 5 85
23.8% 47.5% 17.5% 10.0%
13. I am provided adequate work and storage space to prepare for and do my job.
25 49 6 4 85
29.4% 57.6% 7.1% 4.7%
14. My administrators/supervisors respect the negotiated contracts.
20 49 11 3 2 85
24.1% 59.0% 13.3% 3.6%
15. My planning time is respected by my school 5 15 7 3 53 85
2013-2014 HCEA Job Satisfaction Survey
80
administrations/supervisors.
15.6% 46.9% 21.9% 9.4%
16. In my school, administrators/supervisors support me in enforcing discipline.
11 36 10 2 25 85
18.3% 60.0% 16.7% 3.3%
17. In my school, student misbehavior interferes with learning.
14 28 12 9 20 85
21.5% 43.1% 18.5% 13.8%
18. Too much instructional time is spent administering assessments.
16 18 13 2 32 85
30.2% 34.0% 24.5% 3.8%
19. HCPSS professional development experiences are meaningful and worthwhile.
8 21 23 15 17 85
11.8% 30.9% 33.8% 22.1%
20. Increased workload has contributed to a decline in my morale.
8 23 33 12 8 85
10.4% 29.9% 42.9% 15.6%
21. I am paid fairly 3 15 30 37 85
3.5% 17.6% 35.3% 43.5%
22. I have confidence in the leadership exhibited by the HCPSS Superintendent.
6 41 21 11 3 85
7.3% 50.0% 25.6% 13.4%
23. I have confidence in the leadership exhibited by the Howard County Board of Education.
2 37 26 15 2 85
2.4% 44.6% 31.3% 18.1%
24. I have confidence in the leadership exhibited by the Howard County Education Assn. (HCEA..
16 54 8 3 1 85
19.0% 64.3% 9.5% 3.6%
25. I feel that HCPSS offers me the possibility of advancing professionally in the field of education.
2 43 32 5 2 85
2.4% 51.8% 38.6% 6.0%
26. In my position, I receive appropriate and adequate support and training.
14 38 24 7 1 85
16.7% 45.2% 28.6% 8.3%
27. In the last 12 months, I have experienced harassing behavior from colleagues.
6 5 32 37 5 85
7.5% 6.3% 40.0% 46.3%
28. In the last 12 months, I have experienced harassing behavior from administrators/supervisors.
1 4 38 36 6 85
1.3% 5.1% 48.1% 45.6%
29. In the last 12 months, I have experienced harassing behavior from parents.
1 13 37 25 9 85
1.3% 17.1% 48.7% 32.9%
2013-2014 HCEA Job Satisfaction Survey
81
Level (All)
HCEA Member Yes
Profession (All)
Years in Education (All)
Years with HCPSS (All)
Questions Strongly
Agree Agree Disagree Strongly
Disagree Does Not Apply
Grand Total
1. Overall, morale at my school/worksite is good. 240 1137 596 381 2 2358
10.2% 48.3% 25.3% 16.2%
2. There is an atmosphere of open communication and trust in my school/worksite.
286 1288 533 238 4 2358
12.1% 54.7% 22.6% 10.1%
3. I personally feel successful in my work. 548 1339 349 106 2358
23.2% 56.8% 14.8% 4.5%
4. I feel involved in decision-making at my school/worksite.
253 989 713 354 42 2358
10.9% 42.7% 30.8% 15.3%
5. I want to be involved in decision-making at my school/worksite.
636 1403 204 38 63 2358
27.7% 61.1% 8.9% 1.7%
6. In my school/worksite, I can speak openly about important issues without fear of repercussions.
424 1106 509 283 21 2358
18.1% 47.3% 21.8% 12.1%
7. In my school/worksite, I am treated as a professional.
651 1265 275 144 6 2358
27.7% 53.8% 11.7% 6.1%
8. There is good teamwork among staff in my school/worksite.
552 1283 368 145 5 2358
23.5% 54.5% 15.6% 6.2%
9. Non-instructional duties are assigned on an equitable basis in my school/worksite.
372 1196 385 208 178 2358
17.1% 54.9% 17.7% 9.5%
10. My working environment (i.e. safety, cleanliness. is conducive to success.
634 1249 316 142 8 2358
27.0% 53.1% 13.4% 6.0%
11. My work performance is evaluated fairly. 455 1199 397 247 47 2358
19.7% 51.9% 17.2% 10.7%
12. I am provided adequate time during the workday to plan, prepare for and do my job.
167 733 665 758 26 2358
7.2% 31.4% 28.5% 32.5%
13. I am provided adequate work and storage space to prepare for and do my job.
551 1305 329 145 11 2358
23.5% 55.6% 14.0% 6.2%
2013-2014 HCEA Job Satisfaction Survey
82
14. My administrators/supervisors respect the negotiated contracts.
667 1405 172 72 24 2358
28.6% 60.2% 7.4% 3.1%
15. My planning time is respected by my school administrations/supervisors.
487 1158 321 135 241 2358
23.0% 54.7% 15.2% 6.4%
16. In my school, administrators/supervisors support me in enforcing discipline.
476 1173 342 176 175 2358
21.8% 53.7% 15.7% 8.1%
17. In my school, student misbehavior interferes with learning.
381 710 736 366 139 2358
17.2% 32.0% 33.2% 16.5%
18. Too much instructional time is spent administering assessments.
663 797 546 90 237 2358
31.3% 37.6% 25.7% 4.2%
19. HCPSS professional development experiences are meaningful and worthwhile.
118 915 767 464 67 2358
5.2% 39.9% 33.5% 20.3%
20. Increased workload has contributed to a decline in my morale.
965 767 417 138 63 2358
42.0% 33.4% 18.2% 6.0%
21. I am paid fairly 49 469 849 975 2358
2.1% 19.9% 36.0% 41.3%
22. I have confidence in the leadership exhibited by the HCPSS Superintendent.
80 929 748 492 76 2358
3.5% 40.7% 32.8% 21.6%
23. I have confidence in the leadership exhibited by the Howard County Board of Education.
37 534 904 785 60 2358
1.6% 23.2% 39.3% 34.2%
24. I have confidence in the leadership exhibited by the Howard County Education Assn. (HCEA)
863 1264 141 46 26 2358
37.0% 54.2% 6.0% 2.0%
25. I feel that HCPSS offers me the possibility of advancing professionally in the field of education.
214 1310 511 199 105 2358
9.5% 58.1% 22.7% 8.8%
26. In my position, I receive appropriate and adequate support and training.
284 1356 503 182 13 2358
12.1% 57.8% 21.4% 7.8%
27. In the last 12 months, I have experienced harassing behavior from colleagues.
94 231 768 1147 107 2358
4.2% 10.3% 34.1% 51.0%
28. In the last 12 months, I have experienced harassing behavior from administrators/supervisors.
87 160 814 1164 114 2358
3.9% 7.1% 36.3% 51.9%
29. In the last 12 months, I have experienced harassing behavior from parents.
189 493 852 716 94 2358
8.3% 21.8% 37.6% 31.6%
2013-2014 HCEA Job Satisfaction Survey
83
Level (All)
HCEA Member No
Profession (All)
Years in Education (All)
Years with HCPSS (All)
Questions Strongly
Agree Agree Disagree Strongly
Disagree Does Not Apply
Grand Total
1. Overall, morale at my school/worksite is good. 58 169 67 46 340
17.1% 49.7% 19.7% 13.5%
2. There is an atmosphere of open communication and trust in my school/worksite.
63 181 71 22 1 340
18.6% 53.4% 20.9% 6.5%
3. I personally feel successful in my work. 96 201 34 7 340
28.2% 59.1% 10.0% 2.1%
4. I feel involved in decision-making at my school/worksite.
49 137 98 42 13 340
15.0% 41.9% 30.0% 12.8%
5. I want to be involved in decision-making at my school/worksite.
93 201 23 6 15 340
28.6% 61.8% 7.1% 1.8%
6. In my school/worksite, I can speak openly about important issues without fear of repercussions.
74 158 65 34 6 340
22.2% 47.3% 19.5% 10.2%
7. In my school/worksite, I am treated as a professional.
112 175 36 17 340
32.9% 51.5% 10.6% 5.0%
8. There is good teamwork among staff in my school/worksite.
99 171 48 20 340
29.1% 50.3% 14.1% 5.9%
9. Non-instructional duties are assigned on an equitable basis in my school/worksite.
60 154 56 22 47 340
20.5% 52.6% 19.1% 7.5%
10. My working environment (i.e. safety, cleanliness. is conducive to success.
88 178 45 24 4 340
26.2% 53.0% 13.4% 7.1%
11. My work performance is evaluated fairly. 83 185 42 24 5 340
24.8% 55.2% 12.5% 7.2%
12. I am provided adequate time during the workday to plan, prepare for and do my job.
56 140 59 67 15 340
17.2% 43.1% 18.2% 20.6%
13. I am provided adequate work and storage space to prepare for and do my job.
86 207 38 6 1 340
25.4% 61.1% 11.2% 1.8%
14. My administrators/supervisors respect the negotiated contracts.
99 202 18 5 13 340
2013-2014 HCEA Job Satisfaction Survey
84
30.3% 61.8% 5.5% 1.5%
15. My planning time is respected by my school administrations/supervisors.
64 126 30 14 102 340
26.9% 52.9% 12.6% 5.9%
16. In my school, administrators/supervisors support me in enforcing discipline.
76 136 41 17 67 340
27.8% 49.8% 15.0% 6.2%
17. In my school, student misbehavior interferes with learning.
38 91 109 43 54 340
13.3% 31.8% 38.1% 15.0%
18. Too much instructional time is spent administering assessments.
64 101 66 11 92 340
25.8% 40.7% 26.6% 4.4%
19. HCPSS professional development experiences are meaningful and worthwhile.
16 144 75 66 37 340
5.3% 47.5% 24.8% 21.8%
20. Increased workload has contributed to a decline in my morale.
86 99 102 26 24 340
27.2% 31.3% 32.3% 8.2%
21. I am paid fairly 9 105 119 106 340
2.6% 30.9% 35.0% 31.2%
22. I have confidence in the leadership exhibited by the HCPSS Superintendent.
27 175 79 37 12 340
8.2% 53.4% 24.1% 11.3%
23. I have confidence in the leadership exhibited by the Howard County Board of Education.
12 156 90 59 14 340
3.7% 47.9% 27.6% 18.1%
24. I have confidence in the leadership exhibited by the Howard County Education Assn. (HCEA)
29 199 54 14 33 340
9.4% 64.8% 17.6% 4.6%
25. I feel that HCPSS offers me the possibility of advancing professionally in the field of education.
31 182 77 18 26 340
9.9% 58.0% 24.5% 5.7%
26. In my position, I receive appropriate and adequate support and training.
59 197 61 17 2 340
17.5% 58.3% 18.0% 5.0%
27. In the last 12 months, I have experienced harassing behavior from colleagues.
13 25 108 171 21 340
4.1% 7.8% 33.9% 53.6%
28. In the last 12 months, I have experienced harassing behavior from administrators/supervisors.
6 19 110 180 22 340
1.9% 6.0% 34.6% 56.6%
29. In the last 12 months, I have experienced harassing behavior from parents.
18 47 132 100 40 340
6.0% 15.7% 44.0% 33.3%
2013-2014 HCEA Job Satisfaction Survey
85
Level (All)
HCEA Member Yes
Profession All ESP
Years in Education (All)
Years with HCPSS (All)
Questions Strongly
Agree Agree Disagree Strongly
Disagree Does Not Apply
Grand Total
1. Overall, morale at my school/worksite is good. 50 201 74 40 1 366
13.7% 55.1% 20.3% 11.0%
2. There is an atmosphere of open communication and trust in my school/worksite.
50 184 90 40 366
13.7% 50.3% 24.6% 10.9%
3. I personally feel successful in my work. 101 208 42 13 366
27.6% 56.8% 11.5% 3.6%
4. I feel involved in decision-making at my school/worksite.
29 130 117 63 24 366
8.5% 38.0% 34.2% 18.4%
5. I want to be involved in decision-making at my school/worksite.
67 217 43 8 27 366
19.8% 64.0% 12.7% 2.4%
6. In my school/worksite, I can speak openly about important issues without fear of repercussions.
54 173 88 40 7 366
15.0% 48.2% 24.5% 11.1%
7. In my school/worksite, I am treated as a professional.
77 198 60 26 3 366
21.2% 54.5% 16.5% 7.2%
8. There is good teamwork among staff in my school/worksite.
72 197 75 19 2 366
19.8% 54.1% 20.6% 5.2%
9. Non-instructional duties are assigned on an equitable basis in my school/worksite.
36 166 63 37 59 366
11.7% 54.1% 20.5% 12.1%
10. My working environment (i.e. safety, cleanliness. is conducive to success.
84 206 56 17 2 366
23.1% 56.6% 15.4% 4.7%
11. My work performance is evaluated fairly. 80 195 49 25 12 366
22.6% 55.1% 13.8% 7.1%
12. I am provided adequate time during the workday to plan, prepare for and do my job.
52 167 77 50 18 366
14.9% 48.0% 22.1% 14.4%
13. I am provided adequate work and storage space to prepare for and do my job.
79 214 45 19 8 366
22.1% 59.8% 12.6% 5.3%
14. My administrators/supervisors respect the negotiated contracts.
87 212 36 17 11 366
2013-2014 HCEA Job Satisfaction Survey
86
24.5% 59.7% 10.1% 4.8%
15. My planning time is respected by my school administrations/supervisors.
32 97 39 16 179 366
17.1% 51.9% 20.9% 8.6%
16. In my school, administrators/supervisors support me in enforcing discipline.
64 160 47 25 68 366
21.5% 53.7% 15.8% 8.4%
17. In my school, student misbehavior interferes with learning.
66 118 82 31 64 366
21.9% 39.1% 27.2% 10.3%
18. Too much instructional time is spent administering assessments.
55 102 67 14 122 366
22.5% 41.8% 27.5% 5.7%
19. HCPSS professional development experiences are meaningful and worthwhile.
26 139 99 58 42 366
8.0% 42.9% 30.6% 17.9%
20. Increased workload has contributed to a decline in my morale.
53 97 134 50 31 366
15.8% 29.0% 40.0% 14.9%
21. I am paid fairly 8 64 135 155 366
2.2% 17.5% 36.9% 42.3%
22. I have confidence in the leadership exhibited by the HCPSS Superintendent.
19 192 76 54 16 366
5.4% 54.9% 21.7% 15.4%
23. I have confidence in the leadership exhibited by the Howard County Board of Education.
13 126 141 70 8 366
3.6% 35.2% 39.4% 19.6%
24. I have confidence in the leadership exhibited by the Howard County Education Assn. (HCEA..
108 216 23 8 8 366
30.2% 60.3% 6.4% 2.2%
25. I feel that HCPSS offers me the possibility of advancing professionally in the field of education.
28 190 89 28 28 366
8.3% 56.2% 26.3% 8.3%
26. In my position, I receive appropriate and adequate support and training.
43 200 84 33 3 366
11.8% 55.1% 23.1% 9.1%
27. In the last 12 months, I have experienced harassing behavior from colleagues.
19 28 132 170 16 366
5.4% 8.0% 37.7% 48.6%
28. In the last 12 months, I have experienced harassing behavior from administrators/supervisors.
15 25 139 165 17 366
4.3% 7.2% 39.8% 47.3%
29. In the last 12 months, I have experienced harassing behavior from parents.
13 50 142 123 33 366
3.9% 15.0% 42.6% 36.9%
2013-2014 HCEA Job Satisfaction Survey
87
Level (All)
HCEA Member No
Profession All ESP
Years in Education (All)
Years with HCPSS (All)
Questions Strongly
Agree Agree Disagree Strongly
Disagree Does Not Apply
Grand Total
1. Overall, morale at my school/worksite is good. 30 77 30 17 154
19.5% 50.0% 19.5% 11.0%
2. There is an atmosphere of open communication and trust in my school/worksite.
33 75 34 11 154
21.4% 48.7% 22.1% 7.1%
3. I personally feel successful in my work. 37 97 16 4 154
24.0% 63.0% 10.4% 2.6%
4. I feel involved in decision-making at my school/worksite.
20 61 44 19 9 154
13.8% 42.1% 30.3% 13.1%
5. I want to be involved in decision-making at my school/worksite.
28 104 11 11 154
19.6% 72.7% 7.7% 0.0%
6. In my school/worksite, I can speak openly about important issues without fear of repercussions.
32 69 36 13 4 154
21.3% 46.0% 24.0% 8.7%
7. In my school/worksite, I am treated as a professional.
45 84 20 5 154
29.2% 54.5% 13.0% 3.2%
8. There is good teamwork among staff in my school/worksite.
46 71 26 10 154
29.9% 46.1% 16.9% 6.5%
9. Non-instructional duties are assigned on an equitable basis in my school/worksite.
16 68 29 11 30 154
12.9% 54.8% 23.4% 8.9%
10. My working environment (i.e. safety, cleanliness. is conducive to success.
33 84 28 7 2 154
21.7% 55.3% 18.4% 4.6%
11. My work performance is evaluated fairly. 39 96 13 4 2 154
25.7% 63.2% 8.6% 2.6%
12. I am provided adequate time during the workday to plan, prepare for and do my job.
26 76 23 15 12 154
18.3% 53.5% 16.2% 10.6%
13. I am provided adequate work and storage space to prepare for and do my job.
32 103 15 2 1 154
20.9% 67.3% 9.8% 1.3%
14. My administrators/supervisors respect the negotiated contracts.
38 91 14 1 9 154
26.2% 62.8% 9.7% 0.7%
2013-2014 HCEA Job Satisfaction Survey
88
15. My planning time is respected by my school administrations/supervisors.
14 42 10 3 85 154
20.3% 60.9% 14.5% 4.3%
16. In my school, administrators/supervisors support me in enforcing discipline.
23 62 18 7 42 154
20.5% 55.4% 16.1% 6.3%
17. In my school, student misbehavior interferes with learning.
23 51 36 9 34 154
19.2% 42.5% 30.0% 7.5%
18. Too much instructional time is spent administering assessments.
23 43 25 2 56 154
23.5% 43.9% 25.5% 2.0%
19. HCPSS professional development experiences are meaningful and worthwhile.
4 71 30 17 31 154
3.3% 57.7% 24.4% 13.8%
20. Increased workload has contributed to a decline in my morale.
26 34 66 7 20 154
19.4% 25.4% 49.3% 5.2%
21. I am paid fairly 2 51 57 44 154
1.3% 33.1% 37.0% 28.6%
22. I have confidence in the leadership exhibited by the HCPSS Superintendent.
15 93 28 7 5 154
10.1% 62.4% 18.8% 4.7%
23. I have confidence in the leadership exhibited by the Howard County Board of Education.
7 80 42 13 7 154
4.8% 54.4% 28.6% 8.8%
24. I have confidence in the leadership exhibited by the Howard County Education Assn. (HCEA)
10 94 24 4 16 154
7.2% 68.1% 17.4% 2.9%
25. I feel that HCPSS offers me the possibility of advancing professionally in the field of education.
7 88 34 8 13 154
5.0% 62.4% 24.1% 5.7%
26. In my position, I receive appropriate and adequate support and training.
21 94 31 4 2 154
13.8% 61.8% 20.4% 2.6%
27. In the last 12 months, I have experienced harassing behavior from colleagues.
6 12 51 72 11 154
4.2% 8.4% 35.7% 50.3%
28. In the last 12 months, I have experienced harassing behavior from administrators/supervisors.
2 5 55 79 12 154
1.4% 3.5% 38.7% 55.6%
29. In the last 12 months, I have experienced harassing behavior from parents.