40
Investec Bank plc Overview The information in this presentation relates to the year ending 31 March 2019, unless otherwise indicated.

Investec Bank plc
Overview
The information in this presentation relates to the year ending 31 March 2019, unless otherwise
indicated.

An overview of the Investec
Group

3*Including temporary employees and contractors
Investec: a distinctive specialist bank and asset manager
• Established in 1974
• Today, efficient integrated international business platform employing approximately 10 500* people
• Listed on the JSE and LSE (a FTSE 250 company)
• Total assets of £57.7bn; total equity £5.3bn; total FUM £167.2bn
Facilitating the creation of wealth and management of wealth
Assets:
£22.6bn
Assets:
£35.1bn
Core infrastructureDistribution channels Origination channels
Since
1992
Since
1974

4
Solid recurring income base supported by a diversified portfolio
0%
10%
20%
30%
40%
50%
60%
70%
80%
90%
100%
Mar-10 Mar-11 Mar-12 Mar-13 Mar-14 Mar-15 Mar-16 Mar-17 Mar-18 Mar-19
% contribution to operating profit*
Asset Management Wealth & Investment Specialist Banking
0%
10%
20%
30%
40%
50%
60%
70%
80%
90%
100%
Mar-10 Mar-11 Mar-12 Mar-13 Mar-14 Mar-15 Mar-16 Mar-17 Mar-18 Mar-19
% contribution to operating profit**
Southern Africa UK and Other
Across businesses Across geographies
*Operating profit before taxation, goodwill, acquired intangibles, non-operating items, group costs and Asset Management non-controlling interests but after other non-controlling
interests. **Operating profit before taxation, goodwill, acquired intangibles, non-operating items and Asset Management non-controlling interests but after other
non-controlling interests.

5
Client focused approach
• Clients are the core of our
business
• We strive to build business
depth by deepening existing
and creating new client
relationships
• High-tech, high-touch approach
• High level of service by being
nimble, flexible and innovative.
Specialised strategy
• Serving select market niches as
a focused provider of tailored
structured solutions
• Enhancing our existing position
in principal businesses and
geographies through organic
growth and select bolt-on
acquisitions.
Sustainable business
• Contributing to society, macro-
economic stability and the
environment
• Well-established brand
• Managing and positioning the
group for the long term
• Balancing revenue earned from
capital light activities and
capital intensive activities
• Cost and risk conscious.
Strong culture
• Strong entrepreneurial culture
that stimulates extraordinary
performance
• Passionate and talented people
who are empowered and
committed
• Depth of leadership
• Strong risk awareness
• Material employee ownership.
Strategic focus
Our strategic goals and objectives are based on our aspiration to be recognised as a
distinctive specialist bank and asset manager
The Investec distinction
Asset Management Bank and Wealth
• Grow our advisor
business
• Grow our North America
institutional business
• Continue to invest across
our investment platforms,
especially Multi-asset
and China
• Ensure sustainability is at
the core of our business
• Achieve a successful
demerger and listing
• Focused on enhancing effectiveness of
operating platform to better serve
clients and deliver long-term
shareholder returns
• Increase discipline in capital allocation
• Manage the cost base for greater
efficiencies
• Accelerate revenue growth
• Expanding connectivity across the
organization to more fully serve client
needs
• Bolster digital capabilities
Our long-term strategy is to build a diversified portfolio of businesses and
geographies to support clients through varying markets and economic cycles.
Since inception we have expanded through a combination of organic growth
and strategic acquisitions.
In order to create a meaningful and balanced portfolio we need proper
foundations in place which gain traction over time.
Group strategic focus
• Simplify, focus and grow with discipline
• Leverage our unique client profile and provide our clients with an integrated
holistic offering
• Support our high-touch client approach with a comprehensive digital offering
• Ensure domestic relevance and critical mass in our chosen geographies
• Facilitate our clients with cross-border transactions and flow across our
chosen geographies
Our strategy Divisional strategic focus

6
Corporate / institutional / government
Three distinct business activities focused on well defined target clients
Balanced business model supporting our long-term strategy
Private client (high net worth / high income) / charities / trusts
Internal management services to
external clients
Asset Management(operating completely independently)
• Lending
• Transactional banking
• Treasury solutions
• Advisory
• Investment activities
• Deposit raising activities
Specialist Banking
• Asset management
• Wealth management
• Advisory services
• Transactional banking services
• Property funds
• Lending portfolios
• Investment portfolios
• Trading income
- client flows
- balance sheet management
Types of incomeFee and commission income Net interest, investment, associate and trading income
Contributed to
group income
We aim to maintain an appropriate balance between revenue earned from capital light activities and revenue earned
from capital intensive activities.
Capital light activities Capital intensive activities
Contributed to
group income
Wealth & Investment
• Investment management services
• Independent financial planning
advice
56% 44%
As announced on 14 September 2018 following a strategic review, the group made a decision to demerge and separately list the Investec Asset
Management business. The demerger and the listing of Investec Asset Management is subject to regulatory and shareholder approvals, and is
expected to be completed during the second half of calendar year 2019.

7
We continue to have a sound balance sheet
Cash and near cash
Low gearing ratios
• Senior management “hands-on” culture
• A high level of readily available, high quality liquid assets:
representing c. 25% - 35% of our liability base. Cash and near cash
balances amounted to £13.3 billion at year end, representing 42.4%
of customer deposits.
• No reliance on wholesale funding
• Solid leverage ratios: always held capital in excess of regulatory
requirements and the group intends to perpetuate this philosophy.
Target common equity tier 1 ratio of above 10% and total capital
ratios between 14% and 17%
• Low gearing ratio: 9.4x with leverage ratios in excess of 7%
• Geographical and operational diversity with a high level of
recurring income continues to support sustainability of operating
profit
Key operating fundamentals
9.1 9.4
4.6 4.8
0
2
4
6
8
10
12
14
Mar-10 Mar-11 Mar-12 Mar-13 Mar-14 Mar-15 Mar-16 Mar-17 Mar-18 Mar-19
times
Gearing ratio (assets excluding assurance assets to total equity) Core loans to equity ratio
7,000
9,000
11,000
13,000
15,000
Mar-10 Mar-11 Mar-12 Mar-13 Mar-14 Mar-15 Mar-16 Mar-17 Mar-18 Mar-19
£'mn
Average

8
We have a sound track record
Recurring income Revenue versus expenses
Operating profit** before impairments Adjusted EPS^
*Where annuity income is net interest income and annuity fees. **Operating profit before goodwill, acquired intangibles, non-operating items, taxation and after other non-controlling
interests. ^Where adjusted EPS is earnings per share before goodwill, acquired intangibles and non-operating items and after non-controlling interests and the deduction of
preference dividends.
2,486
1,695
0
500
1,000
1,500
2,000
2,500
3,000
Mar-10 Mar-11 Mar-12 Mar-13 Mar-14 Mar-15 Mar-16 Mar-17 Mar-18 Mar-19
£’mn
Total revenue Expenses
76.9%
0%
10%
20%
30%
40%
50%
60%
70%
80%
90%
0
500
1,000
1,500
2,000
2,500
3,000
Mar-10 Mar-11 Mar-12 Mar-13 Mar-14 Mar-15 Mar-16 Mar-17 Mar-18 Mar-19
£’mn
Other operating income Trading income
Investment and associate income Net fees and commission income
Net interest income Annuity income* as a % of total income
53.255.1
0
10
20
30
40
50
60
Mar-10 Mar-11 Mar-12 Mar-13 Mar-14 Mar-15 Mar-16 Mar-17 Mar-18 Mar-19
pence
731
665
-
100
200
300
400
500
600
700
800
Mar-10 Mar-11 Mar-12 Mar-13 Mar-14 Mar-15 Mar-16 Mar-17 Mar-18 Mar-19
£’mn
Operating profit before impairments** Operating profit**
2,486

9
Third party assets under management Core loans and advances and deposits
Total equity and capital resources Net tangible asset value
-
20
40
60
80
100
120
140
160
180
Mar-10 Mar-11 Mar-12 Mar-13 Mar-14 Mar-15 Mar-16 Mar-17 Mar-18 Mar-19
£’bn
Asset Management Wealth & Investment Other
Total net inflows of £6.5bn
31.0 31.3
25.1 24.9
0%
20%
40%
60%
80%
100%
120%
10
15
20
25
30
35
Mar-10 Mar-11 Mar-12 Mar-13 Mar-14 Mar-15 Mar-16 Mar-17 Mar-18 Mar-19
£’bn
Customer accounts (LHS)
Core loans and advances to customers (LHS)
Loans and advances to customer deposits (RHS)
5,4285,251
6,911 6,898
0
1,000
2,000
3,000
4,000
5,000
6,000
7,000
8,000
Mar-10 Mar-11 Mar-12 Mar-13 Mar-14 Mar-15 Mar-16 Mar-17 Mar-18 Mar-19
£’mn
Total equity (including preference shares and non-controlling interests)
Total capital resources (including subordinated liabilities)
386
442
0
500
1,000
1,500
2,000
2,500
3,000
3,500
4,000
-
100
200
300
400
500
600
Mar-10 Mar-11 Mar-12 Mar-13 Mar-14 Mar-15 Mar-16 Mar-17 Mar-18 Mar-19
£’mnpence
Net tangible asset value (excluding goodwill) (£'mn) (RHS)
Net tangible asset value per share (excluding goodwill) (pence) (LHS)
Share price (pence) (LHS)
Deposits: an increase of 8.7% in neutral currency
Core loans: an increase of 6.8% in neutral currency167.2
160.6
We have a sound track record

10
We have invested in our Brand
…our Communities
… and the Planet
…our People

An overview of
Investec Bank plc (IBP)

12^On 1 March 2019, Fitch placed the Long Term Issuer Default Ratings (IDR) of 19 UK banking groups (including IBP) on Rating Watch Negative (RWN). This follows Fitch placing the UK sovereign’s
AA IDR on RWN as a result of Brexit uncertainty.
*At 31 March 2019 (before goodwill, acquired intangibles, non-operating items, taxation and after other non-controlling interests)
Investec Bank plc is a growing specialist bank and private client wealth manager with primary
business in the UK
Investec Bank plc
Total
assets
£22.1bn
Total
equity
£2.2bn
Net core
loans
£10.5bn
Customer
deposits
£13.5bn
Third Party
FUM
£39.5bn
Employees
(approx.)
3,800
Investec Bank plc
• Operating in the UK since 1992
• Wholly owned subsidiary of Investec plc (UK FTSE 250 listed entity since 2002)
– Investec Bank plc is the main banking subsidiary of Investec plc
– Structured into two distinct businesses: Specialist Banking and Wealth & Investment
– Asset Management is housed in a fellow subsidiary under Investec plc
• PRA and FCA regulated and a member of the London Stock Exchange
• Long-term rating of A1 stable outlook (Moody’s) and BBB+ Rating Watch Negative^ (Fitch)
• Balanced and defensive business model comprising Specialist Banking and Wealth &
Investment – c.27% of adjusted operating profit* from non-banking activities
• Creditors ring-fenced from Investec Bank Limited (Southern African banking subsidiary)
• Capital and liquidity are not fungible between Investec Bank plc and Investec Bank Limited –
each entity required to be self-funded and self-capitalised in adherence with the regulations in their
respective jurisdictions

13^ Where annuity income is net interest income and annuity fees
*CET1 ratios shown on a consolidated basis as at 31 March 2019; after the deduction of foreseeable charges and dividends as required by the CRR and EBA technical standards
FUM = Third party funds under management
Investec Bank plc (IBP)
Diversified revenue
streams with high
annuity base
• Balanced business model comprising two distinct business activities: Specialist Banking and Wealth &
Investment
• Continued focus on growing our capital light businesses, now 50% of IBP’s revenue
• High level of annuity revenue^ accounting for 66% of total operating income
• Strong growth in third party FUM
• Simplification of banking business resulting in a reduction in legacy portfolio and impairments
Sound
balance sheet
• Never required shareholder or government support
• Robust capital base: 11.2% CET1 ratio and strong leverage ratio of 7.9% (7.7% on a fully loaded basis)
as of 31 March 2019*
• IBP benefits from a substantial unlevered asset, being Wealth & Investment (FUM: £39.1bn)
• Low gearing: 10.2x
• Strong liquidity ratios with high level of readily available, high quality liquid assets representing 50% of
customer deposits (cash and near cash: £6.8bn)
• Diversified funding base with strong retail deposit franchise and low reliance on wholesale funding
Strong culture
• Stable management - senior management team average tenor of c.15 – 20 years
• Strong, entrepreneurial culture balanced with a strong risk awareness
• Employee ownership – long-standing philosophy

14
Features of Investec’s structure
• Investec plc is the holding company of the
Investec group’s UK & Other operations
• Two main operating subsidiaries:
o IBP (which houses the Specialist Banking and
Wealth & Investment activities)
o Investec Asset Management
Features of the Investec Group’s DLC structure
• Investec implemented a Dual Listed Companies
Structure in July 2002
• Creditors are ring-fenced to either Investec Limited
or Investec plc as there are no cross guarantees
between the companies
• Capital and liquidity are prohibited from flowing
between the two entities under the DLC structure
conditions
• Shareholders have common economic and
voting interests (equivalent dividends on a per
share basis; joint electorate and class right voting) as
a result of a Sharing Agreement
• Investec operates as if it is a single unified
economic enterprise with the same Boards of
Directors and management at the holding companies
Investec and IBP: structure and main operating subsidiaries
All shareholdings are 100% unless otherwise stated. Only main operating subsidiaries are indicated *20% is held by senior management in the company ^Funds under management (FUM)
relating to Wealth & Investment, Assets under management (AUM) relating to Asset Management and Total assets relating to IBP all as at 31 March 2019 **CET1 ratios as at 31 March 2019;
after the deduction of foreseeable charges and dividends as required by the Capital Requirements Regulation and European Banking Authority technical standards. #Rating Watch Negative.
Assets under Management
UK & OtherMar-19 Mar-18
Investec Wealth & Investment £39.1bn £36.9bn
Investec Asset Management £76.0bn £69.4bn
Other £0.4bn £0.3bn
Total third party assets under
management£115.5bn£106.6bn
Specialist banking
Asset Management
Wealth & Investment
Investec Bank plc
Investec plc
Listed on LSE
Non-SA operations
Investec Asset
Management
Ltd
Investec
Bank
(Channel
Islands)
Ltd
Investec
Bank
(Switzerland)
AG
Investec
Wealth &
Investment
Limited
80%*
Investec
Irish
branch
Investec
Holdings
Australia
Limited
FuM:
£39.1bn^
AuM: £76.0bn^Total assets: £22.1bn^
A1 Stable /
BBB+ RWN#
Investec Limited
Listed on JSE
SA operations
DLC Sharing
Agreement
Baa1
Stable
Creditor ring-fence
11.2%
CET1**
Investec
Asset
Finance
plc

15
• Built via the acquisition and integration of businesses
and organic growth over a long period of time
• Well-established platforms in the regions in which we
operate
• Five distinct channels: direct, intermediaries, charities,
international and digital
• Strategy to internationalise within jurisdictions where
the Investec group already has an established business
• Focus is on organic growth in our key markets and
enhancing our range of services for the benefit of our
clients.
• Low risk, capital light, annuity income generation
• £39.1bn in funds under management
• Generated 27% of adjusted operating profit* in FY 2019
IBP: balanced business model supporting our long-term strategy
Three distinct business activities focused on well defined target clients and regions
Corporate / Institutional / Government /
Intermediary
Private client (high net worth / high income) /
charities / trusts
Specialist Banking
Provides investment
management services and
independent financial
planning advice
Wealth & Investment
• Lending
• Transactional banking
• Treasury solutions
• Advisory
• Investment activities
• Deposit raising activities
Specialist Banking• Discretionary wealth management
• Investment advisory services
• Financial planning
Wealth & Investment
• High-quality specialist banking solution to corporate and private clients with
leading positions in select areas
• Provide high touch personalised service – ability to execute quickly
• Ability to leverage international, cross-border platforms
• Well positioned to capture opportunities between the developed and the
emerging world – internationally mobile
• Strong ability to originate, manufacture and distribute
• Balanced business model with good business depth and breadth.
• Generated 73% of adjusted operating profit* in FY 2019
UK and Europe, Australia, Hong Kong, India, USA UK, Channel Islands (Guernsey), Ireland, Switzerland
Bu
sin
es
sV
alu
e P
rop
osit
ion
Reg
ion
Clie
nt
*Before goodwill, acquired intangibles, non-operating items, taxation and after non-controlling interests
16
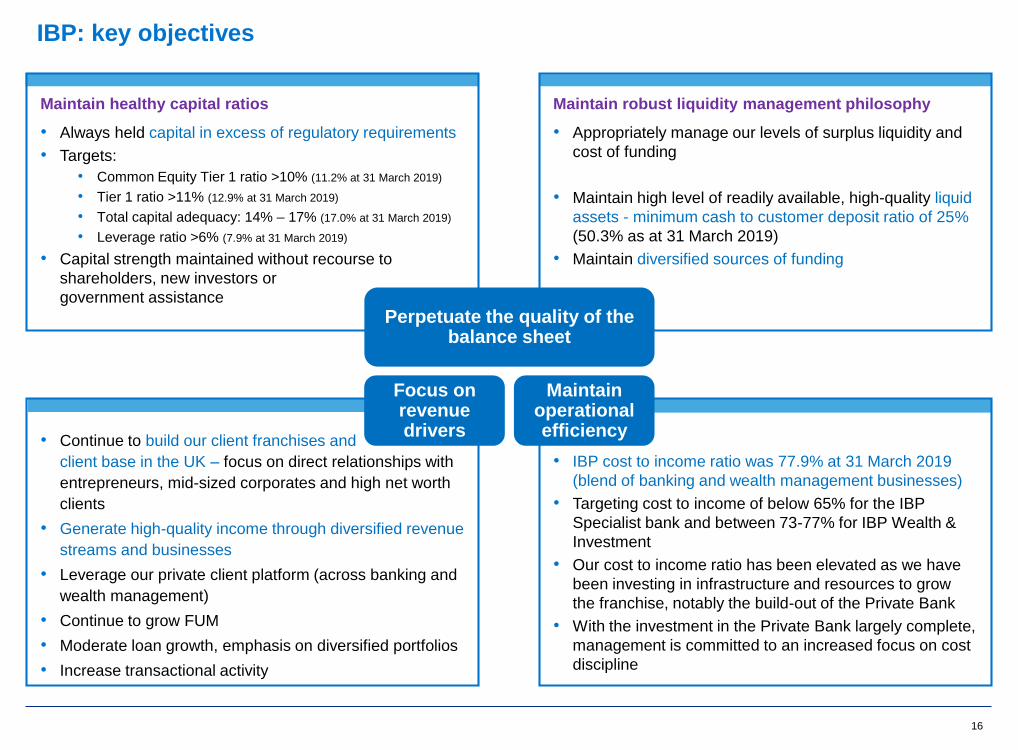
Maintain robust liquidity management philosophy
• Appropriately manage our levels of surplus liquidity and
cost of funding
• Maintain high level of readily available, high-quality liquid
assets - minimum cash to customer deposit ratio of 25%
(50.3% as at 31 March 2019)
• Maintain diversified sources of funding
• Continue to build our client franchises and
client base in the UK – focus on direct relationships with
entrepreneurs, mid-sized corporates and high net worth
clients
• Generate high-quality income through diversified revenue
streams and businesses
• Leverage our private client platform (across banking and
wealth management)
• Continue to grow FUM
• Moderate loan growth, emphasis on diversified portfolios
• Increase transactional activity
Maintain healthy capital ratios
• Always held capital in excess of regulatory requirements
• Targets:
• Common Equity Tier 1 ratio >10% (11.2% at 31 March 2019)
• Tier 1 ratio >11% (12.9% at 31 March 2019)
• Total capital adequacy: 14% – 17% (17.0% at 31 March 2019)
• Leverage ratio >6% (7.9% at 31 March 2019)
• Capital strength maintained without recourse to
shareholders, new investors or
government assistance
• IBP cost to income ratio was 77.9% at 31 March 2019
(blend of banking and wealth management businesses)
• Targeting cost to income of below 65% for the IBP
Specialist bank and between 73-77% for IBP Wealth &
Investment
• Our cost to income ratio has been elevated as we have
been investing in infrastructure and resources to grow
the franchise, notably the build-out of the Private Bank
• With the investment in the Private Bank largely complete,
management is committed to an increased focus on cost
discipline
Focus on revenue drivers
Maintain operational efficiency
Perpetuate the quality of the balance sheet
IBP: key objectives

17
• We have realigned our business model over the past few years and focused on growing our capital light businesses
• We have significantly increased our third party funds under management – a key capital light annuity income driver – in the
Wealth & Investment business
• Our total capital light activities account for 50% of IBP’s revenue
IBP: focusing on capital light activities
Net interest, customer flow trading, investment and associate income
CAPITAL LIGHT ACTIVITIES
• Wealth management
• Advisory services
• Transactional banking services
• Funds
• Lending portfolios
• Trading income largely from client flow as well as balance
sheet management and other
• Investment portfolios
Third party asset management, advisory and transactional income
Fee and commission income Types of incomeNet interest, customer flow trading,
investment and associate income
CAPITAL LIGHT
BUSINESSES
£521mn
50% of total revenue
Net fees and commissions
£511mn
49% of total revenue
Other
£10mn
1% of total revenue
CAPITAL INTENSIVE
BUSINESSES
£528mn
50% of total revenue
Net interest income
£391mn
37% of total revenue
Investment and associate income
£37mn
3% of total revenue
Customer flow and other trading income
£100mn
10% of total revenue
IBP revenues and funds under management
CAPITAL INTENSIVE ACTIVITIES
-
5
10
15
20
25
30
35
40
45
0
100
200
300
400
500
600
Mar-10 Mar-11 Mar-12 Mar-13 Mar-14 Mar-15 Mar-16 Mar-17 Mar-18 Mar-19
£’bn£’mn
FUM (RHS)
Third party assets and advisory revenue (CAPITAL LIGHT) (LHS)
Net interest, investment, associate and trading income (CAPITAL INTENSIVE) (LHS)

IBP’s operating fundamentals
19
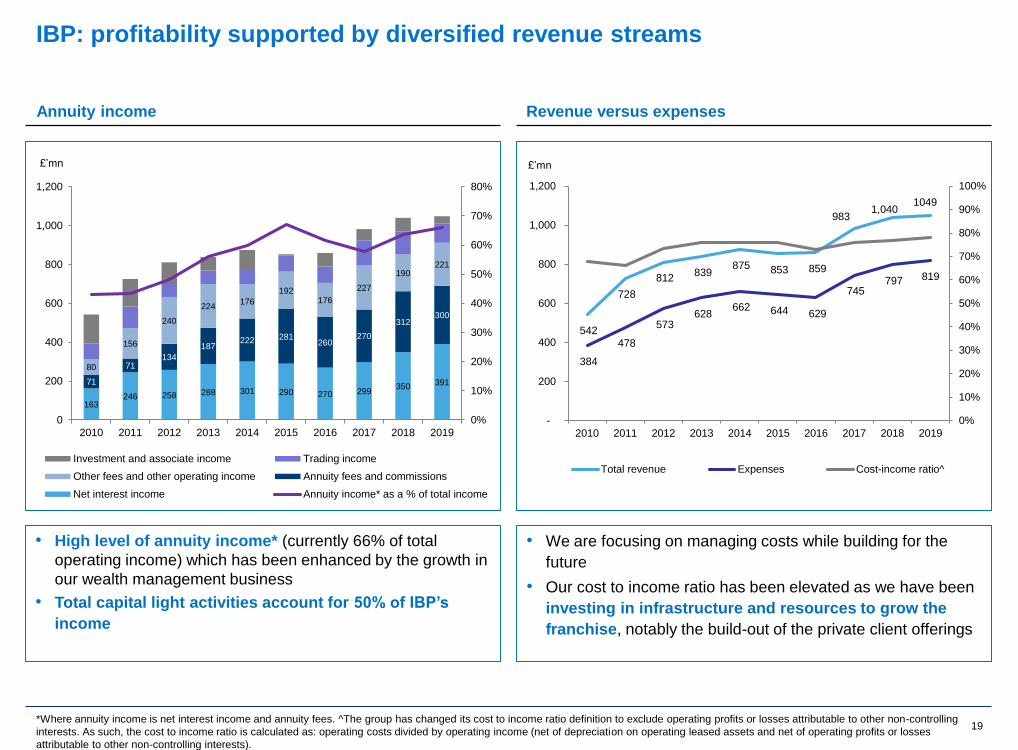
IBP: profitability supported by diversified revenue streams
• High level of annuity income* (currently 66% of total
operating income) which has been enhanced by the growth in
our wealth management business
• Total capital light activities account for 50% of IBP’s
income
Annuity income Revenue versus expenses
• We are focusing on managing costs while building for the
future
• Our cost to income ratio has been elevated as we have been
investing in infrastructure and resources to grow the
franchise, notably the build-out of the private client offerings
*Where annuity income is net interest income and annuity fees. ^The group has changed its cost to income ratio definition to exclude operating profits or losses attributable to other non-controlling
interests. As such, the cost to income ratio is calculated as: operating costs divided by operating income (net of depreciation on operating leased assets and net of operating profits or losses
attributable to other non-controlling interests).
542
728
812 839
875 853 859
983 1,040
1049
384
478
573 628
662 644 629
745 797 819
0%
10%
20%
30%
40%
50%
60%
70%
80%
90%
100%
-
200
400
600
800
1,000
1,200
2010 2011 2012 2013 2014 2015 2016 2017 2018 2019
£’mn
Total revenue Expenses Cost-income ratio^
163246 258 288 301 290 270 299
350 39171
71134
187222 281
260270
312300
80
156
240
224176
192176
227
190221
0%
10%
20%
30%
40%
50%
60%
70%
80%
0
200
400
600
800
1,000
1,200
2010 2011 2012 2013 2014 2015 2016 2017 2018 2019
£’mn
Investment and associate income Trading income
Other fees and other operating income Annuity fees and commissions
Net interest income Annuity income* as a % of total income

20
-
50
100
150
200
250
300
2010 2011 2012 2013 2014 2015 2016 2017 2018 2019
£’mn
Operating profit before tax and impairments*
Operating profit before tax*
IBP: profitability supported by diversified revenue streams
*Before goodwill, acquired intangibles, non-operating items, taxation and after non-controlling interests
• We have grown operating profit (increased by £61mn over the
past three years to £208mn; CAGR of 12%)
• Since 2008 results have been impacted by elevated impairments
driven by the legacy portfolio. This is particularly evident in the
2018 financial year as increased impairments were recognised in
anticipation of accelerated exits on certain legacy assets. This is
not expected to be repeated, as evident in the 2019 financial year
there was no repeat of prior substantial legacy losses.
• It is also worth noting that we remained profitable throughout the
crisis and have built a solid client franchise business which has
supported growth in revenue.
• Operating profit is balanced between Specialist banking and wealth
& Investment businesses
• Higher contribution from the Specialist banking business in 2019
financial year largely driven by improved banking performance
Operating profit before tax* Business mix percentage contribution to operating profit*
Specialist Banking
Wealth & Investment
Three-year CAGR: 12%
50.8%49.2%
40.5%
59.5%
Mar
2017Mar
2018
27.2%
72.8%
Mar
2019

21*Gearing ratio calculated as Total Assets divided by Total Equity ** Loans and deposits in FY15 impacted by the sale of group assets, largely in Australia
IBP: consistent asset growth, gearing ratios remain low
Total assets composition
• Our core loans and advances have grown moderately over
the past 10 years (CAGR of 4.2% since 2010)
• Steady growth in cash and near cash balances (CAGR of
4.4% since 2010)
• We have maintained low gearing ratios* with total gearing
at 10.2x and an average of 10.8x since 2010
14.4
11.211.7 11.4
10.510.0 9.9
9.3 9.1
10.2
6.1
4.6 4.5 4.4 4.33.9
4.2 4.3 4.44.8
0
2
4
6
8
10
12
14
16
2010 2011 2012 2013 2014 2015 2016 2017 2018 2019
times
Total gearing ratio Core loans to equity ratio
Gearing* remains low
7.2 7.6 7.7 8.2 8.2 7.0 7.8 8.6 9.7 10.5
4.6 4.3 4.5 4.5 4.35.0
5.04.9
5.66.85.2
6.68.1
8.67.6
5.9 5.5 4.9
4.8
4.8
5
10
15
20
25
2010 2011 2012 2013 2014 2015 2016 2017 2018 2019
£’bn
Net core loans and advances Cash and near cash balances Other assets
**

22
IBP: exposures in a select target market
• Credit and counterparty exposures are to a select target
market:
• High net worth and high income clients
• Mid to large sized corporates
• Public sector bodies and institutions
• The majority of exposures reside within the UK
• We typically originate loans with the intent of holding these
assets to maturity, thereby developing a ‘hands-on’ and long-
standing relationship with our client
Gross core loans by risk category at 31 March 2019
18%
22%
60% Commercial property investment 9.9%
Residential investment 3.8%
Residential property development 3.1%
Commercial property development 1.1%
Residential vacant land and planning 0.4%
Commercial vacant land and planning 0.1%
HNW and private client mortgages 17.2%
HNW and specialised lending 4.8%
Asset finance 18.2%
Corporate lending and acquisition finance 15.6%
Fund finance 11.4%
Other corporate, institutional, govt. loans 6.0%
Project finance 4.7%
Asset based lending 3.4%
Resource finance and commodities 0.2%
Corporate and other
Lending collateralised against property
High net worth and other private client
£10.6bn
73.3%
9.6%
6.1%
3.1%
4.7%3.2%
UK
Europe (ex UK)
North America
Asia
Australia
Other
Gross core loans by country of exposure at 31 March 2019
£10.6bn

23
IBP: sound and improving asset quality
7.37.6 7.7
8.2 8.2
7.0
7.8
8.6
9.7
10.5
1.71%1.98%
1.66%1.20% 1.00% 1.16% 1.13%
0.90%1.14%
0.38%
4.96%
5.68%
4.11%
3.76% 3.22% 3.01%
2.19%
1.55%
2.16% 2.20%
0%
1%
2%
3%
4%
5%
6%
7%
8%
9%
0
2
4
6
8
10
2010 2011 2012 2013 2014 2015 2016 2017 2018 2019
£’bn
Core loans and advances to customers (LHS)
Credit loss ratio (i.e. income statement charge as a percentage of average grossloans) (RHS)
Stage 3 exposure net of ECL as a % of net core loans and advances tocustomers subject to ECL (RHS)
• Credit quality on core loans and advances for the year
ended 31 March 2019:
• Total income statement ECL impairment charges
amounted to £25.0mn, a substantial reduction from
£106.1mn in the prior period, primarily reflecting a
reduction in legacy impairments
• The credit loss ratio# amounted to 0.38% (1 April
2018: 1.14%), now within its long term average range
• Stage 3 exposures net of ECLs decreased from
£372mn at 1 April 2018 to £211mn predominantly
driven by a reduction in legacy exposures
• Stage 3 exposure net of ECLs as a % of net core
loans and advances subject to ECLs amounted to
2.2% (1 April 2018: 4.3%)
Core loans and asset quality
#Expected credit loss (ECL) impairment charges on gross core loans and advances as a % of average gross core loans and advances subject to ECL

24
£’mn31 Mar
2019
Customer deposits 13,499
Debt securities in issue^ 2,050
Subordinated liabilities 804
Liabilities arising on
securitisation of other assets114
Total 16,467
IBP: diversified funding strategy and credit ratings
Maintaining a high base of high-quality liquid assets
Diversifying funding sources
Limiting concentration risk
Low reliance on wholesale funding
Maintaining a stable retail deposit franchise
Conservative and prudent funding strategy Credit ratings*
• Investec’s funding consists primarily of customer deposits
• Investec adopts a conservative and prudent funding strategy
• Positive rating trajectory: over the past few years both IBP and Investec plc have received ratings upgrades
Selected funding sources
*A rating is not a recommendation to buy, sell or hold securities and may be subject to revision, suspension or withdrawal at any time by the assigning rating organization.
^of which 933mn relates to retail customers. #Rating Watch Negative
IBP’s long-term ratings
0.7%
4.9%
12.4%
82.0%
£16.5bnBaa3 /
BBB-
A3
A2 A2 (positive)
BBB
BBB+ (RWN#)
Jun-15 Oct-15 Feb-16 Sep-17
Moody’s
Fitch
A1 (stable)
Feb-19
• In February 2019, Moody’s upgraded IBP’s long-term deposit rating
to A1 (stable outlook) from A2 (positive outlook) and its baseline
credit assessment (BCA) to baa1 from baa2.
• On 1 March 2019, Fitch placed the Long Term Issuer Default
Ratings (IDR) of 19 UK Banking Groups (including IBP) on Rating
Watch Negative (RWN). This follows Fitch placing the UK
sovereign's AA IDR on RWN as a result of Brexit uncertainty. In
September 2017, Fitch upgraded IBP’s Long-Term Issuer Default
Rating (IDR) to BBB+ from BBB and its Viability Rating (VR) to bbb+
from bbb.
• Investec plc’s long-term issuer rating was upgraded by Moody’s to
Baa2 in February 2016, and to Baa1 in April 2016.

25
IBP: primarily customer deposit funded with low loan to deposit ratio
7.27.6 7.7
8.2 8.2
7.07.8
8.6
9.7
10.5
9.3
10.3
11.1 11.4 11.110.6
11.0 11.312.0
13.5
0%
10%
20%
30%
40%
50%
60%
70%
80%
90%
2
4
6
8
10
12
14
2010 2011 2012 2013 2014 2015* 2016 2017 2018 2019
£’bn
Net core loans and advances (LHS)
Customer accounts (deposits) (LHS)
Loans as a % of customer deposits (RHS)
1.40.8 0.6
1.0 0.80.2 0.5 0.7
1.3 1.3
9.3
10.311.1 11.4 11.1
10.611.0 11.3
12.0
13.5
2
4
6
8
10
12
14
2010 2011 2012 2013 2014 2015 2016 2017 2018 2019
£’bn
Bank deposits Customer accounts (deposits)
• Customer deposits have grown by 46% (c.4% CAGR)
since 2010 to £13.5bn at 31 March 2019
• Advances as a percentage of customer deposits amounted to
77.7%
• Increase in retail deposits and reduced reliance on wholesale
deposits
• Fixed and notice customer deposits have continued to grow
and our customers display a strong ‘stickiness’ and
willingness to reinvest in our suite of term and notice products
Fully self-funded: healthy loan to deposit ratio Total deposits: growing customer deposits
*FY15 impacted by the sale of group assets, largely in Australia

26
80.8%
15.4%
3.8%
Central bank cashplacements and guaranteedliquidity
Cash
Near-cash (other'monetisable' assets)
High level of cash and near cash balances Depositor concentration by type
55.9%
32.3%
2.9%8.9%
Individuals
Non-financial corporates
Small Business
Banks
• We maintain a high level of readily available, high-quality
liquid assets – targeting a minimum cash to customer
deposit ratio of 25%. These balances have increased since
2010 (£4.6bn) to £6.8bn at 31 March 2019 (representing
50% of customer deposits)
• At 31 March 2019 the Liquidity Coverage Ratio reported to
the Prudential Regulatory Authority for IBP (solo basis) was
291% and the Net Stable Funding Ratio^ was 126% - both
metrics well ahead of current minimum regulatory
requirements
IBP: maintaining robust surplus liquidity
Cash and near cash composition
*
*Impacted by sale of group assets **Prudent increase in cash pre Brexit referendum
£6.8bnat 31 March 2019
£14.8bnat 31 March 2019
Since 2009 £'mn
Ave 4,676
Min 1,769
Max 7,119
March 2019 6,792
^The LCR is calculated using our own interpretations of the EU Delegated Act. Ahead of the implementation of the final NSFR rules, the bank has applied its own interpretations of regulatory
guidance and definitions from the BCBS final guidelines, to calculate the NSFR. The reported LCR and NSFR may change over time with regulatory developments and guidance
**

27
IBP: sound capital base and capital ratios
1.2
1.6 1.7 1.91.9
1.8 1.82.0
2.2 2.2
1.7
2.32.4
2.6 2.62.4 2.4
2.6
2.83.0
0.0
0.5
1.0
1.5
2.0
2.5
3.0
3.5
2010 2011 2012 2013 2014 2015 2016 2017 2018 2019
£’bn
Total equity Total capital resources (including subordinated liabilities)
17.018.5
20.221.3
20.0
17.9 18.3 18.4
20.1
22.1
9.0
10.9 11.412.6 12.7
11.011.7
12.713.7
14.6
0%
10%
20%
30%
40%
50%
60%
70%
80%
90%
100%
5
10
15
20
25
2010 2011 2012 2013 2014 2015 2016 2017 2018 2019
£’bn
Total assets (LHS)Total risk-weighted assets (LHS)RWA density (RHS)
• We have continued to grow our capital base and did not
require recourse to government or shareholders during the
crisis
• Our total equity has grown by 83% since 2010 to £2.2bn at 31
March 2019 (CAGR of c.7%)
• The proposed transaction is expected to further enhance the
efficiency of total capital resources
• As we use the Standardised Approach for our Basel III risk
RWA calculations, our RWA represent a large portion of our
total assets
• IBP’s Total RWAs / Total assets is 66%, which is higher
relative to many UK banks on the Advanced Approach
• As a result we inherently hold more capital
Total capital Total risk-weighted assets: high RWA density

28
16.9 16.116.8
16.1 15.8
17.517.0 16.6 16.5 17.0
6.5 6.7 6.5 6.67.2 7.5 7.5
8.0 8.2 7.9
12.3
11.311.5
11.1 10.7
12.1 11.912.2
11.8 11.2
0
2
4
6
8
10
12
14
16
18
20
2010 2011 2012 2013 2014 2015 2016 2017 2018 2019
%
Capital adequacy ratio Leverage ratio Common equity Tier 1
• Investec has always held capital in excess of regulatory requirements and intends to perpetuate this philosophy and ensure
that it remains well capitalised
• The bank has never required shareholder or government support
• In December 2016, the Bank of England set the preferred resolution strategy for IBP to be ‘modified insolvency’. As a result, the
BoE has therefore set IBP’s MREL requirement as equal to its regulatory capital requirements (Pillar 1 + Pillar 2A) and as
such no MREL issuance/impact is expected
• IBP is not expected to be subject to the Banking Reform Act ring-fencing requirements, which are applicable to all large UK
deposit takers, as it falls below the £25bn de minimis threshold for core deposits
Basel capital ratios* Capital development
IBP: sound capital base and capital ratios (continued)
Basel III
requirements
*Since 2014 capital information is based on Basel lll capital requirements as applicable in the UK. Comparative information is disclosed on a Basel ll basis. Since 2014 ratios incorporate the
deduction of foreseeable charges and dividends as required in terms of the regulations. Excluding this deduction IBP’s CET1 ratio would be 13bps higher. The leverage ratio prior to 2014
has been estimated.
^The reported CET 1, T1 and total capital adequacy amounts and ratios are calculated applying
the IFRS 9 transitional arrangements.
^^Based on the group’s understanding of current regulations, ‘fully loaded’ is based on CRR
requirements as fully phased in by 2022, including full adoption of IFRS 9. As a result of the
adoption of IFRS 9 Investec Bank plc elected to designate its subordinated fixed rate medium-
term notes due in 2022 at fair value. By the time of full adoption of IFRS 9 in 2023, these
subordinated liabilities will have reached final maturity and will be redeemed at par value. The
remaining interest rate portion of the fair value adjustment at 31 March 2019 of £17.7 million
(post-taxation), has therefore been excluded from the fully loaded ratios as it will be released into
profit and loss over the remaining life of the instrument.
** The leverage ratios are calculated on an end-quarter basis.
A summary of ratios*31 Mar
2019
1 Apr
2018Target
Common equity tier 1 (as reported)^ 11.2% 11.3% >10%
Common equity tier 1 (fully loaded)^^ 10.8% 11.0%
Tier 1 (as reported)^ 12.9% 12.8% >11%
Total capital adequacy ratio (as
reported)^17.0% 16.0% 14% to 17%
Leverage ratio** (current) 7.9% 8.2% >6%
Leverage ratio** (fully loaded)^^ 7.7% 8.1%

Further information

30
10
20
30
40
50
60
70
80
0
5
10
15
20
25
30
35
40
45
2011 2012 2013 2014 2015 2016 2017 2018 2019
£’bn
Discretionary Non-discretionary
Other Operating profit
• Investment management fees
earned on FUM (largely equity
mandates)
• Commissions earned for execution
• Largely discretionary FUM with
average fees 80bps to 90bps
• Target for average net inflows: 5%
of opening FUM for UK business
Key income drivers
(besides market levels)
• Number of employees: 1,411
• Operating margin: 17.8%
• FUM: £39.1bn
• Net inflows as a % of opening FUM:
0.4% (£0.14bn net inflows for the
year ended 31 March 2019)
• Pre-tax profit: £56.4mn (2018:
£69.3mn)
• % contribution to IBP adjusted
operating profit*: 27%
Current positioning
Operating margin
Net inflows as a % of opening FUM
Average income^ as a % of FUM
Wealth & Investment: Key income drivers and performance statistics
0
10
20
30
2011 2012 2013 2014 2015 2016 2017 2018 2019
%
0
0.2
0.4
0.6
0.8
1
2011 2012 2013 2014 2015 2016 2017 2018 2019
%
-8
-6
-4
-2
0
2
4
6
8
2011 2012 2013 2014 2015 2016 2017 2018 2019
%
IBP: two core areas of activity
^The average income yield on funds under management represents the total operating income for the period as a percentage of the average of opening and closing funds under management. This
calculation does not take into account the impact of market movements throughout the period on funds under management or the timing of acquisitions and disposals during the respective periods
*Before goodwill, acquired intangibles, non-operating items and taxation
Funds under management
£’m

31
58% 57%50%
57%58%
0%
10%
20%
30%
40%
50%
60%
70%
0
100
200
300
400
500
600
700
800
2015 2016 2017 2018 2019
£’mn
Investment and associate income Customer flow trading income
Other fees and other operating income Annuity fees and commissions
Net interest income Annuity income* as a % of total income
0
20
40
60
80
100
120
140
160
180
2014 2015 2016 2017 2018 2019
Net profit before tax ongoing £'mn
• Number of employees: 2,445
• Cost to income: 76.0%
• NIM: 2.22% (2018: 2.21%)
• Pre-tax profit: £151.1mn
(2017: £67.1mn)
• % contribution to IBP
adjusted operating profit**:
73%
Current positioningNet profit before tax
Specialist Banking ongoing: Key income drivers and performance statistics
IBP: two core areas of activity (continued)
Revenue
• Net interest: levels of loans;
surplus cash; deposits
• Fees and commissions:
levels of private and
corporate client activity
• Investment income: realised
and unrealised returns
earned on our investment
and fixed income portfolios
• Customer flow trading
income: level of client
activity
Key income drivers (besides market, economic and
rate levels)
Costs
Impairments
Trends in the above graphs are for the year ended 31 March, and reflect the Ongoing specialist banking business.
**Operating profit before goodwill, acquired intangibles, non-operating items and taxation but after non-controlling interests
72% 71% 71%74% 75% 76%
0%
10%
20%
30%
40%
50%
60%
70%
80%
90%
100%
0
100
200
300
400
500
600
700
800
2014 2015 2016 2017 2018 2019
£’mn
Operating costs £'mn (LHS)
Cost to income ratio (RHS)
0.52%
0.23%0.26% 0.27% 0.24%
0.38%
1.00%
1.16% 1.16%1.13%
1.14%
0.38%
0.0%
0.2%
0.4%
0.6%
0.8%
1.0%
1.2%
1.4%
0
10
20
30
40
50
2014 2015 2016 2017 2018 2019
£’mn
Impairment charge £'mn (LHS)
Ongoing credit loss ratio ratio (RHS)
Statutory credit loss ratio ratio (RHS)

Appendix – summary financials

33
IBP: salient financial features
Key financial statistics 31 March 2019 31 March 2018 % change
Total operating income before expected credit losses/impairment losses (£'000) 1 049 300 1 040 147 0.9%
Operating costs (£'000) 819 169 797 049 2.8%
Adjusted operating profit (before goodwill and acquired intangibles, non-operating items, taxation and after non-
controlling interests) (£'000)207 482 136 347 52.2%
Earnings attributable to ordinary shareholders (£'000) 159 277 97 841 62.8%
Cost to income ratio* (%) 77.9% 76.8%
Total capital resources (including subordinated liabilities) (£'000) 2 966 927 2 788 840 6.4%
Total equity (£'000) 2 163 228 2 209 167 (2.1%)
Total assets (£'000) 22 121 020 20 097 225 10.1%
Net core loans and advances (£'000) 10 486 678 9 663 172 8.5%
Customer accounts (deposits) (£'000) 13 499 234 11 969 625 12.8%
Loans and advances to customers as a % of customer deposits 77.7% 80.7%
Cash and near cash balances (£'000) 6 792 462 5 598 418 21.3%
Funds under management (£'mn) 39 482 37 276 5.9%
Total gearing ratio (i.e. total assets to equity) 10.2x 9.1x
Key asset quality and capital ratios 31 March 2019 1 April 2018
Capital adequacy ratio 17.0% 16.0%
Tier 1 ratio 12.9% 12.8%
CET 1 ratio 11.2% 11.3%
Leverage ratio – current 7.9% 8.2%
Leverage ratio – ‘fully loaded’^ 7.7% 8.1%
Stage 3 exposure as a % of gross core loans and advances to customers subject to ECL 3.2% 6.3%
Stage 3 exposure net of ECL as a % of net core loans and advances to customers subject to ECL 2.2% 4.3%
Credit loss ratio# 0.38% 1.14%*
^ Based on group’s understanding of current regulations, ‘fully loaded’ is based on Capital Requirements Regulation requirements as fully phased in by 2022, including full adoption of
IFRS 9 * As at 31 March 2018# Expected credit loss (ECL) impairment charges on gross core loans and advances as a % of average gross core loans and advances subject to ECL
*The group has changed its cost to income ratio definition to exclude operating profits or losses attributable to other non-controlling interests. As such, the cost to income ratio is calculated as:
operating costs divided by operating income (net of depreciation on operating leased assets and net of operating profits or losses attributable to other non-controlling interests).

34
IBP: income statement
For the year ended (£'000) 31 Mar 2019 31 Mar 2018 % change
Interest income 727 742 598 494 21.6%
Interest expense (336 363) (248 876) 35.2%
Net interest income 391 379 349 618 11.9%
Fee and commission income 523 247 504 606 3.7%
Fee and commission expense (12 366) (10 094) 22.5%
Investment income 34 236 68 943 (50.3%)
Share of post taxation operating profit 2 830 1 444 96.0%
Trading income arising from
- customer flow 86 766 114 502 (24.2%)
- balance sheet management and other trading activities 12 732 2 838 348%
Other operating income 10 476 8 290 26.4%
Total operating income before expected credit losses/impairment losses 1 049 300 1 040 147 0.9%
Expected credit loss impairment charges* (24 991) -
Impairment losses on loans and advances* - (106 085)
Operating income 1 024 309 934 062 9.7%
Operating costs (819 169) (797 049) 2.8%
Depreciation on operating leased assets (2 137) (2 350) (9.1)%
Operating profit before goodwill and acquired intangibles 203 003 134 663 50.7%
Amortisation of acquired intangibles (12 958) (13 273) (3.2%)
Operating profit 190 045 121 390 56.6%
Financial impact of group restructures (12 853) -
Profit before taxation 190 045 121 390 56.6%
Taxation on operating profit before goodwill and acquired intangibles (27 216) (27 651) (1.6%)
Taxation on goodwill and acquired intangibles 4 822 2 418 99.4%
Profit after taxation 154 798 96 157 61.0%
Loss attributable to non-controlling interests 4 479 1 684 166%
Earnings attributable to shareholder 159 277 97 841 62.8%
* On adoption of IFRS 9, there is a move from an incurred loss model to an expected credit loss methodology

35
IBP: balance sheet
For the year ended (£'000) 31 March 2019 1 April 2018* % change
Assets
Cash and balances at central banks 4 445 430 3 487 716 27.5%
Loans and advances to banks 954 938 772 231 23.7%
Reverse repurchase agreements and cash collateral on securities borrowed 633 202 750 102 (15.6%)
Sovereign debt securities 1 298 947 1 155 472 12.4%
Bank debt securities 52 265 113 274 (53.9%)
Other debt securities 508 142 281 939 80.2%
Derivative financial instruments 642 530 604 848 6.2%
Securities arising from trading activities 798 224 701 728 13.8%
Investment portfolio 486 493 472 083 3.1%
Loans and advances to customers 10 488 022 9 539 858 9.9%
Other loans and advances 246 400 415 666 (40.7%)
Other securitised assets 118 143 132 172 (10.6%)
Interests in associated undertakings 8 855 6 414 38.1%
Deferred taxation assets 133 344 148 636 (10.3%)
Other assets 847 604 1 013 440 (16.4%)
Property and equipment 94 714 53 183 78.1%
Investment properties 14 500 14 500 -
Goodwill 260 858 261 075 (0.1%)
Intangible assets 88 409 103 972 (15.0%)
22 121 020 20 028 309 10.4%
* The 1 April 2018 balance sheet has been presented on an IFRS 9 basis and the comparative as at 31 March 2018 on an IAS 39 basis.

36
IBP: balance sheet (continued)
£'000 31 March 2019 1 April 2018* % change
Liabilities
Deposits by banks 1 318 776 1 295 847 1.8%
Derivative financial instruments 719 027 533 319 34.8%
Other trading liabilities 80 217 103 496 (22.5%)
Repurchase agreements and cash collateral on securities lent 314 335 168 640 86.4%
Customer accounts (deposits) 13 499 234 11 969 625 12.8%
Debt securities in issue 2 050 141 1 942 869 5.5%
Liabilities arising on securitisation of own originated loans and advances 113 711 127 853 (11.1%)
Current taxation liabilities 136 818 135 517 1.0%
Deferred taxation liabilities 21 341 22 120 (3.5%)
Other liabilities 900 493 1 014 956 (11.3%)
19 154 093 17 314 242 10.6%
Subordinated liabilities 803 699 716 564 12.2%
19 957 792 18 030 806 10.7%
Equity
Ordinary share capital 1 186 800 1 186 800 -
Share premium 143 288 143 288 -
Capital reserve 162 789 162 789 -
Other reserves (19 647) (56 014) (64.9%)
Retained income 447 924 363 700 23.2%
Shareholder’s equity excluding non-controlling interests 1 921 154 1 800 563 6.7%
Additional Tier 1 securities in issue 250 000 200 000 25.0%
Non-controlling interests in partially held subsidiaries (7 926) (3 060) 159.0%
Total equity 2 163 288 1 997 503 8.3%
Total liabilities and equity 22 121 020 20 028 309 10.4%
* The 1 April 2018 balance sheet has been presented on an IFRS 9 basis and the comparative as at 31 March 2018 on an IAS 39 basis.

37
IBP: segmental analysis of operating profit
For the year to 31 March 2019
£'000Wealth & Investment Specialist Banking Total group
Net interest income 9 189 382 190 391 379
Fee and commission income 306 165 217 082 523 247
Fee and commission expense (724) (11 642) (12 366)
Investment income 1 185 33 051 34 236
Share of post taxation profit of associates - 2 830 2 830
Trading income arising from
- customer flow 793 85 973 86 766
- balance sheet management and other trading activities (1) 12 733 12 732
Other operating income 342 10 134 10 476
Total operating income before expected credit losses 316 949 732 351 1 049 300
Expected credit loss impairment charges* (24) (24 967) (24 991)
Operating income 316 925 707 384 1 024 309
Operating costs (260 561) (558 608) (819 169)
Depreciation on operating leased assets - (2 137) (2 137)
Operating profit before goodwill and acquired intangibles 56 364 146 639 203 003
Loss attributable to non-controlling interests - 4 479 4 479
Operating profit before goodwill, acquired intangibles and after non-controlling interests 56 364 151 118 207 482
Selected returns and key statistics
Cost to income ratio 82.2% 76.0% 77.9%
Total assets (£’million) 866 21 255 22 121
* On adoption of IFRS 9, there is a move from an incurred loss model to an expected credit loss methodology

38
IBP: segmental analysis of operating profit
For the year to 31 March 2019
£'000Wealth & Investment Specialist Banking Total group
Net interest income 5 181 344 437 349 618
297 629 206 977 504 606
Fee and commission income (722) (9 372) (10 094)
Fee and commission expense 10 446 58 497 68 943
Investment income 416 1 028 1 444
Share of post taxation operating profit
Trading income arising from 1 032 113 470 114 502
- customer flow (7) 2 845 2 838
- balance sheet management and other trading activities 235 8 055 8 290
Other operating income
Total operating income before impairment on loans and advances 314 210 725 937 1 040 147
Impairment losses on loans and advances - (106 085) (106 085)
Operating income 314 210 619 852 934 062
Operating costs (244 940) (552 109) (797 049)
Depreciation on operating leased assets - (2 350) (2 350)
Operating profit before goodwill and acquired intangibles 69 270 65 393 134 663
Loss attributable to non-controlling interests - 1 684 1 684
Operating profit before goodwill, acquired intangibles and after non-controlling interests 69 270 67 077 136 347
Selected returns and key statistics
Cost to income ratio 78.0% 76.3% 76.8%
Total assets (£’million) 996 19 101 20 097

39
IBP: asset quality under IFRS 9
£‘million 31 March 2019 1 April 2018
Gross core loans and advances to customers subject to ECL 9 864 8 877
Stage 1 8 969 7 721
Stage 2 576 592
of which past due greater than 30 days 13 18
Stage 3 319 564
Ongoing (excluding Legacy) stage 3* 149 221
Gross core loans and advances to customers subject to ECL (%)
Stage 1 91.0% 87.0%
Stage 2 5.8% 6.7%
Stage 3 3.2% 6.3%
Ongoing (excluding Legacy) stage 3* 1.5% 2.6%
Stage 3 net of ECL 211 372
Of which (excluding Legacy)* stage 3 net of ECL 114 176
Aggregate collateral and other credit enhancements on stage 3 228 414
Stage 3 net of ECL and collateral - -
Stage 3 as a % of gross core loans and advances to customers subject to ECL 3.2% 6.3%
Of which (excluding Legacy)* stage 3 net of ECL 1.5% 2.6%
Total ECL impairments as a % of stage 3 exposure 46.7% 43.8%
Stage 3 net of ECL as a % of net core loans and advances to customers subject to ECL 2.2% 4.3%
Of which (excluding Legacy)* stage 3 net of ECL 1.2% 2.0%
* Ongoing information, as separately disclosed from 2014 to 2018, excludes Legacy, which comprises of pre-2008 assets held on the balance sheet, that had low/negative margins and assets
relating to business we are no longer undertaking

40
IBP: capital adequacy
£‘million 31 March 2019 * 1 April 2018 *
Tier 1 capital
Shareholders’ equity 1 889 1 777
Non-controlling interests (8) (3)
Regulatory adjustments to the accounting basis 110 145
Deductions (348) (361)
Common equity tier 1 capital 1 643 1 558
Additional tier 1 capital 250 200
Tier 1 capital 1 893 1 758
Tier 2 capital 596 445
Total regulatory capital 2 489 2 203
Risk-weighted assets^^ 14 631 13 777
Capital ratios^^
Common equity tier 1 ratio 11.2% 11.3%
Tier 1 ratio 12.9% 12.8%
Total capital ratio 17.0% 16.0%
*The capital adequacy disclosures for Investec Bank plc include the deduction of foreseeable charges and dividends when calculating common equity tier (CET) 1 capital as required under the
Capital Requirements Regulation and European Banking Authority technical standards. These disclosures are different to the capital adequacy disclosures included in the Interim Report, which
follow our normal basis of presentation and do not include the deduction for foreseeable charges and dividends when calculating CET 1 capital. Investec Bank plc’s CET 1 ratio would be 13bps (31
March 2018: 13bps) higher on this basis.
^^ CET 1, Tier 1 (T1), total capital adequacy ratios and risk-weighted assets are calculated applying the IFRS 9 transitional arrangements


