Ooiil-6160 ‘79’0301-1)?6.5SO2.00:0 OVERVIEW NO. 2 NON-EQUILIBRIUM MODELS FOR DIFFUSIVE CAVITATION OF GRAIN INTERFACES TZEJER CHUANG,* KEITH I. KAGAWA,? JAMES R. RICE and LESLIE B. SILLSS Division of Engineering, Brown University, Providence, RI 02912, U.S.A. (Rrceirc~ 30 Junr 1978) Abstract- Existing models for the diffusive growth of voids on grain interfaces, at elevated temperature, are for the most part based on quasi-equilibrium assumptions: surface diffusion is assumed to be sufficiently rapid that the cavity has a rounded, equilibrium shape. and hence cavity growth is assumed to be rate-limited only by grain boundary diffusion. However, creep rupture cavities sometimes have narrow, crack-like shapes and it is appropriate to investigate non-equlibrium models for diffusive rup- ture. We do so here by comparing the quasi-equilibrium model to another limiting case based on a narrow, crack-like cavity shape. Criteria for choosing between the models are given on the basis of representative relaxation times for the surface diffusion process, and also by examining the properties of a ‘self-similar’ sotution for cavity shape. By a suitable choice of parameters which measure the growth rate, this solution can be made to give results corresponding to either limiting case. and aids the interpolation between them. The results suggest that if s is the ratio of the applied stress to that which just equilibrates cavities against sintering, then for circular cavities on a grain boundary with diameter equal to a quarter of their average center-to-center spacing, the quasi-equilibrium mode applies when s < 1 + 6A and the crack-like mode when s > 2 + 9A. Here A is the ratio of surface to grain boundary diffusivity. Also, the stress dependence of the growth rate and rupture lifetime is established in each case, and the results are discussed in relation to the interpretation of experimental data. R&sum&La plupart des modiies de la croissance des cavitks intergranulaires par diffusion, aux tem- piratures Clevkes, reposent sur des hypothises de quasi-kquilibre: on suppose que la diffusion en surface est suffisamment rapide pour que La cavitii ait une forme sphkrique d’tquilibre, de sorte que la vitesse de croissance de la cavitt- n’est limitee que par la diffusion interg~nulaire. Cependant, les cavit& de rupture en Ruage ont parfois des formes &roites, ressemblant B des fissures, si brin qu’il est utile d’itudier des mod4es hors-d’kquilibre de la rupture par diffusion. C’est ce que nous faisons ici, en comparant le mod&le de quasi-tquilibre a un autre cas limite, qui repose sut une forme Ctroite de la cavittt, analogue i une fissure. On donne les crittres qui ~rmettent de choisir entre les deux modtles it partie de temps de relaxation reprtsentatifs pour Is m&can&me de diffusion superficielle, et kgalement en ktudiant les propri&&s d’une solution “semblable 6 elle-m&me” pour la forme de la cavitt-.. En choisissant convenablement les parametres qui mesurent la vitesse decroissdnce. la solution peut donner les resultats de I’un ou de I’autre des cas limites, ce qui facilite I’interpolation entre ceux-ci. Nos r&uitats montrent que si s est le rapport de ia contrdinte appliquke i celie qui t-quilibre juste la cavitation par rapport au frittage. dans le cas de cavitks intergranulaires circulaires dont le diametre est Cgal au quart de leur distance moyenne de centre h centre, le mode de quasi-Cquilibre s’applique lorsque s < 1 + 6A, et le mode de type fissure lorsque s > 2 + 9A. A est ici le rapport de la diffusiti en surface B la di~usivit~ intergranulaire. Nous avons tgalement obtenu dans chaque cas la variation de la viressc de croissance et de la duree avant rupture en fonction de la contrainte: ces rPsuitats sont discutes en liaison avec les rt!sultats expkrimentaux. Zusammenfassung-Die vorhandenen Modelie fiir das Wachstum von Hohlrtiumen an Korn- grenziI5chen bei haheren Temperaturen iiber ~iffusionsprozesse bauen ~berwiegend auf der Annahme von Quasi-Gieichgewicht auf: die Oberflichendiffusion wird als geniigend schnell angenommen. so da13 der Hohlraum die runde Gleichgewichtsform annimmt; das Hohlraumwachstum wird also nur von der Korngrenzdiflusion bestimmt. Alterdings haben Hohlrgume nach Kriechbruch manchmal eine enge. ri~~hniiche Form: daher scheint es geraten. Njchtgleichgewichtsmodeile des di~usionsinduzierten Bruches zu untersuchen. Hier wird das Quasigleichgewichtsmodell mit einem Model1 fiir den Grenzfall der engen rifilhnlichen Hohlraumform verglichen. Es werden Kriterien ftir die Wahl zwischen beiden Modellen angegeben. die auf den fiir die Oberfliichendiffusionsprozesse typischen Relaxationszeiten aufbauen. und die aul3erdem aus den Eigenschaften einer “selbstZhnlichen” L&ung fiir die Hohlraum- form erhalten wurden. Mit einer passenden Auswahl der Parameter fiir die Wachstumsrate kann diese Liisung so gestaltet werden, daR sie Ergebnisse fiir jeden der b&den Grenzf5lle entsprechend liefert und Interpolationen erleichtert. Die Ergebnisse legen folgendes nahe: ist s das Verhgltnis zwischen angelegter Spannung und der Spannung, die gerade die Hohlrlume vor dem Sintern bewahrt. dann t Hawaiian Fluid Power Corp., Honolulu, HI 96819, Current affiliations: U.S.A. * Advanced Systems Technology, Westinghouse Electric $ As of October 1978, School of Engineering, Tel-Aviv Corp., Pittsburgh, PA 15221. U.S.A. University. Ramat-Aviv, Israel. *.?.I. 27 3-A 265
Transcript
Ooiil-6160 ‘79’0301-1)?6.5SO2.00:0
OVERVIEW NO. 2
NON-EQUILIBRIUM MODELS FOR DIFFUSIVE CAVITATION OF GRAIN INTERFACES
TZEJER CHUANG,* KEITH I. KAGAWA,? JAMES R. RICE and LESLIE B. SILLSS
Division of Engineering, Brown University, Providence, RI 02912, U.S.A.
(Rrceirc~ 30 Junr 1978)
Abstract- Existing models for the diffusive growth of voids on grain interfaces, at elevated temperature, are for the most part based on quasi-equilibrium assumptions: surface diffusion is assumed to be sufficiently rapid that the cavity has a rounded, equilibrium shape. and hence cavity growth is assumed to be rate-limited only by grain boundary diffusion. However, creep rupture cavities sometimes have narrow, crack-like shapes and it is appropriate to investigate non-equlibrium models for diffusive rup- ture. We do so here by comparing the quasi-equilibrium model to another limiting case based on a narrow, crack-like cavity shape. Criteria for choosing between the models are given on the basis of representative relaxation times for the surface diffusion process, and also by examining the properties of a ‘self-similar’ sotution for cavity shape. By a suitable choice of parameters which measure the growth rate, this solution can be made to give results corresponding to either limiting case. and aids the interpolation between them. The results suggest that if s is the ratio of the applied stress to that which just equilibrates cavities against sintering, then for circular cavities on a grain boundary with diameter equal to a quarter of their average center-to-center spacing, the quasi-equilibrium mode applies when s < 1 + 6A and the crack-like mode when s > 2 + 9A. Here A is the ratio of surface to grain boundary diffusivity. Also, the stress dependence of the growth rate and rupture lifetime is established in each case, and the results are discussed in relation to the interpretation of experimental data.
R&sum&La plupart des modiies de la croissance des cavitks intergranulaires par diffusion, aux tem- piratures Clevkes, reposent sur des hypothises de quasi-kquilibre: on suppose que la diffusion en surface est suffisamment rapide pour que La cavitii ait une forme sphkrique d’tquilibre, de sorte que la vitesse de croissance de la cavitt- n’est limitee que par la diffusion interg~nulaire. Cependant, les cavit& de rupture en Ruage ont parfois des formes &roites, ressemblant B des fissures, si brin qu’il est utile d’itudier des mod4es hors-d’kquilibre de la rupture par diffusion. C’est ce que nous faisons ici, en comparant le mod&le de quasi-tquilibre a un autre cas limite, qui repose sut une forme Ctroite de la cavittt, analogue i une fissure. On donne les crittres qui ~rmettent de choisir entre les deux modtles it partie de temps de relaxation reprtsentatifs pour Is m&can&me de diffusion superficielle, et kgalement en ktudiant les propri&&s d’une solution “semblable 6 elle-m&me” pour la forme de la cavitt-.. En choisissant convenablement les parametres qui mesurent la vitesse decroissdnce. la solution peut donner les resultats de I’un ou de I’autre des cas limites, ce qui facilite I’interpolation entre ceux-ci. Nos r&uitats montrent que si s est le rapport de ia contrdinte appliquke i celie qui t-quilibre juste la cavitation par rapport au frittage. dans le cas de cavitks intergranulaires circulaires dont le diametre est Cgal au quart de leur distance moyenne de centre h centre, le mode de quasi-Cquilibre s’applique lorsque s < 1 + 6A, et le mode de type fissure lorsque s > 2 + 9A. A est ici le rapport de la diffusiti en surface B la di~usivit~ intergranulaire. Nous avons tgalement obtenu dans chaque cas la variation de la viressc de croissance et de la duree avant rupture en fonction de la contrainte: ces rPsuitats sont discutes en liaison avec les rt!sultats expkrimentaux.
Zusammenfassung-Die vorhandenen Modelie fiir das Wachstum von Hohlrtiumen an Korn- grenziI5chen bei haheren Temperaturen iiber ~iffusionsprozesse bauen ~berwiegend auf der Annahme von Quasi-Gieichgewicht auf: die Oberflichendiffusion wird als geniigend schnell angenommen. so da13 der Hohlraum die runde Gleichgewichtsform annimmt; das Hohlraumwachstum wird also nur von der Korngrenzdiflusion bestimmt. Alterdings haben Hohlrgume nach Kriechbruch manchmal eine enge. ri~~hniiche Form: daher scheint es geraten. Njchtgleichgewichtsmodeile des di~usionsinduzierten Bruches zu untersuchen. Hier wird das Quasigleichgewichtsmodell mit einem Model1 fiir den Grenzfall der engen rifilhnlichen Hohlraumform verglichen. Es werden Kriterien ftir die Wahl zwischen beiden Modellen angegeben. die auf den fiir die Oberfliichendiffusionsprozesse typischen Relaxationszeiten aufbauen. und die aul3erdem aus den Eigenschaften einer “selbstZhnlichen” L&ung fiir die Hohlraum- form erhalten wurden. Mit einer passenden Auswahl der Parameter fiir die Wachstumsrate kann diese Liisung so gestaltet werden, daR sie Ergebnisse fiir jeden der b&den Grenzf5lle entsprechend liefert und Interpolationen erleichtert. Die Ergebnisse legen folgendes nahe: ist s das Verhgltnis zwischen angelegter Spannung und der Spannung, die gerade die Hohlrlume vor dem Sintern bewahrt. dann
t Hawaiian Fluid Power Corp., Honolulu, HI 96819, Current affiliations: U.S.A.
* Advanced Systems Technology, Westinghouse Electric $ As of October 1978, School of Engineering, Tel-Aviv Corp., Pittsburgh, PA 15221. U.S.A. University. Ramat-Aviv, Israel.
*.?.I. 27 3-A 265
266 CHUANG ef al.: DIFFUSIVE CAVITATION OF GRAIN INTERFACES
11Bt sich fir einen runden Hohlraum an einer Korngrenze mit einem Durchmesser von einem Viertel des gegenseitigen mittleren Abstandes das Quasigleichgewichtsmodell anwenden, wenn s i 1 + 6A und das riDPhnliche Modell, wenn s > 2 + 9A, anwenden. Hierbei ist A das Verhgltnis zwischen Oberfllchen- und Korngrenzdiffusivitlt. AuBerdem werden die Spannungsabhgngigkeit von Wach- stumsrate und Bruchstandzeit fiir beide FIlle bestimmt; die Ergebnisse werden im Hinblick auf Interpre- tation experimenteller Daten diskutiert.
1. INTRODUCTION
Under creep conditions, polycrystalline solids often rupture prematurely by the growth and coalescence of grain boundary voids. Experimental findings indi- cate that a concentrated void population generally forms on grain boundaries oriented in a direction per- pendicular to the applied tensile loads [l-3].
These voids can be nucleated at grain junctions (w-type voids) or at grain boundary inclusion inter- faces (r-type voids). Here we investigate the kinetics
of void growth by diffusion, giving special attention to non-equilibrium aspects of the problem. Specifi- cally, rather than assuming a quasi-equilibrium void shape (e.g. one of uniform curvatures) during growth, we allow the void shape to be determined as part of the analysis.
Indeed, numerous studies of the growth of voids on a planar grain boundary perpendicular to the applied stress have been made, on the assumption that surface diffusion is rapid enough to give an essen- tially spherical void shape. Hull and Rimmer [4] and Speight and Harris [S] estimated the time to rupture a material with an array of spherical voids located on a planar grain boundary in which atoms were transported from the surface of the cavity along the
grain interface. A correction to the model was made by Weertman [6], who considered the appropriate boundary condition to be one of zero vacancy flux on the grain boundary at the midpoint between the voids. Vitovec[?] then estimated the strain rate by
considering the change in stress acting across the grain boundary which results from changes in the ligament size. Raj and Ashby [S] investigated the combined contributions of nucleation and growth of voids to the rupture lifetime, again assuming a quasi- equilibrium growth model, and have included effects
of grain boundary sliding. However, the assumption of an equilibrium void
shape may not always be satisfied, and it is well known that rather elongated rupture cavities are sometines observed. Thus Chuang and Rice [9] exam- ined the problem of a long, crack-like cavity located on a planar grain boundary. Their work was limited to a determination of the cavity shape for a given speed of growth. Here we extend that work to a gen- eral examination of non-equilibrium cavity shapes, and of relation between applied stress and growth rates over a wide range of conditions. We consider the growth of pre-existing voids along a planar grain boundary, perpendicular to the applied tensile stress and give results for two cases: (i) a long cylindrical void in which case we assume plane diffusive flow in directions perpendicular to the axis of the cylinder,
(a)
Y
JI
+-
x,r
0-i
lb) Fig. 1. (a) Quasi-equilibrium void and (b) crack-like void, each situated along the grain boundary; n-t) denotes the angle between the tangent to the void at the void tip and
the .x-axis.
and (ii) an axisymmetric void, in which case the diffu- sive flow is also assumed to be axisymmetric.
We start the analysis with the two limiting cases of slow, quasi-equilibrium growth, in which the void has a rounded shape of uniform curvature (i.e. the
case already examined by Hull and Rimmer [4] and others) (Fig. la), and of very rapid growth, in which case there is inadequate time for the void to develop a rounded shape and, instead, it remains thin and crack-like (Fig. 1 b).
The practical cases lying between these two extremes are difficult to treat mathematically. How- ever, we find by linearizing the governing equations it is possible to develop a class of self-similar solu- tions, analogous to those of Mullins [lo] for grain boundary grooving, in which the cavity radius a varies with time t as a = ct’14, where c is a constant. We find that results for large and small c agree, re- spectively, with the limiting results based on the assumptions of crack-like and quasi-equilibrium void shapes. By interpreting these results and by examining characteristic times for surface relaxation, we are able to provide guidelines as to which of the two simpler limiting cases is most appropriate in given circum- stances.
The matter which diffuses from the void surfaces is assumed to flow along the grain boundary, joining the crystals on either side. The crystals themselves
are assumed to move as if they were rigid, rather
than elastically deformable, and this is seen to be jus-
tified by estimates of representative elastic relaxation times. Indeed, these relaxation times and those associ-
ated with various modes of surface shape and grain boundary alteration are given in the Appendix.
Preliminary versions of the results given here, as limited to the long cylindrical void model, are given in theses by Chuang [l 1] and Kagawa [12].
2. PROCESSES IN DIFFUSIVE VOID GROWTH
In order to understand clearly the processes to be modelled, a description of the mechanisms which gov- em diffusive void growth and the behavior of the grains and their boundary is presented here.
Indeed, changes in the shape of a void located on a grain boundary can be accomplished by self-diffu- sion along the surface of the cavity, by bulk diffusion through the lattice, and by evaporation and conden- sation. It is expected that at temperatures significantly below the melting point of the material it should be more difficult to move an atom (or a vacancy) through the lattice than along a free surface; thus lattice diffusion should be negligible compared to sur- face diffusion [ 131. As the temperature approaches the
melting point, however, lattice diffusion should con- tribute significantly to the total atom flux. In order to more precisely determine which mechanism is dominant, it is useful to compare characteristic relax-
ation times of a free surface with periodic curvature
when atom flux results from lattice diffusion and when it results from surface diffusion (e.g. Mul-
lins [lo, 141, summarized in the appendix). If r,, the
characteristic time for surface diffusion, and TV, the characteristic time for lattice diffusion, are such that TJT, c 0.1, it can be expected that surface fluxes will be the more significant part of matter transport. From typical values of the quantities involved in calculating these characteristic relaxation times for some com-
mon metals (see Tables 1 and 2) at temperature T = 0.5 T,,, and T = 0.8 T,,, (T, is the melting tem- perature), it is found that surface diffusion, indeed, does dominate over lattice diffusion as the mechanism
governing void growth (see Appendix Al for details). In a similar manner, it is shown in the appendix that the contribution to matter transport by surface diffu- sion dominates over that by evaporation-condensa- tion (for example T,/T, < 0.1, where T, is the charac- teristic time for evaporation-condensation). Thus, at least for this temperature range, surface diffusion will be considered the only mechanism which determines void shape.
Hence, the voids grow by the diffusion of matter along their surfaces toward the void tip. Near the void tip, in the region adjacent to the grain boundary, the atoms may be removed from the void surface either through the void tip and into the grain bound- ary or through the lattice. An examination of charac- teristic relaxation times for grain boundary and lattice diffusion reveals that grain boundary diffusion will
CHUANG et al.: DIFFUSIVE CAVITATION OF GRAIN INTERFACES 267
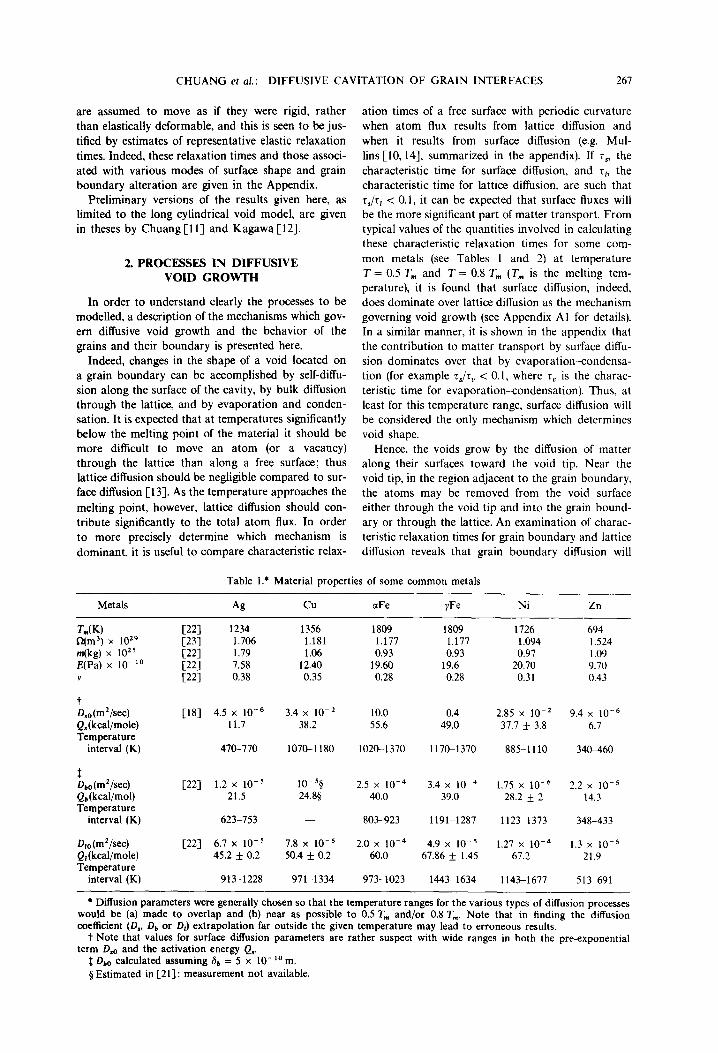
Table l.* Material properties of some common metals
10-54 2.5 x 1O-4 3.4 x 10-a 1.75 x 1o-6 2.2 x 10-S 24.8s 40.0 39.0 28.2 k 2 14.3
l Diffusion parameters were generally chosen so that the temperature ranges for the various types of diffusion processes would be (a) made to overlap and (b) near as possible to 0.5 T, and/or 0.8 T,,,. Note that in findine the diffusion coefficient (D,, Db or D,) extrapolation far outside the given temperature may lead to erroneous results.
t Note that values for surface diffusion parameters are rather suspect with wide ranges in both the pre-exponential term Dso and the activation energy Q*
$ DbO calculated assuming & = 5 x lo- lo m. 5 Estimated in [21] : measurement not available.
268 CHUANG et al.: DIFFUSIVE CAVITATION OF GRAIN INTERFACES
Table 2.* Calculated values of A and A,,,,, at T = 0.5 T,,, and T = 0.8 T,,,
Metals Ag cu xFe yFc Ni Zn
At T = 0.5 T,,,: A = D,6,JD,S, P,(W LWd
(for TJT, = 0.1)
L,,(w)
(for TJT, = 0.1)
Lx (pm)
(for T,,/T, = 0.1)
At T = 0.8 T,,,: A = Ds&JDb& PO (Pa) I,,.
(for T,/T1 = 0.1)
I,,, Wd (for TJT, = 0.1)
L,,(w)
(for T,,/T, = 0.1)
5.72 x IO’ [22] 5.3 X 10-b
1.13 x 10’3
8.4 x IO2
9.89 X IO-‘8
1.4 X IO_‘“$‘i 3.2 [22] 2.9 x lo-’ 6.2 x 10-l
1.98 x IO’% 2.6 x 10’
5.38’ 1.3 x IO’
7.03s
7.9 x 10-Z 3.8 x 1O-b 8.1 x 10’S;
7.4
4.5 x IO4
3.8 x 10’
3.09 lo-’
1.17 x IO2
2.18 x 10’
1.89 x 10’
8.02 x 10’3 2.3 x 1O-4 4.67 x lO’#
1.69 x lo3
2.91 x IO-‘8
2.0% lo-’
5.96 x lo48
2.74 x lo28
1.45 x 10⁴s;
1.6 x IO’ 2.3 x lO-4 1.16 x IO’
1.07 x lo3
3.52 x 10’
28.4$ 7.4 x lo-’ 1.31 x loha
3.86 x 10’
2.31 x 10%
8.6411 8.5 x lO-3 7.89 x lO’l/
4.9 x 1bq
4.56
1.30 x lo4 2.6 x 1O-6 5.98 x 10’s
1.26 x IO3
2.30 x 10’8
2.08 x lo*@ 4.1
1.53 x 1oq
7.W
3.69 x lo-*$
* See footnote of Table I. $Calculated on the basis of Table 1; values for diffusion parameters, however, are outside the desired temperature
range by more than 10%. I/ Calculated for D,, = 4.16 x IO-‘, Q, = 47.7, 1373 < T < 1523. r Calculated for D,, = 10”’ Q = 55.3 970 < T< 1220. . s .
be the dominant mechanism (see Appendix A2 for details). As atoms diffuse into the grain boundary, there are various ways for the grains to respond to
this additional matter. On the one hand, if grain boundary diffusion is sufficiently fast (with respect to void growth) so that the diffused atoms spread over the entire grain boundary, then the growth of the grain boundary 6 will be uniform or equivalently the
grains on both sides of the boundary will separate evenly (Fig. 2a). Hence the grains behave as though they are rigid. If, on the other hand, diffusion is slow on the boundary, the grains must deform in order to accommodate the atoms which have accumulated
near the void tip. In order to do this the grains deform elastically in this region (Fig. 2b). A first analysis of the accommodation of diffused matter by
elastic deformation of the grains has been given by Chuang [l 11, who examined a semi-infinite crack-like void along an infinite grain boundary. (Chuang’s tech-
(b)
Fig. 2. Grain boundary thickening 6 which occurs if grains behave (a) rigidly or (b) elastically.
Vitek [ 151. However, the conditions assumed along the void surface in [lS] involve a discontinuity in the void profile, in that a portion of the void is pre-
sumed to have a constant thickness; this discontinuity is inconsistent with the equations governing surface
diffusion and it is not clear as to what effect this has on the end results.) Indeed, a comparison of the elastic relaxation time with a time calculated on the basis of the rigid grain assumption (i.e. no elastic effects) indicates that the elastic effects generally occur on a time scale so short as to be negligible (see Appendix A3).
3. GOVERNING EQUATIONS
It is known from diffusion theory that differences in chemical potential constitute a thermodynamic force causing atoms to migrate from regions of high potential to those of low potential. In cases of small departures from equilibrium, the general assumption is that the rate of kinetic change along the diffusion path is everywhere linearly dependent on the gradient of the chemical potential.
Thus for diffusion along a free surface, treated as isotropic in the plane of the surface for simplicity, the flux law has the form
J, = - (D,S,/Rk T)d&s. (1)
Here J, is the number of atoms per unit time crossing unit length in the surface, a/& is a derivative with respect to arc length along the surface in the flow direction, fi is the chemical potential per atom, R the volume per atom, kT the energy-per-atom measure of temperature, D, the surface diffusivity, and S, the thickness of the diffusion layer. Experimentally, D,
CHUANG et al.: DIFFUSIVE CAVITATION OF GRAIN INTERFACES 269
and S, cannot be separated and we adopt the expres-
sion 6, = R’13. When a thin layer of matter is added to a curved
surface, the surface area and hence the total surface energy is altered and thus there is an extra energy change in addition to that of adding matter to the bulk. Herring [16, 171 has analysed the problem and,
since the increase in area is negatively proportional to the curvature where matter is added, we have
P = PO - YJ@l + h.2) (2)
where til, ti2 are the principal curvatures (positive for voids like those in Fig. l), ys the surface free energy, and p. is the potential of the bulk. Here it is assumed
that there is no normal stress and the strain energy associated with stresses in the plane of the surface is neglected. Stresses are very small even at the void tip for the diffusive processes considered and the neg- lect of the strain energy term is readily justified
(e.g. Cl 11). Furthermore, conservation of matter requires that
for the axisymmetric void
(Cl/r)ii(rJ,)/& = c, (3)
where v, is the normal velocity, or recession rate, of
the void surface relative to the adjoining solid mater- ial, and where r is the radius measured perpendicu- larly from the axis of symmetry. For the cylindrical void (i.e. the case of plane diffusive flow) we merely delete the two r’s, Hence the differential equation relating position and time dependent changes of the void profile is
(B/r)8[r3(ti1 + ti2)/i%]/& = v,
for the axisymmetric void, with
(4)
B = D,G,.fPy~kT, (5)
and for the cylindrical void the same equation applies with the r’s deleted and ti2 set to zero. The parameter B has dimensions of (length)4/(time), and has a funda- mental role in the subsequent development.
Similarly, for diffusion along the planar grain
boundary, also treated as isotropic in its plane, the atom flux rate is
Jb = -(D,i&/QkT)dp/&, (6)
where D, is the grain boundary diffusivity and 6, the ‘thickness’ of the diffusion zone. Now we observe that where a thin layer of matter is added at a flat segment of grain boundary, joining the crystals on either side, there is no change in area of the interface and hence no contribution of grain boundary free energy yb to p. However, to insert the matter it is necessary to do negative work against the normal stress 0 acting on the grain boundary at the place of insertion, so that the chemical potential is
p = PO - 00. (7)
Again, the strain energy term is neglected, justly so[ll].
For conversion of mass it is necessary that
(i2/r)d(rJ,)/& + &?/at = 0 (8)
for the axisymmetric geometry, where we define 6 as the effective thickening at the grain boundary due to adding matter to the adjoining grains. For the cylin- drical void geometry, with plane flow, we replace &
by 8.x (the x axis lies in the grain boundary, Fig. 1) and delete the two r’s, Hence, in view of the above expressions for Jb and p, the stress distribution and thickening in the grain boundary are related by
(D,G,R/kTr)a[rs~/ar]/~r + d6Jiit = 0 (9)
for the axisymmetric void. Again ?r -+ 3.x and the two r’s are deleted in the cylindrical case.
Since we regard the grains as rigid, 26/i% is uniform as depicted in Fig. 2a. The more elaborate models explored by Chuang [l l] and Vitek [ 151 regard the grains as elastically deformable so that 6 is itself coupled to the stress distribution g.
Now, equations (4) and (9) are the differential equa-
tions to be solved. respectively, on the free surface (to determine its shape) and on the grain boundary (to determine its stress distribution). The regions in
which the equations apply are themselves time de- pendent because the void grows along the grain boundary, and the solutions are coupled by contin- uity conditions at the void tip where it joins the grain boundary. First we note that the tip itself must have the equilibrium angle. from balance of local surface thermodynamic forces (as discussed, for example. in the analysis of grain boundary grooving [lo]). so that
zy, cos cl, = y* (10)
where $ is defined (see Fig. 1) so that n: - $ is the
angle between the grain boundary and the tangent to the void surface at the tip. Furthermore, the chemi-
cal potential must be continuous at the void tip (otherwise there would be an unbounded flux J there) and given the previous expressions for p this implies that
‘Jo = Y&I + K2)np (11)
where (TV is the normal tensile stress at the void tip and the curvatures are evaluated at the void tip. Recall that K* = 0 for the cylindrical void. Finally, continuity of flux at the void tip implies that
whence
(J&tin = 3 JA, ; (124
ab = (2kT/D,&)( JAi,,
= Cmhm‘m% + Kd/m;,, (12b)
where ab is the first derivative of the normal stress with respect to r or x (whichever is applicable) at the void tip.
The mathematical problem of determining the rate of void growth. for a given average tensile stress act- ing on the grain boundary, is too difficult to solve in generality. Nevertheless, it is useful to consider the
270 CHUANG et al.: DIFFUSIVE CAVITATION OF GRAIN INTERFACES
‘ideal’ solution procedure. We should let the cavity radius a vary with time in an arbitrary, yet to be determined manner, and determine the void shape by solving (4) subject to the conditions that the void height is zero and its slope angle is $ at the void extremities, r = a(t). Hence the void shape is a func- tional of the unknown function a(r), and therefore c0 and ob of equations (11) and (12b) are, in principle, determined as functionals of a(t). We next solve (9) for the stress distribution Q on the grain boundary, subject to given values cc, and ah at r = u(t) and, for example, to a condition that the flux vanish mid- way between voids on the grain boundary. These three conditions over-determine the second order dif- ferential equation (9) for Q, and hence the value of d8/& (uniform along the grain boundary for the rigid grains model) that is compatible with given values of co and a; is determined also. But since these latter two quantities are functionals of u(t), the stress distri- bution o(r, t) on the grain interface, and hence the average stress, is likewise determined, in principle, as a functional of u(t). But the average stress is to be regarded as a prescribed function of time, and its rela- tion to a(t) therefore provides a non-linear hereditary relation from which the actual history a(t) of void growth is to be determined.
Next we observe that a/v, where u G da/dt is the cavity growth speed, is a characteristic time associated with altering the equilibrium shape towards which the cavity surface is ever-proceeding by surface diffusion. Thus if 7, e a/u, or if
a3v/B G 6(cyhnder) or 24(axisym.), (15)
the cavity shape will be at equilibrium, whereas if 7s % a/v, or if
a3v/B 9 6(cylinder) or 24(axisym.), (16)
the cavity shape will remain effectively unrelaxed and growth will occur in a crack-like mode. It may be observed that in the early stages of creep rupture a3 and, presumably, v are small, but both increase in time. Hence it is possible that the early stages of growth occur in a quasi-equilibrium mode and the latter stages in a crack-like mode.
As remarked, this program of solution is too diffi- cult to carry out in general. We therefore limit con- sideration to histories a(t) which are very slow (quasi- equilibrium, spherical void shape) or very fast (thin, crack-like void shape), and try to judge the inter- mediate cases on the basis of characteristic relaxation time estimates (Appendix) and the solution for one tractable family of growth histories, namely, self-simi- lar growth with a(t) cc t114.
4.1 Quasi-equilibrium void shapes
As previously discussed, when a3v is sufficiently small the void retains a quasi-equilibrium shape of uniform curvature during growth. Thus the cylindri- cal void is composed of two circular cylindrical seg- ments or caps and the axisymmetric void of two spherical caps.
4.1.1 Long cylindrical void (circular cylindrical caps). For this case K~ = 0 and (see Fig. la)
K, = sin */a. (17)
Moreover, as a result of continuity of matter flux at both void tips
4. VOID SHAPES
42dWW = X2Q(Js)tipl (18)
where the quantity in brackets on the left is the void volume per unit length along the cylindrical axis and where
Our goal is to determine the boundary conditions oe, CT; at the void tip in relation to the time history of void growth. This is done here first for the limiting cases of slow, quasi-equilibrium growth and rapid, crack-like growth, and then for a family of inter- mediate cases based on self-similar solutions. The question arises, for a given history a(t) of cavity growth, how can we determine if we are close to one or another of the limiting cases? This can be done by first computing relaxation times associated with the attainment of equilibrium by surface diffusion, for initial disturbances from equilibrium with half-wave- lengths that we identify with the void diameter 2a. Thus for the long cylindrical void, we set l/2 = 2a, L = 00 in equation (A-11) to obtain a characteristic relaxation time
f($) = (1(1 - sin J, cos $)/sin2$. (19)
Note that in this case one cannot directly evaluate the flux into the tip by using the last form of (12b); this is because, effectively, the curvature gradient is very small and D, very large for near-equilibrium growth. Hence from equations (11) and (12b) we obtain
60 = ys sin $/a, ah = (2W~,UfW)a~ (20)
for the associated stress boundary conditions at the void tip.
(Ts)cylinder = (16/7r4)a4/B z a4/6B, (13)
B is defined in equation (5). For the axisymmetric geometry we should set l/2 = L/2 = 2a, since the void curves in two directions, and this gives a lower relaxation time
4.1.2 Axisymmetric void (spherical cups). For this case the analogous expressions are
K, = K2 = sin+/a (21)
and
dC(W3a3W)l/dt = 2d~(Js),i,l, (22)
where the bracketed term on the left is void volume and
(rl),,irym. = (4/7r4)a4/B z a4/24B. (14) h(G) = [l/(1 + cos $) - (cos 1(1)/2]/sin 1(1. (23)
CHUANG et al.: DIFFUSIVE CAVITATION OF GRAIN INTERFACES 271
Thus the boundary conditions on stress are
co = 2~~ sin *iu, 0; = (2kT/RD,S,)h(i,Qrc. (24)
This method of evaluation of co and crb coincides with that by Hull and Rimmer [IO] and in related studies.
4.2 Crack-like shape
In this limit we assume that a30 is sufficiently large
and that there is inadequate time for the large amounts of diffusive mass transfer necessary to estab- lish a rounded, near-equilibrium void shape. Instead, the void remains thin and crack-like with relatively small curvatures everywhere except near its tip (Fig. lb), where tii and its gradient must be large
in order to allow sufficient mass flow for the charac- teristic tip angle $ to develop. Assuming that the
speed ~1 does not change appreciably over distances comparable to the void thickness near the tip, the
near-tip shape is determined by the ‘steady-state’ analysis of Chuang and Rice [9]. In that analysis the void shape near the tip was assumed to remain un- changed, relative to an observer moving with the tip, during growth. This is an appropriate assumption for the high speed limit of void growth, as will be shown mathematically in the next section. The curvature and surface flux rate at the tip are then given by (see equa- tions (24) and (20) of [9]).
K,,~ = 2 sin($/2)(u/B)1’3
(J,),,, = 2 sin($/2)(B/Q)(r/BP3
where B is defined by (5) and it is noted that
(25)
(26)
2 sin(lC//Z) = (2y, - yb)“z/y~‘z.
(To make contact with the notation of [9], we note first that the sign convention for I\’ is reversed here. and also that in [9] a term 11 representing the surface density of diffusing atoms is employed, and this term is replaced here by $1 = S,/Q. Further, the above expressions actually represent the first term in a cer- tain series solution, but were shown in [9] to be accu-
rate to approximately 2% when compared to the exact, numerically obtained solution for steady-state growth.) The corresponding expression for the thick-
ness, 2u, of the void in steady-state growth, at dis-
era1 3-D voids, including the axisymmetric void. This
is because at rapid growth speeds the principal curva-
ture tii is large near the tip in the direction of growth whereas the curvature x2 remains small. For example, x2 = sin $/a at the tip of the axisymmetric cavity whereas ti, is the inverse of the near-tip radius of curvature, and is much larger for growth in a narrow, crack-like mode. Thus, in the rapid growth limit, the state of flow near the axisymmetric void tip approaches a plane flow state (see the next subsection) and (28), (29) are valid for that case also.
4.3 Linearization of equations for void shape
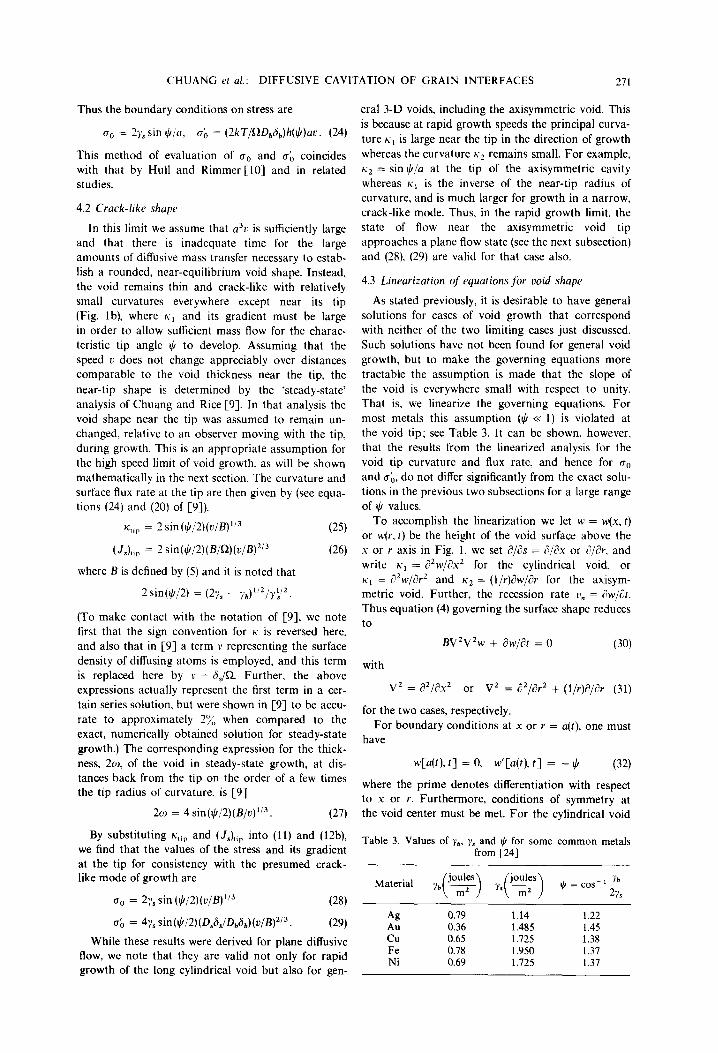
As stated previously, it is desirable to have general solutions for cases of void growth that correspond with neither of the two limiting cases just discussed. Such solutions have not been found for general void growth, but to make the governing equations more tractable the assumption is made that the slope of the void is everywhere small with respect to unity. That is, we linearize the governing equations. For most metals this assumption ($ << I) is violated at the void tip; see Table 3. It can be shown, however, that the results from the linearized analysis for the void tip curvature and flux rate, and hence for o. and u& do not differ significantly from the exact solu- tions in the previous two subsections for a large range of $ values.
To accomplish the linearization we let w = w(x, t) or w(r. t) be the height of the void surface above the x or r axis in Fig. 1. we set i)/ds = d/dx or (7/i%, and
write tii = d2w/iYx2 for the cylindrical void, or tii = a2w/ar2 and x2 = (l/r)rYw/& for the axisym- metric void. Further, the recession rate U, = ?w/dr. Thus equation (4) governing the surface shape reduces to
BV2V2w + awlat = 0 (30)
v2 = a2jaX2 or V2 = d2jar2 + (l/r)a/& (31)
for the two cases, respectively.
For boundary conditions at x or r = a(t), one must have
w[a(t), t] = 0, w’[a(t), t] = - $ (32) tances back from the tip on the order of a few times the tip radius of curvature, is [9]
where the prime denotes differentiation with respect to x or r. Furthermore, conditions of symmetry at
2w = 4 sin($/2)(B/o)“3. (27) the void center must be met. For the cylindrical void
By substituting K,~,, and (J&, into (11) and (12b), we find that the values of the stress and its gradient
Table 3. Values of yb, y. and JI for some common metals from [24]
at the tip for consistency with the presumed crack- like mode of growth are Material
o0 = 2y, sin (1j/2)(u/B)“~ (28)
rub = 4y, sin($/2)(D,SJD,G,)(o/B)2’3. (29) 2
While these results were derived for plane diffusive cu
flow, we note that they are valid not only for rapid Fe
growth of the long cylindrical void but also for gen- Ni
212 CHUANG et al: DIFFUSIVE CAVITATION OF GRAIN INTERFACES
these have the form rv’(0, t) = ~“‘(0, t) = 0; the latter condition implies zero matter flux at x = 0, and is to be replaced by the condition (d/dr)[V’w(O, t)] = 0 for the axisymmetric void.
To obtain quasi-equilibrium solutions for the linearized problem, we merely neglect the dw/& term. Then for both cases one obtains
w = ($/2)(a - ?/a) (33)
(replace r with x for the cylindrical void), which is the linear approximation to a circular cylindrical or
spherical cap. Further, one may compare the void tip curvature ki = $/a predicted from the linearized analysis with (17) or (2 I) and, evidently, it differs from
the exact quasi-equilibrium result only insofar as $ differs from sin $.
To examine the case of rapid growth within the linearized theory, it is convenient to make the substi-
tution
and to write
R = (a - r)/(B/o)1’3 (34)
w(r, t) = (B/u)“~ G,(R, t) (35)
in the equations governing axisymmetric void growth.
Note that (B/o) l/3 is a characteristic length associated with surface diffusion near a disturbance that moves with speed u; see, for example equation (27). Hence R and d are coordinates of the void profile as scaled by this length. Further let
E = (B/u%)“3 (36)
be the ratio of this characteristic length to the void radius; we are interested in the limit E + O+. In terms of G, the differential equation for axisymmetric void growth is readily shown to take the form
a49 3^ a2 a*+ a3 a\; -+2E;j+*~a~CE3;,a~ aR4
* +a&+,$R~+~;~$=o. (37)
Now, proceeding in the spirit of boundary layer theory, we focus on the limit of the above equation as e-t O+ with R remaining finite. One can view this limit as being one of extremely slow surface diffus- ivity, B + O+. There results
a%/a~~ + aqaR = 0.
It is straightforward to show that the same equation results, as E-+0+, when a similar analysis is done for the long cylindrical void case. Further the equa- tion has the unique solution, bounded for large R,
D = w~aiv,=,[i - exp(-R)] = $[I -exp(-R)]
or (38)
w = (B/u)“~${ 1 - exp[-(a - ~)/(B/u)‘/~]} (39)
for r near a. This result of the analysis is, of course,
just the linearized version of the crack-like void pro- file discussed earlier and, indeed, this solution for w leads to a curvature and flux rate at the tip which differ from the exact results of equations (25) and (26)
for the crack-like limit only insofar as 9 differs from 2sin($/2). We do not present the details here, but the same boundary layer technique can be applied to the full non-linear equation (4) describing the void profile. The results confirm that the solution as E + O+ is the same for the axisymmetric and cylindri- cal geometry, and coincides with the ‘steady-state’ solution of Chuang and Rice [9] outlined earlier.
4.4 Self-similar solution for uoid shape
Equation (30) is seen by dimensional considerations to have a family of ‘self-similar’ solutions that corre- spond to an increase in void radius with time accord- ing to
a = &(Bt)‘!4 (40)
where to is an arbitrary positive constant. The associ- ated void profile is such that
w = (B0”4!M5)
where
5 = (x or r)/(Bt)“4, (41)
and where the function r)(r) must satisfy
d4rl/dc4 - (5/4)dq/d5 + r1l4 = 0 (42)
for the long cylindrical void, or
d4qldt4 + (215) d3rlld5’ - (1K2) d2G152
+ UK3 - 5/4)drl/d5 + ~14 = 0 (43)
for the axisymmetric void. Evidently, 5 = to corre- sponds to the void tip, and the conditions
r1(50) = 0, VITO) = - 1 (44)
must be met there. Further, it may be anticipated that small values of <,, correspond to near-equili- brium conditions and large values to crack-like condi- tions. Solutions can be found in a power series form
v = : 4,,5” (45) It&=0
and results are discussed in the following subsections. 4.4.1 Long cylindrical uoid. Of the four linearly inde-
pendent solutions to equation (42) for 9, two can be discarded for failing to meet the symmetry conditions q’(O) = ~“‘(0) = 0. There remains
1 I
1 + 1 s2(mK4” > (46) Ill=, 1
CHUANG rt ul.: DIFFUSIVE CAVITATION OF GRAIN INTERFACES 213
in terms of to by imposing the conditions (44). 4.4.2 A.uisymmetric void. In this case the differential
equation (43) for PJ has a regular singular point at < = 0 where, in view of the symmetry conditions, one
has
r/‘(O) = 0,
[rj”(<) + q”(<)/< - T’(<)/<~] -+O as < 40. (48)
The general solution for q consists of four linearly independent solutions, two of which have logarithmic terms that become unbounded at < = 0. The above boundary conditions are met if the coefficients of these logarithmic solutions are set to zero, and there remain the terms
and B, and B, are determined from the boundary conditions (44) as quotients of series in to.
Expressions for curvature and flux at the void tip will not be shown in detail because of the complexity of the series expressions. These expressions can easily be derived. however, from
Further, the corresponding value of the stress and its gradient at the void tip are, from (11) and (12b)
00 = (cl/Y&) c- <oV”(50) + 11 (53)
ob = 2(0,6,/0,6,) (ir,la’)
x c- GV”‘(50) - 5oV”(50) - 11. (54)
Note that the series representation for any of these quantities is amenable to numerical computation.
In addition, the velocity can be derived by differentiating equation (40) to obtain
rz = 4(a3c/B). (55)
Note that u3u/B is the same dimensionless speed measure which occurred in our earlier discussion
based on relaxation times.
4.5 Discussion
Indeed, in order to develop a model of void growth using the various solutions found for the various stages of void growth, it would be instructive to com- pare the similarity solution to the equilibrium, as well as the crack-like solutions. For very small choices of co (corresponding to slow void growth) a good approximation to u from both (46) and (49) can be made by neglecting all but the first terms of the series; in this case
r? = (50/2X1 - (5/io)21 (56)
which is identical to equation (33) for the linearized equilibrium solution. Thus, the self-similar void shape approaches that of the linearized equilibrium void shape when a3c/B is chosen to be very small. Further- more. the shapes predicted by the similarity solution for co = I, 2 and 3 are compared to the linearized equilibrium shape in Fig. 3. Note the good agreement for the void shape in the neighborhood of the void tip; indeed, this is the region of interest since con-
q EOUlLlBRlUM - - - -
/A = 1 SIMILARITY
0.2 0.4 0.6 06 IO
Fig. 3. Axisymmetric void shapes predicted by the similarity solution for to = 1, 2, 3 and the librium solution.
quasi-equi-
274 CHUANG er at: DIFFUSIVE CAVITATION OF GRAIN INTERFACES
2L OJI
CRACK-LIKE ($8 l,___ ----_-----__
SIMILARITY
I I I
.2 .4 .6 .8 I.
r/a
.I - ($116
CRACK-LIKE
SlhlI?%fl~ ------__
1 I I .2 ‘4 .6 .8 I.
r/a
(b)
Fig. 4. Axisymmetric void shape predicted by the crack-like and similarity solutions for (a) &, = 8 and (b) &, = 16.
IO’
i $(K&,p
IO -
I --- EOUlLl8RllJM
i I ( 4,
,0-t *.5 I 1.0 2.0 1 4.0, 6.0 ,
10-e 10-l I IO IO’ IO’
IO'
IO2
IO
I
IO-’
10-a
10-S
3 I 2 4 6
, 1 I I I J
10-t 10-I I IO IO’ Id
0%4/B
(bl
Fig. 5. Graph of (a) non-dimensionalized curvature (xl) at the void tip and (b) non-dimensionalized flux at the void tip, each vs the non-dimensionafized void growth rate n’u/B for the axisymmetric
void as computed from the quasi-equjlibrium, similarity and crack-like solutions.
CHUANG et al.: DIFFUSIVE CAVITATION OF GRAIN INTERFACES 275
tinuity of flux and chemical potential are enforced here in solving the complete void rupture problem.
On the other hand, for larger choices of to (i.e. for higher growth rates) the similarity solution for
the axisymmetric void is compared to the crack-like solution in Figs. 4(a) and 4(b). The shapes are not alike since by fixing to an acceleration and higher order time derivatives, as well as a velocity are imposed at the void tip. In fact, examination of the acceler- ation reveals a deceleration at the void tip. Hence, the combination of both this deceleration and the
high velocity associated with large choices of to allows matter to be removed from the void tip to form a depression. But once again the agreement in the neighborhood of the void tip for these two solu- tions is quite good.
Furthermore, since we are most interested in deter- mining the values of the curvature and flux at the
void tip, it is worthwhile to make a comparison of these quantities as obtained from the various ‘linear- ized’ solutions.
Figure 5(a) is a graph of non-dimensionalized curva- ture at the void tip vs the void growth rate parameter a%/B. It is seen that for slow growth the curvature found from the similarity solution and that derived by the linearized equilibrium solution agree well. For larger values of the growth rate parameter, the curva- ture obtained from the similarity solution and that
obtained from the linearized crack-like solution are in close agreement.
Next consider Fig. 5(b) which is a graph of non- dimensionalized flux at the void tip vs the void growth rate parameter. Again as in the case of the
curvature til, for slower growth rates the equilibrium solution and the similarity solution for the flux at
the void tip are in good agreement; furthermore, for a3u/B > 4 the similarity solution acts as a smooth transition into the crack-like solution. Thus it can be concluded that near the void tip and for a3v/3 < 4, either the equilibrium solution or the similarity solu- tion approximates well the void growth behavior; for faster growth rates (i.e. a30/B 3 100) the crack-like solution can be used to describe this phenomenon. Moreover, the results are consistent with our earlier discussion of the relaxation time of surface self-diffu- sion for the axisymmetric void, in which we have sug- gested a%/B 2 24 as representative in separating the two limiting cases.
5. RIGID GRAIN MODEL AND STRESS VS GROWTH SPEED RELATIONS
As discussed in Section 2, the grains can be
assumed to separate rigidly as atoms diffuse into the grain boundary ahead of the void tip. Recall that elas- tic effects in the grains may be neglected under most circumstances since the elastic relaxation time is much shorter than any representative time of the void growth process. In this section, using the rigid grain assumption, the relationship between void growth
and applied stress will be explored for each of the void shapes considered in Section 4 (i.e. equilibrium,
self-similar, and crack-like) and in both two and three dimensions.
5.1 Long cyclindrical void
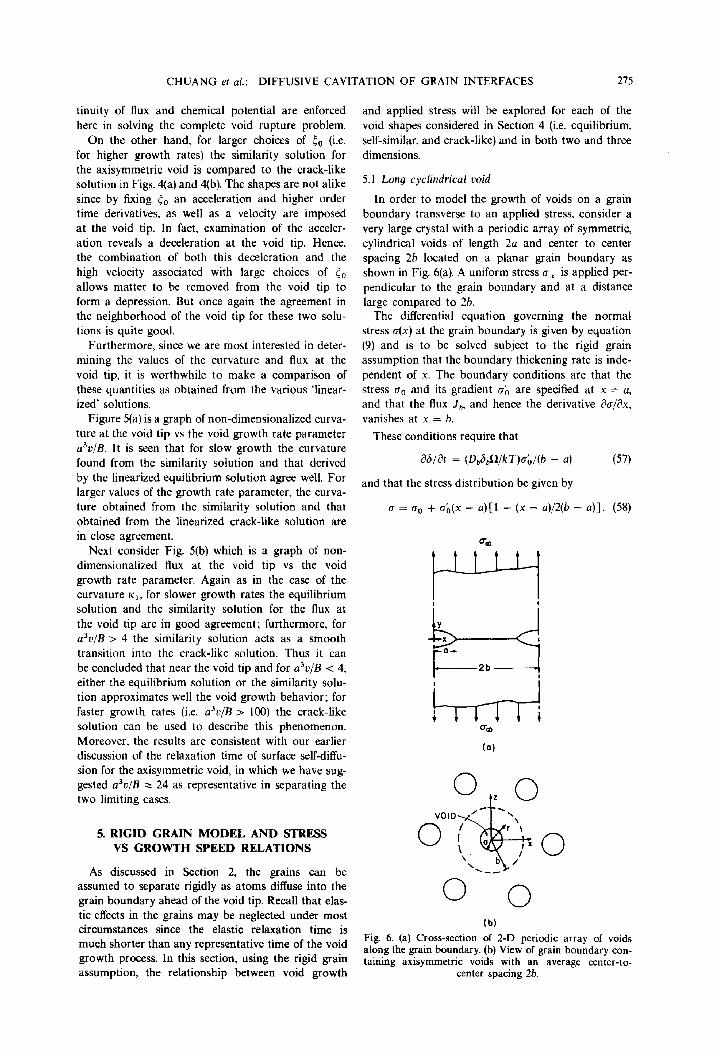
In order to model the growth of voids on a grain boundary transverse to an applied stress, consider a
very large crystal with a periodic array of symmetric, cylindrical voids of length 2a and center to center spacing 2b located on a planar grain boundary as shown in Fig. 6(a). A uniform stress u L is applied per- pendicular to the grain boundary and at a distance
large compared to 2h. The differential equation governing the normal
stress U(X) at the grain boundary is given by equation
(9) and is to be solved subject to the rigid grain assumption that the boundary thickening rate is inde- pendent of x. The boundary conditions are that the stress go and its gradient a; are specified at x = a,
and that the flux J,, and hence the derivative &s/ax, vanishes at x = b.
These conditions require that
aqat = (D,S,syk7-)dJ(b - a) (57)
and that the stress distribution be given by
r7 = u0 + ab(x - a)[1 - (x - a)/2(b - a)]. (58)
=a (a)
(b)
Fig. 6. (a) Cross-section of 2-D periodic array of voids along the grain boundary. (b) View of grain boundary con- taining axisymmetric voids with an average center-to- _.
center spacing 26.
276 CHUANG et al: DIFFUSIVE CAVITATION OF GRAIN INTERFACES
We regard the average remotely applied stress, o,, as being specified and this is given by
1 b 0, =-
s b 0 odx = (1 - d)u, + (1 - d)2bab/3 (59)
to the given values o. and ob at r = a and to zero
flux, au/& = 0. at r = b. Hence there results
%/at = 2(Db&$l/kT)aba/(b2 - a2) (66)
and the stress distribution is
where d = aJb. (r = o. + [acrb/(l - a2/b2)] Recalling now that B,, and oh are expressed, in gen-
eral, as functionals of the growth function a(t), the last equation relates the unknown growth to CJ,, regarded as given. As remarked, it is presently poss- ible to carry out the analysis only for special cases. Thus, for quasi-equilibrium growth (T,, and ah are given by equations (20), resulting in
X [ln(r/a) - (r2 - a2)/2b2]. (67)
The normal stress in the grain boundary can now be related to the applied stress a, through
1 b Q, = 7
s 7th (1 2nrcr dr = (1 - d2)a,, + (1 - d2)2 Qbuhb/3
(68) 1 - d ys sin $ cJX = __
d b + +d(l - d)2 ;;; ---.f(lcl)u (60)
b b
where f($) is defined by (19) and reduces to 2$/3 in the linearized approximation. Note that the speed 0 appears only in the last term and, if we solve
for 0,
3aDbSb 1 - d ys sin $
’ = 2d(l - d)‘kTb2f($) -_____
d b 1 (61) we find the anticipated cut-off stress level below which
sintering occurs. At the other extreme of void growth in the limiting
crack-like case, o. and a; are found from equations (28) and (29), and the expression for 0, is
Next consider an array of axisymmetric voids of radius a with average center to center spacing 2b located on a planar grain boundary as shown in Fig. 6b. As in the case of long cylindrical voids a uniform stress oX is applied transverse to and far from the grain boundary. The stress distribution is to be determined by solution of equation (9) subject
where, again, d = a/b and the function Q = Q(d) is defined by
Q = [3d/(l - d2)3]
x [ln(l/d) - (3 - dz)(l - d2)/4]. (69)
This function is evaluated in Table 4. We note that Q is not strongly variable over an appreciable range of d values; for example, it lies between approximately 0.5 and 0.65 for all values of d > 0.1 (i.e. for voidage
in excess of 1% of the grain boundary area). For quasi-equilibrium void growth u,, and a& are
given by (24) so that
0, = 2 1 - d2 ys sin $
- b + $d(l - d2)2 Q gh($)u d b b
(70)
where h($) is defined by (23) and reduces to 3$/8 upon linearization. Thus the growth rate is given by
3Q DbSb 1 - d2 yssin$
’ = 2d(l - d2)2QkTb2h(ll/) ‘Jr - 2 d b 1 (71)
under these conditions.
On the other hand, for growth at the crack-like limit u. and ah are given by equations (28) and (29) so that
2y, sin (G/2)(1 - d2) 6, =
b b3v 2/3
+ $A(1 - d2)Q s (>I
. (72)
This can be solved for u to give
v = (27/64)(B/b3A3)
x [(1 + QXA)1’2 - 113/Q3(1 - d2)3 (73)
where Z has been defined in (65) and A in (63).
Table 4. Values of the function Q(d) appearing in solution for axisymmetric void growth; d = a/b = ratio of cavity diameter to average center-to-center spacing
d 0 0.01 0.05 0.10 0.20 0.40 0.60 0.80 1.00
%)Q,d : 0.12 0.34 0.48 0.61 0.65 0.61 0.55 0.50
(1 - 11.6 6.78 4.76 2.93 1.36 0.65 0.25 0
CHUANG rt al.: DIFFUSlVE CAVITATION OF GRAIN INTERFACES 277
5.3 Comparisons based on the similarity solution
The similarity solution provides, at the price of
linearization, a means of interpolating approximately between the quasi-equilibrium and crack-like limiting cases. Our discussion here is limited to the axisym- metric model; a MSc. thesis by Kagawa [12] may be consulted for a somewhat analogous discussion based on the long cylindrical void model.
To compare the above equilibrium and crack-like
solutions with the similarity solution. we make the definitions
and
s = [a, /(I - @)]/[2r, sin $/a] (74)
P = C(1 - d2)Q(d)/dl(D,s,/D,s,). (75)
Observe that ax /( 1 - d’) is the average stress on the unvoided portion of the grain boundary, so that s is this stress normalized by the stress which just pre- vents sintering of an equilibrium-shaped void of
radius a. The part of the parameter p that depends on d( = a/b) is given in the last line of Table 4; addi- tionally, p is proportional to what has been defined as A in (63). With these notations, the quasi-equili- brium solution (70) becomes
s = 1 + [h($)/3 sin $]p(a%/B);
and upon linearization
s = 1 + (1/8)p(a%/B);
the crack-like solution (72) is
(764
(76b)
s = [sin($/2)/sin $1 [(u~u/B)“~
+ (2/3)p(~%/B)“~], (77a)
whereupon linearization gives
s = (1/2)(a’~/B)“~ + (1/3)~(a~~/B)*‘~. (77b)
For the similarity solution, g0 and a; are determined
by equations (53) and (54), and the results are inserted into (68) to solve for u, In terms of the linearized version of the stress measure s,
s = (1/2)C- &J”&) + 11
+ (1/3)~[- S;tl”‘(&,) - 5or1”(50) - 11 (78)
where it is recalled that tt = 4a3u/B and, further, that a and v vary during the growth process as t’14 and te314 so that a3v is constant. This feature requires that u, has a rather artificial variation with time in order to be consistent with the presumed growth his- tory. However, our interest in the similarity solution is only in formulating a reasonable procedure for extrapolating between the quasi-equilibrium and crack-like limiting cases.
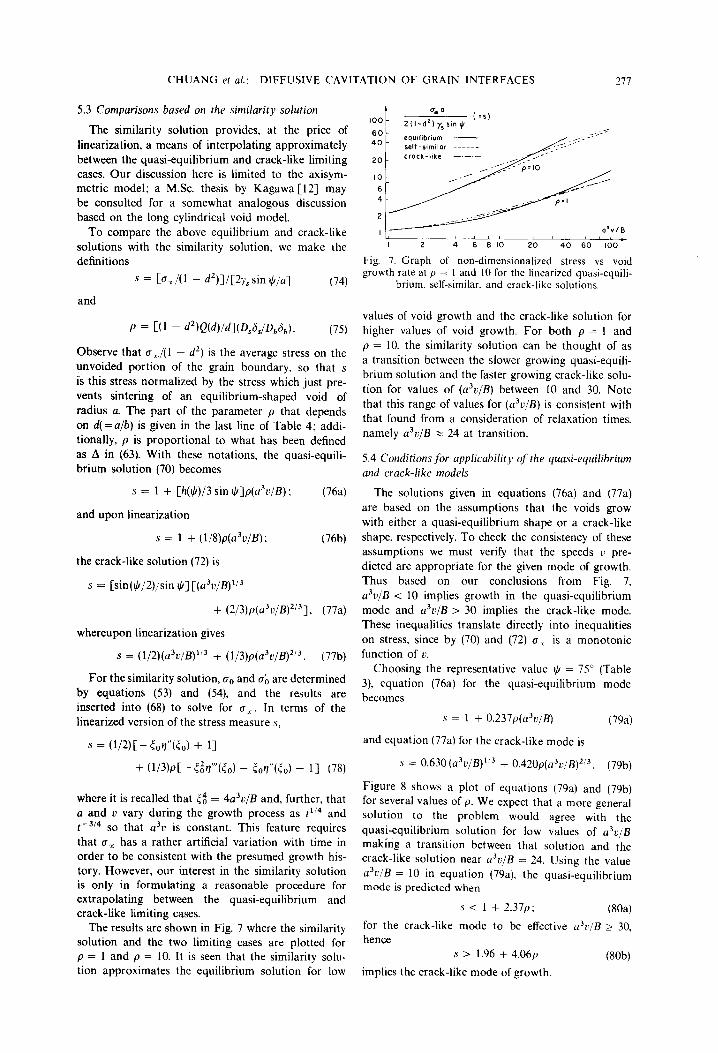
The results are shown in Fig. 7 where the similarity solution and the two limiting cases are plotted for p = 1 and p = 10. It is seen that the similarity solu- tion approximates the equilibrium solution for low
% 0 100
-60 2(l-dz)y,smJI
t’s)
40 equilnbrwm - self-slmtlor ------
I 2 4 6810 20 40 60 100
Fig. 7. Graph of non-dimensionalized stress vs void growth rate at p = I and IO for the linearized quasi-equili-
brium, self-similar. and crack-like solutions.
values of void growth and the crack-like solution for higher values of void growth. For both p = 1 and p = 10, the similarity solution can be thought of as a transition between the slower growing quasi-equili- brium solution and the faster growing crack-like solu- tion for values of (a3u/B) between 10 and 30. Note that this range of values for (a3~/B) is consistent with that found from a consideration of relaxation times, namely a3r/B 4 24 at transition.
5.4 Conditions for applicability of the quasi-equilibrium
and crack-like models
The solutions given in equations (76a) and (77a) are based on the assumptions that the voids grow with either a quasi-equilibrium shape or a crack-like
shape, respectively. To check the consistency of these assumptions we must verify that the speeds L’ pre- dicted are appropriate for the given mode of growth. Thus based on our conclusions from Fig. 7, a3u/B c 10 implies growth in the quasi-equilibrium mode and a3u/B > 30 implies the crack-like mode. These inequalities translate directly into inequalities
on stress, since by (70) and (72) cr I is a monotonic
function of t’. Choosing the representative value ti = 75” (Table
3), equation (76a) for the quasi-equilibrium mode
becomes
s = 1 + 0.237p(a3v/B) (79a)
and equation (77a) for the crack-like mode is
s = 0.630 (a3~‘/B)‘i3 + 0.420p(a3v/B)*“. (79b)
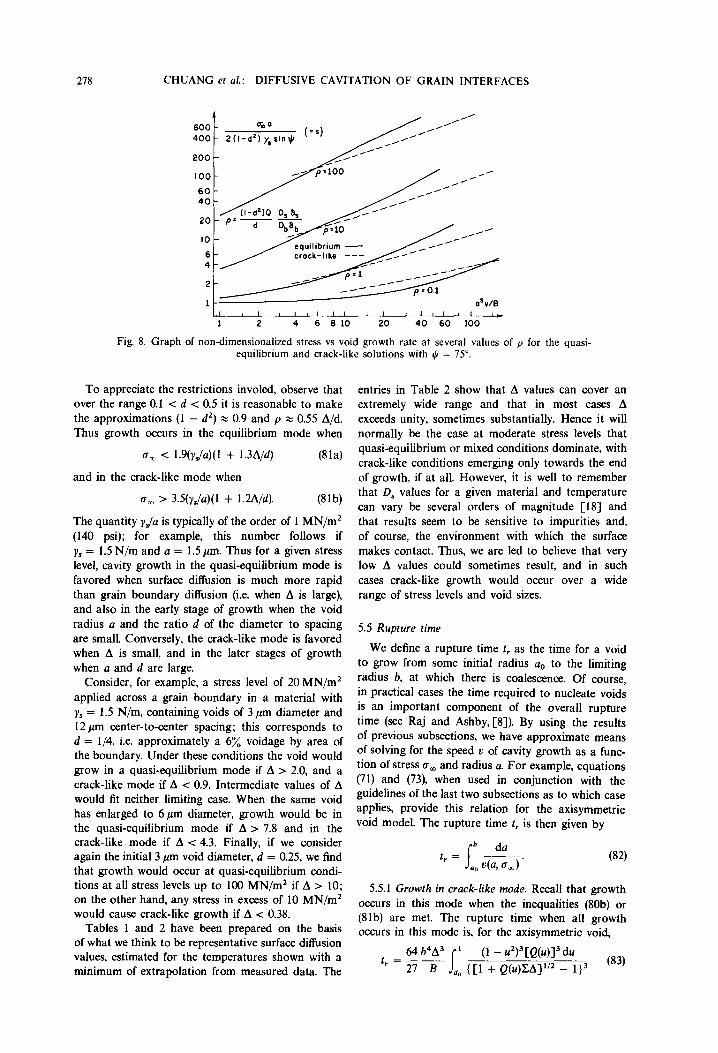
Figure 8 shows a plot of equations (79a) and (79b) for several values of p. We expect that a more general solution to the problem would agree with the
quasi-equilibrium solution for low values of &/B making a transition between that solution and the crack-like solution near a3v/B = 24. Using the value
a3a/B = 10 in equation (79a). the quasi-equilibrium mode is predicted when
s< lf2.37~; (80a)
for the crack-like mode to be effective a3v/B 2 30, hence
s > 1.96 + 4.06~ (8Ob)
implies the crack-like mode of growth
278 CHUANG er al.: DIFFUSIVE CAVITATION OF GRAIN INTERFACES
400- 2(1-d’)y,sing
Fig. 8. Graph of non-dimensionalized stress vs void growth rate at several values of p for the quasi- equilibrium and crack-like solutions with $ = 75”.
To appreciate the restrictions involed, observe that over the range 0.1 < d < 0.5 it is reasonable to make the approximations (1 - d*) z 0.9 and p z 0.55 A/d. Thus growth occurs in the equilibrium mode when
u, < 1.9(yJa)(l + 1.3A/d) (8la)
and in the crack-like mode when
u, > 3.5(y&)(l + 1.2A/d). (8lb)
The quantity U&I is typically of the order of 1 MN/m* (140 psi); for example, this number follows if yS = 1.5 N/m and a = 1.5 pm. Thus for a given stress level, cavity growth in the quasi-equilibrium mode is favored when surface diffusion is much more rapid than grain boundary diffusion (i.e. when A is large), and also in the early stage of growth when the void radius a and the ratio d of the diameter to spacing are small. Conversely, the crack-like mode is favored when A is small, and in the later stages of growth when a and d are large.
Consider, for example, a stress level of 20 MN/m’ applied across a grain boundary in a material with yS = 1.5 N/m, containing voids of 3 pm diameter and 12 pm center-to-center spacing; this corresponds to d = l/4, i.e. approximately a 6% voidage by area of the boundary. Under these conditions the void would grow in a quasi-equilibrium mode if A > 2.0, and a crack-like mode if A < 0.9. Intermediate values of A would fit neither limiting case. When the same void has enlarged to 6pm diameter, growth would be in the quasi-equilibrium mode if A > 7.8 and in the crack-like mode if A < 4.3. Finally, if we consider again the initial 3 pm void diameter, d = 0.25, we find that growth would occur at quasi-equilibrium condi- tions at all stress levels up to 100 MN/m* if A > 10; on the other hand, any stress in excess of 10 MN/m’ would cause crack-like growth if A < 0.38.
Tables 1 and 2 have been prepared on the basis of what we think to be representative surface diffusion values, estimated for the temperatures shown with a minimum of extrapolation from measured data. The
entries in Table 2 show that A values can cover an extremely wide range and that in most cases A exceeds unity, sometimes substantially. Hence it will normally be the case at moderate stress levels that quasi-equilibrium or mixed conditions dominate, with crack-like conditions emerging only towards the end of growth, if at all. However, it is well to remember that D, values for a given material and temperature can vary be several orders of magnitude Cl83 and that results seem to be sensitive to impurities and, of course, the environment with which the surface makes contact. Thus, we are led to believe that very low A values could sometimes result, and in such cases crack-like growth would occur over a wide range of stress levels and void sizes.
5.5 Rupture time
We define a rupture time 1, as the time for a void to grow from some initial radius a0 to the limiting radius b, at which there is coalescence. Of course, in practical cases the time required to nucleate voids is an important component of the overall rupture time (see Raj and Ashby,[8]). By using the results of previous subsections, we have approximate means of solving for the speed v of cavity growth as a func- tion of stress Q, and radius a. For example, equations (71) and (73), when used in conjunction with the guidelines of the last two subsections as to which case applies, provide this relation for the axisymmetric void model. The rupture time t, is then given by
(82)
5.5.1 Growth in crack-like mode. Recall that growth occurs in this mode when the inequalities (80b) or (81b) are met. The rupture time when all growth occurs in this mode is, for the axisymmetric void,
64 b4A3 (1 - u’)‘[Q(u)J”du t’=uB
{[1 + Q(u)XA]“~ - 1}3 (83)
CHUANG et al.: DIFFUSIVE CAVITATION OF GRAIN INTERFACES 279
where do = aO/b and where the stress measure I: is defined by (65) and the function Q(d) by (69). This integral cannot be carried out in closed form. How- ever, by inspection of Table 4 it is seen that Q is not strongly variable for d > 0.1 and it suffices to use an average value G t 0.6 in the integral. Indeed the integrand becomes independent of Q when CA is very small, and depends on the 3/2 power of Q when ZA is very large. Thus the replacement of Q by g is not critical when do > 0.1 and there results
t, = 0.234 ; H(dJ A
1
3
(1 + 0.6XA)“’ - 1 ’ (84)
where the function H(d) is
H(d,) = (35/16) s
’ (1 - u’)~ du do
= (I -d,)[l -d&l +d,)(19- 16d~+5d~~/i6].
(85)
The expression for t, has two limiting ranges. First if 0.6ZA < 0.5, it is suitable to write (1 + x)“’ = 1 + x/Z and thus (84) becomes
t, = 8.67(b4/B)H(d0)/E3
= 3.66(b4/B)(yJbg,)‘H(d,)sin3(lE//2) (86)
where (65) for Z is used. Thus in this limiting case the rupture time varies as c;‘. Further, the result is independent of A, and hence of D, so that the rupture lifetime in this limit is controlled by the rate of surface diffusion; i.e. r, is inversely proportional to D, (note that B is proportional to D,). Of course, the inequality that must be met for validity of this limit, namely 0.6CA < 0.5, implies that A is small. Specifically, when $ = 75”, the restriction on A is
A < 0.4y,lba,. (87)
Hence, if we take ys = 1.5 N/m and b = 6pm as pre- viously, we find that the restriction, for validity of the inverse cube relation, is A < 0.02 when a, = 5 MN/m’, A < 0.005 when a,, = 20 MN/m’, A < 0.001 when o,X = 100 MN/m’. All these com- binations of a, and A values would, generally, be sufficient to meet the basic inequalities cited earlier for validity of the crack-like growth model. However, it is rarely, if ever, the case that such small A values occur (see the discussion at the end of subsection 5.4) and thus a a; 3 law should not frequently be observed. We discuss work by Goods and Nix [i9,20] on silver subsequently; in that case the data on t, is well fit by an inverse cube law.
The other limiting case is when 0.6CA > 100. It is then appropriate to write (1 + x)“’ - 1 = x1” and thus (84) becomes
E, = 0.503(&4/B)H(d~)(A~)~‘2
= 0.327(b4/B)(y,A/bo,)3’ZH(d0)sin3~2($/2) (88)
Now the rupture time varies as the inverse 3/Z power of stress. Further, material parameters enter in the form A3”/B so that t, is controlled by the speed of both surface and grain boundary diffusion, and is in- versely propo~ional to Dz'*/Df “. Again setting $ = 7.5”, the restriction on A for validity of this limit- ing form is
A > 76 y,jba x. (89)
Again taking ys = 1.5 N/m. h = 6 pm, the inequality reads A > 4 for 6, = 5 MN/m’, A > 1 for
6, = 20 MN/m’, and A > 0.2 for ax = 100 MN/ml. From Table 2 and what has been said earlier, those restrictions on A will typically, although not always. be met. Hence, if the applied stress is high enough so that the inequalities (80b) or (8lb) ensuring a crack-like growth mode are met, it is to be expected that the rupture lifetime will follow a 0~~‘~ law. This seems consistent with results on a copper bi-crystal specimen reported by Raj [21].
For the 2-D long cylindrical void model u is given by (64), assuming that conditions for crack-like growth are met. The integral (82) for t, can be done exactly in this case and we find
t, = 0.593 ;(l - d,)4 A ‘3
(1 + zA)“z _ 1‘ 1 ’ (‘O)
This is similar to the above result for an axisymmetric void, and exhibits similar limiting stress exponents for t,.
5.5.2 Growth in quasi-equilibrium and mixed modes. Again consider the axisymmetric geometry. When the inequalities (80a) or (8la) are met (i.e. for low CT, or large A/d), growth in the quasi-equilibrium mode is insured and D is given by (71). The rupture time is calculated from (82) as
t, = 2k7-b3h($) ’
s
~(1 - u’)‘Q(U)du
3RD&,u. do 1 - 2[(1 - u2)/u] [&sin $,/a, b] .
(911 The denominator in the integrand equals 1 - l/s, where s, as defined in (74), is the ratio of the applied stress to that which just equilibrates the void against sintering. Hence, when s * 1 the denominator can be replaced by unity and there results, when Q is given an average value of 0.6 as is appropriate when d > 0.1,
t, = 0.067 kTb3h(+)(1 - d;)3/RD,6,u, . (92)
Hence the lifetime is inversely proportional to o,, and to L),. This expression must be used with care, how- ever, because the condition s >> 1 will be inconsistent with the basic inequality of (SOa), which must be met for validity of the quasi-equilibrium model, unless p =: 0.556/d >> 1. When s is not large, an approximate procedure which slightly underestimates the rupture time is provided by evaluating the denominator in the integrand at its lower limit. This is equivalent to replacing
era by a,. - 2(1 - d$y, sin ~/bd~
in the expression for t,.
280 CHUANG et al.: DIFFUSIVE CAVITATION OF GRAIN INTERFACES
To assess the error involved when rupture time is estimated by the quasi-equilibrium model, but when
the crack-like model is the more appropriate, we cal-
culate the ratio of the rupture time prediction of (92) to that of (88) noting that the latter is appropriate for the crack-like model at representative stress levels (say, l~lOOMN/m*) if A is of the order of unity or larger. Thus, evaluating the expressions for $ = 75” and do = 0.25, we find
Suppose that ys = 1.5 N/m and b = 6 pm as pre- viously. Then for A = 1 and stresses 0% between 10 and lOOMN/m’ (well beyond typical stress levels for validity of the quasi-equilibrium model), the above rupture time ratio ranges from approximately 3 to 9, and there is significant error. of course, larger A values diminish the error, in proportion to A-“‘.
It may frequently happen that the early stages of
void growth are best decribed by a quasi-equilibrium model and the later stages by a crack-like model. To estimate an a/b ratio, say dl, at which the description of growth should change from quasi-equilibrium to crack-like, take the average of equations (8Oa) and (80b) so that
s = 1.5 + 3.2~ (94)
or approximately, for 0.1 < dl < 0.5,
u, b/y, = (2.6/d,)(l + 1.2A/d,). (95)
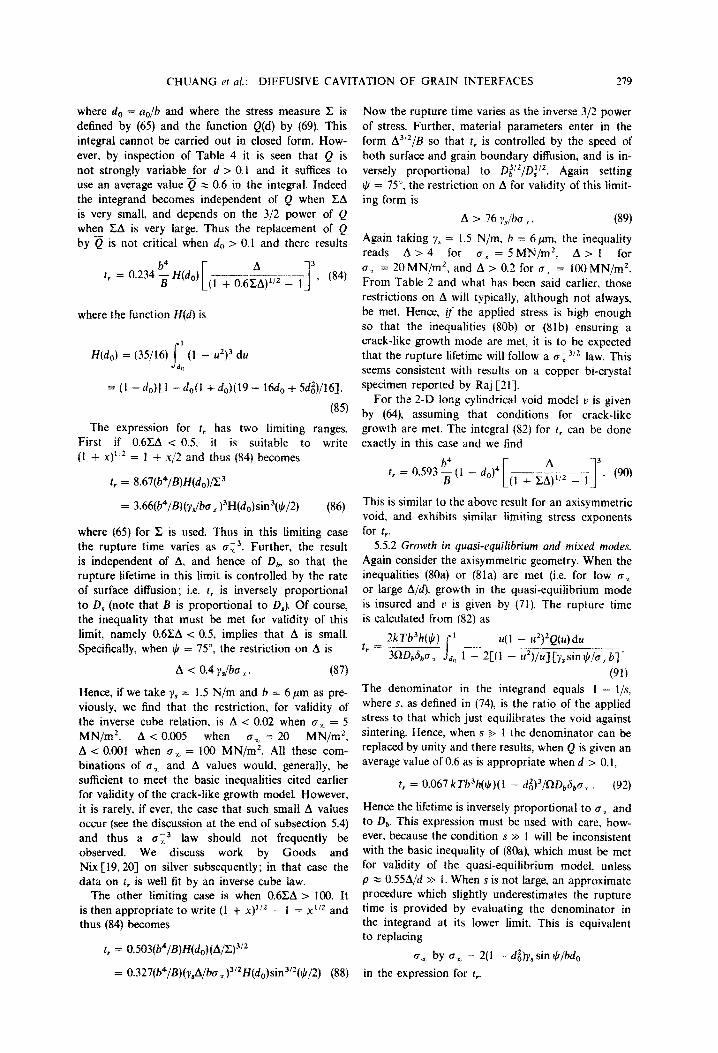
Choosing several representative values for A, Fig. 9 shows the regions in which each mode prevails. As
70 -
60 -
50 - CRACK-LIKE
40 - EPUlLlBRlUM
30 -
20 -
IO -
0 d,
0.2 0.4 0.6 0.8 1.0
Fig. 9. Graph of non-dimensionalized stress vs non-dimen- sionalized void radius at which void growth becomes crack-like. Arrows indicate the direction in which each mode of growth is applicable; similarly directed arrows
can be attached to each curve.
expected, for lower values of A, the crack-like mode of growth prevails at lower stress levels, and con- versely. To estimate rupture time assuming a process in which both modes are active, use equation (92) to obtain the time for the quasi-equilibrium portion
of growth by replacing (1 - d@3 with [(l - d@3 - (1 - df)‘], and to this add the result of
equation (84) for the time spent in crack-like growth, replacing H(d,) by H(d,) in that equation.
6. DISCUSSION OF EXPERIMENTAL RESULTS
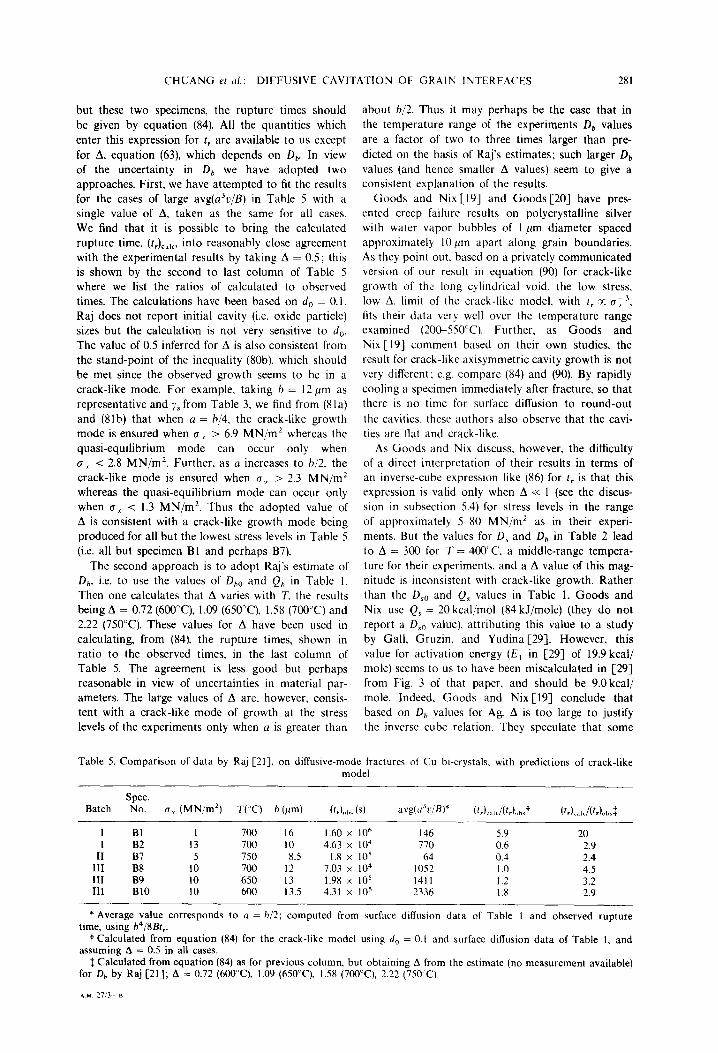
Raj [21] has recently reported results of elevated temperature fracture experiments on copper bi-crystal specimens containing silica and copper oxide particles along a grain boundary oriented perpendicular to the direction of tensile loading. Of the 12 specimens stud- ied, Raj observed that 4 failed entirely or in part by the plastic-flow induced growth of holes, initiated at silica particles, and 2 failed due to “incompatibility of the matrix slip at the grain boundary.” The remain- ing 6 specimens, for which the results are summarized in Table 5, were reported to have failed by cavity growth through diffusional transport. These cavities did not initiate at the silica particles but rather at more distantly spaced copper oxide particles, and evi- dence was presented to show that the voids formed very early in the deformation history.
The first two columns of Table 5 correspond to Raj’s system for identifying the specimens; the next columns give the applied stress (labelled cm here), the temperature, one-half of the reported center-to-center spacing of the rupture cavities on the fractured grain boundary (i.e. the distance referred to as b here), and the observed time to rupture.
Comparison with theory is hindered by the lack of experimental data on D, for Cu. The numbers listed in Table 1 for D,, and Qb in this case are merely estimates by Raj [21], based on analogy with other metals, but no measurement has been reported and these values may be subject to substantial errors. The surface diffusivity results, however, do result from measurements at temperatures just slightly above 750°C by Bonzel and Gjostein, reported in [18], and are consistent with results for other f.c.c. metals,
except Ag, when D, is plotted following Gjostein against T,,jT (e.g. Fig. 17 of [18]). From these results for D, we compute an “average” value of the dimen- sionless speed parameter a3u/B by setting a = b/2 and evaluating v as b/(tJobrr where (t&,\ is the observed rupture time in Table 5. Thus
avg(a3u/B) = b4/8B(t,),,,,.
Calculating B from equation (5) and the data in Tables 1 and 3, we show this average in the third to last column of Table 5. The numbers are all large and suggest that the inequality a3v/B >> 24, ensuring growth in the crack-like mode, is met for all speci- mens except for B7 and perhaps Bl. Thus, for all
CHUANG et al.: DIFFUSIVE CAVITATION OF GRAIN INTERFACES 281
but these two specimens, the rupture times should
be given by equation (84). All the quantities which enter this expression for t, are available to us except
for A, equation (63), which depends on f&. In view of the uncertainty in D, we have adopted two approaches. First, we have attempted to fit the results for the cases of large avg(a3v/B) in Table 5 with a single value of A, taken as the same for all cases.
We find that it is possible to bring the calculated rupture time, (&_ into reasonably close agreement with the experimental results by taking A = 0.5: this is shown by the second to last column of Table 5 where we list the ratios of calculated to observed times. The calculations have been based on do = 0. I Raj does not report initial cavity (i.e. oxide particle) sizes but the calculation is not very sensitive to d,. The value of 0.5 inferred for A is also consistent from the stand-point of the inequality (80b), which should be met since the observed growth seems to be in a crack-like mode. For example, taking h = 12 pm as
representative and yS from Table 3, we find from (8la) and @lb) that when u = h/4, the crack-like growth mode is ensured when (T, > 6.9 MN/m2 whereas the
quasi-equilibrium mode can occur only when 0, < 2.8 MN/m2. Further, as a increases to h/2. the
crack-like mode is ensured when 0, > 2.3 MN/m2 whereas the quasi-equilibrium mode can occur only when g, (: 1.3 MN/m2. Thus the adopted value of A is consistent with a crack-like growth mode being produced for all but the lowest stress levels in Table 5 (i.e. all but specimen Bl and perhaps B7).
The second approach is to adopt Raj’s estimate of D,,, i.e. to use the values of D,,, and Q,, in Table 1. Then one calculates that A varies with T. the results being A = 0.72 (600”(I), 1.09 (65o”C), 1.58 (700°C) and 2.22 (750°C). These values for A have been used in calculating, from (84), the rupture times, shown in ratio to the observed times, in the last column of Table 5. The agreement is less good but perhaps reasonable in view of uncertainties in material par- ameters. The large values of A are, however, consis- tent with a crack-like mode of growth at the stress levels of the experiments only when a is greater than
about h/2. Thus it may perhaps be the case that in the temperature range of the experiments Db values
are a factor of two to three times larger than pre-
dicted on the basis of Raj’s estimates; such larger D,,
values (and hence smaller A values) seem to give a consistent explanation of the results.
Goods and Nix [ 191 and Goods [20] have pres- ented creep failure results on polycrystalline silver with water vapor bubbles of I pm diameter spaced approximately 10 pm apart along grain boundaries. As they point out, based on a privately communicated version of our result in equation (90) for crack-like growth of the long cylindrical void, the low stress. low A. limit of the crack-like model, with t, x a~~. fits their data very well over the temperature range examined (20&55o”C). Further, as Goods and Nix [19J comment based on their own studies, the result for crack-like axisymmetric cavity growth is not very different; e.g. compare (84) and (90). By rapidly cooling a specimen immediately after fracture. so that there is no time for surface diffusion to round-out
the cavities. these authors also observe that the cavi- ties are flat and crack-like.
As Goods and Nix discuss, however, the difficulty of a direct interpretation of their results in terms of an inverse-cube expression like (86) for t, is that this expression is valid only when A K 1 (see the discus- sion in subsection 5.4) for stress levels in the range
of approximately 5-~80 MN/m’ as in their experi- ments. But the values for D, and D, in Table 2 lead to A = 300 for T = 400’ C, a middle-range tempera- ture for their experiments, and a A value of this mag- nitude is inconsistent with crack-like growth. Rather than the Dso and QS values in Table 1, Goods and Nix use Q, = 20 kcal/mol (84 kJ/mole) (they do not report a DrO value). attributing this value to a study by Gall, Gruzin, and Yudina [29]. However, this value for activation energy (E, in [29] of 19.9 kcal/ mole) seems to us to have been miscalculated in [29] from Fig. 3 of that paper. and should be 9.0 kcal/ mole. Indeed. Goods and Nix [I91 conclude that based on D, values for Ag, A is too large to justify the inverse cube relation. They speculate that some
Table 5. Comparison of data by Raj [21], on diffusive-mode fractures of Cu bi-crystals, with predictions of crack-like model
Spec. Batch No. 6, (MN/m’) T(“C) h (pm) (L),,h. (s) avg(tr%lB)* (~,L,&,),ht ~~rLlcii(~r)“hrS
I Bl 1 700 16 1.60 x lo6 146 5.9 20 I B2 13 700 10 4.63 x lo4 770 0.6 2.9
II B7 5 750 8.5 1.8 x 10’ 64 0.4 2.4 III B8 10 700 12 7.03 x 10⁴ 1052 1.0 4.5 III B9 10 650 13 1.98 x IO5 1411 1.2 3.2 III BlO 10 600 13.5 4.31 x 10⁵ 2336 1.8 2.9
* Average value corresponds to a = h/2; computed from surface diffusion data of Table 1 and observed rupture time, using h4/8Bt,.
t Calculated from equation (84) for the crack-like model using d, = 0.1 and surface diffusion data of Table 1, and assuming A = 0.5 in all cases.
$ Calculated from equation (84) as for previous column, but obtaining A from the estimate (no measurement available) for D, by Raj [21]; A = 0.72 (600°C). 1.09 (650°C). 1.58 (700°C). 2.22 (75O’C).
A.M. 2713. R
282 CHIJANG et af.: DIFFUSIVE CAVITATION OF GRAIN INTERFACES
segregant, possibly oxygen or hydrogen, at the grain boundaries could greatly enhance the transport there, giving rise to a much lower A which would be consis- tent with the observed crack-like cavity shape.
In any event, for sufficiently small A (i.e. less than approximately 0.001 for the range of stresses in their experiments) the expression (84) for t, becomes inde- pendent of A and reduces to (86). Using the value of Q, noted above, Goods and Nix show that this expression predicts reasonably the dependence of t, on (r I, T and h over the range examined.
7. CONCLUSION
We have shown how non-equilibrium aspects of surface diffusion can affect the creep cavitation pro- cess. The discussion is organized around two limiting cases: the quasi-equilibrium and the crack-like mode of cavity growth. Further, by recourse to character- istic relaxation time estimates, and to a self-similar solution for cavity growth within the linearized theory, we have shown when one model or the other applies and how to interpolate between them. More quantitative guidelines are given in Section 5 but, essentially, the quasi-equilibrium mode is favored when the stress level is low, when the cavity diameter and ratio of diameter to spacing is small, and when the parameter A, giving the ratio of surface to grain boundary diffusivities, is large; the crack-like mode is favored at high stresses, larger diameters, and small A. The parameter a3u/B is identified as a proper dimensionless measure of speed, in order to ascertain whether the cavity is more nearly of quasi-equi~brium or crack-like shape.
The relation of applied stress to cavity growth rate is different according to the cavity shape. These rela- tions and expressions for the rupture time are devel- oped in Section 5. While uncertainties remain due to the lack of definitive surface and grain boundary diffusion data, the experimental results of Raj [Zl] on Cu bi-crystals, and of Goods and Nix [19,20] on Ag polycrystals with grain boundary water vapor bub- bles, exhibit features that seem consistent with our rupture time predictions based on the crack-like mode of growth.
Acknowledgements-The study was supported by the U.S. Department of Energy (formerly Energy Research and De- velopment Administration) under contract EY-Xi- S-02-3084 with Brown University. In addition, L. Sills was supported in this work by the NSF Materials Research Laboratory at Brown. We are grateful for discussions with M. F. Ashby in the early stages of the study and, more recently, with S. H. Goods, W. D. Nix, and A. G. Evans.
1.
2.
REFERENCES
A. H. Cottrell, Structural Process in Creep Symposium of the Iron and Steel Institute and lnst~tute of Metals, 8 (1961). R. C. Gifkins, Proc. Tewksbury Symposium on Fracture, 44 (1965).
3
4, 5. 6. 7. 8. 9.
IO. II. 12. 13.
14. 15. I 6. 17.
18.
19,
20. 21 22.
23.
24.
25.
26. 27.
28.
29.
F. Garofalo. Fundamentals of Creep and Creep-Rupture in Metals. Macmillan, New York (1965). D. Hull and D. E. Rimmer, Phil. Mag. 4, 673 (1959). M. V. Speight and J. E. Harris, Mef. Sci J. I,83 (1967). J. Weertman, Scripta metall. 7, 1 I29 (1973). F. H. Vitovec, J. Mat. Sci. 7, 615 (1972). R. Raj and M. F. Ashby, Acts metaH. 23, 653 (1975). T.-J. Chuang and J. R. Rice, Acta metal!. 21, 1625 (1973). W. W. Mullins, J. appl. Ph_vs. 28, 333 (1957). T.-J. Chuang, Ph.D. Thesis, Brown University (1974). K. I. Kagawa, Sc.M. Thesis, Brown University (1976). P. G. Shewmon, D~Q$sion in Solids. McGraw Hill, New York (1963). W. W. Mullins. J. appi. Phys. 30, 17 (1959). V. Vitek, Acta rn~tu~~. To be published. C. Herring, J. upp/. Phys. 21, 437 (1950). C. Herring, The Physics of Powder Metallurgy (edited by W. E. Kingston) p. 143. McGraw Hill (1951). G. Neumann and G. M. Neumann, Surface Self-Di#u- sion of Metals. Diffusion Information Center (1972). S. H. Goods and W. D. Nix. Acta metall. 26, 739 (1978). S. H. Goods, Ph.D. Thesis, Stanford University (1977). R. Raj, Acta metall. 26, 341 (1978). C. J. Smithells and E. A. Brands, Metals Reference Book. Butterworth, London (1976). H. W. King, Phys~ca~ ~etuliurgy. North-Holland (I 970). J. P. Hirth and J. Lothe, Theory of Dislocations, p. 764. McGraw-Hill. New York. (1978). E. H. Kennard, Kinetic Theory df G&s. McGraw-Hill, New York (1938). J. Weertman, Acta metall. 5, 1743 (1974). C. Herring. Structure and Properties of Solid Surjixes (edited by R. Gomer and C. S. Smith) Univ. Chicago Press, Chicago (1952). Y. C. Fung, Foundations of Solid Mechanics, p. 195. Prentice-Hall, Engiewood Cliffs (1965). V. V. Gall, P. L. Gruzin and G. K. Yudina, Fir. Metal. ~etalloued 30, 950 (1970).
APPENDIX
Characteristic Rel~ation limes for Matter Transport
In order to determine the conditions for which self-diffu- sion along the surface of the void and along the grain boundary ahead of the void are the only significant mech- anisms of matter transport, it is useful to compare the charac!eristic relaxation time for each mode of transport which results from a periodic disturbance. Mullins [IO, 141 derived characteristic times for the flattening of a periodic, two-dimensional free surface; the extension to three dimen- sions (Section Al), as well as an examination of the charac- teristic relaxation time for grain boundary self-diffusion (Section AZ) are presented here. In addition, the rigid grain assumption is examined in Section A3.
Al. Mass transport at a surface
Indeed, there are several mechanisms which may con- tribute to the process of mass transport at a surface: namely, surface set-diffusion, lattice elf-diffusion, and eva- poration-condensation. To calculate characteristic relaxa- tion times for these processes, consider a semi-infinite, iso- tropic solid occupying the half-space z Z w, where w is a surface given by
w(x, Y. tf = AWwC24xll + y/f41 (Al)
with I and L being the wavelengths of the periodic disturb- ance in the x and y directions respectively, and A(t) taken to be much smaller than both I and L.
CHUANG rt ul.: DIFFUSIVE CAVITATION OF GRAIN INTERFACES 283
where (J,), and (J,), are surface fluxes. J, is the lattice flux in the : direction and A0 = 0 - O0 where 0, is the rate of evaporation from a flat surface. In linear diffusion theory the fluxes in equation (A?) are given by
(./,I,,, = -(D,ii,.!Q~T)?{c/?Y. ij..
JT = -(D,,‘Rk7Ji~l~?~ (A3)
where D, is the coefficient of lattice diffusion. For a free surface, the chemical potential is given by
equation (2). Since the slope of the surface is small every- where,
(P),.Tf&< = p0 - Q~J2W(.X. )‘, t) (A4)
where cz = (2x/l)* + (2n/L)‘. Following Mullins [14] and Herring [27] if we assume that the flow within the crystal is essentially divergenceless (short relaxation time for attainment of local vacancy equilibrium). then p must satisfy Laplace’s equation and
p = pco - Ry,c’ exp( - CI)W(.X, y, t). (A5)
To complete the analysis of equation (AZ), we again fol- low Mullins [14] and consider the matter transport which results from the process of evaporation-condensation. From kinetic theory [25]. the flux from the surface can be approximated by
A0 = Apl(2ntnkT)“’ 646)
where Ap = p - pO, p being the vapor pressure at the sur- face, p,, the pressure at a reference state, and m is the mass of a molecule. Presuming the surface to be in equilib- rium with its own vapor at this pressure p. that the vapor is a perfect gas, and that p is close to p,,
Equating the chemical potential of the solid phase (A4) to that of the vapor phase (A7) at the surface, with both referred to the same reference state, implies that
AP/P~ = - (fP;,c’jkT)w(x, y, t).
Therefore, equation (A6) becomes
A0 = - [poR~,c2~(2nm)“*(kT)” 2]w.x, y, r). 648)
Substitution of equations (A3). (A5) and (A8) into equation (A2) leads to a differential equation for the amplitude of the disturbance as
A’(r) + (FTC4 + F,? + F,.c’)A(t) = 0 (.49)
where
F, = D,ci,R*,~,~:k T
F, = D,Ry,/kT
and
F,. = ponZ;‘,/[(2nm)‘:2(kT)31*].
Solution of equation (A9) gives the shape of the free surface as
w(x. y. r) = 4, exp [ -(F,? + F,?
+ F,c’)t] exp [2rri(u// + j/L)] ; (A 10)
indeed, each of the terms in the first exponential of equa- tion (AlO) gives the contributions to the flattening of the periodic surface by surface self-diffusion, lattice self-diffu- sion and evaporation-condensation, respectively. From equation (AlO) it is seen that the characteristic relaxation
time for each mode of transport is given by
Ts = (k T/D,Wy,) ( l/c?
for surface self-diffusion,
(All)
71 = (kT/D,Ry,)(llc3)
for lattice self-diffusion, and
(A12)
~~ = [(2nm)“z(k~3’2/po~*y~](1/c2) (A13)
for evaporation-condensation. An estimate of the contribution to the total atom flux
on a free surface for each of these mechanisms can be made by examining the ratios of the characteristic relaxa- tion times. Equations (Al 1) and (A12) imply that
%/T, = (Q/D,&)(l/c). (A14)
Assuming the wavelengths of the disturbance to be the same in the x and J’ directions (i.e. I = L = I.), equation (A14) reduces to
T,/T, = (D,/D,&)(Q2\/2z). (A15)
Similarly, equations (Al I) and (A13) imply that
T,/T, = [poR/[D,6,(2nmkT)“2] ) (l/c*) (‘416)
or for I = L = i.
T,/T, = (p,R/[2D,6,(2nmkT)“2]) (i/2n)‘. 6417)
If r,/r, K 1 and TJT" cc 1 for a given 1. surface diffusion can be expected to be the dominant mechanism of matter transport for free surface disturbances of wavelength less than 1. For some common metals, Table 2 lists values of I,,, for these ratios of relaxation times equal to 0.1. These maximum wavelengths are all within reasonable bounds for the consideration of intergranular voids. Hence it can be concluded that surface self-diffusion is the only mechanism which need be considered for the temperatures of interest in this study.
A2. Matter transport in the grain boundary
A similar analysis will be pursued in order to study the dominant mode of mass transport at the grain boundary. Consider a local grain boundary thickening 6 and its as- sociated normal stress distribution cr, on the grain interface produced by placing matter selectively along the grain boundary. Generalizing Weertman’s [26] two-dimensional analysis, the grain interface can be modelled as the surface of a semi-infinite, isotropic, linear elastic solid occupying the half-space ; > 0. If the stresses at the surface are of the form
and
cn = CT,, = B(t)exp[Zni(x/l + y/L)] (Al8)
oyr = o,, = 0,
the linear elastic solution (Fung [28]) gives a grain bound- ary thickening
6 = - 2(l - v)o,/Gc (A19)
where cz = (27r/l)* + (2x/L)‘, and [(l - v)/G]B(t) is assumed much smaller than 1; G is the elastic shear modulus and Y the Poisson ratio.
Mass transport at the grain boundary can result from either grain boundary or lattice diffusion; hence conserva- tion of mass at the grain boundary requires that
a(J,),/ax + &JJ,),/Zy + 2(5,) = (l/Q)(%/~t) (A20)
where (JJx and (J& are the grain boundary fluxes in the x and y directions respectively, J, is the lattice flux in the : direction and &3/i% is the grain boundary thickening
284 CHUANG et a/.: DIFFUSIVE CAVITATlON OF GRAIN INTERFACES
rate. As before, the fluxes can be related to the chemical potential through the following relations
(Jr& )’ = - (D,G*/Qk ?)?p/ix, ?y.
J; = -(D,/QkT)?p/?-_. 6421) By an argument similar to that in Section Al, the chemical potential throughout the entire crystal is found to be
p = fiO - Da, exp( -cz). (A22)
Substitution of equations (A21), (A22), (A18) and (A19) into equation (A20), leads to a first order linear ordinary differ- ential equation for B(t). Solution of this equation reveals the characteristic relaxation time for grain boundary diffu- sion to be
rb = [2(1 - v)/G](kT/D,G,R)(I/c3) (~23)
and the characteristic relaxation time for lattice self-diffu- sion to be
r, = [(I - v)/G](kT/D,R)(l/c2). (~24)
Comparing these relaxation times shows that
rb/r~ = 2(WVs)(W) (~25)
or for 1 = L = 1
Q.I~, = UW’&W./W. 6’6)
If T,+/T, -K 1 for a given I, grain boundary diffusion will be the dominant mechanism of matter transport near grain boundary disturbances of wavelength less than 1. Table
2 gives 1,,, for some common metals with T&, = 0.1; it is seen that for these metals grain boundary diffusion is expected to be the dominant mechanism of matter trans- port.
A3. Elastic effect
Appropriateness of the rigid grain assumption will be examined by comparing the (elastic) relaxation time of the grain boundary with a time which is computed on the basis of the rigid grain assumption. From the analysis in Section 5 which is based on a rigid grain model, equation (61) says that
where u is the void growth rate for the two-dimensional equilibrium configuration, and e,,, is the net section stress. A representative time 7, based on this model can be defined as
From equation (A23) for the (elastic) grain boundary relax- ation time
r& = I@ - 4/alb.,,/G). WW Since the net section stress is much smaller than the shear modulus, Q K r,; thus effects resulting from elastic defor- mation become negligibly small after a time which is short in comparison with that for which the process of void growth is active.