Overview – Nutrient Fate and Transport. Mark B. David University of Illinois at Urbana-Champaign Presented at Building Science Assessments for State-Level Nutrient Reduction Strategies Nov. 13, 2012. What I will cover. what the problem is - PowerPoint PPT Presentation
47
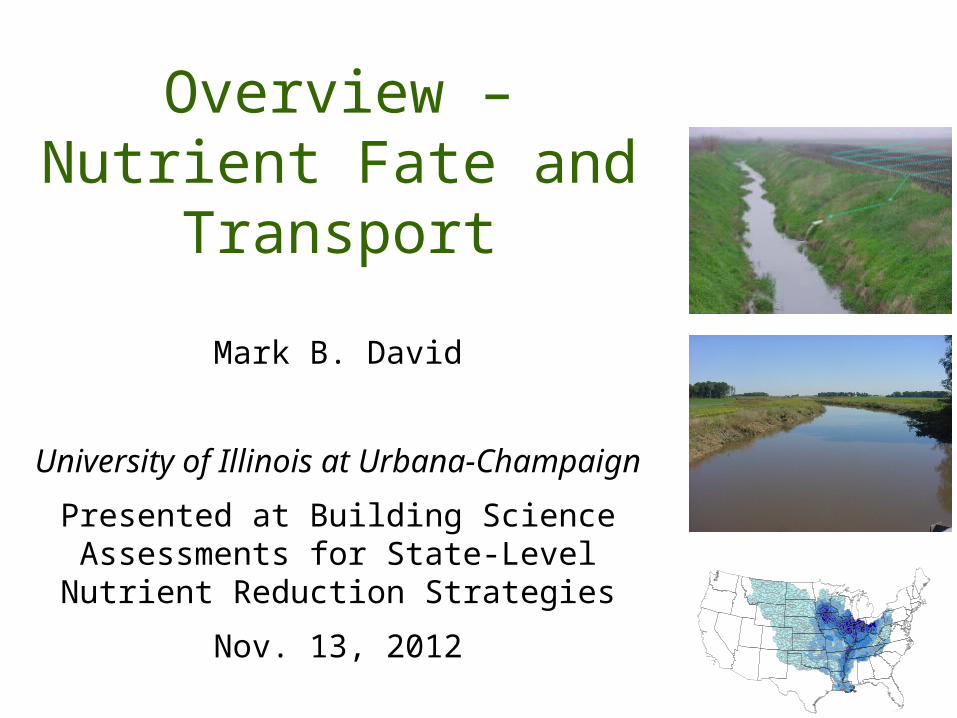
Overview – Nutrient Fate and Transport Mark B. David University of Illinois at Urbana-Champaign Presented at Building Science Assessments for State-Level Nutrient Reduction Strategies Nov. 13, 2012
Transcript
Overview – Nutrient Fate and Transport
Mark B. David
University of Illinois at Urbana-Champaign
Presented at Building Science Assessments for State-Level Nutrient
Reduction StrategiesNov. 13, 2012
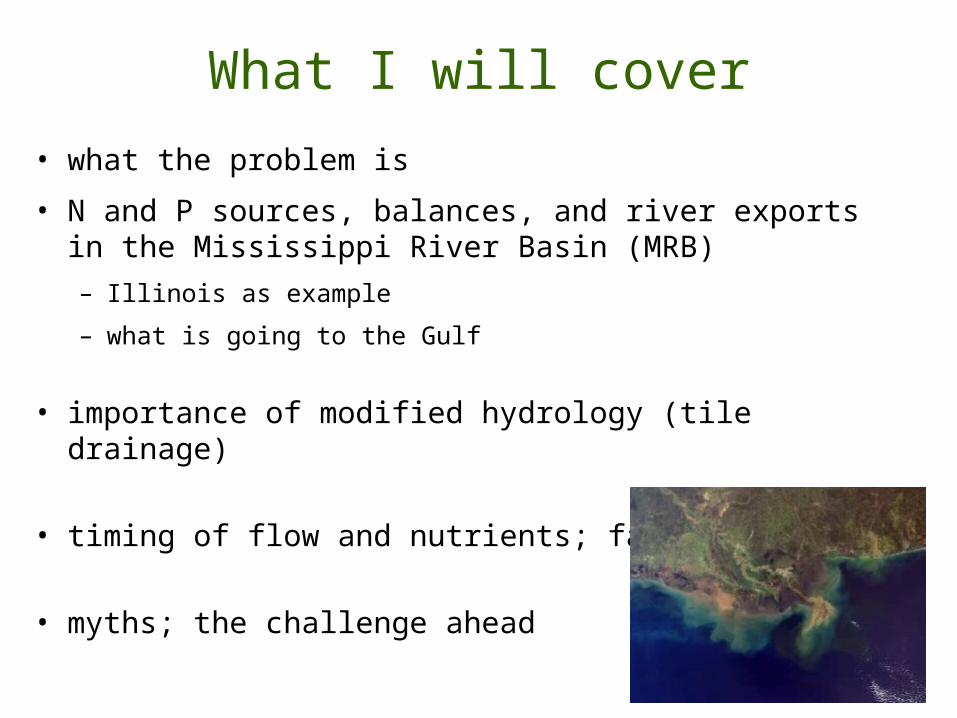
What I will cover• what the problem is• N and P sources, balances, and river exports in
the Mississippi River Basin (MRB)– Illinois as example– what is going to the Gulf
• importance of modified hydrology (tile drainage)
• timing of flow and nutrients; fate
• myths; the challenge ahead
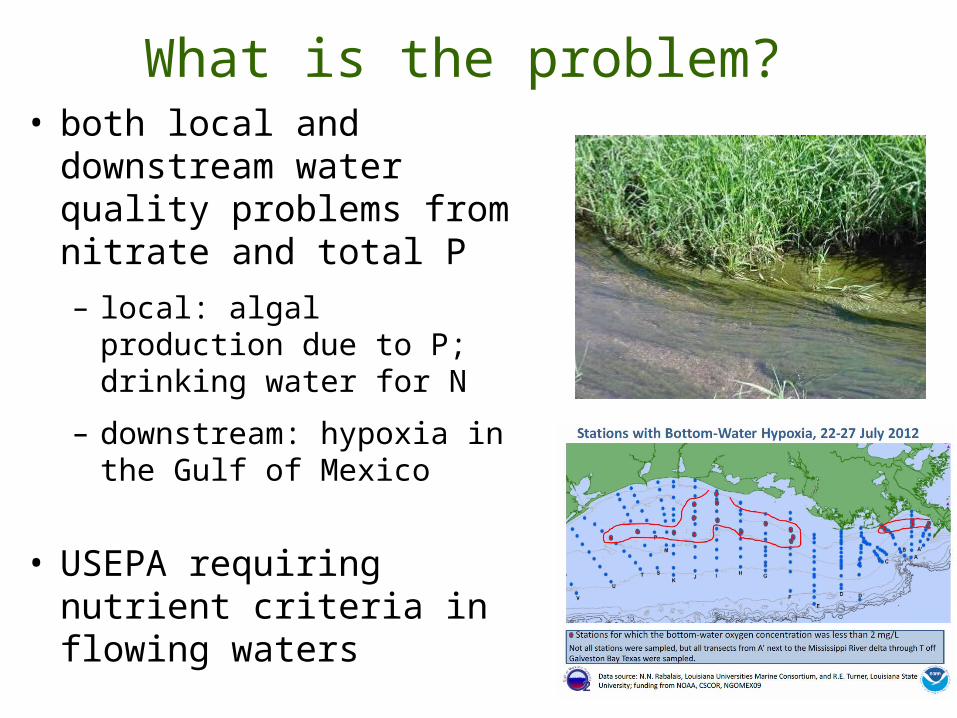
What is the problem?• both local and
downstream water quality problems from nitrate and total P– local: algal production
due to P; drinking water for N
– downstream: hypoxia in the Gulf of Mexico
• USEPA requiring nutrient criteria in flowing waters
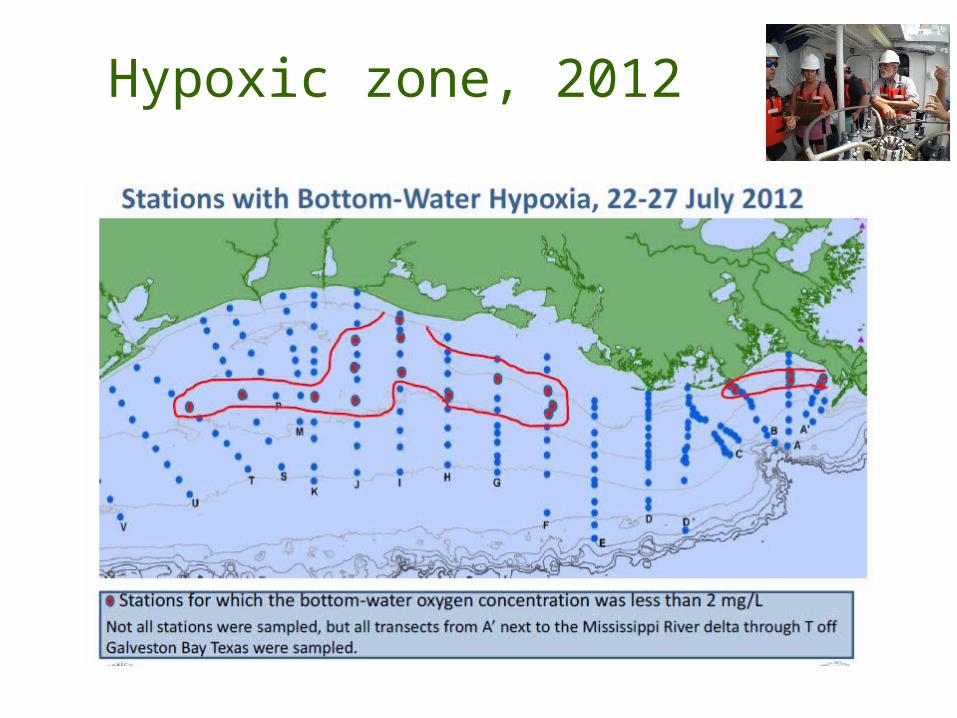
Hypoxic zone, 2012
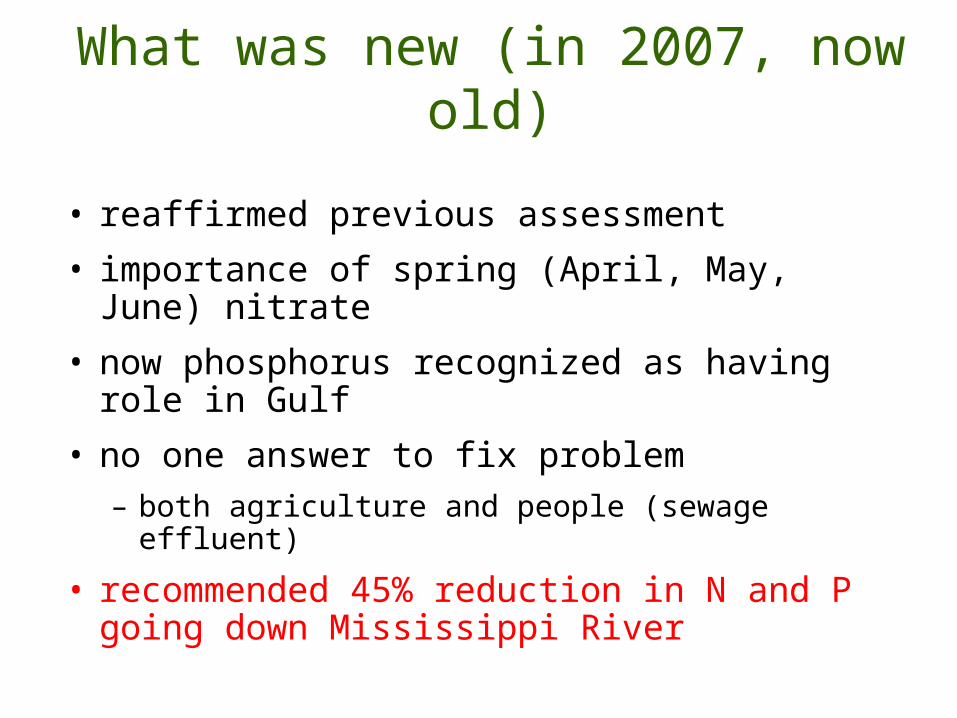
What was new (in 2007, now old)
• reaffirmed previous assessment• importance of spring (April, May, June)
nitrate• now phosphorus recognized as having
role in Gulf• no one answer to fix problem
– both agriculture and people (sewage effluent)• recommended 45% reduction in N and P
going down Mississippi River
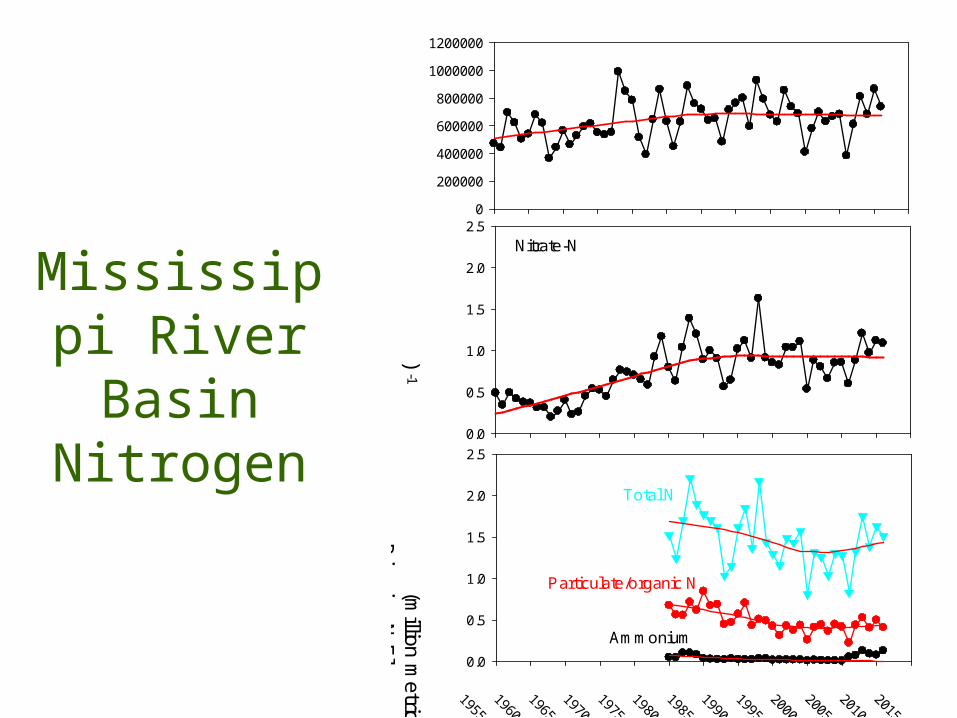
Mississippi River Basin
Nitrogen
Water Flux (m
illion m3)
0
200000
400000
600000
800000
1000000
1200000
Riverine N
Flux(m
illion metric tons N
yr-1
)
0.0
0.5
1.0
1.5
2.0
2.5
19551960
19651970
19751980
19851990
19952000
20052010
2015
0.0
0.5
1.0
1.5
2.0
2.5
Nitrate-N
Ammonium
Total N
Particulate/organic N
Mississippi River Basin Phosphorus
Water Flux (m
illion m3)
0
200000
400000
600000
800000
1000000
1200000
19551960
19651970
19751980
19851990
19952000
20052010
2015
Riverine P
Flux (m
illion metric tons yr
-1)
0.00
0.05
0.10
0.15
0.20
0.25Total P
Soluble reactive P
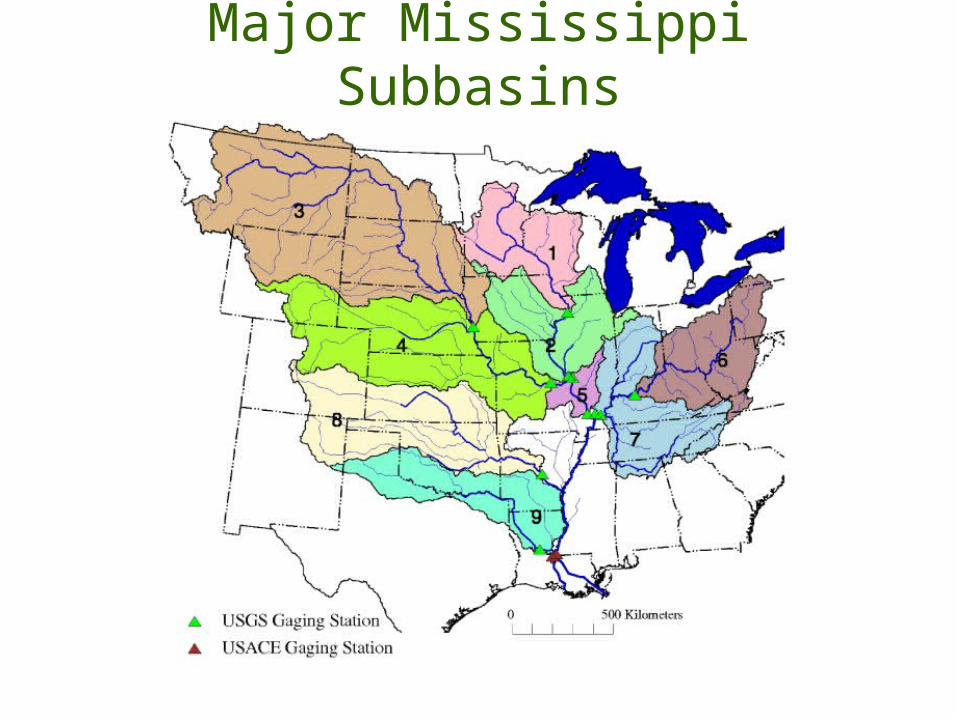
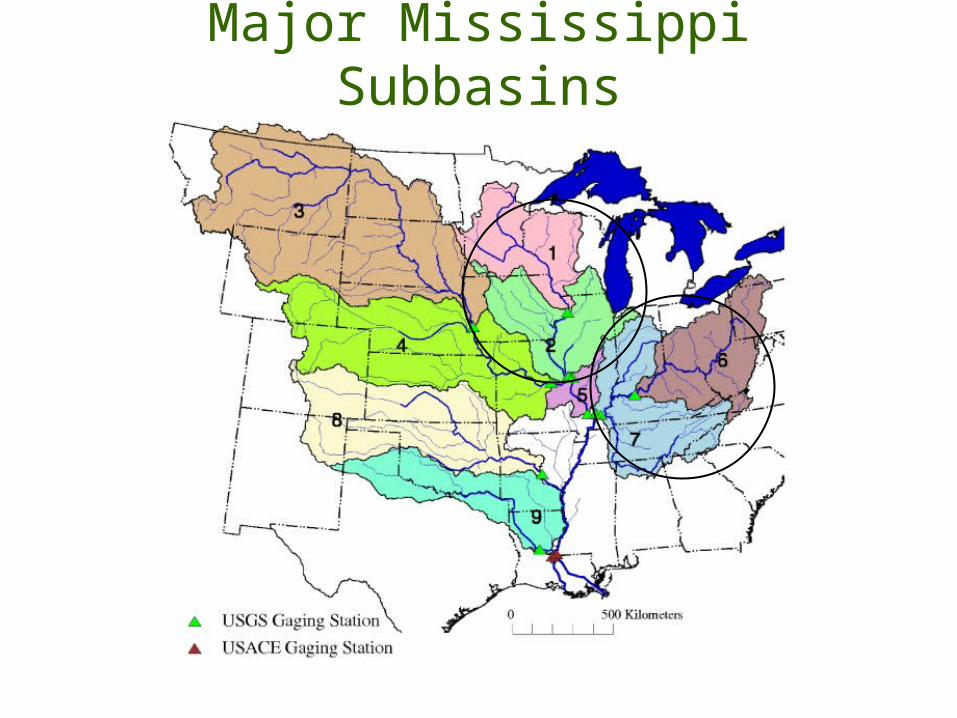
Major Mississippi Subbasins
Major Mississippi Subbasins
Nutrient loads for 2001 to
2010
0
10
20
30
40
50
Subbasin
Miss-Clinton
Miss-Grafton
Missouri-Omaha
Missouri-Hermann
Miss-Thebes
Ohio-Cannelton
Ohio-Grand Chain
Arkansas-Little Rock
Red River-Alexandra
Lower Miss
Nutrient load (1,000 m
etric tons N or P
yr-1
)0
50
100
150
200
250
300
350
2001-20052006-2010
Total P
Nitrate-N
Nutrient yields for 2001 to
2010
0.0
0.5
1.0
1.5
2.0
2.5
3.0
Subbasin
Miss-Clinton
Miss-Grafton
Missouri-Omaha
Missouri-Hermann
Miss-Thebes
Ohio-Cannelton
Ohio-Grand Chain
Arkansas-Little Rock
Red River-Alexandra
Lower Miss
Nutrient yield (kg N
or P ha
-1 yr
-1)
0
2
4
6
8
10
12
14
16
2001-20052006-2010
Total P
Nitrate-N
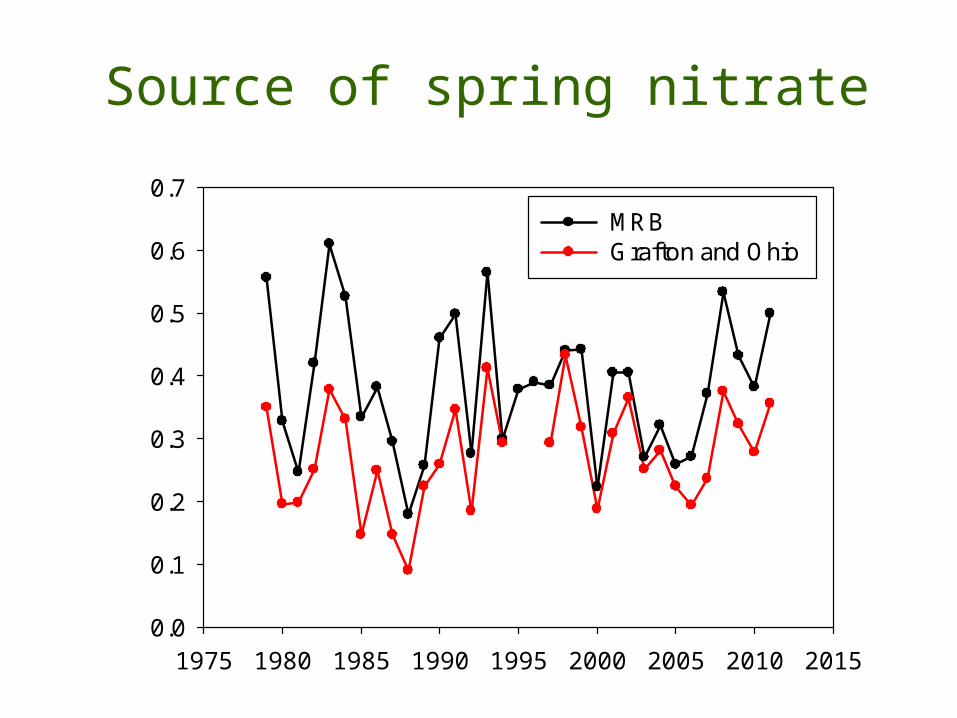
Spring nitrate, upper Miss and Ohio
Water Flux (cm
)
0
5
10
15
20
25
30
1975 1980 1985 1990 1995 2000 2005 2010 20150
5
10
15
20
25
30
Mississippi River at Grafton
Ohio River at Grand Chain, IL
Riverine N
itrate-N Flux
(million m
etric tons N)
0.00
0.05
0.10
0.15
0.20
0.25
0.30
1975 1980 1985 1990 1995 2000 2005 2010 20150.00
0.05
0.10
0.15
0.20
0.25
0.30
Mississippi River at Grafton
Ohio River at Grand Chain, IL
1975 1980 1985 1990 1995 2000 2005 2010 2015
Spring N
itrate (tons N yr
-1)
0.0
0.1
0.2
0.3
0.4
0.5
0.6
0.7MRB Grafton and Ohio
Source of spring nitrate
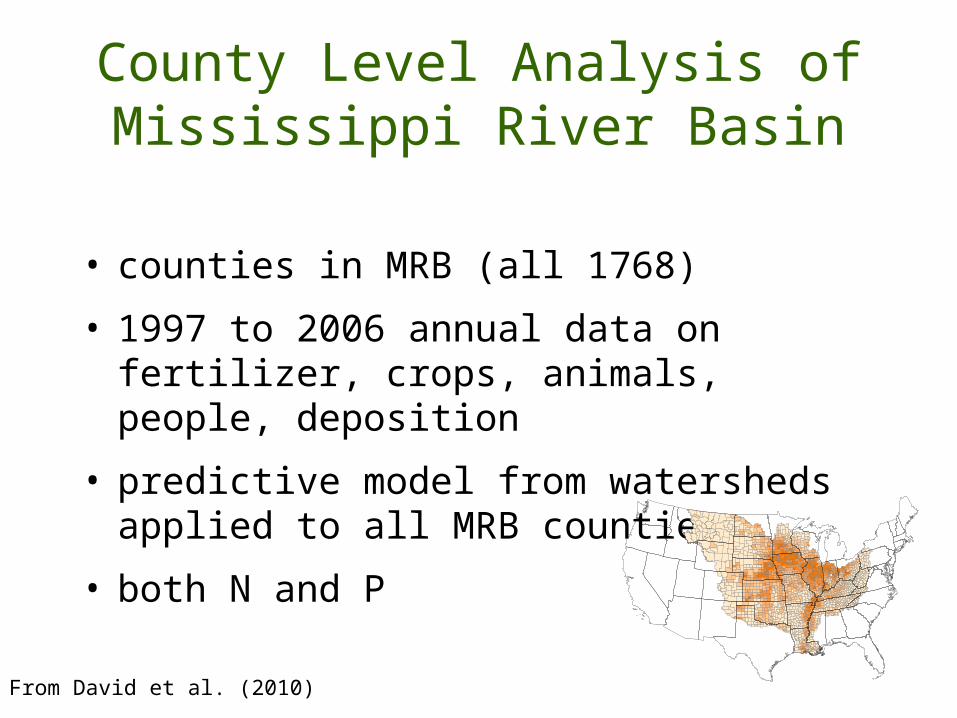
County Level Analysis of Mississippi River Basin
• counties in MRB (all 1768)• 1997 to 2006 annual data on fertilizer,
crops, animals, people, deposition• predictive model from watersheds
applied to all MRB counties• both N and P
From David et al. (2010)
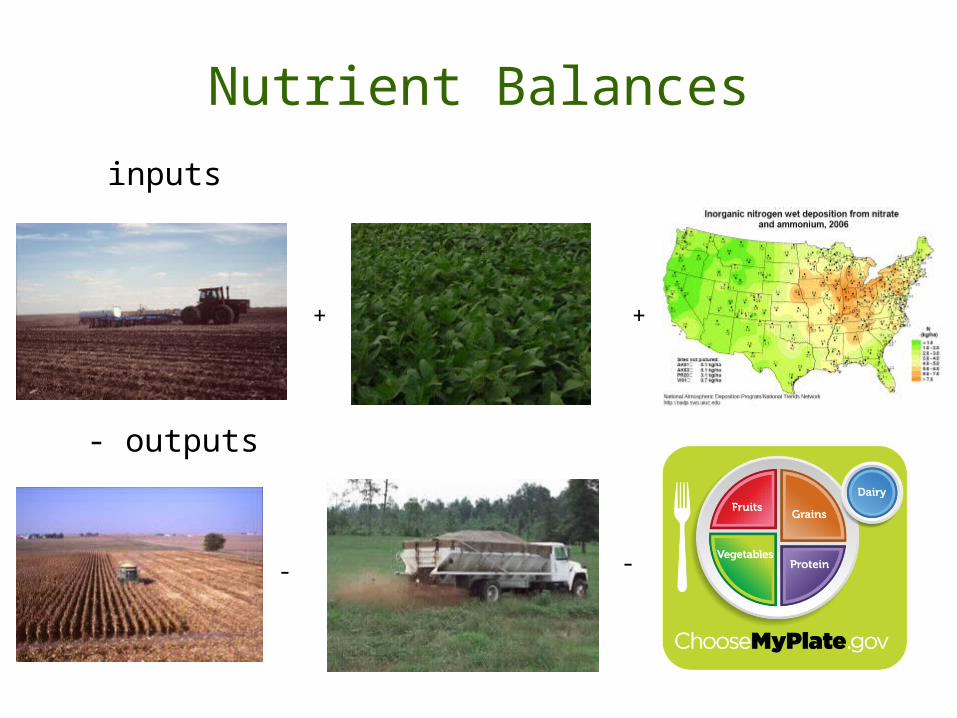
Nutrient Balancesinputs
-
+
-
+
- outputs
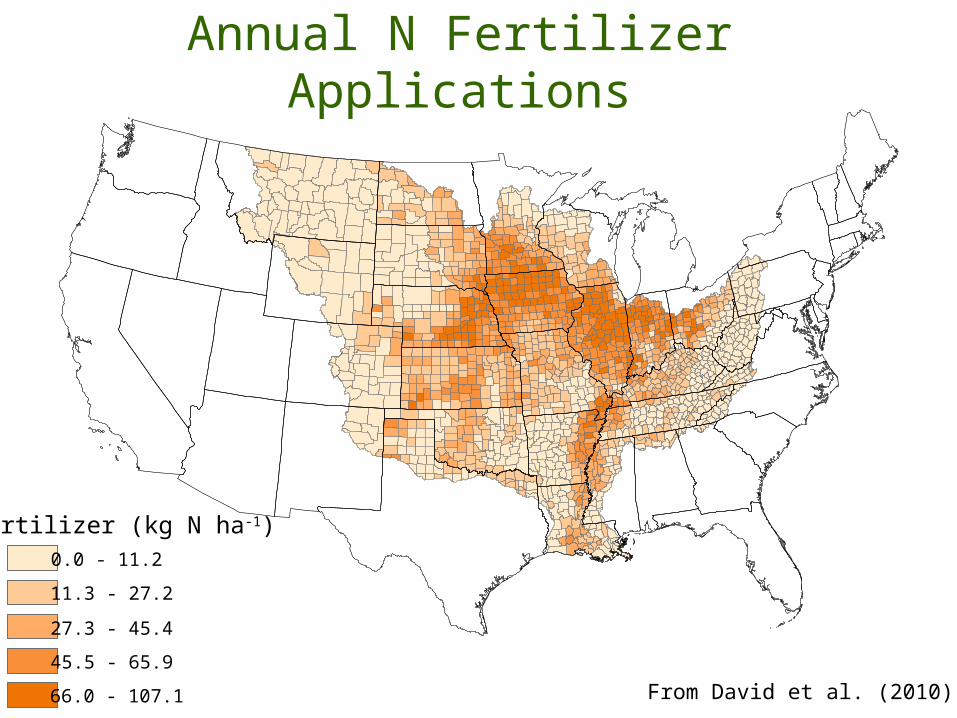
Annual N Fertilizer Applications
Fertilizer (kg N ha-1)0.0 - 11.2
11.3 - 27.2
27.3 - 45.4
45.5 - 65.9
66.0 - 107.1 From David et al. (2010)
Drain0.0 - 5.1
5.2 - 16.3
16.4 - 31.7
31.8 - 51.4
51.5 - 81.8
Tile drainage is concentrated in the corn belt
Fraction of county
From David et al. (2010)
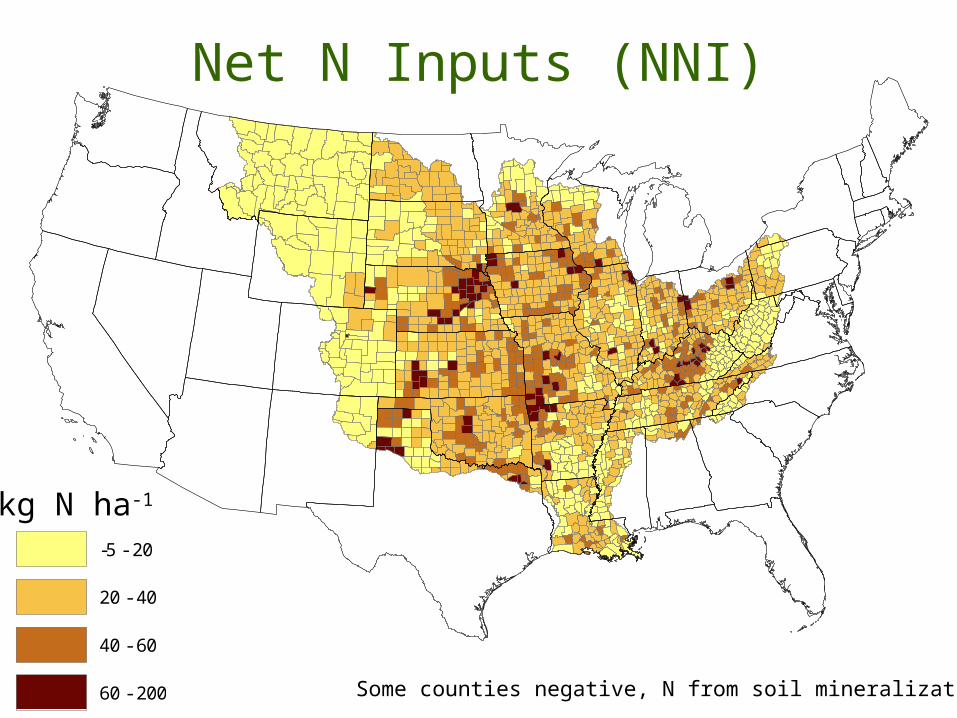
nni
-5 - 20
20 - 40
40 - 60
60 - 200
Net N Inputs (NNI)
kg N ha-1
Some counties negative, N from soil mineralization
• can look at watershed N export as a fraction of net N inputs– most studies, about 25%– however in MRB we know it is larger in critical
areas– can be > 100% in heavily tile drained
watersheds
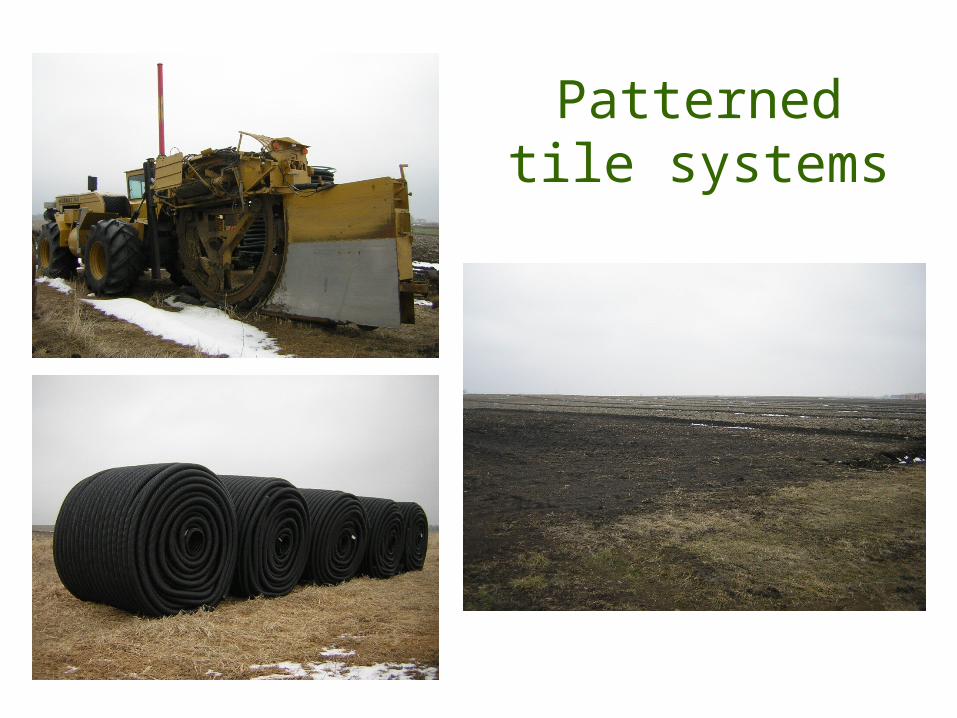
Drainage by tiles and ditches
Patterned tile systems
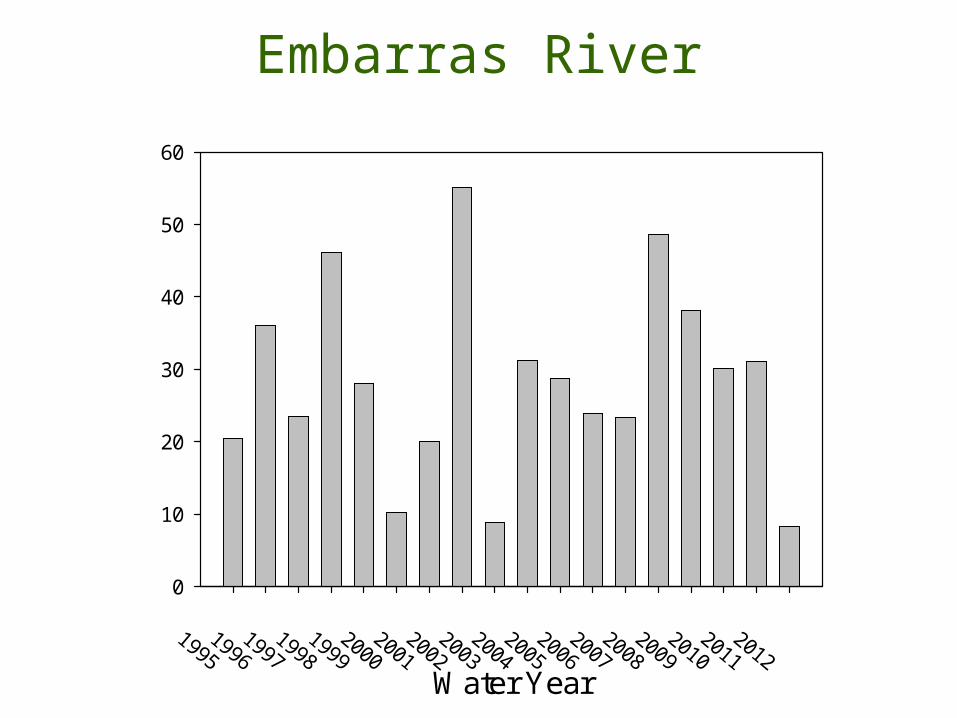
Embarras River - Camargo
Embarras River
19931994
19951996
19971998
19992000
20012002
20032004
20052006
20072008
20092010
20112012
NIT
RA
TE
(mg N
L-1
)
0
5
10
15
20
Embarras River
Water Year
19951996
19971998
19992000
20012002
20032004
20052006
20072008
20092010
20112012
Nitrate E
xport (kg N ha
-1 yr
-1)
0
10
20
30
40
50
60
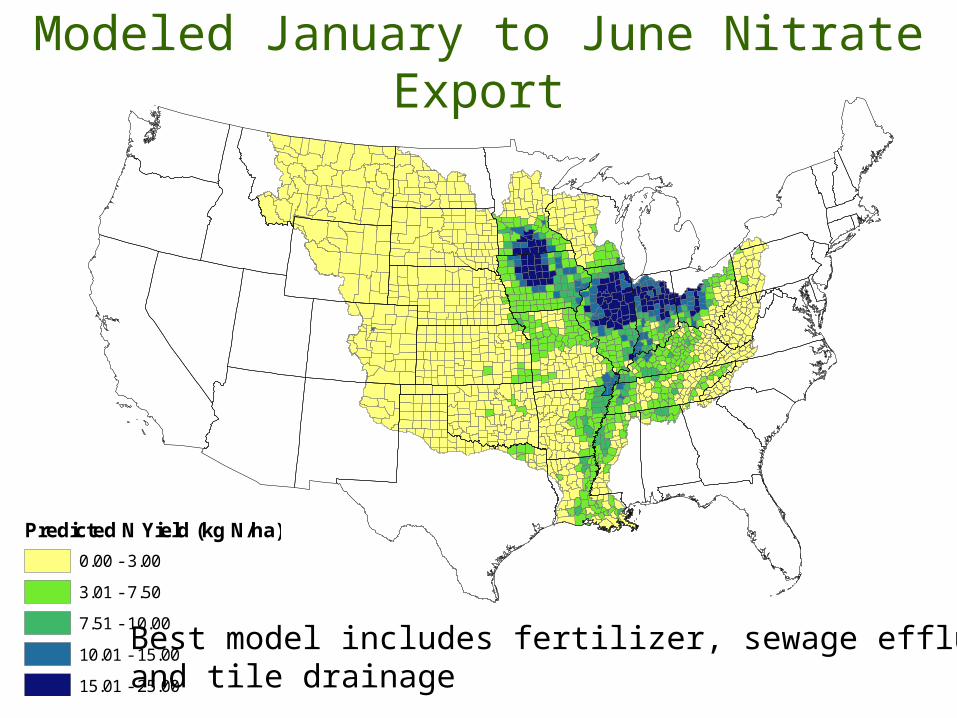
Predicted N Yield (kg N/ha)0.00 - 3.00
3.01 - 7.50
7.51 - 10.00
10.01 - 15.00
15.01 - 25.00
Modeled January to June Nitrate Export
Best model includes fertilizer, sewage effluent,and tile drainage
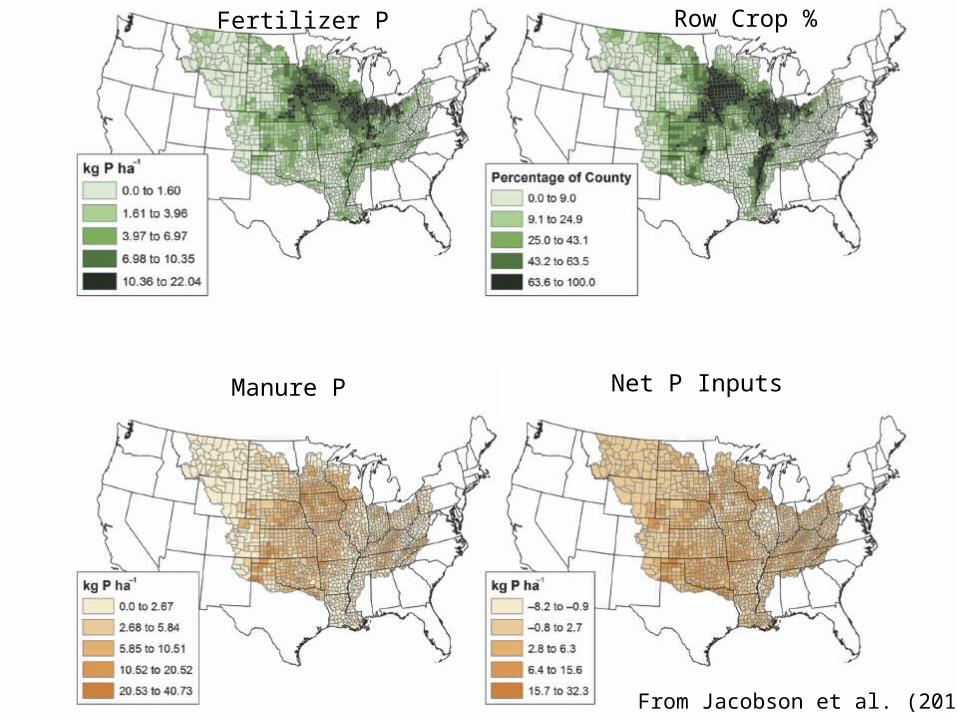
Components of P Mass Balances• net P inputs
= inputs – outputsinputs (fertilizer)outputs (grain harvest - human and animal consumption)
• net indicates additions or removals from soil• little P (relative to N) is lost to streams, but it
is biologically important• surface runoff and tile leaching• manure
From Jacobson et al. (2011)
Fertilizer P Row Crop %
Manure P Net P Inputs
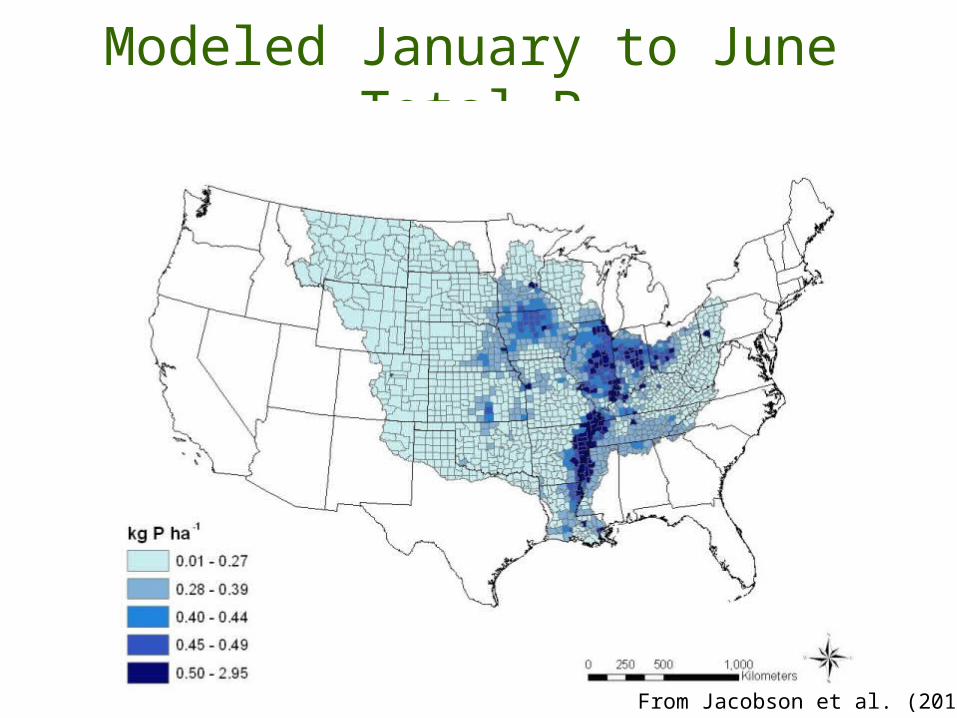
Modeled January to June Total P
From Jacobson et al. (2011)
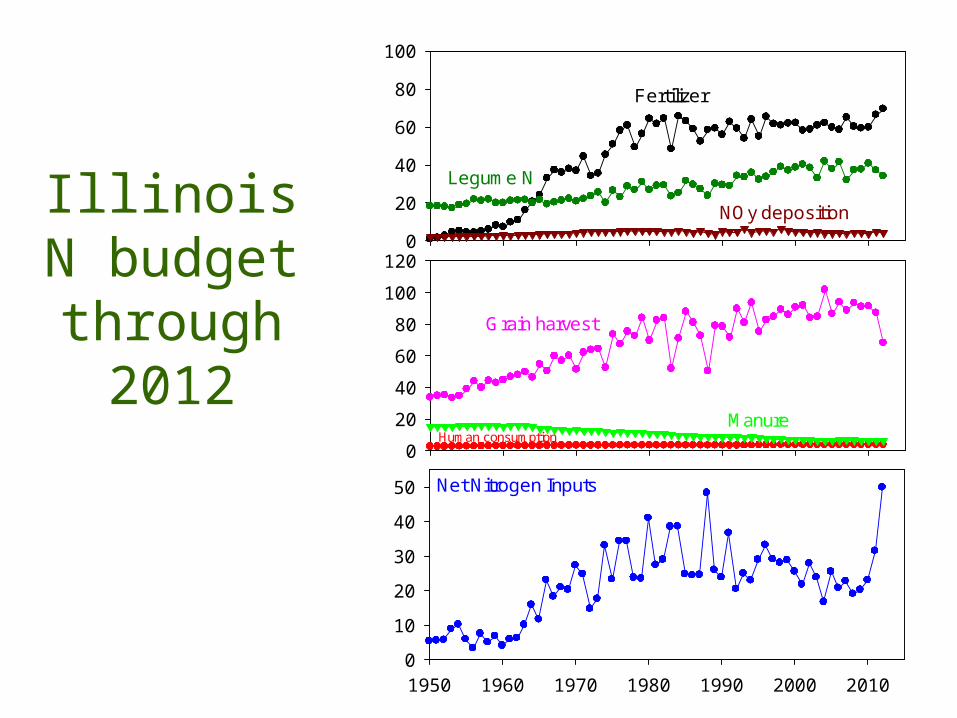
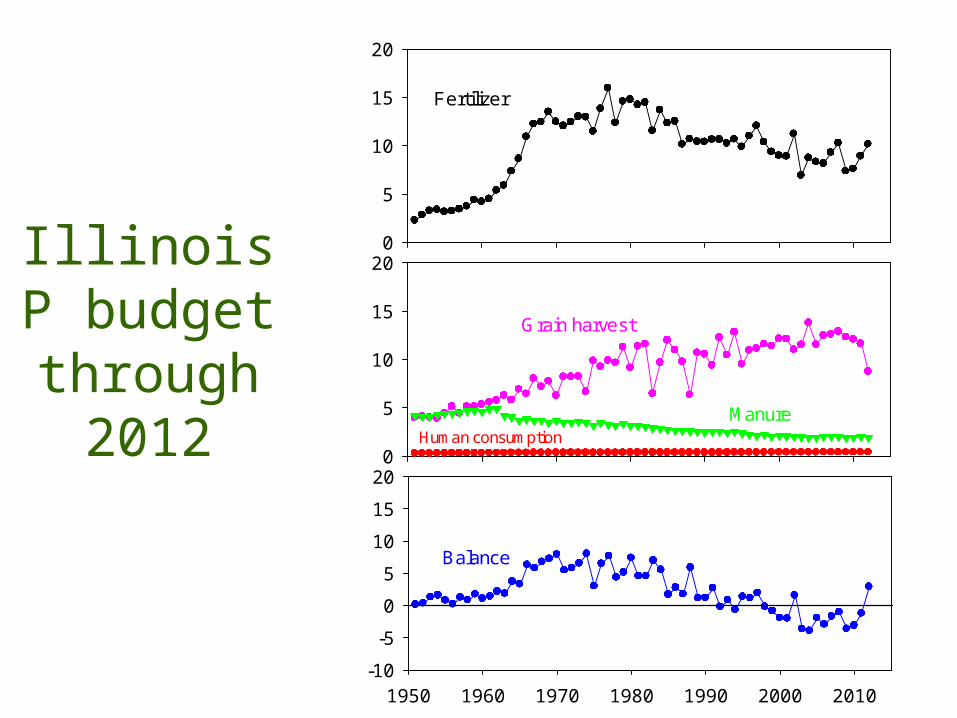
Illinois P budgetthrough
2012
0
5
10
15
20
Phosphorus (kg P
ha-1
)
0
5
10
15
20
Fertilizer
1950 1960 1970 1980 1990 2000 2010-10
-5
0
5
10
15
20
Balance
ManureHuman consumption
Grain harvest
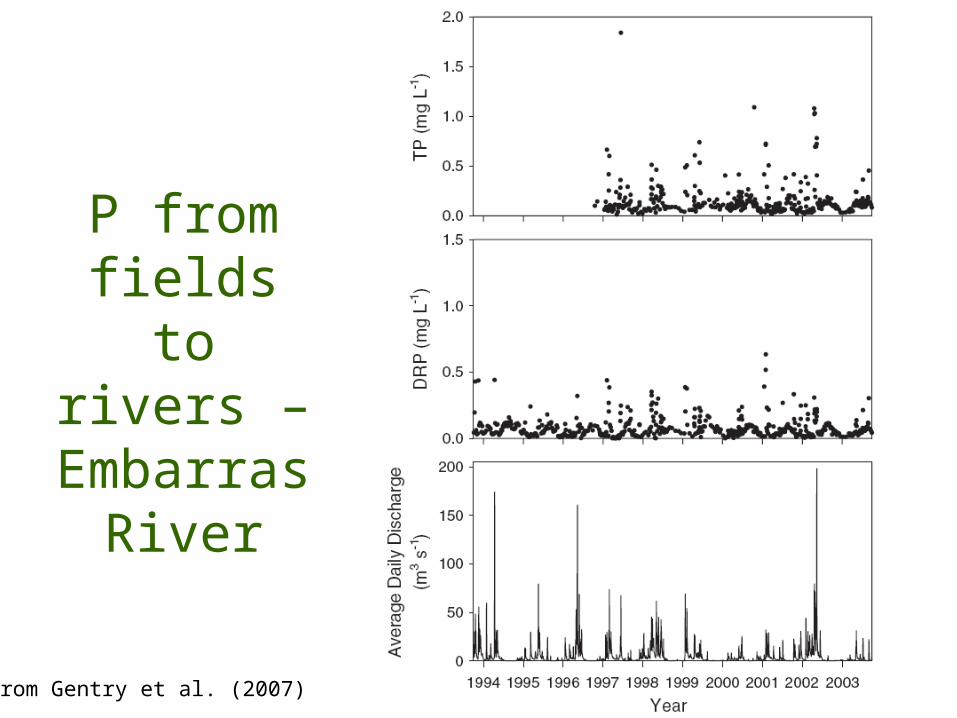
P from fields to rivers –
Embarras River
From Gentry et al. (2007)
Particulate P from
fields to rivers
From Gentry et al. (2007)
Importance of a Few Storm Events
From Royer et al. (2006)
Fate of N• limited in-stream
losses of nitrate during high flow periods– Lake
Shelbyville– Saylorville
Reservoir• retention times
too short• spring nitrate,
headed to Gulf
Depth/Time of Travel (m yr-1)0.1 1 10 100 1000 10000
N R
emoved (%
)
0
20
40
60
80
100Lake Shelbyville, IllinoisGarnier et al. (1999)Royer et al. (2004)Saylorville Reservoir, Iowa
Crumpton equation
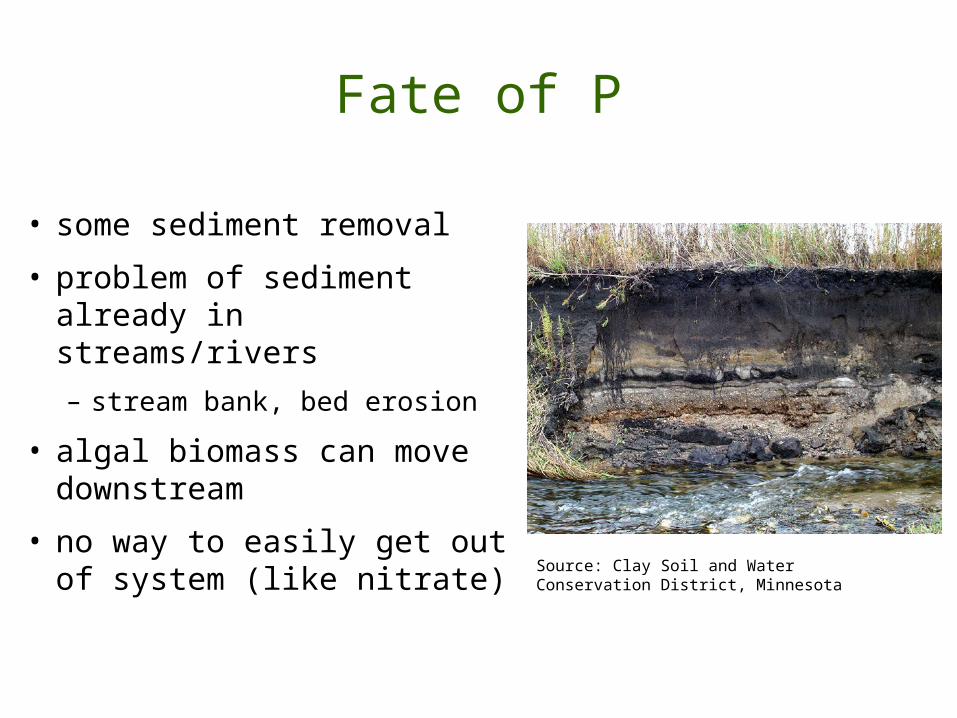
Fate of P
• some sediment removal• problem of sediment
already in streams/rivers – stream bank, bed erosion
• algal biomass can move downstream
• no way to easily get out of system (like nitrate)
Source: Clay Soil and Water Conservation District, Minnesota
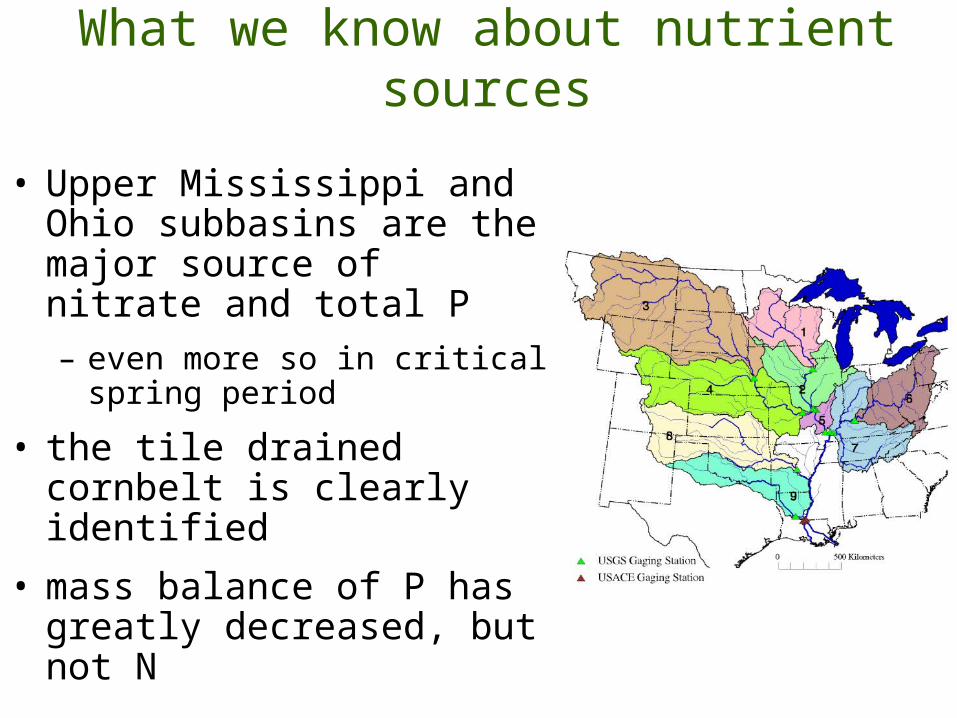
What we know about nutrient sources
• Upper Mississippi and Ohio subbasins are the major source of nitrate and total P– even more so in critical
spring period• the tile drained cornbelt is
clearly identified • mass balance of P has
greatly decreased, but not N
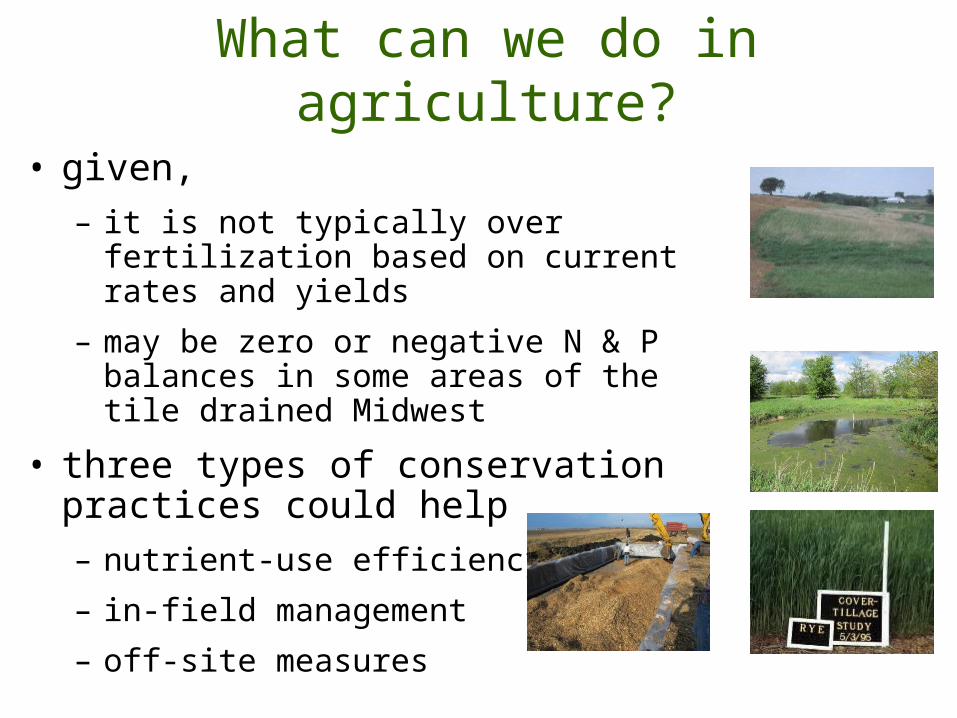
What can we do in agriculture?
• given, – it is not typically over fertilization
based on current rates and yields– may be zero or negative N & P
balances in some areas of the tile drained Midwest
• three types of conservation practices could help– nutrient-use efficiency– in-field management– off-site measures
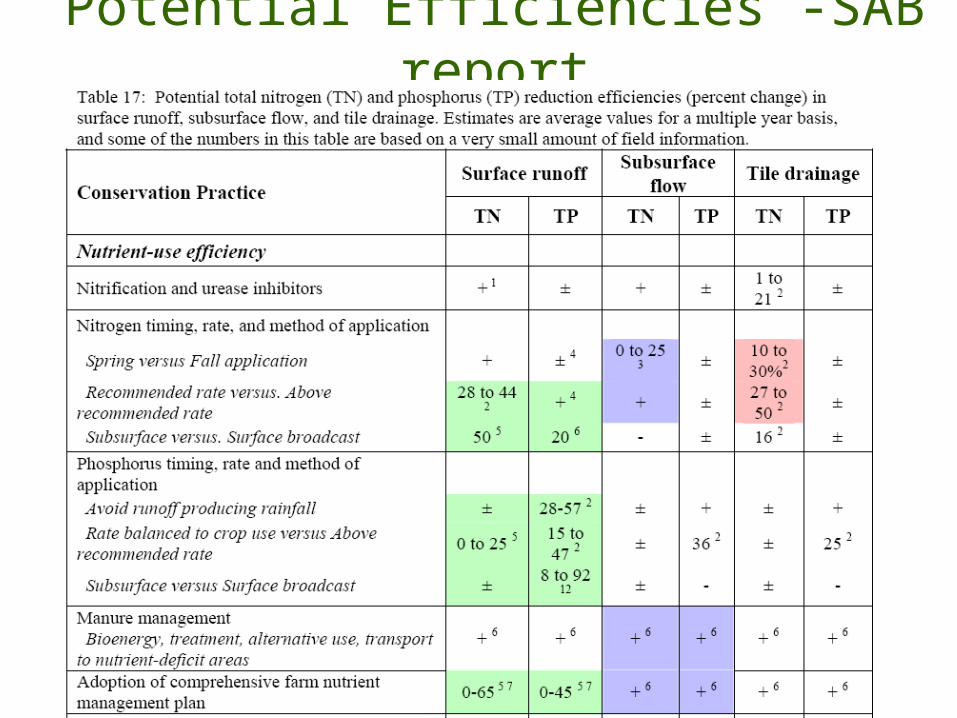
Potential Efficiencies -SAB report
Jan08
Jul08
Jan09
Jul09
Jan10
Jul10
Jan11
Jul11
Jan12
Nitrate-N
Concentration
(mg N
L-1
)
0
5
10
15
20
25
30Corn-Corn-Soy MiscanthusSwitchgrass Prairie
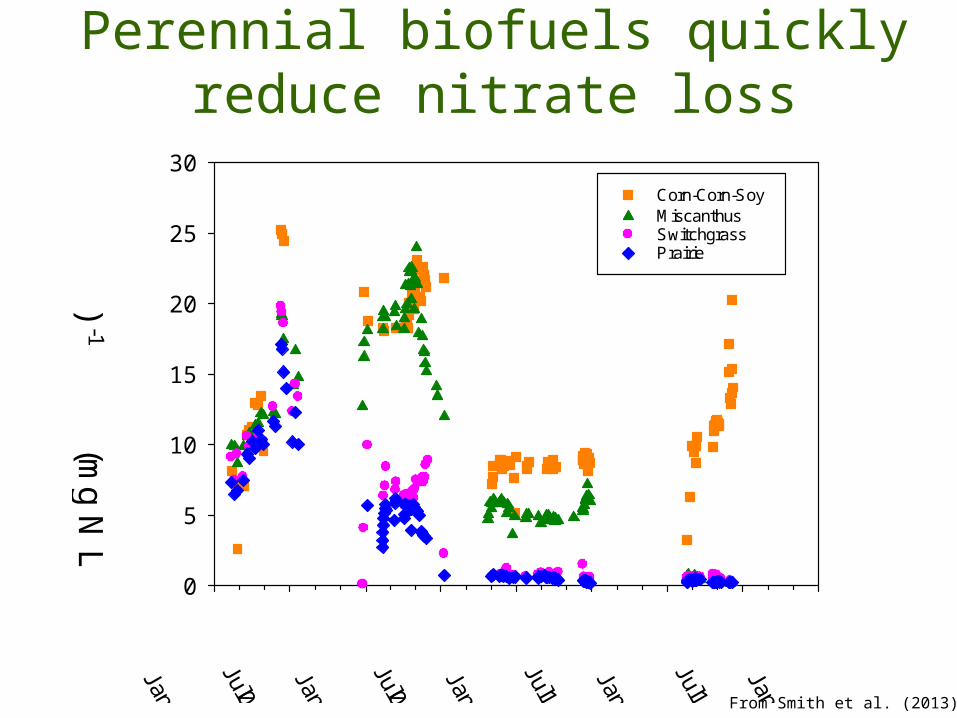
Perennial biofuels quickly reduce nitrate loss
From Smith et al. (2013)
Point sources in MRB?
• sewage effluent and industrial (22% of annual N and 34% of P)
• however, only 14% (N) and 20% (P) of spring load
• not going to solve problem, but could help for P
A few myths• no-till solves all problems• a few (bad) actors are the problem• over application of N (or P) is most of the
problem• just targeting a few fields will solve most of
the problem• edge of field denitrification can solve the
problem• the response will take a long time (decades?)
What’s making it difficult• more corn (and fertilizer)• more intensive tile drainage• warmer winters• more intense winter/spring precipitation• fall N in Illinois, Indiana, Ohio• the intensity of agriculture across the
cornbelt• many (most?) practices to reduce nutrient
loss don’t increase yield
Conclusions• N and P balances don’t relate well to nitrate and P
loss across the MRB (but could increase losses in a drought year)
• counties with high fertilizer inputs have high crop fractions (& corn acres) and tile drainage– all lead to nitrate loss– corn & soybeans on tile drained land much more
important than manure, deposition, or sewage effluent • P from both surface runoff and tiles
– sewage effluent also important• high winter/spring flow and nutrient losses are a
challenge, and seem to be getting worse
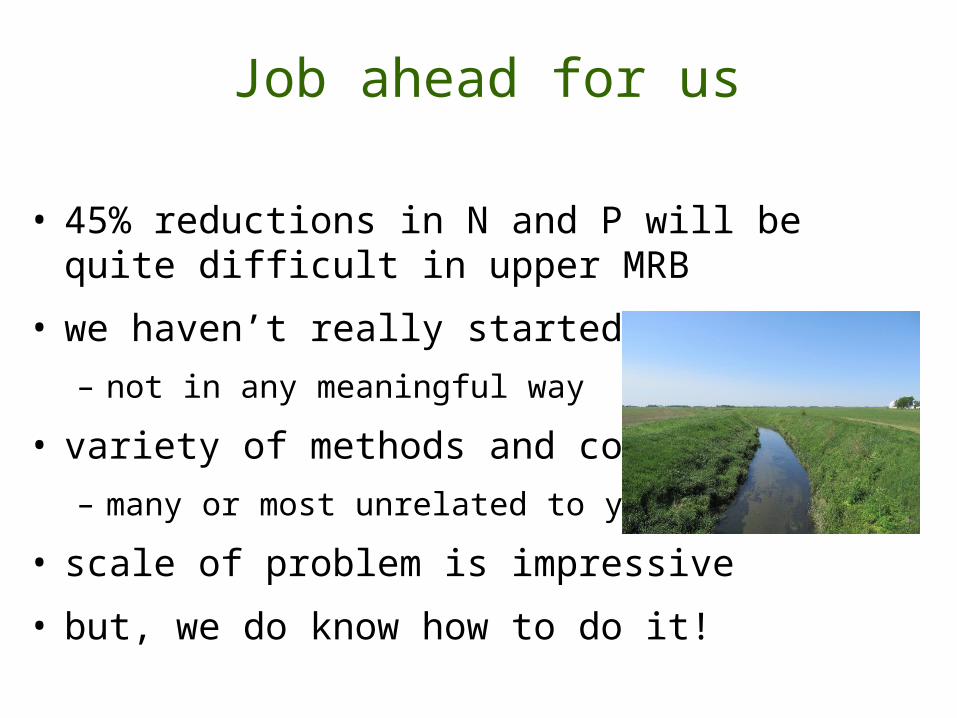
Job ahead for us
• 45% reductions in N and P will be quite difficult in upper MRB
• we haven’t really started– not in any meaningful way
• variety of methods and costs– many or most unrelated to yields
• scale of problem is impressive• but, we do know how to do it!