39
Overview of a School Finance Plan That Makes Sense for Everyone An Equity Center Presentation to the Education Service Center Region 1 Finance Advisory Council February 23, 2018
| Date post: | 19-Jul-2018 |
| Category: |
Documents |
| Upload: | nguyendung |
| View: | 214 times |
| Download: | 0 times |

Overview of a School Finance Plan That Makes Sense for Everyone
An Equity Center Presentation to the
Education Service Center Region 1 Finance Advisory CouncilFebruary 23, 2018

The Plan is a Starting Point that does the following:
• Simplifies calculations so that everyone can easily understand how it works
• Removes waste and other inefficiencies so that we bring every education dollar to bear on every child’s educational opportunities, in accordance with his or her needs, and those opportunities are as good in your district as the state system makes available to any other district
• Treats taxpayers fairly so that the funding level available in your district is as high as the level available to any other district willing to levy the same tax rate
• Removes the root causes of divisiveness among districts
• Makes adequate funding achievable
2/23/2018 Equity Center 2

The Plan is based on these basic elements
• All districts are funded alike• All school funding elements are in Chapter 42• No funding elements in Chapter 41• There are NO Chapter 41 and 42 districts
• One Basic Allotment for everyone – AND it applies to all pennies of tax rate from $0.01 through $1.17
• There is only one tier, with all 117 pennies funded at the same level• No Guaranteed Levels• No Equalized Wealth Levels• No Tier 2, Golden or Copper Pennies
2/23/2018 Equity Center 3

The Plan is based on these basic elements
• No prior year value surprises or inequities• Guaranteed revenue – no tax collections surprises• WADA is calculated by a much simpler formula
• No funding is determined by WADA calculations• WADA is only used for equity measurements
• Collections do not determine funding• It is a stable system based on the needed funding level, not the state of a district’s economy
• No convoluted recapture calculations that no one understands• Everyone treated the same for ASF Per‐Capita and Transportation
2/23/2018 Equity Center 4

Calculating a District’s Basic Allotment
Current Law• Statutory BA = $5,140Assume Compressed Tax Rate of $0.90
Calculation:Lesser of 5,140, or5,140 * .90, which is 4,626(1,018 different Basic Allotments are possible)
New Plan• Higher Basic Allotment
• Savings are rolled into it
Calculation:None – Every district has the same Basic Allotment
2/23/2018 Equity Center 5

District Adjustments are retained, with two adjustments (see following slides)
1. Cost of Education Index – CEI – Applies to all districts2. Small District Adjustment – SDA – Less than 1,600 regular ADA
1. Greater than 300 square miles 2. Less than 300 square miles
3. Mid‐size District Adjustment – MSDA – Less than 5,000 regular ADA
2/23/2018 Equity Center 6

Simplifying the CEI Calculations Basic Allotment Adjusted Basic AllotmentCurrent Law
Assume BA = $5,140; CEI = 1.10
Calculation:$5,140 * (1 + (0.100 * 0.710)) =$5,505 ABA
New PlanTEA changes every district’s CEI to reflect the 71% reduction.Old CEI = 1.10; new CEI = 1.071
Calculation:Basic Allotment* 1.071 = Adjusted Basic Allotment
*BA will be higher than $5,140 because of the savings
2/23/2018 Equity Center 7

Diseconomy of Scale Adjustment Calculations
• Three calculations become two• Small District Adjustment for all small districts for districts with more than 300 square miles
• Small District Adjustment for districts with less than 300 square miles• Mid‐size District Adjustment
2/23/2018 Equity Center 8

Categorical Aid10 Allotments reduced to 6 Allotments
1. Regular Program Allotment2. Special Education Allotment3. Career & Technology
Allotment4. Gifted & Talented Allotment5. Compensatory Education
Allotment
6. Bilingual Education Allotment7. Public Education Grant8. New Instructional Facility
Allotment9. Transportation Allotment10. High School Allotment
2/23/2018 Equity Center
No changes were made to how the allotments are calculated.
9

Target Revenue
Tier 1 Collections
DTRs
Tier 2, Level 1 Guaranteed Level
You have enough complications in your life…why create unnecessary ones when you calculate revenue?
Compressed Tax Rates
Golden Pennies
Copper Pennies
Tier 2, Level 1
Tier 2, Level 2 Equalized Wealth
Level
Tier 1 Equalized Wealth Level
WADA
Tier 2, Level 2
Tier 1
Multiple Basic Allotments
Austin Level
ASATR
Tier 1 Local Fund Assignment
Tier 1 Local Fund Assignment
2/23/2018
Wealth Hold‐Harmless
Tier 2
Tier 2, Level 2 Guaranteed Level
Tier 2 Level 1 Collections
Tier 2 Level 2Collections
Equity Center 10

Determining a District’s Funding Level
2/23/2018 Equity Center 11
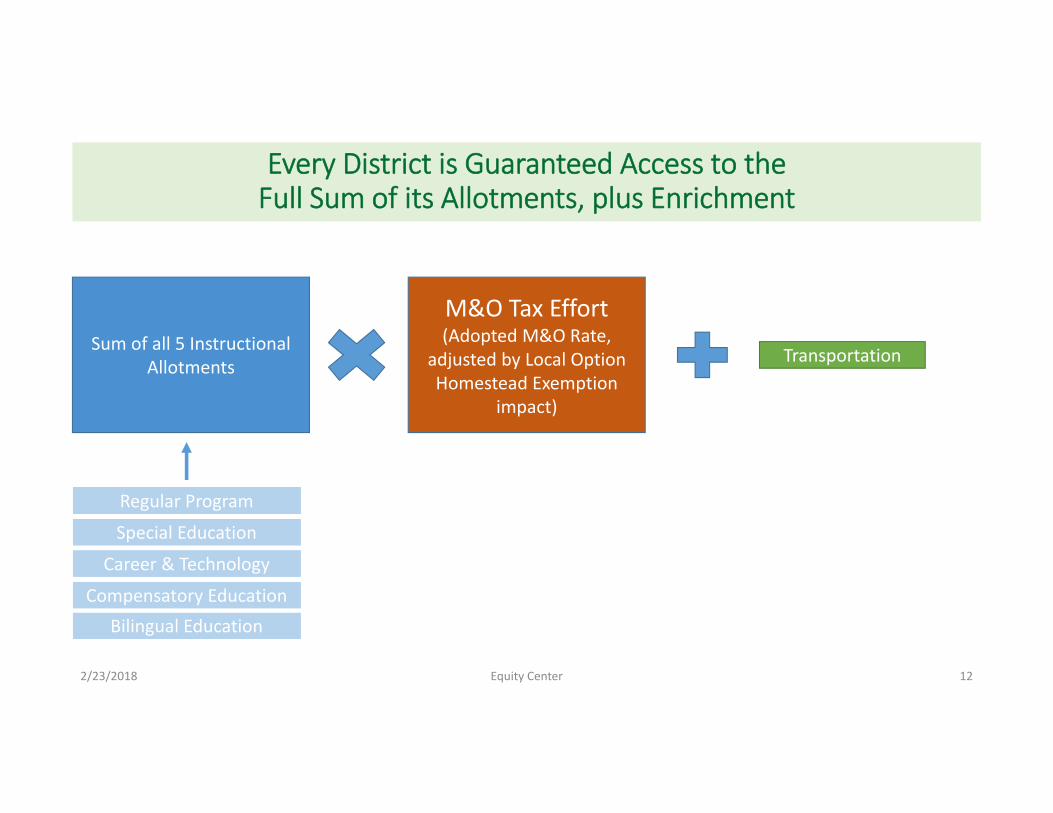
Every District is Guaranteed Access to the Full Sum of its Allotments, plus Enrichment
Transportation
Regular Program
Special Education
Career & Technology
Compensatory EducationBilingual Education
Sum of all 5 Instructional Allotments
M&O Tax Effort (Adopted M&O Rate,
adjusted by Local Option Homestead Exemption
impact)
2/23/2018 Equity Center 12

Determine Funding Levels
• Assume, for ease of following the calculations, the sum of the five instructional allotments is $1,000,000 and the Transportation Allotment is $50,000.
Examples:(Sum of 5 Allotments x Tax Effort) + Transportation = Funding Level
$1,000,000 x 1.00 = $1,000,000 + $50,000$1,000,000 x 1.04 = $1,040,000 + $50,000 $1,000,000 x 0.96 = $960,000 + $50,000 $1,000,000 x 1.17 = $1,170,000 + $50,000
For every 1 cent increase (or decrease) in tax effort, funding increases (or decreases) by 1%
2/23/2018 Equity Center 13

Tax Rate vs. Tax Effort
• The Local Option Homestead Exemption exempts a portion of the taxable value of homesteads
• Two districts, exactly alike, both taxing at $1.04 are not making the same effort if one of the districts is exempting part of its taxable value from taxation
Tax Effort = M&O Tax Rate XTaxable value a District IS
ENTITLED to tax
Taxable value a District CHOOSES to tax
2/23/2018 Equity Center 14

Sources of Funding
2/23/2018 Equity Center 15

State & Local Responsibilities
2/23/2018 Equity Center
Funding Amount at Chosen Tax
Effort
State Share of M&O Funding
M&O Tax Collections
Lower Wealth District Mid‐Wealth District
State Share of M&O Funding
M&O Tax Collections
ASF Per Capita ASF Per Capita
16
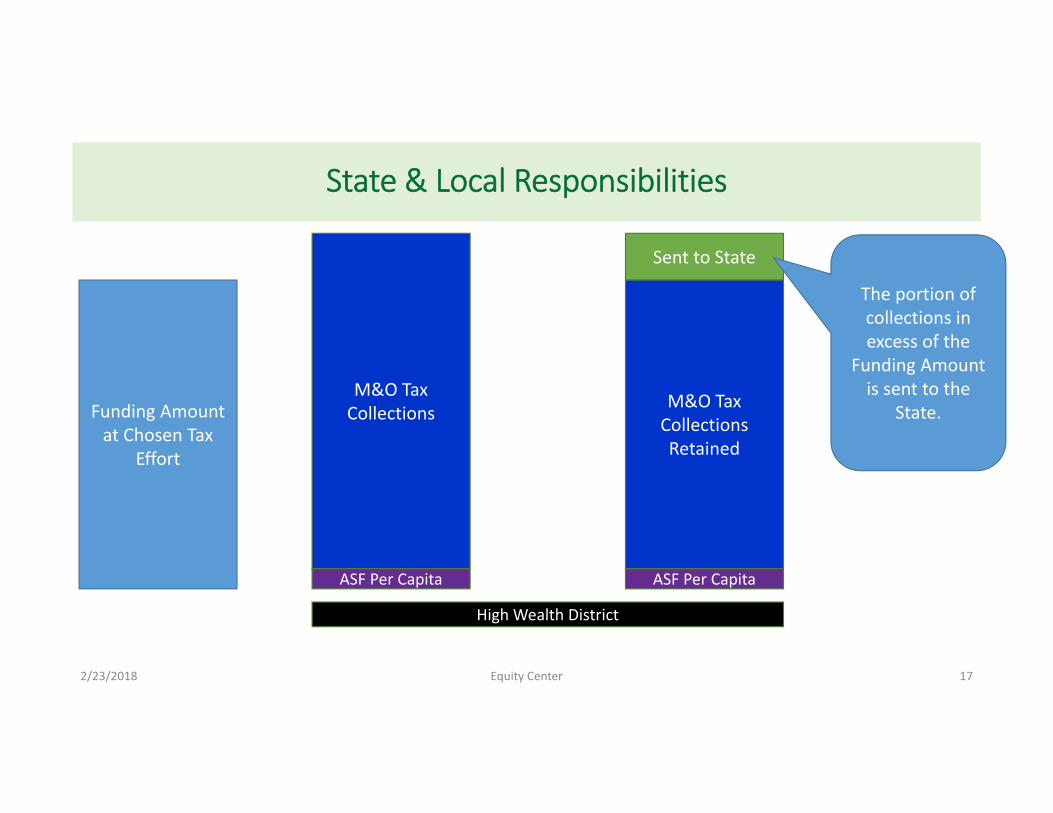
State & Local Responsibilities
2/23/2018 Equity Center
Funding Amount at Chosen Tax
Effort
High Wealth District
M&O Tax Collections
ASF Per Capita
Sent to State
M&O Tax CollectionsRetained
ASF Per Capita
The portion of collections in excess of the
Funding Amount is sent to the
State.
17

All Property Tax Collections Fund Public Education
• All increases in collections due to growth in district wealth must be spent on public education by covering student growth, increasing the Basic Allotment, increasing district adjustments and/or increasing allotment weights
• All increases in collections sent to the State must be used to increase the Basic Allotment
• These are both DRIVERS of school funding levels
2/23/2018 Equity Center 18

369
5729
501
30 32
$228,357$274,320
$1,092,849
$391,759
$998,593
$1,670,181
0
75
150
225
300
375
450
525
$200,000
$425,000
$650,000
$875,000
$1,100,000
$1,325,000
$1,550,000
$1,775,000
1.17 or above above 1.06 but lessthan 1.17
above 1.04 or equal to1.06
1.04 above 0.999 but lessthan 1.04
less than 1.00
FY 2017 SCHOOL DISTRICT ADOPTED M&O TAX RATE (ATR) INFORMATION
Number of Districts Average Wealth per WADA
2/23/2018 Equity Center 19

$6,269 $6,251
$6,601
$6,022
$6,952
$7,068
$1.17
$1.12
$1.06
$1.04$1.02
$0.92
$0.900
$0.950
$1.000
$1.050
$1.100
$1.150
$1.200
$5,900
$6,100
$6,300
$6,500
$6,700
$6,900
$7,100
1.17 or above above 1.06 but lessthan 1.17
above 1.04 or equal to1.06
1.04 above 0.999 but lessthan 1.04
less than 1.00
FY 2017 SCHOOL DISTRICT REVENUE PER WADA/ADOPTED M&O TAX RATE (ATR)COMPARISON
Average Revenue per WADA Average ATR
2/23/2018 Equity Center 20

2/23/2018
$4,000
$5,000
$6,000
$7,000
$8,000
$9,000
$10,000
$11,000
$12,000
$0.70 $0.75 $0.80 $0.85 $0.90 $0.95 $1.00 $1.05 $1.10 $1.15 $1.20 $1.25
FY 18 Revenue per WADA at Adopted M&O Tax RateTEA January 2018 DATA
$0.71 Tax Rate provides $9,883 per WADA
$1.24 Tax Rate provides $6,843 per WADA
58% of Tax Effort provides a $90,000 per Classroom advantage
Equity Center 21

$4,000
$4,500
$5,000
$5,500
$6,000
$6,500
$7,000
$0.70 $0.75 $0.80 $0.85 $0.90 $0.95 $1.00 $1.05 $1.10 $1.15 $1.20 $1.25
Texas School Finance‐‐FY 18 on a Cost Based Formula‐‐BA $5,583Revenue per WADA Without Transportation
2/23/2018 Equity Center 22

$4,000
$4,500
$5,000
$5,500
$6,000
$6,500
$7,000
$0.70 $0.75 $0.80 $0.85 $0.90 $0.95 $1.00 $1.05 $1.10 $1.15 $1.20 $1.25
Texas School Finance—FY 18 on a Cost Based Formula—BA $5,583Revenue per WADA — $1.04 Effective Tax Rate for all districts —Without Transportation
2/23/2018 Equity Center 23

Biggest Stumbling Blocks?
Those that Feel They must Protect the Status QuoThose that Purposefully Misidentify the Problems
2/23/2018 Equity Center 24

60% 61%63%
65%
59%
51%54% 53% 52%
54% 55% 55% 56% 56%58% 60%
40% 39%37%
35%
41%
49%46% 47% 48%
46% 45% 45% 44% 44%42% 40%
FY03 FY04 FY05 FY06 FY07 FY08 FY09 FY10 FY11 FY12 FY13 FY14 FY15 FY16 FY17 FY18
Funding Texas Public Education‐‐TEA Summary of Finance 1/31/2018
% Local % State
2/23/2018 Equity Center 25
What does Chapter 41 reallymean?
2/23/2018 Equity Center 26
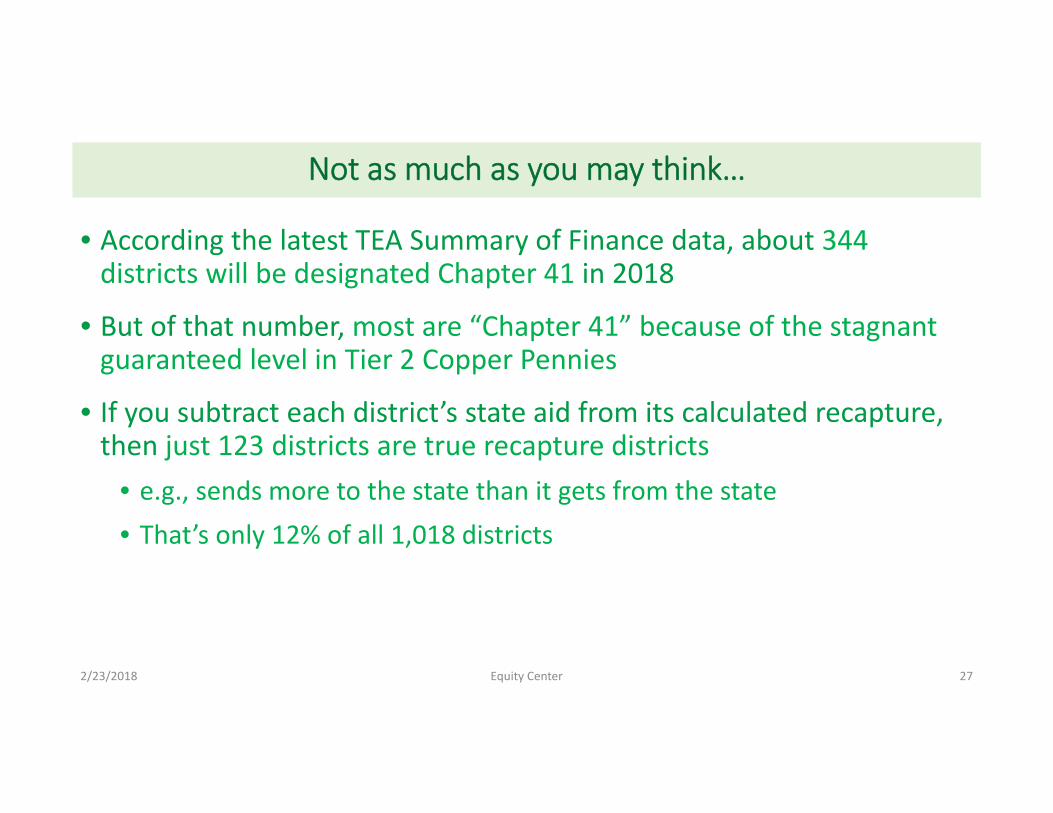
Not as much as you may think…
• According the latest TEA Summary of Finance data, about 344 districts will be designated Chapter 41 in 2018
• But of that number, most are “Chapter 41” because of the stagnant guaranteed level in Tier 2 Copper Pennies
• If you subtract each district’s state aid from its calculated recapture, then just 123 districts are true recapture districts
• e.g., sends more to the state than it gets from the state • That’s only 12% of all 1,018 districts
2/23/2018 Equity Center 27

Not as much as you may think…
344 Estimated Chapter 41 Districts in FY18
− 123 True Recapture Districts
221 Chapter 41 Districts that are substantially funded like Chapter 42 Districts
2/23/2018 Equity Center 28

Last session, the racket over recapture and ASATR drowned out the call for a more adequate system.
It literally sucked all the oxygen out of the capitol.
2/23/2018 Equity Center 29

“Robin Hood” recaptures the efficiency lost to our over‐reliance on property taxation to fund our public schools.
(That’s $320 per WADA over the biennium.)
2/23/2018 Equity Center 30

“Robin Hood” recaptures the efficiency lost to our over‐reliance on property taxation to fund our public schools.
Recapture is estimated to provide about $4,100,000,000 in NECESSARY revenue this biennium.
(That’s $320 per WADA over the biennium.)
2/23/2018 Equity Center 31

“Robin Hood” recaptures the efficiency lost to our over‐reliance on property taxation to fund our public schools.
Recapture is estimated to provide about $4,100,000,000 in NECESSARY revenue this biennium.
(That’s $320 per WADA over the biennium.)
2/23/2018 Equity Center 32

What would a system without recapture look like?
FY17 M&O Tax Rate
FY18 Current Law
FY18 without Recapture
Gain per Classroom
Tier 1 Recapture Districts 1.032 6,781 12,552 197,886
Everyone Else 1.097 6,262 6,267 170
Difference (6.5)cents 520 6,285 197,716
Additional State Funding Needed for the Biennium (without recapture) $4,100,000,000
2/23/2018 Equity Center 33
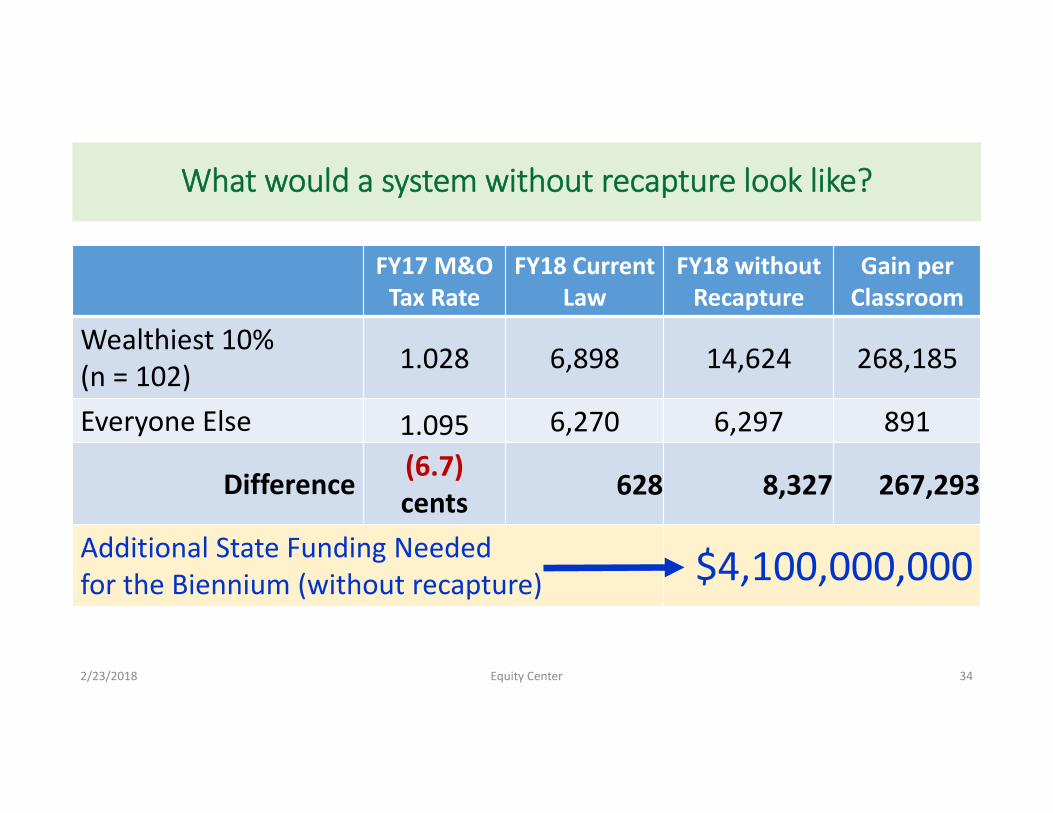
What would a system without recapture look like?
FY17 M&O Tax Rate
FY18 Current Law
FY18 without Recapture
Gain per Classroom
Wealthiest 10% (n = 102) 1.028 6,898 14,624 268,185
Everyone Else 1.095 6,270 6,297 891
Difference (6.7)cents 628 8,327 267,293
Additional State Funding Needed for the Biennium (without recapture) $4,100,000,000
2/23/2018 Equity Center 34

2/23/2018 Equity Center
$4,000
$5,000
$6,000
$7,000
$8,000
$9,000
$10,000
$11,000
$12,000
$0.70 $0.75 $0.80 $0.85 $0.90 $0.95 $1.00 $1.05 $1.10 $1.15 $1.20 $1.25
FY 18 Revenue per WADATEA January 2018 DATA
35
$28,000 gap per classroomof 22 students

2/23/2018 Equity Center
$4,000
$5,000
$6,000
$7,000
$8,000
$9,000
$10,000
$11,000
$12,000
$0.70 $0.75 $0.80 $0.85 $0.90 $0.95 $1.00 $1.05 $1.10 $1.15 $1.20 $1.25
FY 18 Revenue per WADA‐‐No RecaptureTEA January 2018 DATA
36
$28,000 gap per classroomof 22 students

2/23/2018 Equity Center
$4,000
$12,000
$20,000
$28,000
$36,000
$44,000
$52,000
$60,000
$68,000
$76,000
$84,000
$0.70 $0.75 $0.80 $0.85 $0.90 $0.95 $1.00 $1.05 $1.10 $1.15 $1.20 $1.25
FY 18 Revenue per WADA‐‐No RecaptureTEA January 2018 DATA
37

If not recapture, then what method of “efficiency” do we pick?
Choices• Eliminate local property tax and increase/create state tax to take its place
• Income Tax• State Property Tax• Increase Sales Tax• Split Tax Roll (Tax non‐homestead property at state level)• Keep and increase state Franchise Tax• Statewide Land Tax• Statewide fees
• Consolidation• Recapture
2/23/2018 Equity Center 38

2/23/2018 Equity Center 39


