15
Overview of Autogas market in Europe Samuel Maubanc General Manager AEGPL – European LPG Association [email protected] www.aegpl.be AIGLP Congress Buenos Aires, March 30 th , 2017
Overview of Autogas market in Europe
Samuel Maubanc General Manager
AEGPL – European LPG Association [email protected]
www.aegpl.be
AIGLP Congress Buenos Aires, March 30th, 2017
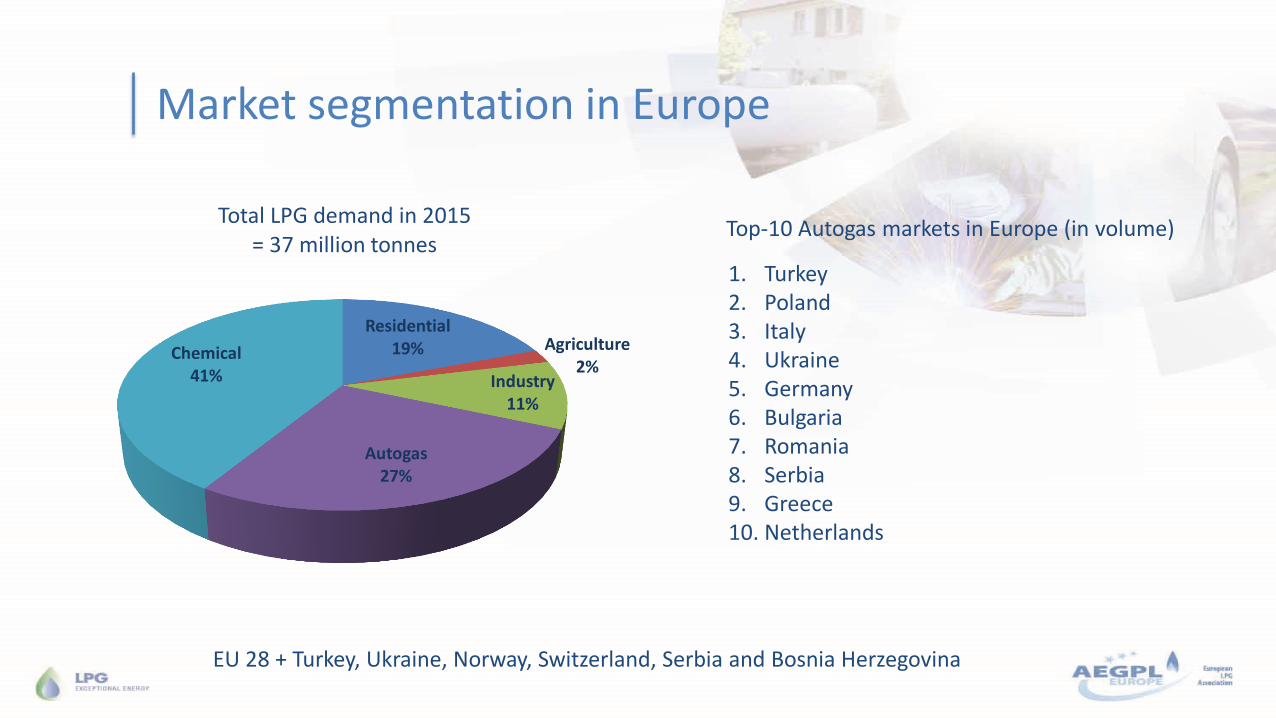
Market segmentation in Europe
Residential 19% Agriculture
2% Industry
11%
Autogas 27%
Chemical 41%
Total LPG demand in 2015 = 37 million tonnes
1. Turkey 2. Poland 3. Italy 4. Ukraine 5. Germany 6. Bulgaria 7. Romania 8. Serbia 9. Greece 10. Netherlands
Top-10 Autogas markets in Europe (in volume)
EU 28 + Turkey, Ukraine, Norway, Switzerland, Serbia and Bosnia Herzegovina
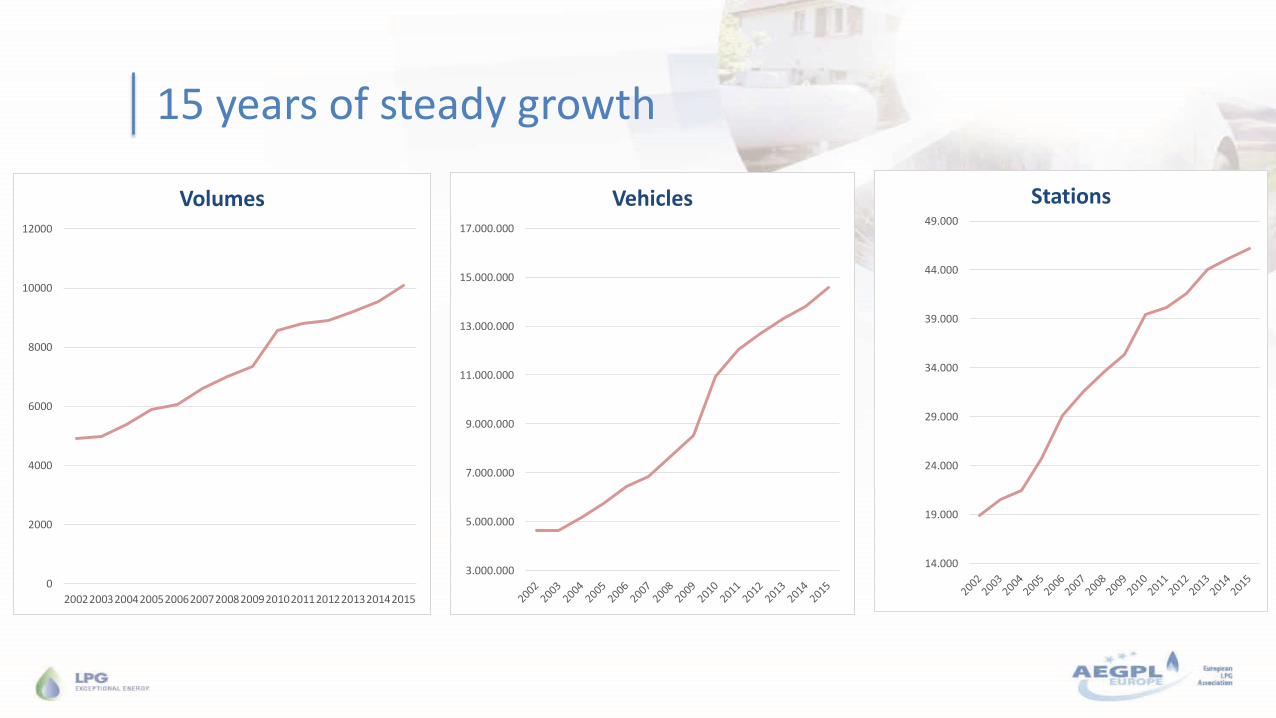
15 years of steady growth
0
2000
4000
6000
8000
10000
12000
20022003200420052006200720082009201020112012201320142015
Volumes
3.000.000
5.000.000
7.000.000
9.000.000
11.000.000
13.000.000
15.000.000
17.000.000
Vehicles
14.000
19.000
24.000
29.000
34.000
39.000
44.000
49.000
Stations
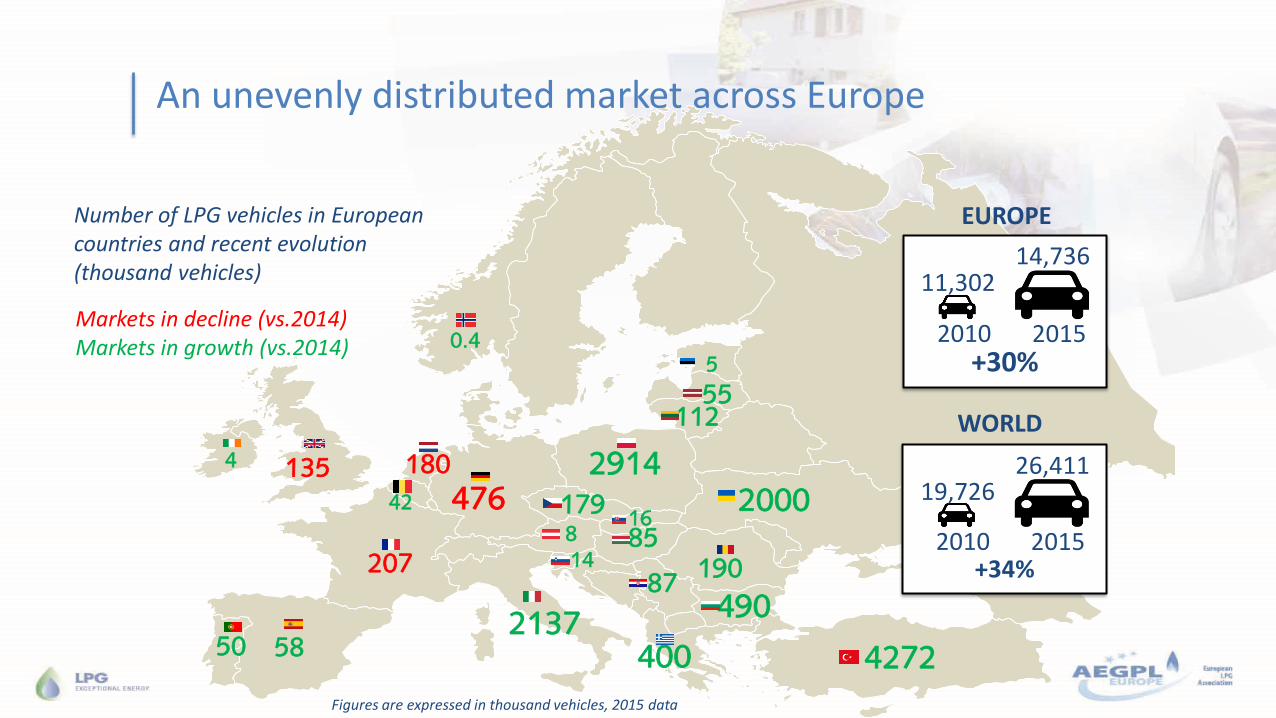
Number of LPG vehicles in European countries and recent evolution (thousand vehicles)
Markets in decline (vs.2014) Markets in growth (vs.2014)
14,736 11,302
2010 2015 +30%
26,411 19,726
2010 2015 +34%
50 58 2137
135 2914
490
400
476
190
180
207
Figures are expressed in thousand vehicles, 2015 data
8
42
87
179
5
85
4
55 112
16
14
0.4
4272
2000
EUROPE
WORLD
An unevenly distributed market across Europe
Key factors driving LPG demand in Europe
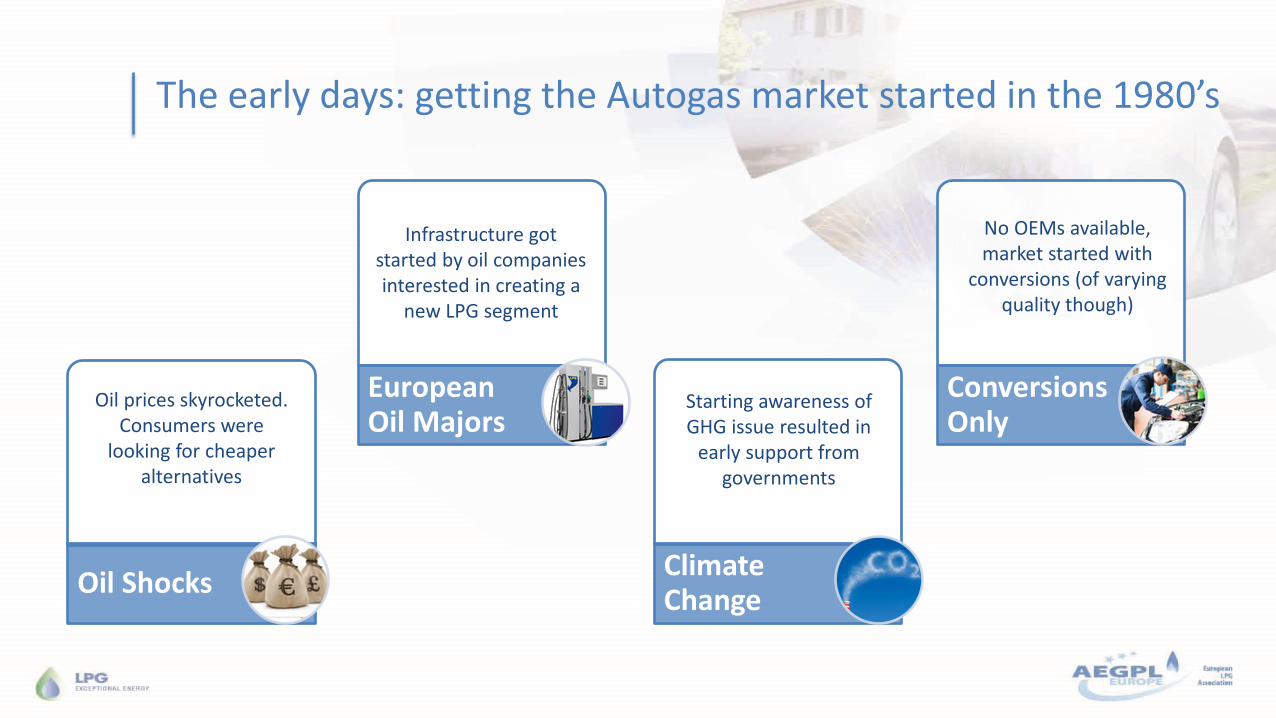
Oil Shocks
European Oil Majors
Climate Change
Conversions Only
Oil prices skyrocketed. Consumers were
looking for cheaper alternatives
Infrastructure got started by oil companies interested in creating a
new LPG segment
Starting awareness of GHG issue resulted in
early support from governments
No OEMs available, market started with
conversions (of varying quality though)
The early days: getting the Autogas market started in the 1980’s
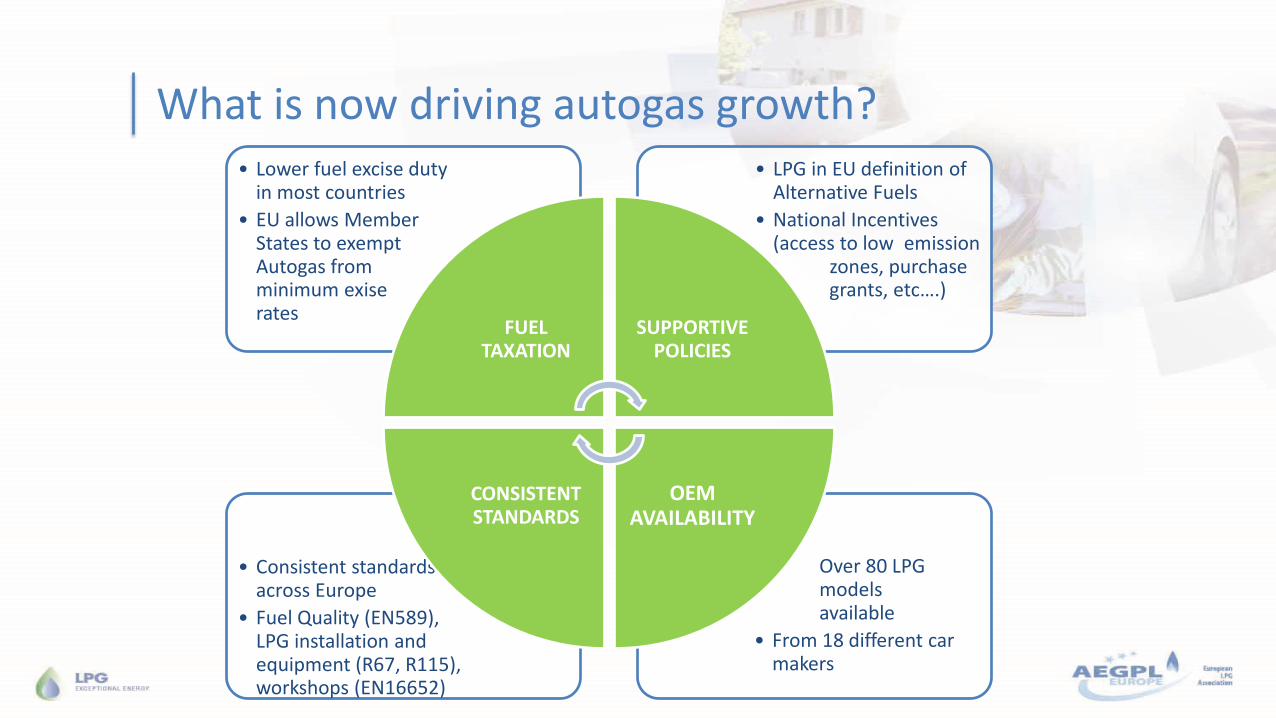
• Over 80 LPG models available
• From 18 different car makers
• Consistent standards across Europe
• Fuel Quality (EN589), LPG installation and equipment (R67, R115), workshops (EN16652)
• LPG in EU definition of Alternative Fuels
• National Incentives (access to low emission zones, purchase grants, etc….)
• Lower fuel excise duty in most countries
• EU allows Member States to exempt Autogas from minimum exise rates
FUEL TAXATION
SUPPORTIVE POLICIES
OEM AVAILABILITY
CONSISTENT STANDARDS
What is now driving autogas growth?
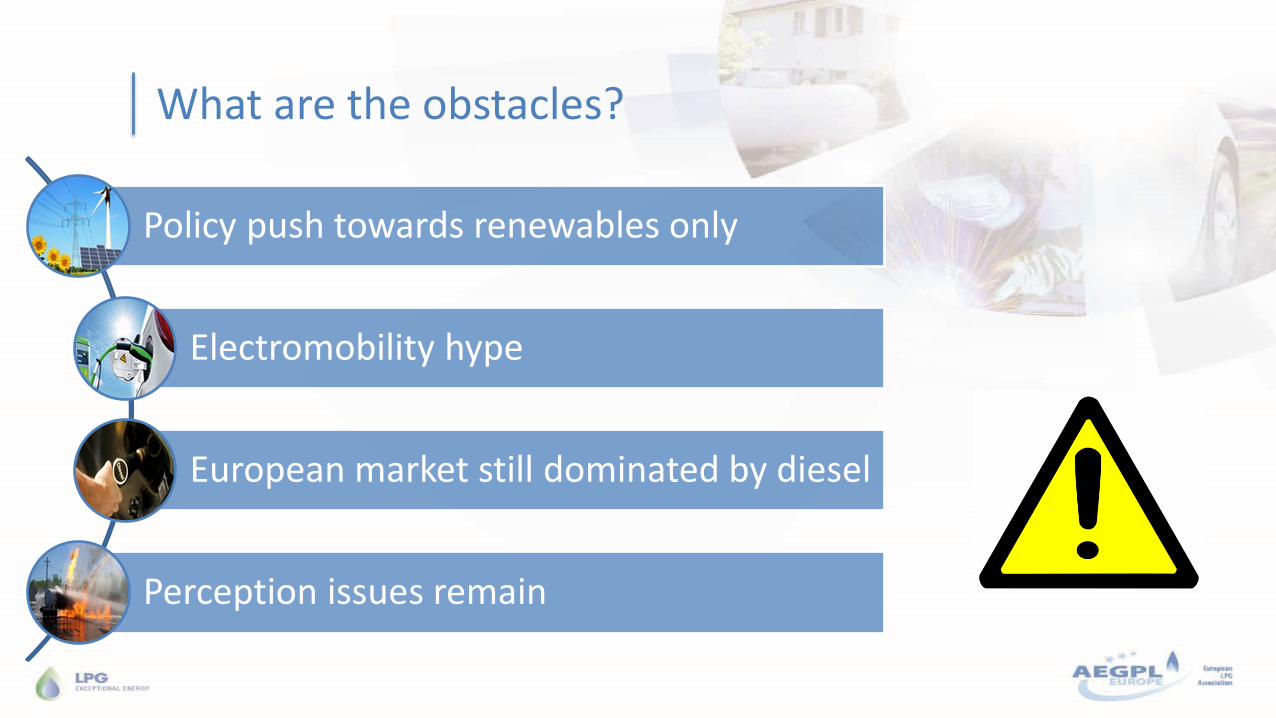
Policy push towards renewables only
Electromobility hype
European market still dominated by diesel
Perception issues remain
What are the obstacles?
What winning cards up our sleeves?
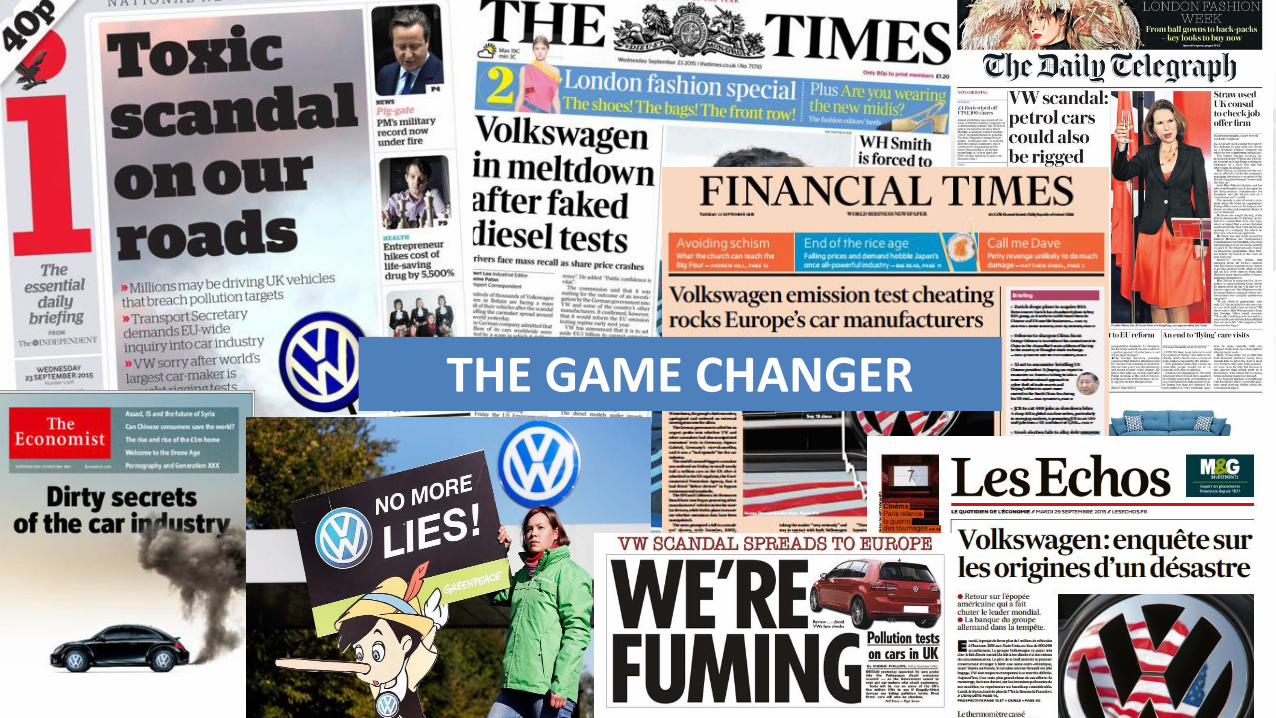
THE GAME CHANGER
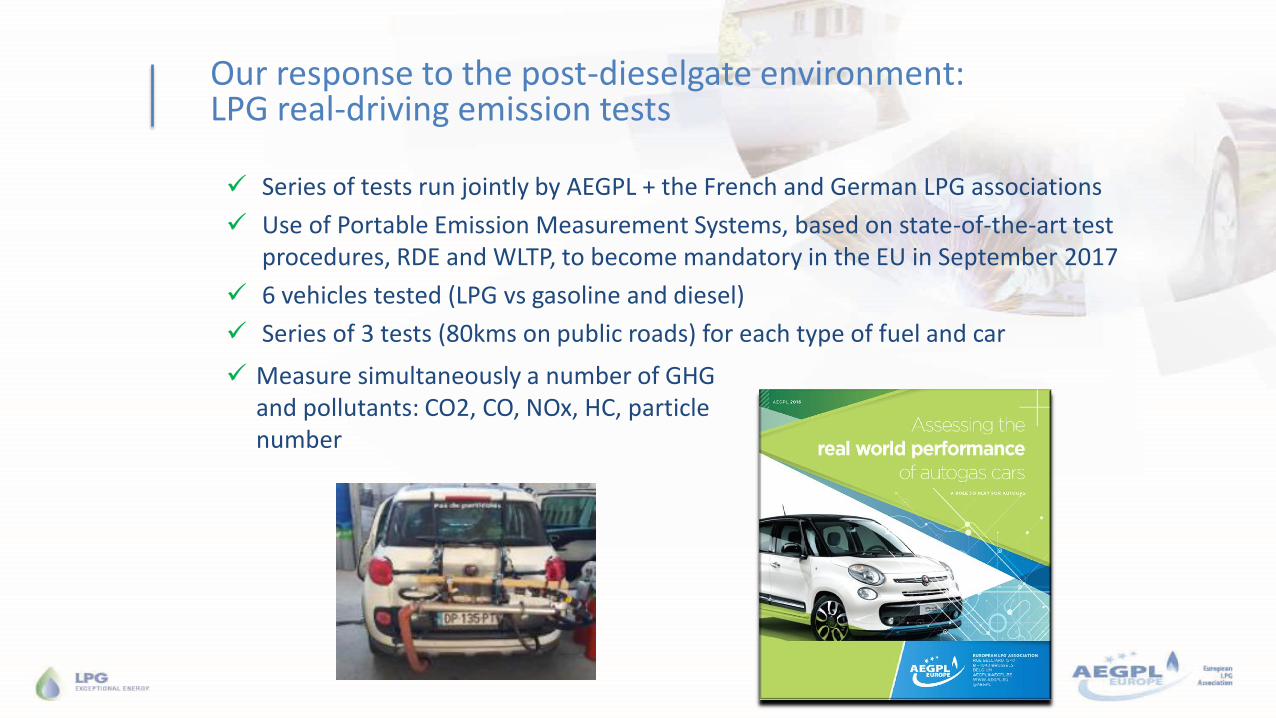
Our response to the post-dieselgate environment: LPG real-driving emission tests
Series of tests run jointly by AEGPL + the French and German LPG associations
Use of Portable Emission Measurement Systems, based on state-of-the-art test procedures, RDE and WLTP, to become mandatory in the EU in September 2017
6 vehicles tested (LPG vs gasoline and diesel)
Series of 3 tests (80kms on public roads) for each type of fuel and car
Measure simultaneously a number of GHG and pollutants: CO2, CO, NOx, HC, particle number
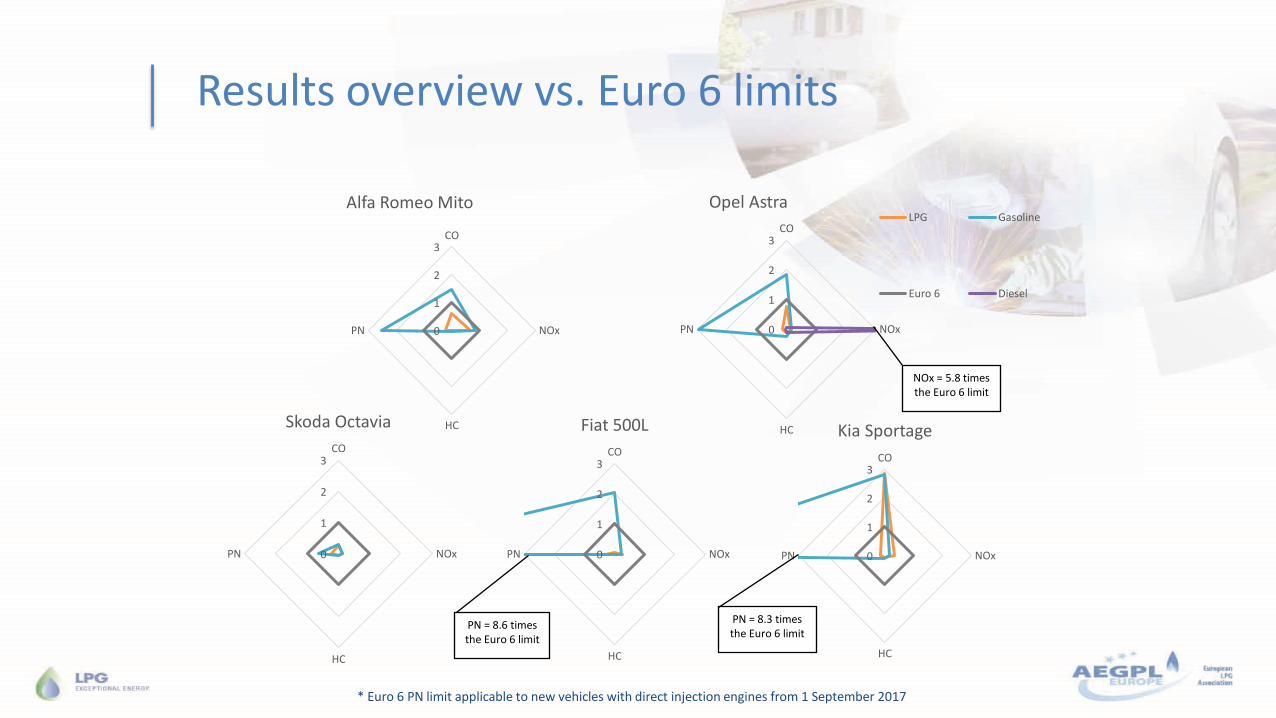
Results overview vs. Euro 6 limits
0
1
2
3CO
NOx
HC
PN
Alfa Romeo Mito
0
1
2
3CO
NOx
HC
PN
Fiat 500L
PN = 8.6 times the Euro 6 limit
0
1
2
3CO
NOx
HC
PN
Skoda Octavia
0
1
2
3CO
NOx
HC
PN
Opel Astra LPG Gasoline
Euro 6 Diesel
0
1
2
3CO
NOx
HC
PN
Kia Sportage
NOx = 5.8 times the Euro 6 limit
PN = 8.3 times the Euro 6 limit
* Euro 6 PN limit applicable to new vehicles with direct injection engines from 1 September 2017
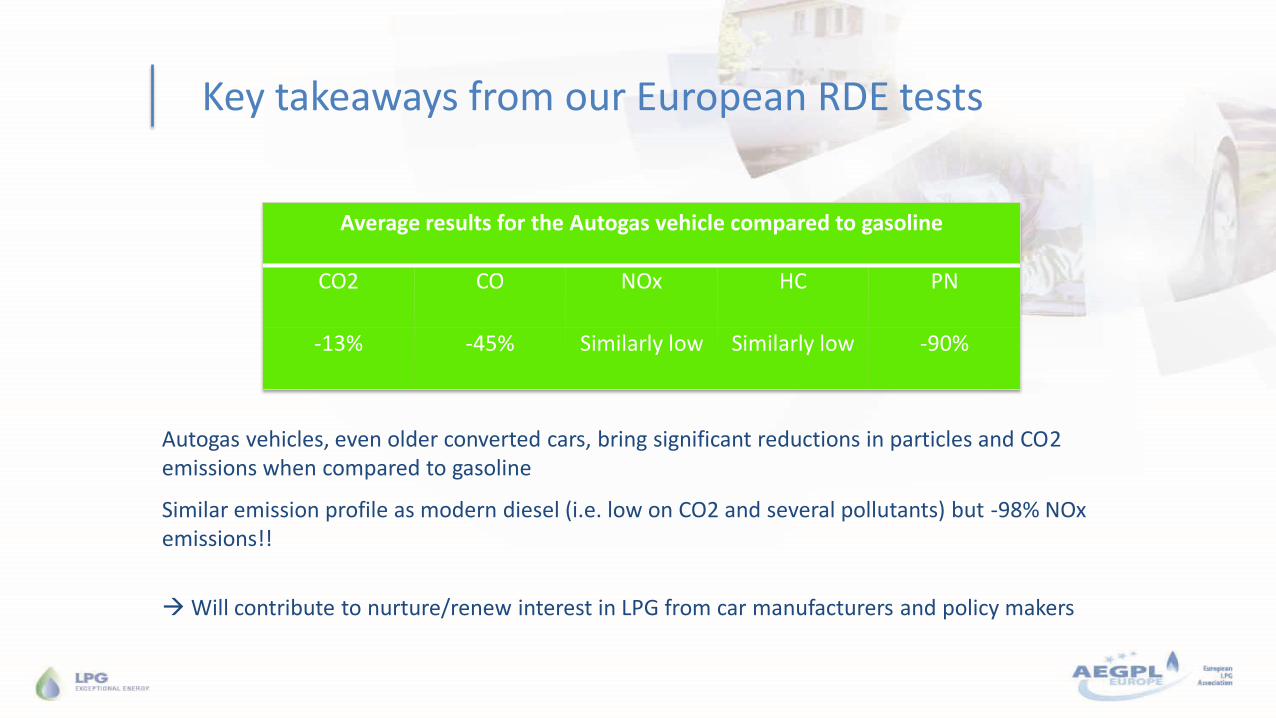
Key takeaways from our European RDE tests
Autogas vehicles, even older converted cars, bring significant reductions in particles and CO2 emissions when compared to gasoline
Average results for the Autogas vehicle compared to gasoline
CO2 CO NOx HC PN
-13% -45% Similarly low Similarly low -90%
Similar emission profile as modern diesel (i.e. low on CO2 and several pollutants) but -98% NOx emissions!!
Will contribute to nurture/renew interest in LPG from car manufacturers and policy makers
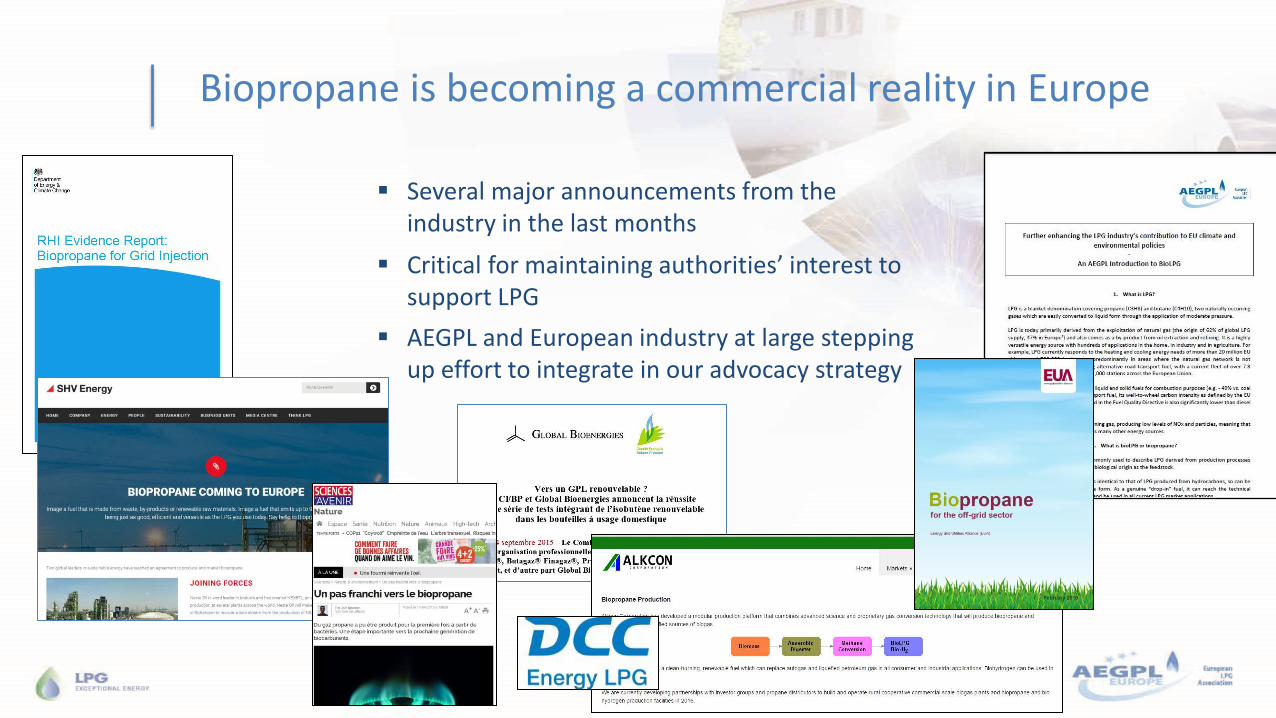
Biopropane is becoming a commercial reality in Europe
Several major announcements from the industry in the last months
Critical for maintaining authorities’ interest to support LPG
AEGPL and European industry at large stepping up effort to integrate in our advocacy strategy
See you in Lisbon, Portugal !
www.aegpl2017.com


