92
Health and Safety Executive Overview of collision detection in the UKCS Prepared by AEA Technology plc for the Health and Safety Executive 2006 RR514 Research Report
| Date post: | 03-Feb-2017 |
| Category: |
Documents |
| Upload: | dangnguyet |
| View: | 226 times |
| Download: | 1 times |

Health and Safety Executive
Overview of collision detection in the UKCS
Prepared by AEA Technology plc for the Health and Safety Executive 2006
RR514 Research Report

Health and Safety Executive
Overview of collision detection in the UKCS
J K Robson AEA Technology plc 329 Harwell International Business Centre Didcot Oxon OX11 0QJ
For many years the primary resource for monitoring and appraisal of the collision risks to UKCS offshore oil and gas installations posed by approaching vessels was the attendant ERRV and for the many units this is still the case. However, collision threat detection via radar watchkeeping is just one of a number of duties that the ERRV crew needs to conduct. Notwithstanding the foregoing, it is known that the tools they had to work with for collision threat detection were subject to a number of limitations. More recently there have been technological advancements leading to the relatively limited deployment of automated radar detection and tracking systems, the so called ‘hybrid’ radar, to supplement the work of the ERRV crews and assist in the overall collision risk management strategy. Other changes in the global regulatory regime of the marine industry has also seen the implementation of automatic identification system (AIS) equipment which may also have an impact on vessel identification and the processes through which an errant vessel may be warned off when approaching an installation. These factors were investigated in detail during the course of the study and the results are discussed both for how they affect current operations and may be adopted in the future to enhance offshore safety.
This report and the work it describes were funded by the Health and Safety Executive (HSE). Its contents, including any opinions and/or conclusions expressed, are those of the author alone and do not necessarily reflect HSE policy.
HSE Books

© Crown copyright 2006
First published 2006
All rights reserved. No part of this publication may bereproduced, stored in a retrieval system, or transmitted inany form or by any means (electronic, mechanical,photocopying, recording or otherwise) without the priorwritten permission of the copyright owner.
Applications for reproduction should be made in writing to:Licensing Division, Her Majesty’s Stationery Office,St Clements House, 216 Colegate, Norwich NR3 1BQor by email to hmsolicensing@cabinetoffice.x.gsi.gov.uk
ii

CONTENTS
EXECUTIVE SUMMARY v
1 INTRODUCTION 1
2 CIVIL MARINE RADAR 3
2.1 BACKGROUND 32.2 EQUIPMENT OVERVIEW 62.3 PERFORMANCE STANDARDS 72.4 DESIGN CONSIDERATIONS AFFECTING PERFORMANCE 102.5 PHYSICAL CONDITIONS AFFECTING PERFORMANCE 11
2.5.1 Scanner Height 112.5.2 Blind and Shadow Sectors 112.5.3 Target Reflective Properties 122.5.4 False or Spurious Echoes 13
2.6 METEOROLOGICAL CONDITIONS AFFECTING PERFORMANCE 132.7 SUMMARY AND DISCUSSION 14
3 AUTOMATIC IDENTIFICATION SYSTEMS (AIS) 17
3.1 OVERVIEW 173.2 USE OF AIS 18
3.2.1 Ship-to-Ship Data Exchange 183.2.2 Coastal Surveillance 183.2.3 Vessel Traffic Systems 183.2.4 Potential Benefits of AIS to the Offshore Industry 19
3.3 AIS COMMUNICATIONS SCHEME 193.4 AIS MESSAGES 203.5 AIS SHIPBOARD EQUIPMENT 213.6 AIS BASE STATION EQUIPMENT 223.7 SHIPBOARD CARRIAGE REQUIREMENTS 223.8 AIS STANDARDS 233.9 IMPLEMENTATION AND USE OF AIS IN THE UK 233.10 SUMMARY AND DISCUSSION 23
3.10.1 AIS as an Enhancement to Marine Radar? 233.10.2 Integrating AIS with Radar 243.10.3 Limitations of AIS 253.10.4 Conclusion 26
4 HYBRID RADAR SYSTEMS 27
SCOPE 27OPERATING PARAMETERS 28OPERATING CONSIDERATIONS FOLLOWING SYSTEM MALFUNCTION 28
5 DISCUSSION 31
APPENDICES Appendix 1 Comparison of REWS and ERRV Gathered Data
Due to Close By Obstacles” by Professors A.K. Brown and P.D.L. Williams
Appendix 2 MCA Shipping Notices and Marine Guidance Notes for AIS Appendix 3 “Report on the Performance Degradation of Civilian Marine Radar
iii

iv
EXECUTIVE SUMMARY
Many areas of the UKCS are subject to high traffic densities from a wide range of vessel types; fishing vessels, transiting merchant ships and regular scheduled ferry routes. In some areas, principally in the southern North Sea and Irish Sea, navigational constraints and routing schemes tend to funnel passing vessels into close proximity with installations. Combining these factors increases the risk of a vessel/installation collision. A review of past collision incidents reveals that such events, which can lead to catastrophic collapse of the installation or foundering of the vessel, have largely been the result of either mechanical failure or inadequate watchkeeping on the vessel.
With the potential for such a serious incident it has long been the offshore industry’s contention that those on board offshore installations can not rely solely on vessels to realise their responsibilities and keep out of their way. Instead, Duty Holders have developed systems to provide early warning of collision risk as part of an overall collision risk management strategy. For many years the stand-by vessel’s watchkeeping officers and radar were cornerstone of an installation’s early warning system and in many fields this is still the case. In itself all civil marine radar have a disadvantage when attempting to provide collision warnings for installations insofar as all IMO radar performance standards refer to minimum accuracies with respect to the vessel on board which they are fitted rather than to a third party. Such shortcomings are compounded when the ‘blind’ and ‘shadow’ sectors of a vessel based radar are considered as well as the degradation of performance caused by intervening obstructions.
More recently a number of technological advances have opened up the possibility for a more integrated and holistic solution where unmanned and automated radars can provide an early indication of an approaching collision risk, pass information to slave displays at remote locations and assist in the location of in-water casualties. Such systems have become known as ‘hybrid radar’ and in principle they offer the potential to overcome some of the drawbacks of vessel based radar because they can be sited to best advantage. Moreover, their use can free up watchkeeping officers from some of the more tedious and mundane tasks that collision risk monitoring entails.
Technology and the marine industry’s regulatory regime are constantly moving forward and with the recent introduction of the automatic identification system (AIS) the possibility to uniquely identify vessels in the vicinity has become a reality, albeit with some gaps where the type or size of a vessel falls outside the scope of the carriage requirements. The manner and extent to which those concerned with collision risk warning and management utilise the AIS technology remains to be fully proven though early experience has highlighted a number of issues. Foremost among these is the reliance that AIS has been properly set up; it is a ‘cooperative’ system requiring accurate inputs to be of use otherwise it may transmit erroneous data that could lead to greater problems.
Trials and critical analysis of hybrid radar performance has highlighted some performance concerns with respect to spurious targets but, overall, when combined with the benefits afforded by an integrated on-station stand-by vessel the collision risk management solution can be particularly robust.
The report highlights each facet of collision detection in the UKCS; civil marine radar, hybrid radar and AIS in detail. At the end of each section the results are summarised and discussed for their relevance. The report concludes with an overall discussion on the state of collision risk warning and management in the UKCS.
v

vi

1 INTRODUCTION
Collision or impact are general terms to describe any contact between an offshore oil and gas installation and another vessel and it is one of the ‘major’ hazards that can befall a fixed or floating installation. The inherent energy transfer to a stationary installation from a vessel, of not necessarily large displacement, travelling at even modest speed can quite easily cause deformation of structural members or possibly catastrophic failure.
Experience of offshore oil and gas extraction in both the UKCS and other areas of the world has demonstrated that collision is not an abstract event. The Ship/Platform Collision Incident Database (2001)1, contains details of 557 collision incidents recorded between 1975 and 2001. Of these, 549 (98.6%) were assessed as being collisions between an installation and an ‘attendant vessel’ and the remainder with a ‘passing vessel’. In the context of the database, attendant vessels are usually categorised as those craft that approach an installation for a bona fide reason and after having first sought permission from the installation to do so. Examples of these are platform supply vessels (PSVs); escape, rescue and recovery vessels (ERRVs); or tankers working at a floating production and storage unit (FPSO).
Obviously, because of the generally higher speeds being involved with a passing vessel and the likelihood that it will have a larger displacement than an attendant vessel, the potential effect from collision will be greater. This, coupled with the difficulties caused by the oil and gas industry’s inability to control events beyond the 500 metres ‘safety zone’, has meant that more attention has been focussed on monitoring the activities of approaching vessels and giving early warning where it appears the installation’s safety may be impinged.
Historically, ERRVs, or their predecessor the stand-by vessel (SBV), were the primary source of monitoring and appraisal of the collision risks posed by an approaching vessel and, around a number of installations, this is still the case. With changes to the work activities and generally higher expectations of the duties to be undertaken by ERRV the need for diligent and traditional radar watchkeeping for approaching vessels has not diminished but has become just one of the competing duties that the crew needs to be vigilant to. Set against this backdrop the tools ERRV crews have to work with are subject to a number of limitations in common with all civil marine radar (CMR). An overview of the operation and practical limitations of the radar equipment commonly is use by ERRV is discussed in Section 2 of this report.
More recently, through the development of an Automatic Identification System (AIS), the marine industry has started to come to terms with the mandatory requirement for many vessels to be fitted with and use a system to exchange static and dynamic information about their vessel with other in the vicinity. It is inevitable that the introduction of AIS will have an impact on the way collision risk management is carried out on the UKCS and Section 3 deals with this in more detail.
The last decade has seen the development of several ‘hybrid’ radar systems that are largely automated and are an integral part of a larger emergency response (ER) plan. Moreover, rather than being seen as an alternative to and in competition to with traditional radar watchkeeping, such systems ought to be considered as supplementary to it and as a tool through which early warning of collision risk can be disseminated. The philosophy and practical operation of a hybrid radar system currently in use in the UKCS is detailed in Section 5. Building on this and using data from an earlier study, Appendix 1 of this report compares the results from
1 Ship/Platform Collision Incident Database (2001), Research report 053, JK Robson – MaTSU, 2003
1

automatically acquired radar data with that manually recorded by an ERRV crew and attempts to explain some of the issues highlighted.
The report concludes in Section 6 with a discussion on a number of observations made during this study.
2

2 CIVIL MARINE RADAR
2.1 BACKGROUND
In its broadest and most simple description a radar transmits a short pulse of energy from its scanner and a small amount may be reflected back to the scanner in the form of an echo.
Commercial shipborne radar has been commonplace for many years and their installation is mandatory on vessels under the provisions of the International Convention for the Safety of Life at Sea. As far back as 1971 the Inter-Governmental Maritime Consultative Organisation (now International Maritime Organisation - IMO) made recommendations for minimum performance standards for the equipment (Resolution A.221(VII) – adopted on 12 October 1971 – Performance Standards for Navigational Radar Equipment) to ensure it met the stated aim of:
“Provide an indication in relation to the ship of the position of other surface craft and obstructions and of buoys, shorelines and navigational aids in a manner which will assist in avoiding collision and in navigation.”2
Subsequently, the IMO has made a number of further resolutions relating to marine radar to encompass developments and enhancements in technology of newer equipment:
• Resolution A.278(VIII) – adopted 20 November 1973 – Supplement to the Recommendation on Performance Standards for Navigational Radar Equipment
• Resolution A.422(XI) – adopted 15 November 1979 – Performance Standards for Automatic Radar Plotting Aids
• Resolution A.477(XII) – adopted 19 November 1981 – Performance Standards for Radar Equipment
• Resolution A.820(19) – adopted 23 November 1995 – Performance Standards for Navigational Radar Equipment for High-Speed Craft
• Resolution A.823(19) Appendix 3 – adopted 23 November 1995 – Performance Standards for Automatic Radar Plotting Aids (ARPAs)
• Resolution MSC.64(67) Annex 4 – adopted 4 December 1996 – Adoption of New and Amended Performance Standards
Throughout the various resolutions the stated aim of the radar equipment has endured and therein lies a possible problem when using a shipborne radar for providing collision risk warning for an installation or any other third party. Specifically, the performance standards relate to the minimum expectation for range/bearing accuracy and discrimination of targets detected by the shipborne unit in the vicinity of itself rather than being able to predict their movement in relation to another location such as the installation it guards.
The majority of modern CMR far exceed the performance standards laid down by the IMO and with their new models their manufacturers are left to add features or redesign their equipment
2 Performance Standards for Shipborne Radiocommunications and Navigational Equipment, Fourth Edition (2002), page II/3.1(a)/1, International Maritime Organisation, ISBN 92-801-5139-8.
3
to make them more user friendly or better integrate with other bridge systems. However, while most CMR are undoubtedly better than they used to be at providing users with information on objects in the vicinity of their vessel and the associated risks they may pose, there are particular concerns in the offshore industry where the equipment is used to the benefit of one or more installations. Primarily the equipment is being called upon to undertake tasks it was not designed for, against performance standards that are not entirely relevant and with vessel crews that may not have been specifically trained to carry out such assessments.
The IMO performance standards are based around the accuracy of information of objects in the vicinity of ‘own ship’ rather than predicting the course, speed and closest approach to a distant point. Furthermore, the radar training and competence of deck officers is based on the use of radar to assist their own vessel and the assessment of risk posed to it rather than to a third party, notwithstanding the fact that to some extent it may be of use in such circumstances.
The last decade has seen the development of so-called ‘hybrid radar systems’ that use radar as part of their function to perform a number of safety critical tasks. These range from assisting in the location of personnel who may have entered the water following helicopter ditching or over the side work to the detection and tracking of vessels that have the potential to collide with an installation. One such system is the Radar Early Warning System (REWS) developed by SML Technologies Ltd. With these systems the most advantageous location for the equipment can be selected to optimise radar performance in respect of vessel detection and tracking.
While it is likely that an ERRV mounted radar ought to be able to detect the majority of targets in its vicinity at an adequate range to warn of risk of collision, in a number of cases on the UKCS, particularly in the southern North Sea (SNS), one vessel may have responsibility for a number of installations. In these circumstances it is possible for an ERRV to be at one extreme of its operational area while an errant vessel is approaching from the other. Depending on the size of the area covered and disposition of installations within it, the limitations of a CMR may lead to a reduction in the detection and warning time for an errant vessel. Figure 1, overleaf, highlights the possible effect on early radar detection of an ERRV patrolling a field of multiple installations.
4

Figure 1 Radar coverage provided by hybrid radar system and ERRV
Figure 1 depicts a seven installation field and the radar coverage area of a hybrid radar system with 25 nautical mile range fitted at installation ‘B’ with an ERRV using the 12 miles range to the south of installation ‘G’. The early warning provided by the ERRV of vessels approaching the field from the west is likely to be impaired (even if radar watchkeepers used the 24 miles range) and will require an extra degree of vigilance from those involved.
It is quite likely that some of the installations depicted in the field in Figure 1 are normally unattended (NUI) and therefore it is unlikely that the ERRV will not be called upon to provide close standby as a matter of routine. However, even in such circumstances, continuous collision risk monitoring for all installations will still need to be provided. In some cases daughter craft (DC) have taken on the support role of NUI during manned periods and these, too, are fitted with radar. For anything other than rudimentary navigation and target detection the fitness for purpose of their radar is a matter for conjecture.
5
Moreover, where groups of installations are covered there could be some degradation of radar performance caused by intervening structures resulting in the possibility of ‘blind’ or ‘shadow’ sectors in the lee of installations. The magnitude of this phenomenon is largely dependent on the size and type of the installation and the ERRV’s proximity to it. For instance, radar performance is less likely to be affected by smaller tubular structures than by large solid jackets whereas the performance of an ERRV radar that is close to an installation will be subjected to bigger ‘blind’ and ‘shadow’ sectors than one that is further away. The largest of these effects will probably occur if an ERRV is close to an FPSO or similar; these are essentially ship shaped structures which that are likely to produce large blind or shadow sectors for the ERRV’s radar when close.
The utilisation of a single ERRV to cover several jackets increases the complexity of the task by more than simply a multiple of the number of jackets involved. The need to detect, assess and monitor targets as they approach and pass several geographically separate installations, while at the same time factoring in different blind and shadow sectors, increases the workload on ERRV OOWs considerably.
HSE recently carried a further complementary study into the effect of intervening obstructions between a CMR and approaching targets. The results of the in-depth work by eminent academics, who also have practical experience of the issues involved, is presented in Appendix 3.
2.2 EQUIPMENT OVERVIEW
Radar works on the principal of electro-magnetic waves being transmitted in short bursts, which, on encountering an object, are echoed back. The time taken for the echo to be received and the direction from which the echo emanates enables both the range and bearing of the object to be determined.
In its simplest form a modern CMR operates with five main components:
Transmitter The transmitter can either be located within the scanner or in a separate enclosure some distance away and it generates the electro-magnetic pulses. Transmitters differ in respect of the pulse length and power and the pulse repetition frequency (PRF). The pulse length and PRF are controlled automatically by the radar display range control in use. (See section 2.4 – Design Considerations Affecting Performance for details)
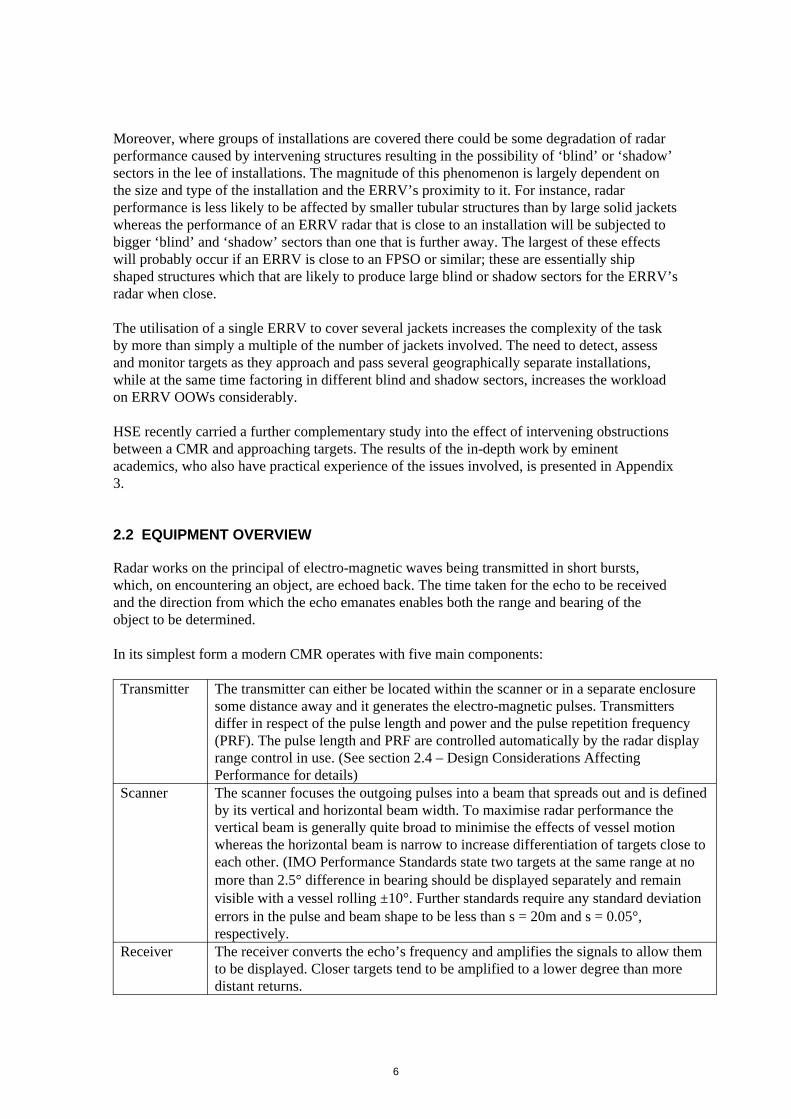
Scanner The scanner focuses the outgoing pulses into a beam that spreads out and is defined by its vertical and horizontal beam width. To maximise radar performance the vertical beam is generally quite broad to minimise the effects of vessel motion whereas the horizontal beam is narrow to increase differentiation of targets close to each other. (IMO Performance Standards state two targets at the same range at no more than 2.5� difference in bearing should be displayed separately and remain visible with a vessel rolling –10�. Further standards require any standard deviation errors in the pulse and beam shape to be less than s = 20m and s = 0.05�, respectively.
Receiver The receiver converts the echo’s frequency and amplifies the signals to allow them to be displayed. Closer targets tend to be amplified to a lower degree than more distant returns.
6
Display The display converts incoming range and bearing data into an XY radar picture. Without a gyro input the radar picture will be displayed as head up with the top of the display as the forward direction over the bow. This gives a relative radar picture showing all targets with respect to the bow of the ship. Including a gyro input permits a north up picture with the ship’s heading highlighted as it would on a chart. The latter type of display, known as ‘sea stabilisation’ has a number of advantages over the former: � target tails are distinct as the effect of a vessel yawing is displayed on the
heading marker only. � target bearings can be obtained directly from the radar without the need to
first find the relative bearing from the fore/aft line of the vessel and then apply this to the vessel’s true course.
� target display remains constant as the vessel alters heading – only the heading line changes.
� target bearings can be taken while the vessel alters course. � orientation of the radar display and navigational chart are the same; this is
particularly important when fixed objects or land are within radar range.
To display the absolute position (latitude/longitude) of a target requires (normally) a GPS input, with an offset added for the difference in position of the GPS antenna and the radar antenna.
ARPA An ARPA unit extracts the radar tracks from the radar video and displays them on Tracker the radar display. After initial detection the target’s speed, course CPA, etc., are
determined after a number of collaborating returns.
The main factors affecting the accuracy of measurement of this target are examined below.
2.3 PERFORMANCE STANDARDS
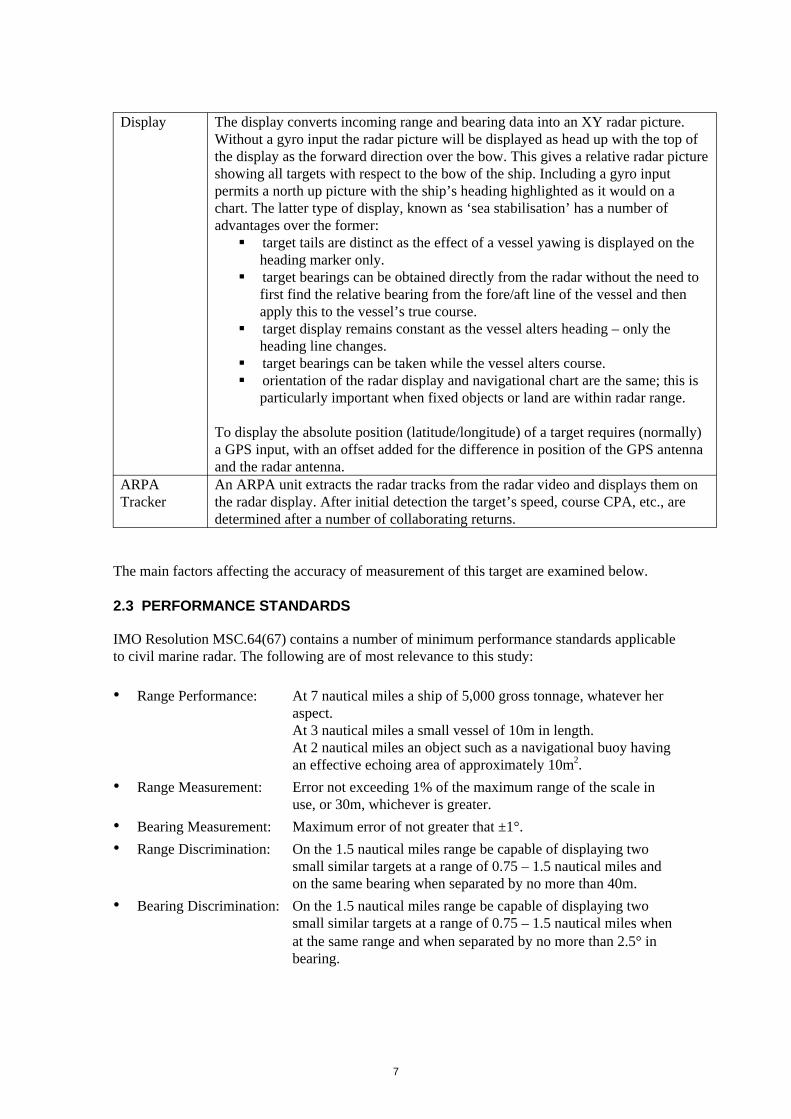
IMO Resolution MSC.64(67) contains a number of minimum performance standards applicable to civil marine radar. The following are of most relevance to this study:
• Range Performance: At 7 nautical miles a ship of 5,000 gross tonnage, whatever her aspect. At 3 nautical miles a small vessel of 10m in length. At 2 nautical miles an object such as a navigational buoy having an effective echoing area of approximately 10m2.
• Range Measurement: Error not exceeding 1% of the maximum range of the scale in use, or 30m, whichever is greater.
• Bearing Measurement: Maximum error of not greater that –1�.
• Range Discrimination: On the 1.5 nautical miles range be capable of displaying two small similar targets at a range of 0.75 – 1.5 nautical miles and on the same bearing when separated by no more than 40m.
• Bearing Discrimination: On the 1.5 nautical miles range be capable of displaying two small similar targets at a range of 0.75 – 1.5 nautical miles when at the same range and when separated by no more than 2.5� in bearing.
7

• Roll or Pitch: The performance standards prescribed by the IMO should be capable of being maintained when the ship is rolling or pitching –10�.
Additionally, IMO Resolution A.823(19) sets performance standards for ARPAs based on four predefined scenarios within 1 minute of tracking and again within 3 minutes of tracking:
Table 1 IMO performance standards for automatic radar plotting aids (ARPA)
Scenario Own ship
course
Own ship
speed
Target range
Target bearing
Relative course of
target
Relative speed of
target 1 000� 10 knots 8 Nm 000� 180� 20 knots 2 000� 10 knots 1 Nm 000� 090� 10 knots 3 000� 5 knots 8 Nm 045� 225� 20 knots 4 000� 25 knots 8 Nm 045� 225� 20 knots
In the tables below the minimum accuracy requirements of shipborne ARPA equipment are presented. The data reflects the different scenarios described above:
Table 2 IMO minimum performance standards within 1 minute of tracking
Scenario
Data Relative course
(degrees)
Relative speed
(knots)
CPA
(nautical miles)
1 11 2.8 1.6
2 7 0.6 -
3 14 2.2 1.8
4 15 1.5 2.0
Table 3 IMO minimum performance standards within 3 minutes of tracking
Scenario
Data Relative course
(degrees)
Relative speed
(knots)
CPA
(nautical miles)
TCPA
(minutes)
True course
(degrees)
True speed
(knots)
1 3.0 0.8 0.5 1.0 7.4 1.2
2 2.3 0.3 - - 2.8 0.8
3 4.4 0.9 0.7 1.0 3.3 1.0
4 4.6 0.8 0.7 1.0 2.6 1.2
IMO Resolution A.823(19) also recognises a number of other errors peculiar to ARPA, the so called ‘Sensor Errors’, emanating from log/gyro compass inputs and other factors connected with the equipment’s design and set up. Sensor errors can affect both the range and bearing accuracy however have been taken into account in the accuracy figures quoted in Tables 2 and 3.
8

Table 4 IMO sensor errors
Factor Magnitude Comment Error in
Pulse shape ±20 m The IMO Performance Standards have a maximum pulse shape error of ±20m.
Range
Target glint ±30 m) The IMO Performance Standards allow for target glint Range (scintillation) errors for a target of 200m in length of s = 30m along the length of the beam.
Factor Magnitude Comment Error in
Quantisation ±19 m (rectangular distribution)
Range quantisation of the ARPA is the sampling frequency. The maximum permitted Range Quantisation to meet the IMO Performance Standards is ± 0.01 Nm (±18.52m).
Range
Trigger setting ±5 m The trigger delay is part of the internal system and has to be adjusted on site to account for the installation. Typically, it can not be set up better than ±5 m (within ±33 ns).
Range
Total Range ±74 m Error Beam shape ±0.05� The IMO Performance Standards have a maximum
beam shape error of ±0.05�. Bearing
Target glint ±0.16� (1m The IMO Performance Standards allow for target glint Bearing at 10km) (scintillation) errors for a target of 200m in length of s
= 1m across the beam. Antenna ±0.05° Bearing backlash (rectangular
distribution) 10° pitch and roll
±0.22� As a ship rolls and/or pitches in heavy seas some additional errors are created. These are at a maximum
Bearing
on relative bearings of 045�, 135�, 225� and 315� and zero on relative bearings of 000�, 090�, 180� and 270�. For a 10° roll there will be a mean error of 0.22� with a 0.22� peak sine wave superimposed.
Quantisation ±0.1� (see above) Bearing (rectangular distribution)
Gyro-compass ±0.62� Calibration error of 0.5� with a normal distribution about this of s = 0.12°.
Bearing
Heading marker alignment
±1� The heading marker signal indicates the forward direction of the ship and then a target’s bearing is determined by the angle away from the heading. The heading mark is aligned with the ship’s centre-line but the IMO Performance Standards permit a maximum
Bearing
error of not greater that –1�. Total Bearing ±2.2� Error
9

2.4 DESIGN CONSIDERATIONS AFFECTING PERFORMANCE
The main factors that can affect the performance of a CMR at the design stage are the power of the transmitter, the length of the electro-magnetic pulses that it emits and the frequency by which it does so. These factors do not apply in isolation and the setting chosen to optimise one may have an adverse effect on and compromise another.
• Transmitter power - Transmitter power influences the radar’s range and how well it detects smaller targets. While it is true that increasing the power leads to a greater range, electro-magnetic waves generally travel along line of sight and therefore targets beyond the visual horizon will not be detected (however, some targets over the visual horizon may be detected as a result of wave refraction). The power also has an effect on radar accuracy insofar as the better a target is illuminated by radar the better it is for an automatic radar plotting aid (ARPA) to determine its shape and centre.
• Pulse length - The length of the electro-magnetic pulse affects the range of the radar and the discrimination between targets. Long pulse lengths have more energy than short pulse lengths and therefore can be used at a greater range. Unfortunately, the longer the pulse the worse the discrimination between targets is, especially when close. An example of this is where two vessels are located at close quarters; using a long pulse length the returning pulses can merge to give the impression of one target. So there is a compromise to be made between resolution of targets and maximum radar range.
• Pulse repetition frequency - PRF is the number of transmitted pulses per second. Changing the pulse length affects the PRF which becomes faster for short pulse lengths and slower for longer lengths. This is necessary because a longer pulse travels a greater distance and therefore requires a greater time to reach and be reflected back from the target before the next pulse is emitted. In general ,the larger the PRF the better the target is defined in angle as it is reflects more pulses giving it greater definition. A better defined target has a more accurate centre and therefore is better for an ARPA to determine bearing accuracy.
Changing a radar’s range setting automatically changes the pulse length and PRF to produce optimum conditions for the selected range:
Table 5 Typical PRF and pulse lengths for various range scales
Range scale (Nm) PRF Pulse length 0.25 2000 0.05 0.5 2000 0.05 0.75 2000 0.05 1.5 2000 0.05 3.0 1000 0.25 6.0 1000 0.25 12 1000 0.25 24 500 1.00 48 500 1.00
10

2.5 PHYSICAL CONDITIONS AFFECTING PERFORMANCE
2.5.1 Scanner Height The height of the radar scanner is a measure of the theoretical radar horizon as, in general, radar waves travel in straight lines when being transmitted from and reflected back to the scanner. Similarly, targets with a greater height ought to be detected before lower ones as they will become visible to the radar earlier. Table 6 highlights the distance of the visible horizon at various heights of eye and contrasts this with the maximum theoretical radar horizon. The differences are due to the slight refraction of radar waves as they pass through the atmosphere.
Siting radar scanners at the highest available point is generally sought after although there is still a balance to be struck to minimise target loss as they approach the scanner. The range at which close targets are ‘lost’ by a radar will depend on the vertical beam width coupled with scanner height. If the scanner is too high and the vertical beam width too narrow then a target will be ‘lost under the radar’ at a greater range than if the scanner was lower and the beam width was wider. Angling the scanner downwards can have effect on this but will also reduce the radar horizon range.
Table 6 Visible and theoretical radar horizons at different heights of eye
Height of eye (m) Visible horizon (Nm)
Theoretical radar horizon (Nm)
10 6.1 7.0 15 7.5 8.6 20 8.6 9.9 30 10.5 12.1 50 13.6 15.6 100 19.2 22.1
Although scanner height is a fair measure of a radar’s theoretical maximum range the further refraction of radar waves due to non-standard atmospheric conditions can occur and this has the effect of diminishing or extending detection ranges (see Section 2.6).
2.5.2 Blind and Shadow Sectors All radar, whether platform based or a conventional system fitted on an ERRV, are subject to ‘blind’ and ‘shadow’ sectors caused by intervening non-radar transparent obstructions. Such sectors may result from part of the structure upon which the radar antenna is located being in the way of the area swept by the radar beam, for example masts on the ERRV, legs of a jack-up, or cranes on a fixed installation or MODU, or may be caused by temporary obstructions such as another vessel or the installation itself. Partial obstruction of the pulses, either in the vertical or horizontal plane, results in a shadow sector wherein the radar suffers reduced detection ranges. Blind sectors occur where radar detection is totally obscured. The number and angular extent of these sectors is dependent on the relative locations of the scanner and any obstructions and possibly also the trim of the vessel.
Certain blind and shadow sector, primarily those caused by permanent parts of the structure, can be readily ascertained and steps taken to minimise their effects or at least to make allowance for them. The magnitude and direction of the temporary blind and shadow sectors is related to a number of factors such as the height of the radar antenna in relation to the temporary obstructions and also its proximity. Lower antennas tend to suffer the effects more, although not exclusively as they may be able to ‘see’ under the obstruction (in the case of a
11

jacket) and particularly in the case of FPSO and shuttle tankers, etc. which have the potential to create very large blind and shadow sectors in the right circumstances.
Furthermore, even though an ERRV may be moving, the blind or shadow sectors caused by a temporary obstruction may remain, albeit on a changing bearing, if the relative bearings between the ERRV, the temporary obstruction and the approaching vessel does not change.
The report reproduced in Appendix 3 explains and quantifies the causes and effects of blind and shadow sectors in more detail than is presented here.
2.5.3 Target Reflective Properties Each target has a number of properties that will have an effect on the echo returned from it:
• Material – Targets constructed of electrically conductive materials generate the best radar returns. Metals are better in this respect than wood whereas man-made materials such as fibreglass, polythene, nylon, etc., are the worst. In many cases man-made materials offer very poor radar reflections, if not being almost transparent. It is also likely that fibreglass coated with an anti-fouling coating will provide better radar returns than a wooden hull with the same coating.
• Size – Up to a point, the echo strength of smaller targets varies directly with their projected area. However, because the horizontal beam width is narrow targets easily fill it. Any further increase in vessel size has only a limited effect on displayed echo size. The vertical beam width is much wider to take into account of the dynamic effects of a vessel in a seaway and is composed of a number of lobes, the more of the lobes that are cut the better the radar return will be. In general this effect leads to better echo strength when the height of the scanner is increased.
• Shape – Different shapes have different ‘reflective indices’. In terms of radar reflective properties the ‘best’ shapes have smooth, vertical sides. In the illustrations below all the shapes have the same surface area:
Cube Cone Cylinder Sphere Reflective Index 1200 0 300 1
• Surface roughness – Radar energy, similar to light waves, suffer when reflected from a rough surface, i.e., the rougher the surface then the greater possibility that some reflection may not occur back to the source. However, because of their increased wavelength, greater surface roughness can be considered smooth for radar purposes.
• Aspect – Differing aspects of a target will affect how strongly a radar return is received. An ‘end on’ vessel will not present as good a return as a vessel that is ‘beam on’. This effect occurs because the surface area will be smaller with a vessel steering directly towards a radar and, more predominantly, because a vessel’s side presents more vertical area to reflect radar than does its bow or stern.
12
2.5.4 False or Spurious Echoes As well as there being a number of conditions that can lead to a degradation in overall radar performance, reduction of detection range and possibility that some targets may be lost altogether, there are some occasions when false or spurious targets will be displayed.
• Second trace returns – These are caused by the echo from one pulse being returned to the display after the next pulse has been transmitted, i.e., an echo returned from a target beyond the maximum theoretical range. A second trace return displayed not by its own trace but by the following one. As an example, if a PRF is 1000 the maximum theoretical range will be 81 miles whereas if a target is 90 miles away it will be displayed at a range of 9 miles. Second trace returns are particularly prevalent under super-refraction or radar ducting conditions. A change of PRF will indicate whether the return is true or a second trace, as it will endure even with a different PRF.
• Reflected echoes – If outgoing pulses are obstructed but then reflected in such a way as to reach a target before following the same path back to the radar, it is possible for them to be displayed at approximately the correct range but on the bearing of the obstruction instead of their correct bearing. If the obstruction is on board the ERRV it is often the case that reflected echoes appear to be in the blind or shadow sector. If the reflection occurs off another source; a cliff, a quay or an installation very close to an ERRV, it is likely that both the bearing and range of the indirect echo will be in error.
• Multiple echoes – This effect is particularly relevant on shipborne radars when the target is large, in close proximity and at the optimum (‘beam on’) aspect for returns. Radar energy is transmitted and is reflected back and forth between the target and ERRV. Echoes are displayed on the correct bearing but on multiples of the closest (correct) range. They become progressively weaker with increased range.
• Radar to radar interference – All CMR operate within a predefined frequency range and therefore it is possible that other radars in the vicinity may be operating on the same frequency. When transmitted pulses from the other set is picked up by the ERRV (rather than its own reflected returns) it can be displayed as ‘spoking’.
• Side lobes – Due to imperfections or inefficient scanner design it is possible for small lobes of energy to exist on each side of the main lobe. Especially with large targets at close range there may be sufficient energy within the side lobes for a return to be displayed. Such echoes will be at the correct range but wrong bearing.
2.6 METEOROLOGICAL CONDITIONS AFFECTING PERFORMANCE
Certain meteorological conditions can affect radar performance markedly and unexpectedly. Some effects, such as heavy rain in the vicinity or increased winds causing radar returns from the sea surface, are apparent from the radar display whereas other meteorological phenomena can lead to a degradation in radar performance without necessarily manifesting themselves to a radar observer. This latter category affects the propagation of radar waves through the atmosphere.
• Precipitation – Rain can cause a scattering of radar energy so that the pulse is weakened and the detection ranges of targets in and beyond the rain is reduced. In many instances the rain reflects sufficient energy back to radar and this is displayed as rain clutter. The effect of this is to further reduce target detection and definition within the rain area due to lack of contrast between the echo and background. Different types of precipitation, i.e., rain, hail,
13
sleet and snow, exhibit broadly similar characteristics on radar although clutter caused by rain tends to be worse because of the greater water content.
• Sea conditions – In any sea state other than smooth water radar returns are received from the water to be displayed as ‘sea clutter’. It usually occurs when there is a breaking sea state resulting in radar energy being reflected back to the vessel from the near vertical face of the wave. The effect of clutter can make it difficult to display small targets in the area due to lack of contrast between it and the background sea returns. Another implication of the sea condition is the effect it has on a vessel’s movement. To a greater or lesser extent as a vessel rolls and/or pitches in a seaway so the centre of the radar beam may alternately be directed towards the sea or above the horizon. Obviously, smaller vessels are likely to be more susceptible to sea induced movement than larger ones.
• Fog, Mist, Dust and Sand – Fog and mist do not generally produce echoes although detection ranges may be slightly reduced in dense fog. Although dust or sand laden atmospheres are not a common occurrence on the UKCS, they can lead to small reductions in detection ranges and occasionally sand storms can give rise to a speckled effect on the radar display.
• Propagation – Radar waves suffer refraction or bending in the atmosphere in a similar way to light waves, the amount of refraction depending on the prevailing atmospheric conditions. In standard conditions (pressure = 1013mb sea level – decreasing at 36mb/300m; temperature = 15�C sea level – lapse rate of 2�C/300m; relative humidity = 60% - constant) the radar wave is bent in such a way that the radar horizon can be approximately 15% further than the visible horizon for similar heights of eye/scanner for 3cm wavelength radars3. When atmospheric conditions are non-standard then anomalous propagation (anoprop) can occur; these are classed as either ‘sub-refraction’, ‘superrefraction’ or ‘ducting’. The extent to which these conditions occur is very variable and almost impossible to predict with accuracy.
• Sub-refraction – A shortening of the radar horizon caused by the radar wave being refracted in such a way that the energy lobe leaves the earth’s surface sooner than it would under normal atmospheric conditions. The effect of sub-refraction is a reduction in detection ranges. Conditions under which it can occur are an increase in the lapse rate or relative humidity increasing with height, for example cold air moving over a relatively warm sea surface.
• Super-refraction – An increase to the radar horizon from the radar wave being refracted so that the energy lobe is forced to follow the earth’s curvature further than it would under normal atmospheric conditions. Super-refraction increases radar detection ranges and occurs when the lapse rate is less than normal or the relative humidity decreases with height, such as in areas where warm air moves over a cooler sea surface.
• Radar ducting – It is possible at some height that the temperature ceases to fall and begins to rise with increased altitude. Up to this point, known as the inversion level, a duct occurs and radar pulses are trapped and can travel large distances over the earth’s surface leading to ‘second trace returns’ (see Section 2.5.3).
2.7 SUMMARY AND DISCUSSION
Civil marine radar is invaluable in providing early warning collision risk and monitoring of the sea area around itself, be it on a vessel or on an installation and it is difficult to see it being
3 Norie’s Nautical Tables, JW Norie, ISBN 0852881606 – Radar Range Table.
14

replaced in the medium term with alternative technologies. Indeed, it is more likely that radar will be supplemented by other emerging technologies rather than being superseded by them.
Throughout its existence CMR has been continually improved in terms of performance, reliability and the uses/ease to which it can be put to the extent that much of the responsibility for ensuring proper tuning and the plotting of targets to determine collision risk has largely been taken out of the radar observer’s hands. However, with almost all shipborne radar the need for a well trained and diligent watchkeeper endures to this day to understand and minimise the potential dangers that may stem from some of the limitations described above.
In respect of CMR on the UKCS the scope has expanded in the last 10 years through the development of platform based systems, so called ‘hybrid radar’ either as an integral part of a wider emergency response system or as a supplement to a conventional ERRV based system for collision risk warning and management. There are a number of pros and cons to each system and these are discussed further in Section 5.
15

16

3 AUTOMATIC IDENTIFICATION SYSTEMS (AIS)
3.1 OVERVIEW
The Automatic Identification System (AIS) is a relatively new technology that, in theory, provides the potential to increase maritime safety by providing a means for ships to exchange information on their identity, position, course, speed and other data with other nearby ships and shore stations. The situational awareness of officers of the watch on board vessels fitted with the equipment should be increased as a result.
AIS is a standardised shipboard broadcast transponder system through which users continually transmit and receive information. The system uses a common VHF radio channel for spontaneous and masterless communication. This permits a large number of transmitters to send data bursts over a single narrowband radio channel by synchronising their data transmissions to a very precise timing standard. The data exchange is totally automatic and transparent to the users.
AIS is designed to operate in one of the following modes:
• In a ship-to-ship mode for collision avoidance.
• As a means for coastal states to obtain information about a ship and its cargo.
• As a traffic management tool when integrated with a Vessel Traffic System (VTS) or hybrid radar system of the type used on some offshore installation on the UKCS.
The International Telecommunication Union (ITU) have developed the “Technical Characteristics for a Universal Shipborne Automatic Identification System Using Time Division Multiple Access in the Maritime Mobile Band” in their ITU-R Recommendation M.1371-1. This document defines in detail how AIS and STDMA technology works. The original standard, adopted by the International Telecommunications Union (ITU) in 1998, was revised in 2001 to clarify design requirements.
In respect of fixed offshore oil and gas installations and mobile drilling units while on station the ITU document does not recommend mandatory fitment of AIS equipment but, where it is carried, it should act as ‘base station’. In this context it is important to note that when mobile units are in transit they are covered by the requirements of SOLAS Chapter V just as any other ship would be and therefore should be fitted with an operational shipboard AIS. When MODU reach their station they should cease AIS transmissions and may become as base station.
Having mentioned the voluntary nature of AIS equipment on fixed and MODU while on station there are potential benefits to having the equipment. These are discussed in more detail in the following sub-sections.
In areas under UK jurisdiction the Maritime and Coastguard Agency (MCA) Technical Services Branch is the lead agency for AIS and to whom operators of fixed and MODU should refer when considering whether to install base station equipment as there may be implications for the broader network. Some constraints on the network may mean that the MCA may decide that making a particular offshore installation into an AIS base station would not be appropriate. In Norway, for example, some offshore installations are being fitted as AIS base stations and integrated into their national network.
17

3.2 USE OF AIS
3.2.1 Ship-to-Ship Data Exchange The primary operating mode for AIS is autonomous ship-to-ship reporting whereby each ship transmits its data to all other AIS-equipped ships within VHF range. The unique communications scheme permits these data transmissions to take place independently without the need for a master control station.
Position and other data are usually fed automatically from the ship’s sensors into the AIS system where it is formatted and transmitted in a short data burst on a dedicated VHF channel. When received on other ships the data are decoded and displayed in graphical and text format. It is also possible for AIS data to be fed to an integrated navigation system or ARPA to provide AIS “tags” for radar targets. AIS data can also be logged to the a Voyage Data Recorder (VDR) for playback and future analysis.
Updated AIS messages are transmitted automatically without any action required by the watch officer on either ship. The frequency between transmissions varies between every few seconds and every few minutes depending on the vessel’s status. This is detailed in Section 3.4.
3.2.2 Coastal Surveillance In coastal waters the authorities may establish automated AIS stations to monitor the movement of vessels through an area. These stations may simply monitor AIS transmissions from passing ships or may actively poll vessels via the AIS channels, requesting data such as identification, destination, ETA, type of cargo and other information. Coast stations can also use the AIS channels for shore-to-ship transmissions, to send information on tides, Notices to Mariners and local weather forecasts. Multiple AIS coast stations and repeaters may be tied together into Wide Area Networks (WAN) for extended coverage.
Coastal nations may use AIS to monitor the movement of hazardous cargoes and control commercial fishing operations in their territorial waters. AIS data can be logged automatically for playback in investigating an accident, oil spill or other event. AIS can also be a useful tool in search and rescue (SAR) operations, allowing SAR co-ordinators to monitor the movements of all surface ships, aircraft and helicopters involved in the rescue effort.
3.2.3 Vessel Traffic Systems When integrated with a shore-based vessel traffic system (VTS), AIS can facilitate monitoring and controlling the movement of vessels through restricted harbours and waterways. AIS can augment traditional radar-based VTS installations and provide an AIS “overlay” on the radar picture. It can also provide a cost-effective alternative in areas where it is not feasible to establish radar-based systems, possibly on those offshore oil and gas installations that are not covered by a hybrid radar system. When integrated with radar the AIS can ensure continuous coverage, even when the radar picture is degraded by heavy precipitation or other interference.
The VTS control can assume control over the assignment of timeslots for AIS messages to ensure optimum data exchange within the coverage area. Dedicated channels may be designated for local-area AIS operations and shipboard AIS equipment has the ability to shift to different channels automatically when directed by a VTS controller.
18

3.2.4 Potential Benefits of AIS to the Offshore Industry For ERRV watchkeepers
• Improved situational awareness
• Unambiguous identification of radar targets
• Overcomes problem of “target swapping” when two contacts pass close together on the radar screen
• Ability to “see” behind an intervening structure to detect and identify other ships
• Detect a change in another ship’s heading almost in real time without waiting for ARPA calculations
• Detect vessels that might otherwise be hidden in another vessel’s or installation’s radar shadow
• Real time information about other ship’s movements (e.g., accelerating or decelerating, rate of turn)
For installations
• Automatic identification of radar targets
• Constant coverage even when radar picture is degraded by weather and interference
• Automatic logging of all data
3.3 AIS COMMUNICATIONS SCHEME
AIS messages are updated and retransmitted periodically to maintain the contemporaneous and usefulness of the data. To achieve this, AIS utilises a self-organising time-division multiple access (STDMA) data communications scheme. This uses the precise timing data in the global positing system (GPS) signals to synchronise multiple data transmissions from many users on a single narrowband channel.
Each AIS unit broadcasts its messages and receives messages from all other units within VHF radio range. The area in which AIS messages can be received is called the unit’s “cell” with the unit at the centre of its own communication cell.
The practical size of the cell can be varied according to the traffic density on the AIS channel. If the number of AIS messages begins to overload the network, a unit’s system can automatically shrink its cell by ignoring weaker stations further away in favour of those nearby.
Under the STDMA protocol each minute of time is divided into 2250 timeslots. An AIS report fits into one or several of these 2250 timeslots, which are selected automatically based on data link traffic and projections of future actions by other stations currently on the network. When a unit first enters the cell of another unit, it takes an unoccupied timeslot. All AIS stations continually synchronise their slot selections with each other.
Timeslots and timeout periods are selected on a randomised basis. When a station changes its slot assignment, it announces to all other stations on the channel its new location and timeout for that location. Each station continually updates its internal “slot map” to reflect changes in occupied slots and timeouts. Special provisions are made for automatic conflict resolution in the event two stations end up in the same timeslot to ensure that stations always choose unoccupied slots. In situations of high traffic density it may be necessary to reduce the number
19

of ships in a communication cell, as described above. This enables time slots used by weak stations far away, to be used also by a station nearby. The AIS system applies very specific rules on how this reoccupation of timeslots is done.
The key to the STDMA scheme is the availability of a highly accurate standard time reference, to which all of the stations can synchronise their timeslot assignments, in order to avoid overlap. This time reference is supplied by the precise timing signal in the GPS satellite message. Thus, GPS plays a critical role in AIS, providing the universal time reference as well as positioning data for each unit.
AIS data transmissions utilise a 9.6 kbps FM/GMSK (Gaussian Minimum Shift Keying) modulation technique, as specified in ITU Recommendation M.1371.1. The International Telecommunications Union (ITU) has designated two dedicated frequencies for AIS; 161.975 MHz (marine band channel 87B) and 162.025 MHz (channel 88B).
An AIS station has two independent VHF receivers that are normally tuned to the two AIS frequencies, as well as one transmitter, which alternates its transmissions back and forth between the two. The shipborne system can also be retuned to other frequencies, for instance when operating under the control of a shore-based VTS. This can be done either manually or remotely by the AIS shore station.
3.4 AIS MESSAGES
AIS is designed to work autonomously and continuously in a ship-to-ship mode but the specifications provide for switchover to an “assigned mode” for operation in an area subject to a competent authority responsible for traffic monitoring. In the latter case the data transmission intervals and timeslots are set remotely by the coastal authority. Alternatively, the AIS can work in a “polling mode” in which the data transfer occurs in response to interrogation from another ship or shore station.
Ship generated information provided by the AIS falls into several categories termed ‘static’ (details of the ship), ‘dynamic’ (ship’s position, course/speed, etc.) and ‘voyage related’. Safety and other messages can also be transmitted/received.
Static data Dynamic data Voyage related data IMO number (where available) Ship’s position with accuracy Destination and ETA (at
indication and integrity status Master’s discretion) Call sign and name Time in UTC Hazardous cargo (type) Length and beam Course over ground Ship’s draft Type of ship Speed over ground Location of position-fixing Navigational status (e.g., “at antenna on the ship (aft of bow anchor,” “not under command,” and port or starboard of centre- manually entered) line)
Heading Rate of turn (where available)
Static information is programmed into the unit at commissioning whereas most dynamic information is derived from interfaces with a GPS and other sensors. Some navigational status
20

and voyage-related data is entered manually by the Master through a password-protected routine and safety messages can be inserted at any time by the ship or shore station.
The static and voyage-related data are transmitted every six minutes, when amended or on request (for instance, when interrogated by a Vessel Traffic System operator). Safety messages are sent as needed. The update rates for dynamic information will depend on the ship’s status and speed, according to the following schedule:
Speed/Status Information update rate At anchor 3 minutes 0-14 knots 10 seconds 0-14 knots and changing course 3 1/3 seconds 14-23 knots 6 seconds 14-23 knots and changing course 2 seconds 23+ knots 2 seconds 23+ knots and changing course 2 seconds
The AIS specifications also allow for insertion of brief binary messages from ship or shore stations. Such messages might include notices to mariners, navigational warnings, tides and currents, weather forecasts, SAR communications and ship-specific instructions from a VTS operator. The AIS standard also includes formats for transmission of differential GPS error correction data. This can provide valuable redundancy to existing beacon DGPS systems in critical navigation areas.
3.5 AIS SHIPBOARD EQUIPMENT
IMO Resolution MSC.74(69), Annex 3 states that an approved shipboard AIS system shall be able to perform the following functions:
• Automatically provide information on the ship’s identity, type, position, course, speed, navigational status and other safety-related matters to appropriately equipped shore stations, other ships and aircraft.
• Receive automatically such information from similarly fitted ships.
• Monitor and track ships.
• Exchange data with shore-based facilities.
A shipboard AIS system consists of the following elements:
• An STDMA radio transponder with two VHF receivers and one transmitter (it is also possible that the transponder has a Digital Selective Calling (DSC) receiver tuned to Channel 70).
• A control and display unit, which includes the communications processor and interfaces for taking inputs from the ship’s navigation sensors and sending outputs to external systems, such as ECDIS, ARPA, VDR or Inmarsat terminal.
• One or more GPS/DGPS receivers that provide position information as well as the precise time base needed to synchronise the STDMA data transmissions.
A ship’s position and precise timing data are derived from the GPS receiver, augmented by differential corrections when available. Other data is fed into the AIS from shipboard sensors, such as gyrocompass and speed log. Static and voyage-related data are operator-entered through
21

a keyboard. The AIS communications processor organises the data for transmission and handles all STDMA communications functions. The shipboard transponder system receives AIS reports from other ships and shore stations and displays the AIS data for each target in text or graphic format. AIS data is output for display on an external device such as ECDIS, ARPA or remote PC.
3.6 AIS BASE STATION EQUIPMENT
The main function of an AIS base station is to receive, monitor and record AIS traffic within the VHF coverage area of that unit and to send this information to the AIS Operator Station (AOS). A fixed base station can also monitor other AIS base stations and forward AIS data and status messages to the AOS; they can be remotely operated from the AOS via a local area network (LAN) or other dedicated line enabling minimum maintenance.
An AIS base station can be used for transmitting AIS text messages to AIS transponders on individual vessels or as broadcast messages to all vessels within the VHF coverage area and to transmit Differential Global Navigation Satellite Service (DGNSS) corrections generated from an internal reference station or those from an external third party DGNSS service provider.
However, because of the potentially far reaching consequences for the managed AIS network it is unlikely that Duty Holders will be able to unilaterally make the decision for their installations to act as a base station. Overall responsibility for the operation of the AIS network on the UKCS rests with the MCA and it is to them that Duty Holders should approach prior to fitting AIS equipment.
3.7 SHIPBOARD CARRIAGE REQUIREMENTS
The IMO has established mandatory carriage requirements for approved AIS equipment under the Safety of Life at Sea (SOLAS) Convention Chapter V. The AIS carriage requirements apply to:
• All ships of 300 gross tonnage and upwards engaged on international voyages
• Cargo ships of 500 gross tonnage and upwards not engaged on international voyages
• All passenger ships irrespective of size
When the timetable for implementation was originally agreed at the IMO it made allowance for mandatory installation of AIS equipment on vessels over 300 gross tons by 1 July 2007, with other vessel sizes and types having earlier deadlines. With AIS being seen as a tool for monitoring and increasing coastal state security as well as an enhancement to safety, the timetable was revisited at the International Conference on Maritime Security (December 9 and 10, 2002) at the IMO. The Conference moved forward the deadline for fitting of AIS on ships engaged in international voyages so that all such ships over 300 tons that are not required to fit AIS at an earlier date, will have to fit AIS at the first safety equipment survey after 1 July 2004, but in any case not later than 31 December 2004. The deadline for ships not engaged in international voyages remains at 1 July 2008, but national authorities can move this date forward in their own waters, as has happened in the United States of America.
22
3.8 AIS STANDARDS
There are three primary international standards for AIS equipment. They were developed jointly by the International Maritime Organisation (IMO), International Telecommunications Union (ITU) and International Electrotechnical Commission (IEC). Shipboard AIS equipment must meet the provisions of all three bodies.
IMO Resolution MSC.74(69), Annex 3, “Recommendations on Performance Standards for a Universal Shipborne Automatic Identification System (AIS)”. This document establishes carriage requirements for AIS and performance requirements for the shipboard equipment. The IMO standard was used by the ITU and IEC in developing technical and test standards. It was approved by the IMO Subcommittee on Safety of Navigation at its 45th session in late 2000.
ITU-R Recommendation M.1371-1.
IEC Standard 61993-2, “Universal Shipborne Automatic Identification System (AIS)”. This standard specifies the minimum operational and performance requirements, methods of testing and required test results conforming to the performance standards contained in IMO Resolution MSC.74(69), Annex 3. It incorporates the technical characteristics contained in ITU-R M.1371-1 and takes into account the ITU Radio Regulations where appropriate.
3.9 IMPLEMENTATION AND USE OF AIS IN THE UK
In the UK the Maritime and Coastguard Agency (MCA) has issued several Merchant Shipping Notices and Marine Guidance Notes concerning the use and implementation of AIS. Appendix 2 contains:
• MSN 1780 (M) - Revised Carriage Requirements For Automatic Identification Systems (AIS), March 2004.
• MGN 277 (M+F) - Operational Guidance for Automatic Identification Systems (AIS) on Board Ship, September 2004.
• MIN 199 (M+F) - Automatic Identification System (AIS) – Use by Small-Craft, December 2004.
3.10 SUMMARY AND DISCUSSION
3.10.1 AIS as an Enhancement to Marine Radar? Since first being used on commercial vessels radar has become increasingly digital in recent years. The original analogue radar that displayed an overview of radar targets around a vessel still remains but over the years it has been enhanced with more and more digital information. With the introduction of ARPA to calculate the relative course and speed of a radar target and display them as a vector came the ability to predict the closest point of approach (CPA) and the time of the closest point of approach (TCPA). When GPS was connected to radar the traffic situation in absolute rather than relative terms could be displayed by calculating a target’s true course over ground (COG) and speed over ground (SOG). More recently, the introduction of digital charts made it possible for the echoes of fixed features to be enhanced by overlaying them with an electronic chart.
23
3.10.2 Integrating AIS with Radar In its simplest form AIS is a unit fitted to comply with regulation, essentially out of sight and out of mind. While most manufacturers provide a ‘basic’ unit to address this need some also produce more sophisticated equipment that can be connected to a radar, or electronic chart, or both. By doing so, an AIS transponder takes radar another step to becoming pure digital.
Instead of having to derive a target’s COG and SOG from own ship’s GPS data and then the range and bearing to a target by radar, a target sends its own GPS information. This can be done even when the target is obscured from own ship by an intervening obstruction, such as an offshore installation.
There are five major areas where AIS enhances detection:
• Identifying Targets Beyond a Radar Obstruction - It was reported that during trials4 of AIS equipment on board two cruise vessels (“Regal Princess” and “Sea Princess”) near Juneau, Alaska in 2000 the vessels were 6.3 nautical miles apart yet separated by a 750m tall island (Douglas Island). The vessels became aware of each other through their AIS transmissions and the OOW was able to anticipate a traffic situation earlier.
• Translating Targets to Names - AIS allows radar (and ECDIS) manufacturers to label a target with an abbreviated name or show its full name when it is selected.
• Prediction of Target Track - By taking into account a vessel’s rate of turn (ROT), as transmitted by AIS, the OOW’s ability to anticipate a traffic situation more accurately is increased.
• Extend Detection Range - The extended range and target identification that AIS provides allows the OOW to identify other ships that may pass close a point, such as an installation, even when at a considerable distance away. From a range of up to 40 nautical miles it will be possible to predict a vessel’s track. Continuous updates to position and course/speed will enable recalculations of the track and early decisions on the likelihood of intervention to be made. Such action may be initiated through a VHF radio or, if the other ship is still beyond VHF range, via an AIS instant message.
• Clarification of a Target’s Intentions - Scrutiny of AIS information can provide not only a target’s destination but also it’s intended route. It is possible to temporarily display the route to facilitate the anticipation of a target’s intentions. Other AIS information, such as a vessel’s limited manoeuvring capabilities, can also be transmitted.
Although using an AIS input to a radar may lead to the benefits described above, there are several limitations that could cause uncertainties in the displayed information:
• Accuracy of AIS Positions - If an AIS target is no longer sending position updates its icon on a radar display will be crossed-off with a flashing line. However, if a target sends out erroneous AIS position updates because of a GPS problem the other users can only find this out by comparing AIS and radar positions (assuming it is clear which radar and AIS icons are associated with each other).
• Target Icon Consolidation - If a nearby vessel has both an AIS and a radar icon on the screen and the two do not overlap then the radar or ECDIS software will try to decide whether the two separate icons should be replaced with a single consolidated icon and where to place that icon on the screen. The software bases this decision on a comparison of
www.uais.org/DisplayIssues.htm - Fred W. Pot, Marine Management Consulting, Seattle, USA.
24
4

each icon’s range, bearing, relative course and relative speed. If this test is passed then the target’s radar icon is dropped from the screen.
• Predicting TCPA Based on ROT - Although there are benefits to making predictions for CPA and TCPA taking into account an approaching vessel’s ROT, the algorithms necessary to resolve the data are not readily available. Until an appropriate algorithm has been developed, once per second re-calculation of ROT-corrected TCPA of all selected AIS targets will remain impractical.
3.10.3 Limitations of AIS Perhaps because of its recent development it is felt there are a number of potential limitations to the use of AIS. It is fair to say that these tend to be connected with both the man/machine interface as well as with technology itself and may culminate with the possibility of OOWs becoming over reliant on the outputs:
• AIS is a 'cooperative' system needing proper installation, maintenance and operation whereas radar is 'non-cooperative', i.e., it does not require actions or activities on another vessel to enable detection to take place.
• AIS does not enable the integrity of the information provided by the transmitting vessel to be verified by the recipient. AIS plots are based on 'real time' information derived from sensors of the transmitting vessel whereas radar plots are based on historical information with verifiable accuracy.
• AIS equipment failure on a transmitting vessel could prevent display of the information on the recipient vessel.
• Not all vessels are, or will be, required to be fitted with AIS and so will not be 'visible' to the system.
• There is the potential for a mis-match between the AIS and radar information if the latter is being operated in ‘sea stabilised’ relative motion; a display and operating mode still favoured by a large number of mariners.
• The accuracy of the AIS output information is dependent on the accuracy of the underlying sub-systems such as GPS and VHF. Sensor incompatibility can also result in AIS data being inaccurate and VHF interference or other radio frequency interference can attenuate AIS signals.
• Manually input data, some permanently stored and other periodically updated by ship’s personnel, can provide erroneous information through errors either while being manually input or by the failure to update voyage information as necessary. Port and cargo information is likely to suffer from a high error rate, for example.
• Vessels that are disabled or not under command may not transmit a signal and debris or other floating objects would be invisible to the AIS.
• Existing AIS systems have a finite number of time slots, and hence the number of messages that can be handled simultaneously, and in busy areas it may be necessary to selectively curtail certain messages.
• From monitoring early usage of the AIS around the UK it has become apparent that there is some indication that a significant proportion of targets either transmit no AIS signature or do so with incorrect and/or missing data. Furthermore, there appears to be differences in the quality of reception by AIS units based on their manufacturer. The extent to which these issues continue into the future will obviously be studied further in the coming years.
25
3.10.4 Conclusion Overall, AIS is a relatively new and emerging technology though one that will probably enhance maritime safety in a tangible and increasing way in the near future. Though recently mandatory it is very likely that further development will be required for all the potential benefits outlined above to become readily available.
During the introduction and early operational phases it is important that users are conversant with some of AIS’s potential shortcomings to minimise the possibility of ‘AIS assisted collisions’. As was the case during the introduction of CMR, unfamiliarity with the equipment and inexperience of interpreting the outputs led to a number of incidents that, in the absence of the equipment, may well not have occurred. It is to be hoped that the introduction of AIS will not suffer the same fate.
Nonetheless, connecting AIS to radar holds the potential to significantly improve an OOW’s ability to anticipate and avoid potential collisions. In terms of ERRV on the UKCS there will be undoubtedly be benefits from the introduction of AIS; anticipation will be improved primarily by AIS’ extended range, its capability to see beyond an obstruction and by improving target’s path predictions. Early warning of possible encroachment of safety zones and improvements to intervention strategies will be possible by being clearly able to identify targets for communication purposes via VHF or via instant messaging.
26
4 HYBRID RADAR SYSTEMS
The systems provide a PC-based display for radar and ARPA that can be an integral part of a PC-based bridge and provide a networked display and control capability. It comprises a radar interface unit, scan converter card and management processor that can be distributed to multiple displays via a network server and control and operation of the radar and ARPA is available at each display.
To gain an insight into the background, use, benefits and limitations of a hybrid system we undertook a series of visits and discussions with:
• SML Technologies Ltd. (Dave Cheadle), Burridge, Hampshire on 8 July 2003 – equipment manufacturer.
• ConocoPhillips (Fiona Wong), Aberdeen on 12 November 2003 – Duty Holder user.
• “Putford Trader” (Master), Lowestoft on 23 February 2004 – ERRV fitted with equipment.
The results of our meetings are presented in the form of a case study.
PURPOSE This system was introduced to the LOGGS field in 1997 to facilitate ERRV sharing and as a means of improving the time to detect personnel in the water. This enabled an ERRV to be located further from a manned installation or elsewhere in the field and still meet the rescue and recovery performance standards.
SCOPE The system comprises several elements.
The main systems are located on LOGGS and Murdoch and track/record the movement of all vessels within a 25 nautical miles radius of the installations. Radar track data is transmitted via a network to screens on the installation, ERRV and DC. The information displayed on these screens is superimposed on to electronic charts to give a composite view of all marine activities. On receipt of a signal from an activated personal locator beacon (PLB), information on course to steer, estimated arrival time, man overboard drift and estimated pick-up point are displayed. The system is also used for collision warning purposes, tracking all vessels within radar range. Course, speed, CPA and time to CPA of a vessel are displayed on the screen.
Transponder units are located on each platform to provide a signal to the ERRV for activities being carried out on, or within 500m of these installations. A system is provided on each of the ERRV on long term contract to ConocoPhillips in the SNS. It raises an audible alarm in the installation control room and transmits the signal to the main system and the ERRV. These units are generally permanently fitted on the installation. However, portable transponders are available should the fixed unit fail but in such circumstances operating restrictions during helicopter operations apply.
A homing direction finder (DF) is located on each DC. This listens for the PLB alarm signal and, should one be received, the DF unit locks onto and homes in on the activated PLB or strongest signal with multiple alarms. The DC can then be directed alongside for recovery.
27
Personnel are issued with PLBs in situations where it is conceivable that they may require rescue from the water such as during NUl operations, following a helicopter ditching and over-the-side work. PLB alarm test modules are fitted at the heliport and main complexes to test PLBs prior to issue.
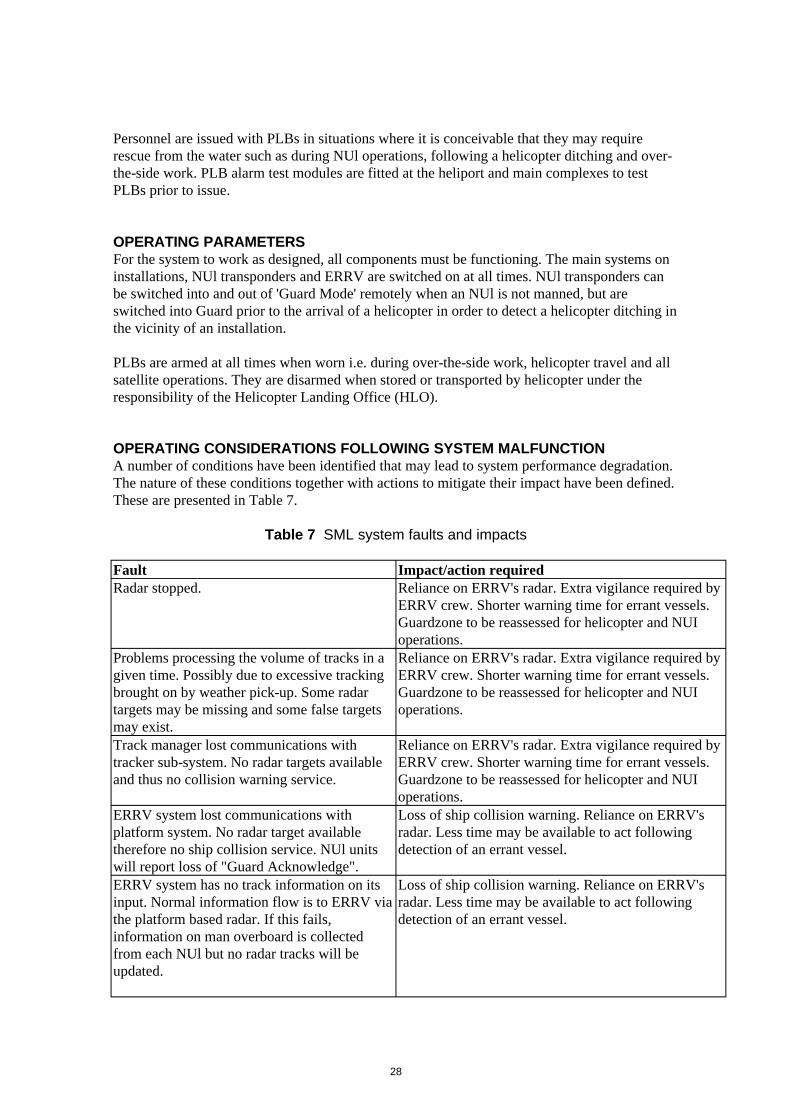
OPERATING PARAMETERS For the system to work as designed, all components must be functioning. The main systems on installations, NUl transponders and ERRV are switched on at all times. NUl transponders can be switched into and out of 'Guard Mode' remotely when an NUl is not manned, but are switched into Guard prior to the arrival of a helicopter in order to detect a helicopter ditching in the vicinity of an installation.
PLBs are armed at all times when worn i.e. during over-the-side work, helicopter travel and all satellite operations. They are disarmed when stored or transported by helicopter under the responsibility of the Helicopter Landing Office (HLO).
OPERATING CONSIDERATIONS FOLLOWING SYSTEM MALFUNCTION A number of conditions have been identified that may lead to system performance degradation. The nature of these conditions together with actions to mitigate their impact have been defined. These are presented in Table 7.
Table 7 SML system faults and impacts
Fault Impact/action required Radar stopped. Reliance on ERRV's radar. Extra vigilance required by
ERRV crew. Shorter warning time for errant vessels. Guardzone to be reassessed for helicopter and NUI operations.
Problems processing the volume of tracks in a Reliance on ERRV's radar. Extra vigilance required by given time. Possibly due to excessive tracking ERRV crew. Shorter warning time for errant vessels. brought on by weather pick-up. Some radar Guardzone to be reassessed for helicopter and NUI targets may be missing and some false targets operations. may exist. Track manager lost communications with Reliance on ERRV's radar. Extra vigilance required by tracker sub-system. No radar targets available ERRV crew. Shorter warning time for errant vessels. and thus no collision warning service. Guardzone to be reassessed for helicopter and NUI
operations. ERRV system lost communications with Loss of ship collision warning. Reliance on ERRV's platform system. No radar target available radar. Less time may be available to act following therefore no ship collision service. NUl units detection of an errant vessel. will report loss of "Guard Acknowledge". ERRV system has no track information on its Loss of ship collision warning. Reliance on ERRV's input. Normal information flow is to ERRV via radar. Less time may be available to act following the platform based radar. If this fails, detection of an errant vessel. information on man overboard is collected from each NUl but no radar tracks will be updated.
28

Fault Impact/action required Radar tracks not being updated. Loss of Loss of ship collision warning. Reliance on ERRV's collision warning service. radar. Less time may be available to act following
detection of an errant vessel. Platform based man overboard units Guardzone to be reassessed for helicopter and NUI
operations. Personal locator beacons Replace PLB. ERRV main computer inoperative Information may be available from manned complexes.
Guardzone to be reassessed for helicopter and NUI operations.
ERRV direction finding system inoperative Guardzone to be reassessed for helicopter and NUl operations. Information may be available from manned complexes.
DC display inoperative Guardzone to be reassessed for helicopter and NUl operations. DC directions to be taken from ERRV.
DC direction finding system inoperative Guardzone to be reassessed for helicopter and NUl operations. DC directions to be taken from ERRV.
SYSTEM MAINTENANCE A maintenance contract with the equipment manufacturer is in place to ensure the reliability and availability of the system and its components. There is the facility for remote interrogation of the system to determine its status and this carried out weekly by the manufacturer and a report made to the Duty Holder. Faults are rectified as soon as practicable and operating restrictions put in place until the system is functioning correctly.
Faults on the ERRV and DC are reported and arrangements made for their repair by the manufacturer when the vessel is in port. In the meantime operating restrictions are put in place
TRAINING All persons using the equipment are suitably trained. This includes personnel with access to screens on the installations, persons who may have cause to make adjustments to the platform based equipment and persons using the equipment on vessels.
RELIEF VESSELS If a relief vessel is deployed without the equipment it may have to operate with a reduced guardzone and may not be able to detect errant vessels as effectively.
MOBILE INSTALLATIONS Any mobile unit in the SNS area are also fitted with a transponder to allow the system to work at optimum efficiency. The co-ordinates of drilling rigs and other mobile units employed by the Duty Holder in areas covered by the system are entered once it is on location to enable early warning of potentially errant vessels.
AIS It is expected that AIS will be integrated into the system as it becomes a more mature technology.
LIMITATIONS A number of system limitations were highlighted during our discussions, primarily concerning the ability of the ERRV to fully utilise the system’s benefits when working cargo and in close
29
proximity to installations. As expected, their ability to warn off errant vessels was somewhat impaired when backed-up and transferring cargo to/from an installation.
Ergonomically it is important that equipment for such radar systems is appropriately sited on an ERRV’s bridge. In many cases bulkhead and shelf space is at a premium and, particularly with retrofit equipment, all the best vantage points have already been allocated to other pieces of equipment. The changing nature of maritime regulations ensures equipment is fitted piecemeal over the years with speed and ease of installation being the prime mover in siting decisions rather than positioning so that operator performance is enhanced rather than diminished. The introduction of more purpose built ERRV on to the UKCS may mean this becomes less of an issue in the future; provided the vessel owners have foreseen the possibility of this equipment and specified the need for at least cable trunking if system is not to be fitted during construction.
A further limitation to this approach to changing regulations and circumstances is the possibility for recently fitted equipment to interfere with other systems around it. In some respects this is a symptom of the ad hoc approach described above but it can, at best, negate some of the usefulness of new equipment and at worst render it unusable. A case in point is with powerful satellite communications equipment that interferes with other equipment when transmitting.
30

5 DISCUSSION
During the conduct of this work a number of points became apparent. Below is a list of topics felt worthy of note; some make comparisons between issues to do with the performance of different radar systems whereas others comment on how new technology may be used in the future and the possibility of amending operating procedures to minimise the risk of ship/platform collision.
• Shipborne radar developed around the concept of providing a positional overview around the vessel carrying the radar and IMO performance standards still refer to this. Providing collision risk warning for installations on the UKCS based on ERRV radar somewhat extends this premise beyond the current performance standards. The extent to which the ERRV can provide warning of potential collision for a third party through observations of its own radar is not entirely clear although it is likely to be less accurate than if the installation was fitted with a similar radar itself and was keeping its own watch. The majority of CMR permit a guardzone to only be defined around own ship but not around a third party. This limitation will prevent the sounding of an alarm as a vessel approaches an installation and will require vigilance on the part of ERRV watchkeepers to determine whether risk of collision exists. Where multiple installations are guarded the level of watchkeeping required is compounded.
• With a slight enhancement due to atmospheric refraction the radar horizon is approximately proportional to the height of the scanner. It follows, therefore, that scanners sited at a greater height above sea level, such as is possible when they are placed on an installation, will be able to detect approaching targets at a greater range than if the scanner was placed at a lower height, such as on an ERRV. This hypothesis assumes at other conditions such as the size, shape and material of the target lend themselves to detection at such ranges.
• As well as being able to maximise the height of eye, platform based radar can also be sited to minimise the occurrence of blind and/or shadow sectors caused by intervening obstructions. This consideration is important not just on the installation where the radar is fitted but, where there are multiple installations in a field, it can be sited on the optimum installation to minimise radar obstructions.
• In a sense, the positions recorded by an automated system can self-validate insofar as the previous position confirms the current one and this itself is confirmed by the next one. However, while this is true in theory the results of the data comparison carried out in Appendix 1 indicate that some degree of such validation was occurring for targets that would subsequently be ‘lost’ a short time later. To minimise the tracking of spurious targets it is important to ensure there are no errors in the algorithms for removing false targets.
• Despite their best intentions and a high degree of vigilance, ERRV crews have a number of other duties to attend to while on bridge watch and this may mean that the movements of approaching vessels are not fully recorded. The primary activity of ERRV crews is one of safety:
� to minimise the threat to offshore oil and gas installations from approaching vessels,
� to provide close support during periods of overside working. � to offer a place of safety should evacuation/escape from the installation be needed.
• Assuming continuous radar observations are being kept on an ERRV it is possible for a watchkeeper to monitor a developing situation and the movement of the vessels involved as well as be aware of operational factors on the threatened installation. This overview
31

position, supplemented by other background information as appropriate, will assist the decision making process and lead to quicker and better informed initiation of intervention strategies. On a purely automated system the radar alarm would need to be activated, personnel summoned and contact with the errant vessel attempted all before the seriousness of the incident could be assessed and possibly escalated. However, with the best will in the world it is extremely unlikely that ERRV watchkeepers will be able to devote their entire attention to radar monitoring duties. At best it is more likely that an ERRV’s radar will be inspected no more frequently than every few minutes, at least until an approaching collision risk becomes apparent. At worst, and depending on what activities the ERRV is carrying out, the radar could go unobserved for quite considerable periods. Cargo transfer operations are possibly the most onerous in terms of degrading the radar watch because they may require the bridge watchkeeper to work away from the radar. At the same time radar detection is likely to be impaired by the ERRV’s close proximity to an installation leading to increased or modified blind/shadow sectors (refer also to the report included as Appendix 3). When an ERRV is working cargo, or during any other activity where the visual or radar watch for approaching vessels is likely to be impaired, it is imperative that consideration is given to supplementing the bridge watch with additional properly trained and competent watchkeepers. Such consideration is likely to involve assessing the risks inherent in an ERRV carrying out additional duties over and above their primary safety related function and may well lead to having two certificated deck officers continuously present on the bridge.
• It is suggested that a manned radar watch will be less likely to lead to false alarms because in many cases a visual lookout can confirm whether a threatening target is a bona fide vessel and, if it is, what the nature of the nature of the threat may be. For instance, a fishing vessel that has been working in the area for several hours and has already been in contact with the ERRV to discuss intentions, may temporarily breach a radar’s guard zone (not the 500m safety zone) without it necessarily triggering an alarm. Conversely, in an automated system the facility to downgrade a threat because of ‘background’ information is more difficult to achieve with any degree of safeguards – a guard zone breached is a guard zone breached and results in an alarm. Thereafter, a decision needs to be made about the appropriate response. Visual lookout becomes less of a benefit in certain environmental conditions; fog or possibly other adverse weather conditions such as snow, mist or haze all diminish visual visibility while leaving radar visibility relatively unaffected. Rain, especially when heavy, affects both visual and radar visibility and under these conditions a radar watch may become more difficult requiring particularly close attention. While algorithms may be developed to minimise the effect of all environmental phenomena it is felt to be difficult to produce a ‘one size fits all’ approach without eroding some of the safeguards.
• Given the remoteness of hybrid radar system equipment, both far from shore and in largely inaccessible areas of an installation, and the harsh environmental conditions in which it operates, may mean that service and maintenance considerations are particularly important. Experience in the operation of hybrid radar systems in an offshore environment has shown that some can be susceptible to errors, caused either by improper tuning and set up of the equipment during installation or by interference from other radio signals while in use. A comparison of the REWS with ERRV gathered data (see Appendix 1) indicated an apparently large number of spurious targets. What is particularly clear is the need for an offshore installation’s maintenance regime to take account of the logistics of fitting and maintenance of a hybrid radar system, especially when it is a safety critical item. These could be addressed through maintenance agreements though are also likely to include remote access and adjustment from shore and built in component redundancy to minimise equipment downtime.
32

• Automated data acquisition and recording permits archiving and, if circumstances warrant it, interrogation and reconstruction of events. Such a facility may prove to be useful if an errant vessel incident occurs and a contemporaneous and comprehensive data set is required for investigation. Through the use of platform based radar a full and definitive investigation into a recent collision in the SNS between a manned installation and large fishing vessel was possible.
• Effective detection, plotting and collision risk assessment using conventional ERRV based radar requires a high degree of diligence from watchkeeping officers both to detect an approaching vessel, or vessels, initially and to monitor their movements until finally past and clear of the installation. From a human factors perspective a great deal of work has already been done into ‘task overload’, which in terms of this study would be the effects of the ERRV OOW having to monitor and control several conflicting duties simultaneously. Areas that may merit further study in terms of human factors are the choices of radar display available to radar watchkeepers, i.e., true or relative motion, sea or ground stabilised, etc., and what may prompt the choice of one display over another.
• Based on this work it is suggested that a place does exist for a hybrid radar system as a complementary and integrated tool for ERRV crews. They can provide an automated early warning of vessels approaching multiple installations in a field while at the same time helping crews with the decision making and prioritisation process. The adoption of such a ‘hybrid’ system is starting to occur at several fields on the UKCS although where we were able to discuss the use of the equipment with the ERRV’s crew it appeared to have received a somewhat mixed reaction.
33

34

Appendices
CONTENTS
Appendix 1 Comparison of REWS and ERRV Gathered Data Appendix 2 MCA Shipping Notices and Marine Guidance Notes for AIS Appendix 3 “Report on the Performance Degradation of Civilian Marine Radar
Due to Close By Obstacles” by Professors A.K. Brown and P.D.L. Williams

Appendix 1 Comparison of REWS and ERRV Gathered Data
CONTENTS
Part 1 Overview Part 2 Notes on Data Comparison Part 3 Data Comparison Methodology
Part 3.1 REWS Data Confidence Part 3.2 Positional Comparison
Part 4 Traffic Routes Around Ravenspurn Bravo Part 5 Data Comparison Discussion
PART 1 OVERVIEW
As a prelude to this study HSE commissioned a project to collect and compare two data sets that purported to refer to the same events. Over a period of approximately one month in early 2000 a Safe Marine Ltd.’s (now SML Technologies Ltd.) REWS automatically collected radar data of vessels in the vicinity of the Ravenspurn Bravo platform in the SNS. Simultaneously, OOWs on the ERRV “Putford Worker” manually recorded date/time, radar bearing, range and CPA information, together with a number of other parameters, from passing vessels at the time they were first detected on the vessel’s radar.
Both data sets were analysed by BOMEL Limited on behalf of the HSE and a final report (C828\01\169R REV A – June 2001) was produced. The report contained a number of conclusions highlighting the difficulty of reconciling the two data sets because of an apparent shift of approximately 20 minutes between positions recorded by the two sources.
At HSE’s request we reassessed the raw data from first principles for both sources to attempt to clarify whether there was a consistent time shift between data sources and, if one was found to exist, why this may be so.
PART 2 NOTES ON DATA COMPARISON
Before explaining how the data were analysed and what the outcomes were it is considered prudent to note a number of observations:
• The ERRV data records both the vessel’s and target’s position (latitude/longitude) at the time when first detected. Simultaneously, the ERRV’s range/bearing to Ravenspurn Bravo was also recorded as was the target’s course, speed and CPA. However, it is not clear from the data we had access to whether the CPA referred to the target’s minimum distance away from Ravenspurn Bravo or the installation named in the record sheet, which in many cases was different (only 7 of 340 records referred to Ravenspurn Bravo).
• The processed REWS data records details of each target detected with respect only to the Ravenspurn Bravo, i.e., the range/bearing/heading of the target at CPA, the range from the installation when it was first detected and lost.
• The different bases upon which the data were recorded makes simple positional comparison at a fixed time impossible unless the CPA occurred at the same time as the ERRV recorded the position.
• Over the whole period for which data were collected there were a total of 593 vessels recorded by the ERRV (between 00:00 on 14 February and 20:00 on 11 March 2000) although it appears data recording was interrupted between 11:45 on 27 February and 06:25 on 29 February 2000.
• REWS data recording occurred between 00:00 on 15 February and 23:57 on 14 March 2000 although there appeared to be interruptions between: � 23:58 on 25 February and 14:21 on 26 February 2000, � 23:59 on 4 March and 16:26 on 5 March 2000, � 23:58 on 12 March and 18:18 on 13 March 2000.
• Processing of the REWS data recorded as above yielded a total of 6002 records, of which 3218 had a CPA of 12 nautical miles or less.
PART 3 DATA COMPARISON METHODOLOGY
The two systems’ different approach to data recording, as outlined above, resulted in the need to analyse not only the processed REWS data but also their daily raw data files where a record had been made of each target’s latitude/longitude at specified times, usually about 2.5 minutes apart. By comparing the raw positional information of each plot is was possible to reconstruct each target’s course/speed at various stages of its transition of the Ravenspurn Bravo radar coverage area.
To some extent the target positions recorded by REWS can be considered to validate each other, i.e., the current position is validated by the previous one and the next one validates the current one. But, like all CMR based systems, the strength of a radar return (and possibly the accuracy of an individual plot) for the REWS will differ depending on a number of factors, for example the target's range, size, material and aspect. When a vessel is beam on the radar return will be better than when end on or oblique.
Part 3.1 REWS Data Confidence In an attempt to develop a better understanding of the confidence that ought to be attributed to the REWS data, the course/speed between subsequent plots was calculated for all targets when within 12 miles of Ravenspurn Bravo (NB: for the sake of expediency the calculations were undertaken using ‘plane sailing’ rather than the more accurate spherical trigonometry – with the distances involved the difference would be minuscule). Unfortunately, it is believed there could be some limitations to this approach:
• Small positional errors when recorded at short intervals can cause large differences in calculated speed/course.
• The propensity for some vessels, such as fishing or oilfield support vessels, to make numerous course alterations during normal operations.
• The changing effect of tidal streams or currents are ignored. Targets encountering a change in the direction or rate of either the tide or a current between plots will be set in a course made good even though they have not altered course. As the REWS plots true positions, i.e., course made good, they include these effects.
Notwithstanding these constraints, after the true course between plots had been calculated for each target then their standard deviation was produced. The results are presented in Figure 2, overleaf.

Figure 2 REWS targets’ calculated course standard deviations
The results in Figure 2 indicate that for a relatively large number of tracks the true course calculated from the individual plots differed only slightly between consecutive positions. Bearing in mind the limitations of calculating courses from positions separated by a short time these results are encouraging; in over half the tracks the standard deviation of the calculated course was less than 20�. A further measure through which the robustness of the REWS data can be assessed is the ‘time on plot’ (or number of positions recorded for a passing vessel) of each target. Taking the difference between the ‘Time Found’ and ‘Time Lost’ data for each target can help to determine the confidence with which a target’s data should be viewed and whether it is a ‘real’ vessel or not. These data are particularly relevant for targets that pass closer to Ravenspurn Bravo than those at extreme range. For example, a target skirting the radar coverage area that is ‘found’ at 20 miles range and ‘lost’ shortly afterwards at a similar range is considered more likely to have been a bona fide target than one ‘found’ at 7 miles range and ‘lost’ at 3 miles. To quantify this hypothesis the ‘time on plot’ figure was determined for each target. This was done for all targets and, separately, for targets where the reported CPA is 12 miles or less (for consistency with the ERRV data). To facilitate analysis the results were placed into bins according to various time periods. In reviewing the results it is important to stress that fishing vessels need to be treated with caution because it is likely they may remain on plot for considerable periods when working in the area.
0
20
40
60
80
100
120
140
160
180
1
208
415
622
829
1036
1243
1450
1657
1864
2071
2278
2485
2692
2899
3106
3313
3520
3727
3934
4141
4348
4555
4762
4969
5176
5383
Cumulative tracks
Tar
get
's c
ou
se s
tan
dar
d d
evia
tio
n

Table 8 Time ‘on plot’ of all targets detected by REWS
Time on plot < 15 minutes 15 - 30 minutes
30 minutes – 1 hour
1 - 2 hours > 2 hours
Target count 2207 (36.8%)
948 (15.8%)
821 (13.7%)
909 (15.1%)
1117 (18.6%)
Table 9 Time ‘on plot’ of all targets with CPA of 12 miles or less detected by REWS
CPA less than Cumulative Time on plot (cumulative) (miles) target count < 15 minutes 15 - 30
minutes 30 minutes –
1 hour 1 - 2 hours > 2 hours
1 29 19 3 2 0 5 65.5% 10.3% 6.9% 0.0% 17.2%
2 110 69 5 7 7 22 62.7% 4.5% 6.4% 6.4% 20.0%
3 319 169 33 28 22 67 53.0% 10.3% 8.8% 6.9% 21.0%
4 647 292 90 62 65 138 45.1% 13.9% 9.6% 10.0% 21.3%
5 1114 415 183 139 131 248 37.3% 16.4% 12.5% 11.8% 22.3%
6 1879 641 346 262 245 391 34.1% 18.4% 13.9% 13.0% 20.8%
7 2242 744 424 317 289 475 33.2% 18.9% 14.1% 12.9% 21.2%
8 2414 785 436 328 315 557 32.5% 18.1% 13.6% 13.0% 23.1%
9 2592 819 453 349 353 626 31.6% 17.5% 13.5% 13.6% 24.2%
10 2773 841 471 379 407 684 30.3% 17.0% 13.7% 14.7% 24.7%
11 2980 878 494 412 447 758 29.5% 16.6% 13.8% 15.0% 25.4%
12 3218 935 536 459 476 812 29.1% 16.7% 14.3% 14.8% 25.2%
Building on time on plot as a measure of the confidence with which the REWS data can be considered Figure 2 was recalculated with the calculated course standard deviation placed into bins as in Tables 8 and 9. The results are presented in Figure 3, overleaf.
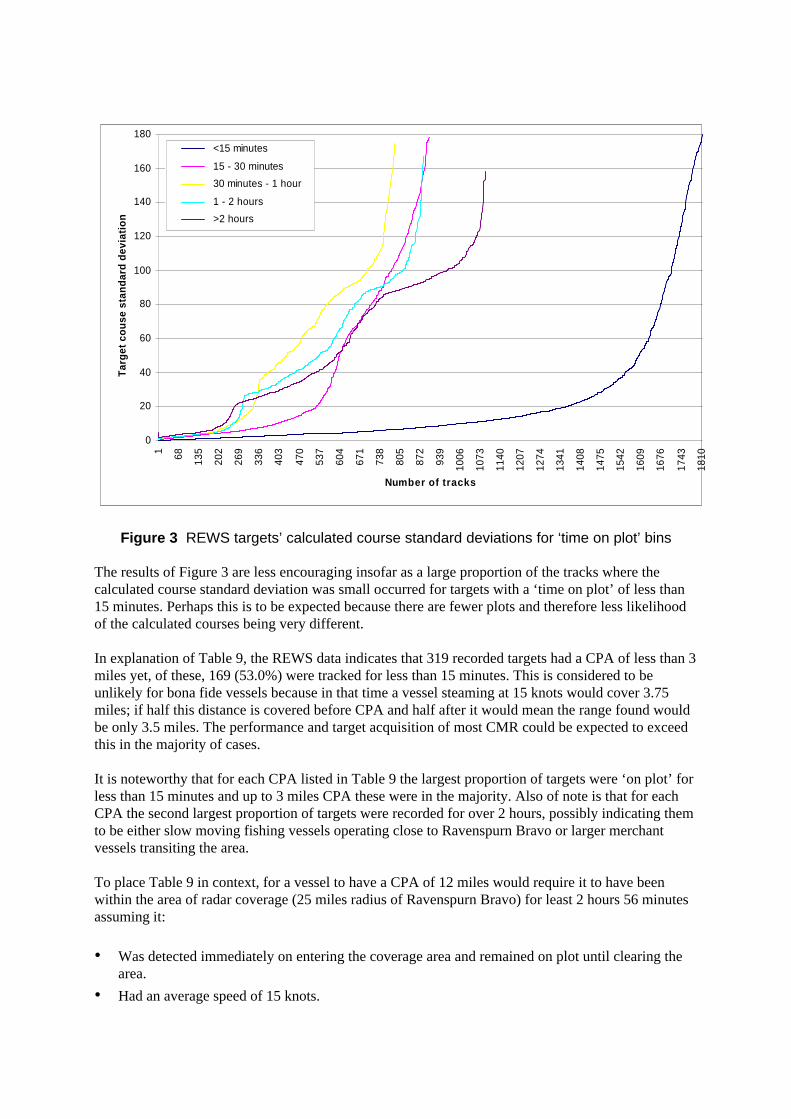
Figure 3 REWS targets’ calculated course standard deviations for ‘time on plot’ bins
The results of Figure 3 are less encouraging insofar as a large proportion of the tracks where the calculated course standard deviation was small occurred for targets with a ‘time on plot’ of less than 15 minutes. Perhaps this is to be expected because there are fewer plots and therefore less likelihood of the calculated courses being very different. In explanation of Table 9, the REWS data indicates that 319 recorded targets had a CPA of less than 3 miles yet, of these, 169 (53.0%) were tracked for less than 15 minutes. This is considered to be unlikely for bona fide vessels because in that time a vessel steaming at 15 knots would cover 3.75 miles; if half this distance is covered before CPA and half after it would mean the range found would be only 3.5 miles. The performance and target acquisition of most CMR could be expected to exceed this in the majority of cases. It is noteworthy that for each CPA listed in Table 9 the largest proportion of targets were ‘on plot’ for less than 15 minutes and up to 3 miles CPA these were in the majority. Also of note is that for each CPA the second largest proportion of targets were recorded for over 2 hours, possibly indicating them to be either slow moving fishing vessels operating close to Ravenspurn Bravo or larger merchant vessels transiting the area. To place Table 9 in context, for a vessel to have a CPA of 12 miles would require it to have been within the area of radar coverage (25 miles radius of Ravenspurn Bravo) for least 2 hours 56 minutes assuming it:
• Was detected immediately on entering the coverage area and remained on plot until clearing the area.
• Had an average speed of 15 knots.
0
20
40
60
80
100
120
140
160
180
1 68 135
202
269
336
403
470
537
604
671
738
805
872
939
1006
1073
1140
1207
1274
1341
1408
1475
1542
1609
1676
1743
1810
Number of tracks
Tar
get
co
use
sta
nd
ard
dev
iati
on
<15 minutes
15 - 30 minutes
30 minutes - 1 hour
1 - 2 hours
>2 hours

• Maintained a steady course.
Obviously, vessels detected and lost at ranges of less than 12 miles will have shorter times on plot, as will those steaming at a higher speed, but the data in Table 9 begs the question of why there are apparently large numbers of vessels that passed relatively close to the installation yet very few were recorded by the ERRV.
A slightly worrying interpretation of the data and a possible explanation for the results of Table 9 is the large number of targets with a small CPA yet a short time between acquisition and loss. This indicates either they were not detected until relatively close to Ravenspurn Bravo or, more likely, they were false or spurious targets. Although a difficult and somewhat imprecise exercise, from our analysis of the data it is suggested that as many as 1300 (21.7%) recorded targets were not bona fide vessels.
Part 3.2 Positional Comparison Bearing in mind the contents of Part 3.1 and the confidence with which some of the REWS data should be viewed, a comparison was made between the target’s position recorded by the ERRV and those recorded by REWS.
From the early stages of this activity it became apparent that it would not result in ‘absolute’ data matches. Both the ERRV and REWS equipment is subject to permitted tolerances in performance standards and any errors in external sensory input, for example GPS or time keeping differences, could compound any discrepancies between data recorded by the two sources.
To minimise the effects of the equipment’s shortcomings and produce the best attempt at data matching it was decided to create a ‘box’ of –one minute difference of latitude/longitude about each of the 593 positions reported by the ERRV (NB: 1 minute difference of longitude at 54� latitude = 0.59 nautical miles5, therefore the ‘box’ was rectangular having sides of 2 nautical miles and ends of approximately 1.2 nautical miles; an area of 2.4
2 nautical miles). The whole area within the box was
then compared with positions recorded by the REWS. To further refine the positional comparison only REWS data recorded within –30 minutes of the time reported by the ERRV were used.
As the REWS data comprises a series of positions that when combined make up a track for each target, using this method it was possible to identify which REWS targets were closest to the position reported by the ERRV at a similar time.
A total of 2365 target positions were recorded by REWS that fell within the ‘box’ around the position recorded by the ERRV and were also within –30 mins of the reported time. This match was achieved for 419 ERRV records, i.e., 174 ERRV target reports could not be verified by their proximity and timing with a corresponding REWS target. Also of note is that the 419 ERRV records matched with a total of 560 REWS tracks, meaning that in some cases there were multiple tracks being recorded by REWS where a vessel’s position fell within the ‘box’ and time window:
• 58 occurrences of 2 tracks
• 14 occurrences of 3 tracks
• 5 occurrences of 4 tracks
• 2 occurrences of 5 tracks
• 5 occurrences of 6 tracks
• 1 occurrence of 8 tracks
Departure = Difference of longitude x Cosine latitude 5
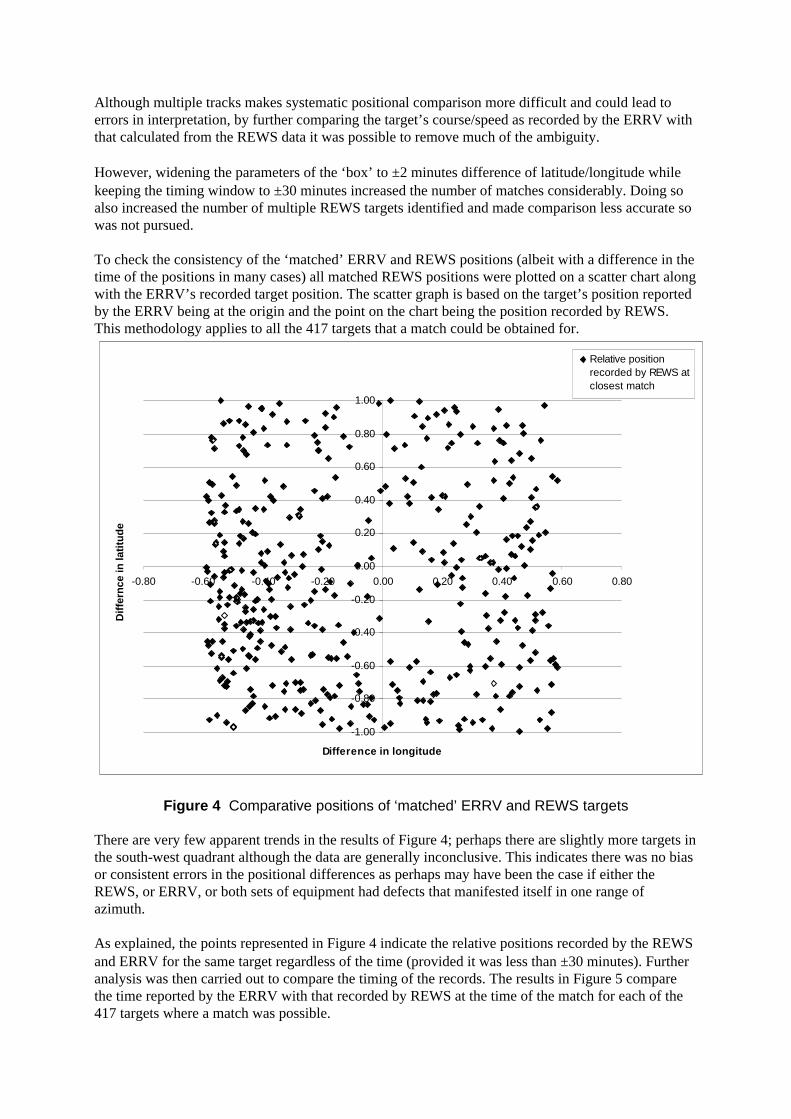
Although multiple tracks makes systematic positional comparison more difficult and could lead to errors in interpretation, by further comparing the target’s course/speed as recorded by the ERRV with that calculated from the REWS data it was possible to remove much of the ambiguity.
However, widening the parameters of the ‘box’ to –2 minutes difference of latitude/longitude while keeping the timing window to –30 minutes increased the number of matches considerably. Doing so also increased the number of multiple REWS targets identified and made comparison less accurate so was not pursued.
To check the consistency of the ‘matched’ ERRV and REWS positions (albeit with a difference in the time of the positions in many cases) all matched REWS positions were plotted on a scatter chart along with the ERRV’s recorded target position. The scatter graph is based on the target’s position reported by the ERRV being at the origin and the point on the chart being the position recorded by REWS. This methodology applies to all the 417 targets that a match could be obtained for.
-1.00
-0.80
-0.60
-0.40
-0.20
0.00
0.20
0.40
0.60
0.80
1.00
-0.80 -0.60 -0.40 -0.20 0.00 0.20 0.40 0.60 0.80
Dif
fern
ce in
lati
tud
e
Difference in longitude
Relative position recorded by REWS at closest match
Figure 4 Comparative positions of ‘matched’ ERRV and REWS targets
There are very few apparent trends in the results of Figure 4; perhaps there are slightly more targets in the south-west quadrant although the data are generally inconclusive. This indicates there was no bias or consistent errors in the positional differences as perhaps may have been the case if either the REWS, or ERRV, or both sets of equipment had defects that manifested itself in one range of azimuth.
As explained, the points represented in Figure 4 indicate the relative positions recorded by the REWS and ERRV for the same target regardless of the time (provided it was less than –30 minutes). Further analysis was then carried out to compare the timing of the records. The results in Figure 5 compare the time reported by the ERRV with that recorded by REWS at the time of the match for each of the 417 targets where a match was possible.

-30
-20
-10
0
10
20
30
1 17 33 49 65 81 97 113
129
145
161
177
193
209
225
241
257
273
289
305
321
337
353
369
385
401
417
Tim
e sh
ift
bet
wee
n R
EW
S a
nd
ER
RV
rec
ord
s (m
ins.
)
Figure 5 Time difference between ERRV and REWS records at position match
Points beneath the x axis, of which there are 65, indicate that the time of the matching position was recorded by the REWS before that of the ERRV whereas the points above the axis indicate the reverse. The data indicate that in the majority of cases the ERRV’s position was recorded between 10 and 30 minutes before that of the REWS with a preponderance of these suffering an approximate 20 minutes time shift. No explanation for the time difference could be found; whether it was due an error in the ship’s time being kept by the ERRV, an error in the internal clock mechanism of the REWS or some other unexplained reason.
Figure 5 does not indicate whether the REWS or ERRV first detected the target before the other, simply that at the time of the closest position match there was a difference in the time recorded. However, having identified those REWS tracks that match vessels reported by the ERRV in 417 instances it was possible to calculate how many, and by how much, were first recorded by the REWS. The ‘time found’ information was compared with the time recorded by the ERRV to produce Figure 6, overleaf. To place the chart in context it is important to bear the following in mind:
• Under any circumstances a ‘time shift’ between the REWS and ERRV positions is acknowledged – this could have an influence on the data used to produce Figure 6 and may cause a number of targets to classified in columns to the left of where they should be.
• The REWS system has a greater height of eye and therefore could normally be expected to detect targets earlier than a radar placed on an ERRV.
• REWS is an automatic system rather than one relying on a human observer who, for much of the time, has other duties to attend to. The effect of this is that the records kept by the ERRV refer to the time when a target was first noticed by the radar observer rather than when it was first
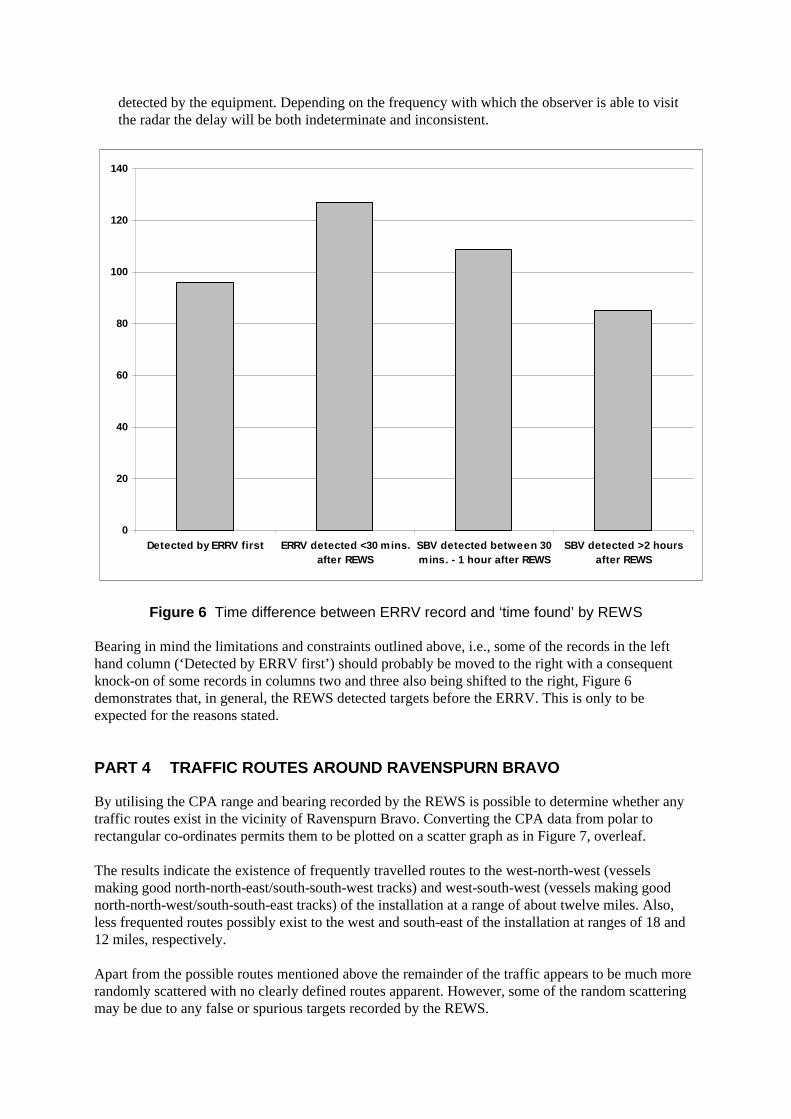
detected by the equipment. Depending on the frequency with which the observer is able to visit the radar the delay will be both indeterminate and inconsistent.
0
20
40
60
80
100
120
140
Detected by ERRV first ERRV detected <30 mins. after REWS
SBV detected between 30 mins. - 1 hour after REWS
SBV detected >2 hours after REWS
Figure 6 Time difference between ERRV record and ‘time found’ by REWS
Bearing in mind the limitations and constraints outlined above, i.e., some of the records in the left hand column (‘Detected by ERRV first’) should probably be moved to the right with a consequent knock-on of some records in columns two and three also being shifted to the right, Figure 6 demonstrates that, in general, the REWS detected targets before the ERRV. This is only to be expected for the reasons stated.
PART 4 TRAFFIC ROUTES AROUND RAVENSPURN BRAVO
By utilising the CPA range and bearing recorded by the REWS is possible to determine whether any traffic routes exist in the vicinity of Ravenspurn Bravo. Converting the CPA data from polar to rectangular co-ordinates permits them to be plotted on a scatter graph as in Figure 7, overleaf.
The results indicate the existence of frequently travelled routes to the west-north-west (vessels making good north-north-east/south-south-west tracks) and west-south-west (vessels making good north-north-west/south-south-east tracks) of the installation at a range of about twelve miles. Also, less frequented routes possibly exist to the west and south-east of the installation at ranges of 18 and 12 miles, respectively.
Apart from the possible routes mentioned above the remainder of the traffic appears to be much more randomly scattered with no clearly defined routes apparent. However, some of the random scattering may be due to any false or spurious targets recorded by the REWS.

Figure 7 Position of REWS targets’ CPA relative to Ravenspurn Bravo
PART 5 DATA COMPARISON DISCUSSION
During the course of our comparison of the REWS and ERRV gathered data a number of observations were made. In and of themselves these possibly have a limited significance though they are considered worthy of note. To place them in context an attempt has been made to explain how or why they have occurred and they affect they may have.
• A number of targets reported by the ERRV have a ‘time of first detection’ that is similar to the next or previous report. This is more likely to indicate the time when the radar observer first noticed it rather than the time the target was first acquired by the ERRV’s radar. This is very easy to explain inasmuch as the OOW’s were very probably engaged in other activities and only when they returned to the radar did he notice a new target and record its details from the ARPA.
• Within the REWS data the ‘Heading at CPA’ and ‘Bearing at CPA’ information is somewhat unexpected as they are rarely 90� apart, as would normally be the case. As the REWS equipment is on a fixed object the data collected is ‘true’ data as there is no ‘relative’ component caused by a vessel’s movement. The ‘heading’ reported by REWS is not actually the vessel’s heading but rather its true course made good. Tidal stream influences, which cause a difference between a
-30.00
-20.00
-10.00
0.00
10.00
20.00
30.00
-30.00 -20.00 -10.00 0.00 10.00 20.00 30.00
Bearing and range at CPA

vessel’s course made good (of which the ‘Bearing at CPA’ is a perpendicular) and course steered (which is the heading) can be discounted as the REWS equipment is stationary.
• If the heading at CPA is not perpendicular to the bearing at CPA then it should be possible to extend or backfit the heading through the reported CPA to determine the correct CPA at some other point along the vessel’s track.
Target ‘heading at CPA’ recorded by REWS
Target ‘bearing at CPA’ recorded by REWS
Projected heading
Target ‘range at CPA’ recorded by REWS
ACTUAL CPA
Figure 8 Effect of non-perpendicular ‘heading at CPA’ and ‘bearing at CPA’
• In their report (C828\01\169R REV A – June 2001) Bomel highlighted the apparent ‘spike’ in the number of targets detected at the start of each day and subsequent drop off to more stable levels shortly afterwards. This, together with our belief that a relatively large percentage of REWS recorded vessels at other times of the day could be attributed to false or spurious targets, leads to the suggestion that proper set up and tuning is very important. This should ensure that all bona fide targets are detected at an adequate range to enable a robust collision risk management strategy to be implemented as well as to minimise the possibility of false alarms from scanty or inaccurate information.
Appendix 2 MCA Shipping Notices and Marine Guidance Notes for AIS
CONTENTS
MSN 1780 (M) Revised Carriage Requirements Automatic Identification System (AIS), March 2004
MGN 277 (M+F) Operational Guidance for Automatic Identification Systems (AIS) on Board Ship, September 2004
MIN 199 (M+F) Automatic Identification System (AIS) – Use by Small Craft, December 2004
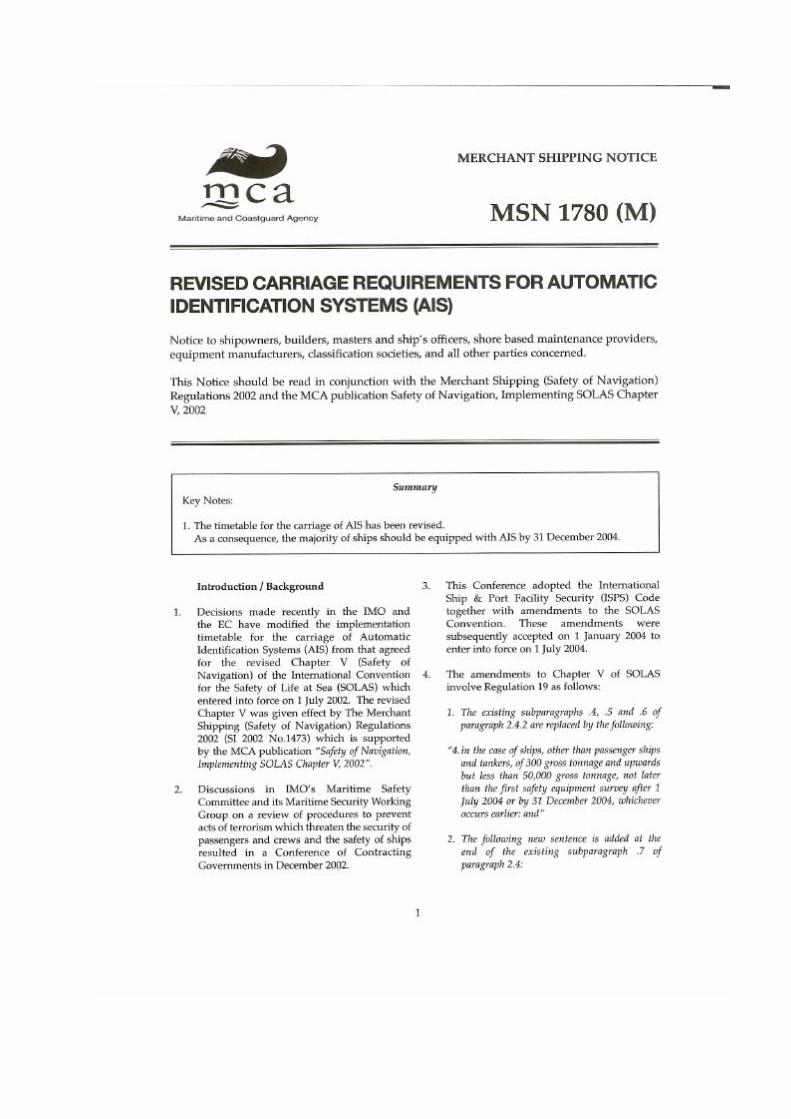


Appendix 3 “Report on the Performance Degradation of Civilian Marine Radar Due to Close By Obstacles” by Professors A.K. Brown and P.D.L. Williams
Appendix 3: Report on the Performance Degradation of Civilian Marine Radar Due to Close By Obstacles
Report on the Performance Degradation of Civilian Marine Radar Due to Close By Obstacles
Professor A.K. Brown, Professor P.D.L. Williams
University of Manchester
1
Appendix 3: Report on the Performance Degradation of Civilian Marine Radar Due to Close By Obstacles
Summary
The performance of individual Civilian Marine Radars (CMR) is usually dependent on the choice of available commercial-off-the-shelf (COTS) equipment adequate to fulfil its operational requirement (OR), followed by satisfactory installation and inspection with written test results of how the contractor certifies that the equipment will fulfil the OR. In practice however radar performance may be degraded by close by obstacles, be they on the ship itself (such as masts) or close to the ship such as dockside or an object such as an oil rig. In these cases the radar performance will always be degraded to some extent. This report reviews some of the salient effects of blockage on fundamental marine radar performance.
2

Appendix 3: Report on the Performance Degradation of Civilian Marine Radar Due to Close By Obstacles
Contents
1) Introduction................................................................................................................. 4
2) A Brief Overview of Civilian Marine Radar (CMR) .................................................. 4
3) The Blockage effect .................................................................................................... 5
4) Blockage effect of radar antennas ............................................................................... 6
5) First hand experience on a large tanker suffering a 50% reduction of all target detections in a swell period............................................................................................. 134
6) CMRs different types and expected performance under a selection of scenarios..... 13
7) Conclusions and the "The Next Move"..................................................................... 15
8) Acknowledgements................................................................................................... 14
9) APPENDIX 1 Regulations........................................................................................ 16
10) APPENDIX 2 Glossary of Radar Terms ................................................................. 19
3
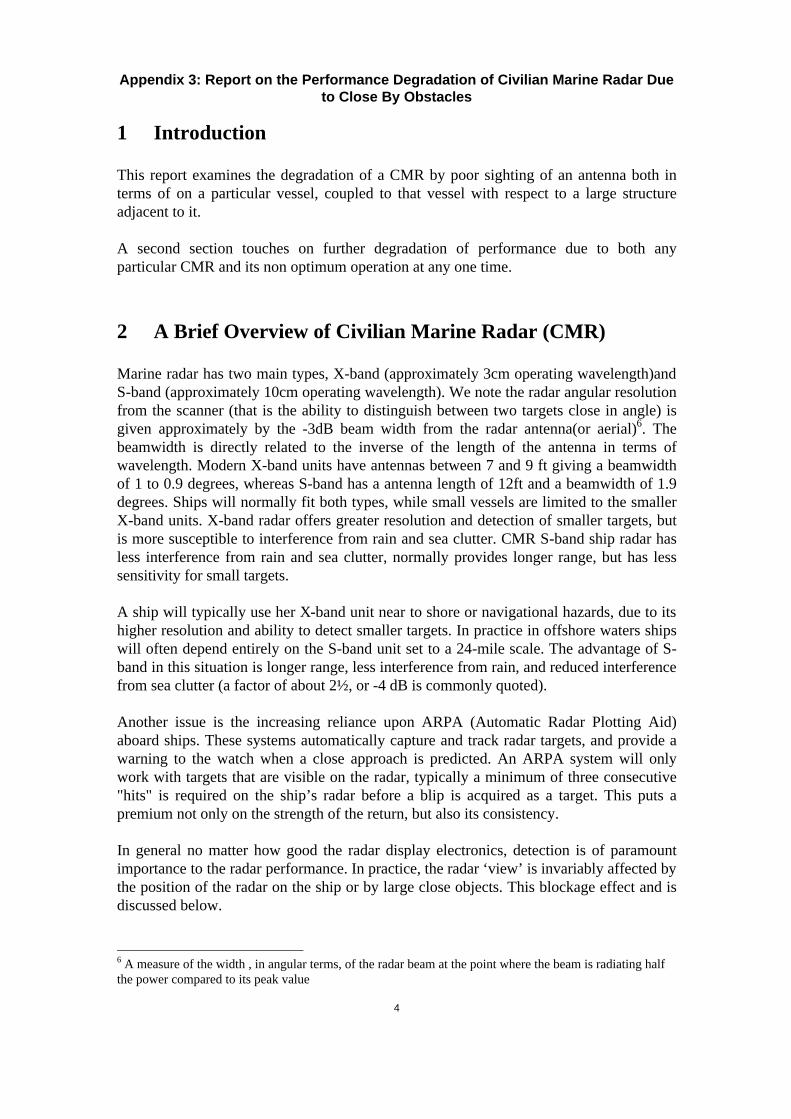
Appendix 3: Report on the Performance Degradation of Civilian Marine Radar Due to Close By Obstacles
1 Introduction
This report examines the degradation of a CMR by poor sighting of an antenna both in terms of on a particular vessel, coupled to that vessel with respect to a large structure adjacent to it.
A second section touches on further degradation of performance due to both any particular CMR and its non optimum operation at any one time.
2 A Brief Overview of Civilian Marine Radar (CMR)
Marine radar has two main types, X-band (approximately 3cm operating wavelength)and S-band (approximately 10cm operating wavelength). We note the radar angular resolution from the scanner (that is the ability to distinguish between two targets close in angle) is given approximately by the -3dB beam width from the radar antenna(or aerial)6. The beamwidth is directly related to the inverse of the length of the antenna in terms of wavelength. Modern X-band units have antennas between 7 and 9 ft giving a beamwidth of 1 to 0.9 degrees, whereas S-band has a antenna length of 12ft and a beamwidth of 1.9 degrees. Ships will normally fit both types, while small vessels are limited to the smaller X-band units. X-band radar offers greater resolution and detection of smaller targets, but is more susceptible to interference from rain and sea clutter. CMR S-band ship radar has less interference from rain and sea clutter, normally provides longer range, but has less sensitivity for small targets.
A ship will typically use her X-band unit near to shore or navigational hazards, due to its higher resolution and ability to detect smaller targets. In practice in offshore waters ships will often depend entirely on the S-band unit set to a 24-mile scale. The advantage of S-band in this situation is longer range, less interference from rain, and reduced interference from sea clutter (a factor of about 2½, or -4 dB is commonly quoted).
Another issue is the increasing reliance upon ARPA (Automatic Radar Plotting Aid) aboard ships. These systems automatically capture and track radar targets, and provide a warning to the watch when a close approach is predicted. An ARPA system will only work with targets that are visible on the radar, typically a minimum of three consecutive "hits" is required on the ship’s radar before a blip is acquired as a target. This puts a premium not only on the strength of the return, but also its consistency.
In general no matter how good the radar display electronics, detection is of paramount importance to the radar performance. In practice, the radar ‘view’ is invariably affected by the position of the radar on the ship or by large close objects. This blockage effect and is discussed below.
6 A measure of the width , in angular terms, of the radar beam at the point where the beam is radiating half the power compared to its peak value
4

3
Appendix 3: Report on the Performance Degradation of Civilian Marine Radar Due to Close By Obstacles
The Blockage effect
When a radar antenna does not have line of sight its performance and ability to “see” a target is diminished. Just how much blockage occurs is a function of how far away the obstruction is and its size (both width and height) with respect to the radar. This is discussed more fully in Section 4.
We note there are a number of issues which need to be considered in the radar siting problem.
a) A simple ‘line of sight’ approximation gives a crude indication of difficulties, where shadowing from structures might occur, etc. However, the problem in depth is a subtle one. The electromagnetic waves transmitted by the antenna will diffract around obstacles to some degree. Small objects (in wavelength terms) may be hardly seen by the radar especially when close in. Conversely large objects will produce close to ‘optical’ shadowing effects.
b) The effects on the radar is not just limited to loss of detection in a shadow sector (although this might be the most serious effect). For example poor sidelobes in a certain angular sector region may also be produced by blocking just part of the antenna aperture - this degrades the resolution of the radar and may be accompanied by loss of gain degrading detection performance.
c) The radar ‘beam’ is radiated by the antenna and changes with distance from the antenna until it is fully formed then, in free space, it maintains the same angular shape for any more distant range. This fully formed beam is known as the far field radiation pattern of the antenna. Conventionally, as a good approximation, the far field is given by 2D2/?, where D is the antenna length. For a 9ft X-band scanner this equates to a range of 450m, for a 12ft S-band antenna about 150 m. We note that the main beam is essentially formed by about half that distances, with the sidelobes remaining somewhat high until the 2D2/? distance. Blockage has a somewhat different effect in the antenna near field and far field, with the intermediate range something of a ‘gray area’.
d) A real siting problem is not just the blockage or otherwise of the antenna. Reflections of large complex metallic objects can be re-reflected off other structures producing false or ‘ghost’ targets. This problem is well known in complex port scenarios and has, for example, been reported as a problem with offshore wind farms.
For these reasons, the detailed computation of blockage and siting effects is complex and tends to be specific to the situation modeled. Modern computational techniques do allow us to look at this problem for specific scenarios. However insight can be gained more generally by looking at published measurements of the problem. The remainder of this current work, therefore, draws on measurements of these effects based on a wide range of siting scenarios.
5
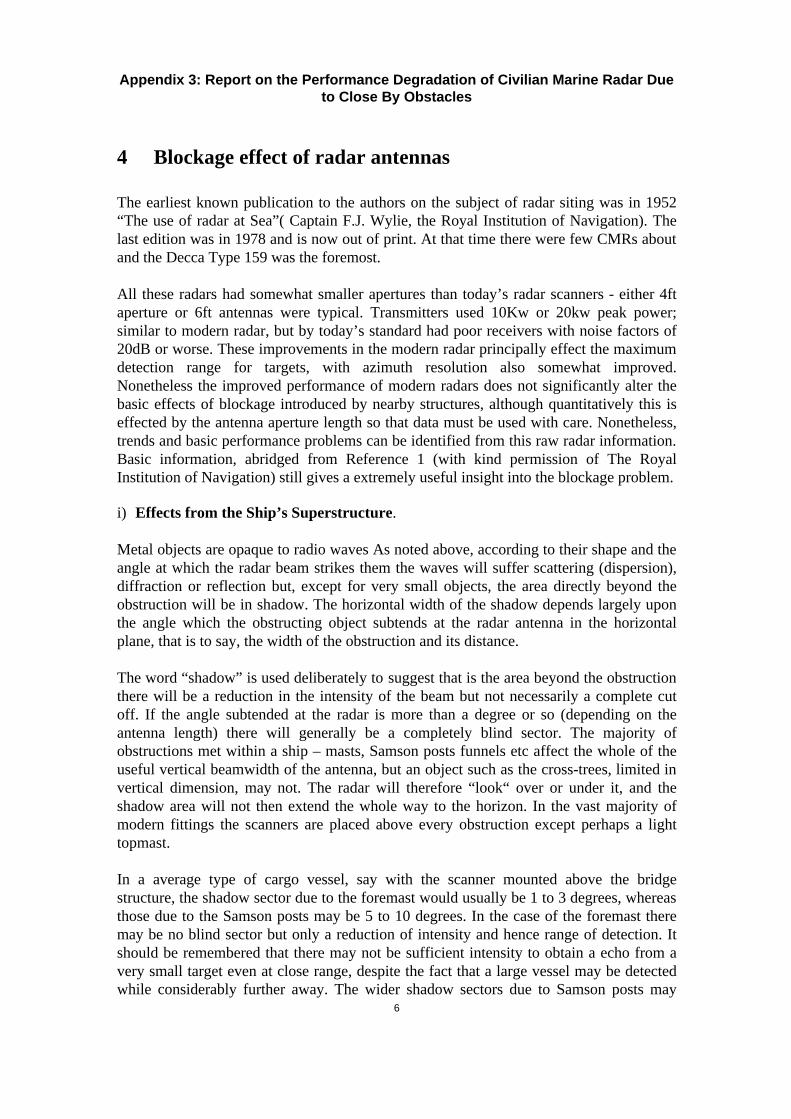
4
Appendix 3: Report on the Performance Degradation of Civilian Marine Radar Due to Close By Obstacles
Blockage effect of radar antennas
The earliest known publication to the authors on the subject of radar siting was in 1952 “The use of radar at Sea”( Captain F.J. Wylie, the Royal Institution of Navigation). The last edition was in 1978 and is now out of print. At that time there were few CMRs about and the Decca Type 159 was the foremost.
All these radars had somewhat smaller apertures than today’s radar scanners - either 4ft aperture or 6ft antennas were typical. Transmitters used 10Kw or 20kw peak power; similar to modern radar, but by today’s standard had poor receivers with noise factors of 20dB or worse. These improvements in the modern radar principally effect the maximum detection range for targets, with azimuth resolution also somewhat improved. Nonetheless the improved performance of modern radars does not significantly alter the basic effects of blockage introduced by nearby structures, although quantitatively this is effected by the antenna aperture length so that data must be used with care. Nonetheless, trends and basic performance problems can be identified from this raw radar information. Basic information, abridged from Reference 1 (with kind permission of The Royal Institution of Navigation) still gives a extremely useful insight into the blockage problem.
i) Effects from the Ship’s Superstructure.
Metal objects are opaque to radio waves As noted above, according to their shape and the angle at which the radar beam strikes them the waves will suffer scattering (dispersion), diffraction or reflection but, except for very small objects, the area directly beyond the obstruction will be in shadow. The horizontal width of the shadow depends largely upon the angle which the obstructing object subtends at the radar antenna in the horizontal plane, that is to say, the width of the obstruction and its distance.
The word “shadow” is used deliberately to suggest that is the area beyond the obstruction there will be a reduction in the intensity of the beam but not necessarily a complete cut off. If the angle subtended at the radar is more than a degree or so (depending on the antenna length) there will generally be a completely blind sector. The majority of obstructions met within a ship – masts, Samson posts funnels etc affect the whole of the useful vertical beamwidth of the antenna, but an object such as the cross-trees, limited in vertical dimension, may not. The radar will therefore “look“ over or under it, and the shadow area will not then extend the whole way to the horizon. In the vast majority of modern fittings the scanners are placed above every obstruction except perhaps a light topmast.
In a average type of cargo vessel, say with the scanner mounted above the bridge structure, the shadow sector due to the foremast would usually be 1 to 3 degrees, whereas those due to the Samson posts may be 5 to 10 degrees. In the case of the foremast there may be no blind sector but only a reduction of intensity and hence range of detection. It should be remembered that there may not be sufficient intensity to obtain a echo from a very small target even at close range, despite the fact that a large vessel may be detected while considerably further away. The wider shadow sectors due to Samson posts may
6

Appendix 3: Report on the Performance Degradation of Civilian Marine Radar Due to Close By Obstacles
have a blind ”core”. The funnel will usually cause a blind sector of from 10 degrees to 45 degrees or more depending on its distance from the radar. This sector will be large enough to obscure a ship of almost any size, however close.
Various experiments have been carried out to determine the shadow effect of obstructions to the radar beam. The results of these experiments have been combined in Figs. 1, 2 and 3 to show effect of a variety of obstructions on the shadow areas caused.
Figure 1 Detection ranges for various targets as affected by the obstruction of a 3ft diameter mast 20ft from the radar (from Ref 1)
Figure 1 shows the detection ranges of vessels of three different sizes as affected by the obstruction of a 3 ft. diameter mast placed 20 ft. from the radar, subtending an angle of 8 degrees. It will be seen that in the case of the 10,000-ton ship no shadow is caused until the range of 5 miles is reached; from that point the shadow sector gradually increases until it is about 24 wide at the normal maximum range of detection. It will also be seen that in the cases of the smaller vessels the shadow sector begins closer to the radar aerial. This is due to the lesser echoing areas of the smaller targets.
Figure 2 shows the effect of varying the diameter of the obstruction while keeping the radar at the same distance from it; while figure 3 shows the effect of varying the distance
7

Appendix 3: Report on the Performance Degradation of Civilian Marine Radar Due to Close By Obstacles
between the obstruction and the radar while keeping the size of the obstruction constant. In both these illustrations the target was a 1000-ton ship.
Figure 2 Detection ranges as affected by the obstruction of masts of different diameters (from Ref 1)
8

Appendix 3: Report on the Performance Degradation of Civilian Marine Radar Due to Close By Obstacles
Figure 3 Detection ranges as affected by the obstruction of a mast at different distances from the radar (from Ref 1)
9
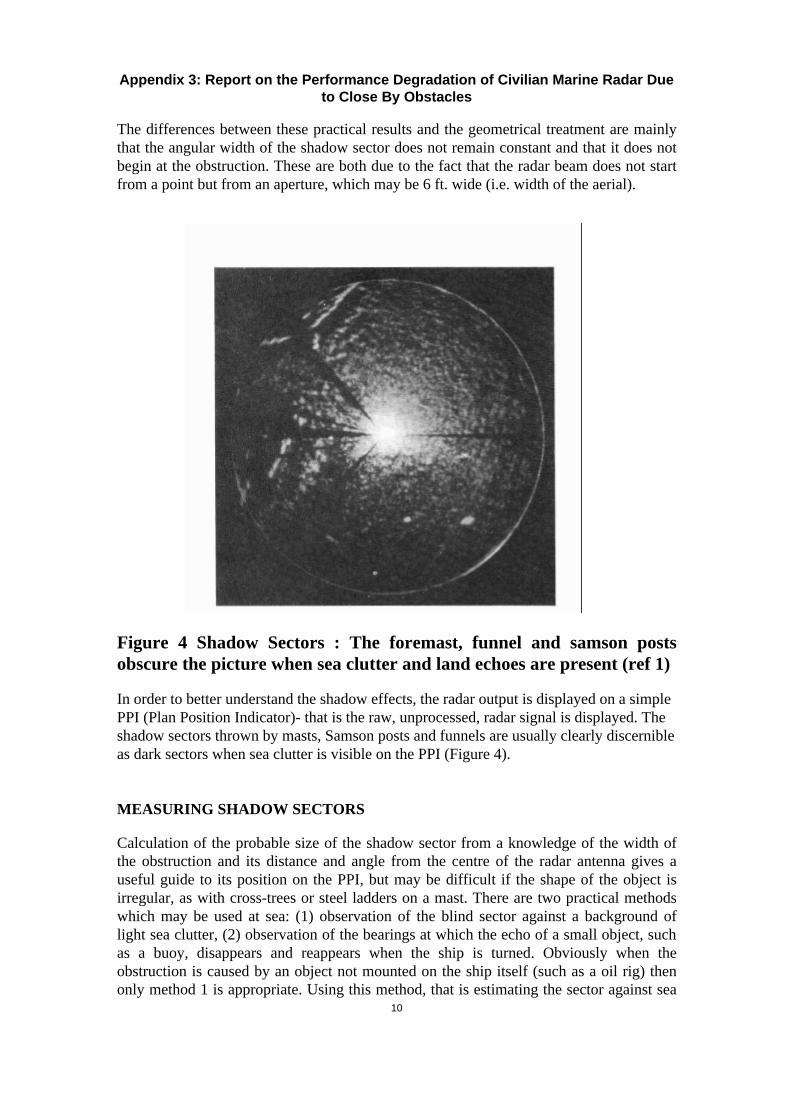
Appendix 3: Report on the Performance Degradation of Civilian Marine Radar Due to Close By Obstacles
The differences between these practical results and the geometrical treatment are mainly that the angular width of the shadow sector does not remain constant and that it does not begin at the obstruction. These are both due to the fact that the radar beam does not start from a point but from an aperture, which may be 6 ft. wide (i.e. width of the aerial).
Figure 4 Shadow Sectors : The foremast, funnel and samson posts obscure the picture when sea clutter and land echoes are present (ref 1)
In order to better understand the shadow effects, the radar output is displayed on a simple PPI (Plan Position Indicator)- that is the raw, unprocessed, radar signal is displayed. The shadow sectors thrown by masts, Samson posts and funnels are usually clearly discernible as dark sectors when sea clutter is visible on the PPI (Figure 4).
MEASURING SHADOW SECTORS
Calculation of the probable size of the shadow sector from a knowledge of the width of the obstruction and its distance and angle from the centre of the radar antenna gives a useful guide to its position on the PPI, but may be difficult if the shape of the object is irregular, as with cross-trees or steel ladders on a mast. There are two practical methods which may be used at sea: (1) observation of the blind sector against a background of light sea clutter, (2) observation of the bearings at which the echo of a small object, such as a buoy, disappears and reappears when the ship is turned. Obviously when the obstruction is caused by an object not mounted on the ship itself (such as a oil rig) then only method 1 is appropriate. Using this method, that is estimating the sector against sea
10

Appendix 3: Report on the Performance Degradation of Civilian Marine Radar Due to Close By Obstacles
clutter, the gain or sea-clutter control should be adjusted until the clutter is weak. Otherwise the sector may be narrowed due to clutter echoes penetrating into it from the sides.
False or indirect echoes
It has been shown that metal obstructions in the path of the radar beam may tend either to scatter it or to reflect from it. Some structures such as funnels or cross-trees are good reflectors and, a considerable portion of the energy in the radio beam may be sent off at an angle which will depend on the character of the obstruction. It is necessary to recall that the ship radar beam has considerable vertical width - typically 20 degrees or more and objects which do not obstruct the horizontal view from the scanner may give rise to reflections in the same way as those which do.
The echo caused by a reflected portion of the beam will return to the scanner by the same path and, whatever the actual bearing of the target may be, the echo will appear on the bearing of the obstruction. It will appear at the true range of the target if the additional distance between the scanner and the reflecting object is negligible. Such echoes are known as false or indirect echoes. The direct echo from the target will also appear at its proper bearing and distance unless it is in a blind sector.
In practice, objects in the ship which lie in or near the horizontal path of the beam are the most frequent causes of reflections, and false echoes are, therefore, more likely to appear within shadow sectors. As has been seen, however, they may also appear on bearings where no shadow sector is apparent. Although false echoes may be caused by Samson posts and less conspicuous structures the objects most commonly associated with these echoes are funnels and cross-trees. As only a small portion of the energy from the beam will contribute to the production of false echoes, it will require a target with a strong response to cause them.
As an example, assuming that the radar antenna is on the centre line, forward of the funnel, a false echo due to the funnel will appear to be astern of the ship or nearly so. Owing to the curvature of the funnel the false echo will be so distorted as to bear little resemblance to the shape of the original target. When the ship is passing close to land, oil rigs, wind farms etc., or moving in a river, false echoes from the structures may appear to be following the ship (Figure 5).
11

Appendix 3: Report on the Performance Degradation of Civilian Marine Radar Due to Close By Obstacles
Figure 5 False echoes: Land near Sutherland is seen to the south east due to reflections from the funnel (3 mile range scale)
False echoes may cause a certain amount of confusion and may be mistaken for true echoes. It is possible to eliminate some of the sources of false echoes when these occur due to ship structure. In the case of cross-trees, for example, deflecting material of some kind (corrugated steel, for example) may be arranged either to scatter the beam or to deflect it upwards and so away from possible targets. Radar absorbent material (RAM) has also been found to be effective.
When the ship is very close to structures such as buildings, bridges, offshore structures etc., these may cause false echoes in exactly the same way as has been described for the ship’s structure. When the ship is in dock there may be such a confusion of false echoes due to buildings and the ship herself that it is virtually impossible to identify any particular echoes.
12

Appendix 3: Report on the Performance Degradation of Civilian Marine Radar Due to Close By Obstacles
5 First hand experience on a large tanker suffering a 50% reduction of all target detections in a swell period.
Whilst with Decca Radar one of the author’s (PDLW) and colleague were called to go across to Cherbourg to investigate a complaint that the Decca Radar was failing to provide consistent video and other radar data to an early ARPA system. So we went aboard in dock and all seemed fine. We put to sea in a large tanker in ballast, trimmed to the stern with the bow well out of the water. All was well till we were clear of the harbour & pitching head into an Atlantic swell. Due to the trim of the vessel & the swell, the ARPA tracker lost track on the selected target ship ahead. The resulting tracking loss arising from the change in the scanner alignment with the sea surface & the blockage of the bow. Some ships carry additional radar on the bow partly to reduce the perceived sea clutter and also reduce the blind zone caused by the bow as above.
6 CMRs different types and expected performance under a selection of scenarios
a) The antenna horizontal sizes start at 2ft 5” going to 9ft on X band or 9 or 12ft at S band for CMRs. VTS and other rig or shore based sets make use of 9, 18, 25ft on X band or large aperture dual band antennas.
b) Blockage is either partial when a small antenna boresight is directed at the centre of a metal obstruction or complete with a small aperture and large obstruction.
c) The situation is now more complex to analyze, but in all cases will degrade radar performance.
d) In the case of an offshore rig structure multiple reflections will make the situation worse with both missed targets due to sector shadowing and the occurrences of false targets at wrong bearings, all of which will produce an ambiguous radar picture on the screen and potentially cause confusion and errors.
e) On an ARPA both missed and false targets make them dangerous to rely on exclusively in complex scenarios and the radar is certainly not to be used without a dedicated operator.
f) Shipping includes fast CATs, powerboats and RIB types. Some have small RCS. Tankers and VLCCs are larger and have larger RCS. All of this needs radar receivers with greater dynamic range to cope with a greater range of target RCS and antennas with better sidelobes as well. Also newer types of radar such as FM/CW and pulse compression sets can generate range sidelobes, which with a few exceptions have never been experienced in civil marine service.
13

Appendix 3: Report on the Performance Degradation of Civilian Marine Radar Due to Close By Obstacles
7 Conclusions and “The Next Move”
1. The report has shown the significant degradation of using a CMR in close proximity to any offshore rig or other large structure.
2. Performance degradation includes but is not limited to: loss of detection performance, generation of false targets, high sidelobe production, etc
3. The degree of degradation can only be judged by the fall in performance from the required standard to comply with its fitness for purpose. We note that the state of any equipment to fulfil its Task or Operational Requirement depends on the choice of a CMR, its performance every day and how much spare or excess performance there will be at any time. Without an adequate margin of say 20dB. one is in without a chance. Also it cannot be too strongly stated that a well trained radar observer must always be on duty. To clarify this, Chapter 18 of the Reference 13 (Williams 2000) is included here as Appendix 1 by kind permission of the author.
The report has shown that the effect of close by obstacles on radar can be significant. A more comprehensive study is needed to examine the use of supplementary systems such as AIS within the offshore blockage environment. A paper has been submitted to the Journal of Navigation (Williams 2004.) This will provide a framework for owners and operators to examine their needs which should lead to a review of all sensors in use now and for the future to fulfil the growing risks both for safety and security (intruder detection) perspectives.
8 Acknowledgements
The authors wishes to thank the Royal Institute of Navigation for their permission to use extracts from the book commissioned in 1952 “The Use of Radar at Sea” edited by the late Captain F.J. Wylie and help in many ways, also from friends and colleagues over many years.
14
Appendix 3: Report on the Performance Degradation of Civilian Marine Radar Due to Close By Obstacles
References
1) Wylie F.J. Editor . “The Use of Radar at Sea” RIN. Out of print
2) Briggs R.J. (2004) “Target Detection by Marine Radar”, IEE, October 2004.
3) Brown, A.K. and R. Aitmedhi. (1992) Shore-based antennas – a guide to their selection for port, river, coastal and security surveillance. ESAT Antennas, 1992.
4) McGeoch I. (2004) AIS and Radar. SEAWAYS. The Nautical Institute. August.
5) Morchin W. (1993). Engineers Source Book. ARTEC HOUSE.
6) Norris A. (2004). The Future of Marine Radar. SEAWAYS The Nautical Institute July.
7) Skolnik M.I. (1970). Radar Handbook. McGraw Hill (Later editions no longer carry the chapter on CMR).
8) Sperry Marine (2000) Bridge House E Radar User Guide.
9) Stiff I. P. A. 2002 The COLREGS-Time for a rewrite. J of Nav 55 419-430.
10) Stiff I. P. A. (2004) AIS and Collision Avoidance – A Sense of Déjà Vu. J of Nav 57 167 – 180.
11) Williams P.D.L., (2004) Sensors for our senses. Submitted to J of Nav – Sept 29 2004.
12) Williams P.D.L. (1999), Civil Marine Radar. A Personal Record of History and Development over half a century with a focus on small target detection. Vol. 1. ISBN No 0 9536148 0 8. Also vol. 2 in 2000 ISBN 0 9536148 13.
13) Williams P.D.L. (2002) Civil Marine Radar – A Fresh Look at Transmitter Spectral Control and Diversity Operation. Journal of Navigation Vol. 55 3 pp 405-418.
15

Appendix 3: Report on the Performance Degradation of Civilian Marine Radar Due to Close By Obstacles
9 APPENDIX 1 Regulations
(Drawn from Chapter 18 of Reference 13 with kind permission of the author)
Regulations
Introduction
Historically the first formal requirements written for CMR followed the many operational requirements or ORs, specifications and technical specifications written for military use in the period 1930 to 1946. The draft specification for CMR first appeared as a discussion document in the UK and was modified at a meeting in May 1946 in London of the International Meeting on Radio Aids to Marine Navigation ( IMRAMN ). Croney (1970.)
Then followed a series of updates of this original specification as well as national ones around the world. Later further specifications were introduced for both ARPA and ATA equipment as well as ones for ship’s gyros and speed and distance measurement equipment or logs. So as of December 1998 the position of specifications in Europe is that there are now a number of specifications for several items in the UK and other European countries which are gradually being harmonised and may be listed as follows:-
Shipborne radar BS 7168: until 1989, then IEC 60936 : 1988, (1991 on the way) then EN 60936 : 1993 Marine Automatic Radar Plotting Aids ( ARPA ) EN 60872 : 1993 Marine Gyrocompass complying with IEC Standard BS EN ISO 8728 Marine Devices to Measure Speed and Distance complying with BS EN 61023 Marine Navigation and Radio Communication Support Systems IEC 60936-2 1998 note 1 General Requirements for Marine Navigational Equipment Standard No BS EN 60945 note 2 Marine Automatic Radar Tracking Aid ( ATA ) its number is IEC 60936-2 1998 note 3 Radar reflectors BS EN ISO 8729 note 4
Note 1. At the time of writing some UK and other national standards like the German DIN and French ones are being raised from scratch when the IEC catalogue system can be invoked from the beginning and such is the case for radar for high speed ships. So the omnibus new title on the note 1 line has already been bought into place and there is a subtitle “ Shipborne radar for high speed vessels which has jumped in front of the current version of the original 1946 CMR requirements specification.
Note 2. This has been in place some time but is still a national standard, to eventually have an IEC number.
Note 3. This is a variation of the ARPA specification with some changes to minimum scanner speed.
16
Appendix 3: Report on the Performance Degradation of Civilian Marine Radar Due to Close By Obstacles
Note 4. This is by way of a guide to the construction of the single corner and there are many more available.
Discussion
The above represent the major specifications but there are many more either implied or called up. We note that IEC stands for International Electrotechnical Commission. But some countries may have supplementary requirements perhaps not readily available so contractors may face hidden specifications and regulations particularly with regard to unwanted Tx spectral residues in bands adjacent to the marine radar bands (and guard bands). Other problems occur when CMR types of equipment are used ashore and often fresh frequency allocations are mandatory so the extra expense can be out of proportion to the initial cost of the mass produced CMR modules. But the pressure on radio spectrum space is becoming greater and greater.
Back in the 1946 era CMR was in its infancy and the operating bands were partly chosen for their suitability for marine radar, partly due to the availability of microwave components like X and S band magnetrons, mixers, duplexors, TR cells and local oscillators and partly due to the fact that S band did not suffer from precipitation problems, nor significant attenuation through 5 to 10 nm of non tropical rainfall but needed a large 12 ft ( 5.2 m ) aperture to produce a 2 degree beam with enough power taper across its horizontal aperture to meet the specified near and far side lobe level required.
Modern magnetrons in general need to transmit lower modest peak and mean power levels than fifty years ago as receiver noise factors have improved from something around the 15 dB then to 3 to 5 dB today so where 75 kW S band transmitters were commonplace 20 years ago they are rarely found as we enter the millennium. Magnetrons when suitably driven and matched now can produce clean spectra particularly on long pulse and are environmentally friendly but radio frequency congestion is like road traffic getting worse.
The frequency allocation at the time of writing are in three bands as follows and polarisation is also listed:-
Band Frequency (GHz) Polarisation notes S band 3 to 3.1 choice of HH or VV frequencies not stated now C band to choice of HH or VV “ X band 9.33 to 9.5 to be capable of HP for racon / ramark use
Note 1. The frequencies no longer appear in the CMR specs and may change. Note 2. C band is occasionally used, powerful equipment came out in the late 1980s for use on ocean trawlers to detect feeding tuna when on the surface (possibly detecting water splashes and birds), enabling detections from 5 to 10 nm to be made.
Potential new frequency allocations are very much more open but of course subject to an horrendous minefield of national regulations and potential interference to established users. By
17

Appendix 3: Report on the Performance Degradation of Civilian Marine Radar Due to Close By Obstacles
way of illustration we now list the bands theoretically open for negotiation. As a preamble we note that at periods of several years the World Administrative Radio Conference meet in Geneva so there have recently been WARC 1979, WARC 1990 and others, there is now a delay before the deliberations and stream of resolutions from each WARC meeting and the International Radio Union or ITU publish their reports, but these contain caveats to the effect that much of the detailed technical discussions which take place at the actual meetings may be omitted from the 3 or more volume reports and fresh resolutions issued from these meetings. In general Radio navigation bands operate in all of the three regions as are needed for ships plying the high seas world-wide.
We accept that a 12 ft antenna is as big as most merchant navy ships wish to carry so to meet the two degree horizontal beam requirement there is little point in going to longer wavelengths.
Old Band Name Frequency Range (GHz) ITU RRS No. Notes/Bandwidth S 2.7-2.9 109 S 2.9-3.1 109 S 3.1-3.3 109 C 5.460-5470 115 only 10 MHz C 5.470-5.650 119 90 MHz
5.70-8.850 125 9.20-9.30 125
X 9.3-9.5 125 existing band 9.5-9.8 125 300 MHz
J 14-14.25 133 250 MHz 14.25-14.3 133 only 50 MHz 24.05-25.25 142 200 MHz 24.25-25.25 144 1 GHz
At mm wavelengths water and gas absorption limits the working range particularly over the sea where water vapour is always present so above 15 GHz few equipment's are at sea except perhaps on research vessels.
The problem is not only meeting the above regulation as amended but overriding national ones as well. Also, there may be others which at first sight may not to be relevant but one can find out too late. Finally the “Health and Safety” aspects need to be covered wherever sales are proposed and made.
Also, the eye safety aspects close to a microwave radiator, without being sure it seems that people falling on a deck or having a big scanner start up and bang someone's head come high on the list of accidents that have occurred. The only microwave accident cost a firm a new shirt as the service engineer had some flash bulbs in his pocket which went off and burnt his shirt, he might have had a burn from the shirt catching fire, but do take care.
18
c
Appendix 3: Report on the Performance Degradation of Civilian Marine Radar Due to Close By Obstacles
10 APPENDIX 2 Glossary of Radar Terms
2D two-dimensional 3D three-dimensional A antenna physical aperture Ae effective aperture A ac alternating current A/D analogue to digital (ADC) AFC automatic frequency control ADT automatic detection and tracking AGC automatic gain control AIC adaptive interference canceller AM amplitude modulation A Scope Range amplitude display asl above sea level ATA automatic tracking aid ATC air traffic control B Frequency bandwidth Bn Receiver noise bandwidth BPF band pass filter B Scope Range azimuth display
velocity of EM waves in vacuum CA cell averaging CAA Civil Aviation Authority UK term CAGO cell averaging greatest of CCD charge-coupled device CFAR constant false alarm rate cm centimetre CMR civil marine radar COTS commercial-off-the shelf CP Circular polarisation CRT Cathode ray tube CW continuous wave D/A digital-to-analog dB decibel dBm decibel wrt to 1 mw dBW decibel wrt 1 watt DERA Defence Evaluation and Research Agency UK DF direction finding deg degree DIC digital integrated circuit dti Department of Trade and Industry DST display storage tube ECM electronic counter measures ECCM electronic counter counter measures
19

Appendix 3: Report on the Performance Degradation of Civilian Marine Radar Due to Close By Obstacles
EM Electromagnetic EMC Electromagnetic compatibility EMI UK firm [Defence part now taken over by Racal itself now Thales part of Thompson CSF] EMI electro magnetic interference ERP effective radiated power F noise factor FAA Federal Aviation Authority FET field-effect transistor FFT fast fourier transform FM frequency modulation FD frequency diversity FM/CW Frequency modulated Continuous Wave type of active radar FTC fast time constant G gain (power) FN Noise figure or NF fc carrier frequency GHz gigahertz GRT gross registered tonnage HF high frequency HP horizontal polarisation HH Horizontal transmit and horizontal receive polarisation HPF high pass filter HV Horizontal transmit and vertical receive polarisation Hz hertz IAGC instantaneous automatic gain control IC integrated circuit IF Intermediate frequency IFF identification friend or foe ( old WW l l term ) IFM instantaneous frequency measurement I/Q in-phase/quadrature IR Infrared k Planks constant KF Kalman filter km kilometre kW kilowatt LCD liquid crystal display LNA low noise amplifier LO local oscillator log amp logarithmic amplifier LOS line of sight LP linear polarisation LPF low pass filter LSB least significant bit m metre
20

Appendix 3: Report on the Performance Degradation of Civilian Marine Radar Due to
MDS MHz MIC mm MoT mW MW MTBF MTI MTD NF nm NRL OR OSC Pd
Pfa
pdf PLD PLO PM PN PPI PPM PRF PRI PSD PW Q R&D RAM RCS RF RAM ROM
Rx T/R SAR SCV SLC SNR STC SSR TCR Tx
Close By Obstacles
minimum detectable signal megahertz microwave integrated circuit millimetre Ministry of Transport milliwatt megawatt mean time between failures moving target indicator moving target detector noise factor nautical mile Naval Research Laboratory USA (1) operating range, (2) operational requirementoscillator probability of detection probability of false alarm probability density function pulse length discriminator phase locked oscillator phase modulation pseudo noise plan position indicator (1) pulse position modulation, or (2) parts per millionpulse repetition frequency pulse repetition interval phase sensitive detector pulse width quality factor of tuned circuit research and development radar absorbent material radar cross section radio frequency random access memoryread only memory receiver transmitter receiver (1) search and rescue (2) synthetic aperture radarsub clutter visibility side lobe cancellation signal to noise ratio S/N sensitivity time control or swept gain secondary surveillance radar target to clutter ratio S/C transmitter
21

Appendix 3: Report on the Performance Degradation of Civilian Marine Radar Due to Close By Obstacles
UHF ultra high frequency VCO voltage controlled oscillator VH vertical transmit and horizontal receive polarisation VHF very high frequency VLSIC very large scale integrated circuit VDU visual display unit, TV raster type. VH vertical transmit and horizontal receive polarisation VP vertical polarisation VTMS vessel traffic management system VV vertical transmit and vertical receive polarisation X-POL cross polarisation XPD cross polarisation discrimination XTAL crystal, usually quartz. Z impedance
22

Published by the Health and Safety Executive 12/06
Health and Safety Executive
Overview of collision detection in the UKCS
For many years the primary resource for monitoring and appraisal of the collision risks to UKCS offshore oil and gas installations posed by approaching vessels was the attendant ERRV and for the many units this is still the case. However, collision threat detection via radar watchkeeping is just one of a number of duties that the ERRV crew needs to conduct. Notwithstanding the foregoing, it is known that the tools they had to work with for collision threat detection were subject to a number of limitations. More recently there have been technological advancements leading to the relatively limited deployment of automated radar detection and tracking systems, the so called ‘hybrid’ radar, to supplement the work of the ERRV crews and assist in the overall collision risk management strategy. Other changes in the global regulatory regime of the marine industry has also seen the implementation of automatic identification system (AIS) equipment which may also have an impact on vessel identification and the processes through which an errant vessel may be warned off when approaching an installation. These factors were investigated in detail during the course of the study and the results are discussed both for how they affect current operations and may be adopted in the future to enhance offshore safety.
This report and the work it describes were funded by the Health and Safety Executive (HSE). Its contents, including any opinions and/or conclusions expressed, are those of the author alone and do not necessarily reflect HSE policy.
RR514
www.hse.gov.uk


