35
Overview of Higher Education Trends: Returns and Financing Highlights from EAG 2014 29 September 2014 Patricia Mangeol OECD Higher Education Programme Directorate for Education and Skills
| Date post: | 21-Dec-2015 |
| Category: |
Documents |
| Upload: | audra-oneal |
| View: | 214 times |
| Download: | 0 times |

Overview of Higher Education Trends: Returns and FinancingHighlights from EAG 2014
29 September 2014
Patricia Mangeol
OECD Higher Education Programme
Directorate for Education and Skills

• Higher education attainment and returns – What is the relationship between HE and Skills?– Is higher education still a strong protection against
unemployment? – What are some of the non-financial returns?
• Financing higher education– How much do countries spend per student across the OECD
and who pays?– How have funding models and student aid systems evolved?
• Impact of the crisis and key challenges:– Impact of crisis on returns and financing– How to make HE high quality and relevant to the labour
market, while maintaining affordability and expanding access?
2
Key Questions on OECD Trends

3
The Rate of People with HE Still RisesIs
rae
l
Un
ited
Sta
tes
Ge
rma
ny
Bra
zil
Est
on
ia
Au
stri
a
Ru
ssia
n F
ed
era
tion
Fin
lan
d
Ch
ile
Tu
rke
y
Ita
ly
De
nm
ark
Me
xico
Sw
itze
rla
nd
Ne
w Z
ea
lan
d
Ca
na
da
Slo
vak
Re
pu
blic
Ice
lan
d
Au
stra
lia
Gre
ece
Sw
ed
en
EU
21
Ave
rag
e
OE
CD
ave
rag
e
No
rwa
y
Hu
ng
ary
Ne
the
rla
nd
s
Cze
ch R
ep
ub
lic
Un
ited
Kin
gd
om
La
tvia
Po
rtu
ga
l
Be
lgiu
m
Slo
ven
ia
Sp
ain
Fra
nce
Lu
xem
bo
urg
Ire
lan
d
Jap
an
Po
lan
d
Ko
rea
- 10
0
10
20
30
40
50
60
70
-10
0
10
20
30
40
50
60
70
Difference between the 25-34 and 55-64 year-old population with tertiary education (right axis)
Proportion of the 25-34 year-old population with tertiary education (left axis)
Proportion of the 55-64 year-old population with tertiary education (left axis)% Percent-age points
Chart A1.3 – EAG2014
25-34 and 55-64 year-olds with tertiary education, and percentage-point difference between these groups

4
Educational Upward Mobility in Many Countries – With Large Variations
Czech RepublicGermany
AustriaUnited States
Slovak RepublicItaly
NorwayDenmark
England/N. Ireland (UK)Spain
AverageAustralia
JapanSwedenEstoniaCanada
NetherlandsPolandIrelandFrance
Flanders (Belgium)Finland
KoreaRussian Federation*
- 10 20 30 40 50 60 70
Upward mobility
Downward mobility
Chart A4.3 – EAG 2014
Percentage of 25-64 year-old non-students whose educational attainment is higher than (upward mobility) or lower than (downward mobility)

5
But Mobility Did Not Trickle Down to the Disadvantaged
Japa
n
Cana
da
Nor
way
Swed
en
Esto
nia
Ger
man
y
Den
mar
k
Net
herl
ands
Aust
ralia
Flan
ders
(Bel
g...
Uni
ted
Stat
es
Russ
ian
Fede
rat..
.
Finl
and
Aver
age
Engl
and/
N. I
rela
...
Aust
ria
Irel
and
Fran
ce
Kore
a
Pola
nd
Slov
ak R
epub
lic
Czec
h Re
publ
ic
Spai
n
Italy
-
10
20
30
40
50
60
70
80
90
100
Parents with tertiary educationParents with upper secondary or post-secondary non-tertiary education as highest level of attainmentParents with educational attainment below upper secondary education
%
Chart A4.1 – EAG 2014
Parents with tertiary education
Percentage of 20-34 year-olds in tertiary education, by parental attainment (2012)

HE AND SKILLS
6

7
HE and Skills: A Rocky RelationshipJa
pan
Net
herla
nds
Fin
land
Sw
eden
Aus
tral
ia
Cze
ch R
epub
lic
Fla
nder
s (B
elgi
um)
Nor
way
Uni
ted
Sta
tes
Ave
rage
Pol
and
Aus
tria
Eng
land
/N. I
rela
nd (
UK
)
Slo
vak
Rep
ublic
Fra
nce
Ger
man
y
Den
mar
k
Irel
and
Kor
ea
Can
ada
Est
onia
Spa
in
Italy
Rus
sian
Fed
erat
ion
200
220
240
260
280
300
320
Below upper secondary education Upper secondary or post-secondary non-tertiary education Tertiary education
Chart A1.4 – EAG 2014
Mean literacy score, by educational attainment (2012)

8
Proportions of Highly Literate, Tertiary Educated Adults Vary Across Countries Ja
pan
Fin
land
Net
herla
nds
Sw
eden
Aus
tral
ia
Nor
way
Fla
nder
s (B
elgi
um)
Eng
land
/N. I
rela
nd ..
.
Uni
ted
Sta
tes
Cze
ch R
epub
lic
Ave
rage
Pol
and
Can
ada
Aus
tria
Ger
man
y
Irel
and
Fra
nce
Den
mar
k
Est
onia
Slo
vak
Rep
ublic
Kor
ea
Rus
sian
Fed
erat
ion
Spa
in
Italy
0
5
10
15
20
25
30
35
40
Below upper secondary education Upper secondary or post-secondary non-tertiary education
Tertiary education%
Chart A1.5 – EAG 2014
Percentage of adults scoring at literacy proficiency Level 4/5 in the Survey of Adult Skills, by educational attainment (2012)

9
And Skill Levels Matter for Earnings, Even Within the Same Education Level
Below upper secondary ed-
ucation
Upper secondary or post-sec-
ondary non-ter-tiary education
Tertiary educa-tion
All levels of ed-ucation
0
1000
2000
3000
4000
5000
AverageEquivalent USD Level 4 or 5
Level 3
Level 2
Level 1 or below
Mean monthly earnings, by educational attainment and literacy proficiency level – Average
Chart A6.4 – EAG 2014

10
RETURNS TO HIGHER EDUCATION: RECENT
FINDINGS

11
Individuals with HE Have Higher Employment Rates …Ic
elan
d 18
Nor
way
25
Switz
erla
nd 2
1Sw
eden
25
Ger
man
y 30
Net
herl
ands
25
Aust
ria
31D
enm
ark
25La
tvia
34
Braz
il 19
Slov
enia
38
Isra
el 3
8Lu
xem
bour
g 22
Pola
nd 4
5Be
lgiu
m 3
7Au
stra
lia 1
8Fr
ance
29
Finl
and
29Ch
ile1
24U
nite
d Ki
ngdo
m 2
7N
ew Z
eala
nd 1
6Cz
ech
Repu
blic
43
OEC
D a
vera
ge 2
8Ru
ssia
n Fe
dera
tio...
Esto
nia
32Po
rtug
al 1
9Ca
nada
25
Mex
ico
16U
nite
d St
ates
27
Slov
ak R
epub
lic 4
9Ir
elan
d 36
Japa
n
H
unga
ry 4
1Ita
ly 2
8Sp
ain
28Ko
rea
12Tu
rkey
25
Gre
ece
24
20
30
40
50
60
70
80
90
100
Below upper secondary education Upper secondary or post-secondary non-tertiary education Tertiary education%
Percentage point difference in em-ployment rates between people with below upper secondary and ter-tiary qualifications
Chart A5.1 – EAG 2014

12
... And Higher EarningsH
un
ga
ry
Gre
ece
Slo
ven
ia
Tu
rke
y
Ire
lan
d
Cze
ch R
ep
ub
lic
Au
stri
a
Po
lan
d
Un
ited
Sta
tes
Fra
nce
Slo
vak
Re
pu
blic
Ge
rma
ny
EU
21
ave
rag
e
Lu
xem
bo
urg
OE
CD
ave
rag
e
Po
rtu
ga
l
Isra
el
Fin
lan
d
Ca
na
da
Italy
Sw
itze
rla
nd
Ne
the
rla
nd
s
Un
ited
Kin
gd
om
Sp
ain
Ko
rea
Au
stra
lia
Jap
an
Sw
ed
en
De
nm
ark
Be
lgiu
m
Est
on
ia
No
rwa
y
Ne
w Z
ea
lan
d 100
120
140
160
180
200
220
240
Men Women
Tertiary-type A or advanced research pro-grammes
Index
Chart A6.1 – EAG 2014
Relative earnings, by educational attainment and gender (2012); upper secondary education = 100

13
Individuals with HE Have Better Social Outcomes/ Enjoy Better Quality of Life
Below upper secondary education
Upper sec-ondary or post-sec-
ondary non-tertiary educa-
tion
Tertiary ed-ucation
All 50
60
70
80
90
100Level 1 or below Level 2 Level 3 Level 4 or 5
Below upper secondary education
Upper sec-ondary or post-sec-
ondary non-tertiary educa-
tion
Tertiary ed-ucation
All 10
20
30
40
50
60Level 1 or below Level 2 Level 3 Level 4 or 5%
Below upper secondary education
Upper sec-ondary or post-
secondary non-tertiary education
Tertiary educa-tion
All 5
10
15
20
25
30Level 1 or below Level 2 Level 3 Level 4 or 5
%
Below upper secondary education
Upper sec-ondary or post-
secondary non-tertiary education
Tertiary educa-tion
All 5
10
15
20
25
30 Level 1 or below Level 2 Level 3 Level 4 or 5%
Proportion of adults reporting that they are in good health Proportion of adults reporting that they believe they have a say in government
Proportion of adults reporting that they volunteer at least once a month
Proportion of adults reporting that they can trust others
Chart A8.1 – EAG 2014
14
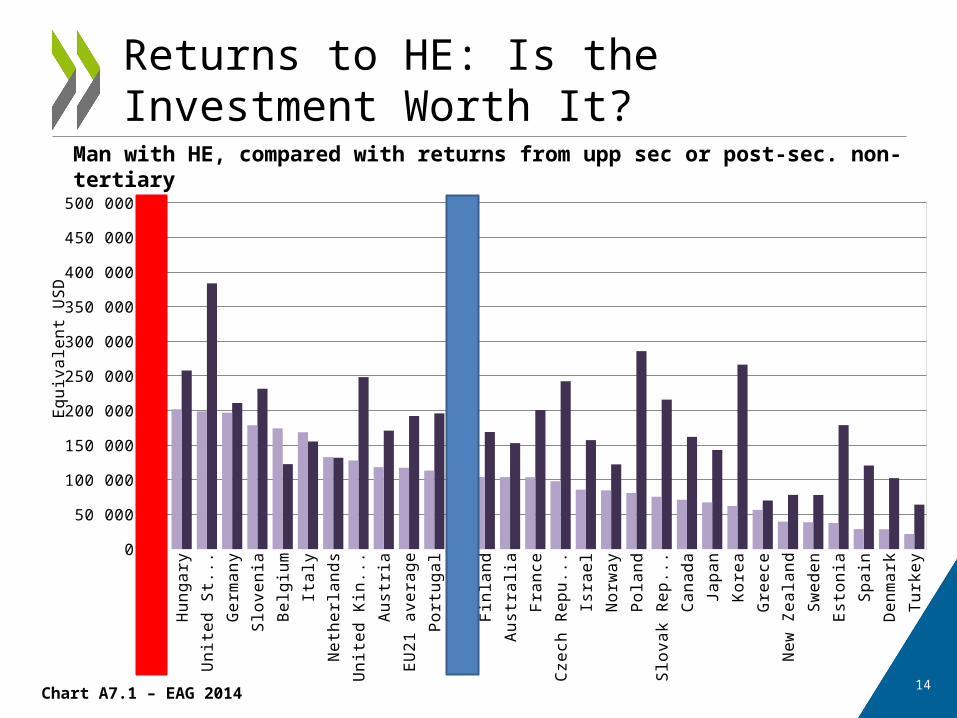
Returns to HE: Is the Investment Worth It?
Tu
rke
y
De
nm
ark
Sp
ain
Est
on
ia
Sw
ed
en
Ne
w Z
ea
lan
d
Gre
ece
Ko
rea
Jap
an
Ca
na
da
Slo
vak
Re
pu
blic
Po
lan
d
No
rwa
y
Isra
el
Cze
ch R
ep
ub
lic
Fra
nce
Au
stra
lia
Fin
lan
d
OE
CD
ave
rag
e
Po
rtu
ga
l
EU
21
ave
rag
e
Au
stri
a
Un
ited
Kin
gd
om
Ne
the
rla
nd
s
Italy
Be
lgiu
m
Slo
ven
ia
Ge
rma
ny
Un
ited
Sta
tes
Hu
ng
ary
Ire
lan
d 0
50 000
100 000
150 000
200 000
250 000
300 000
350 000
400 000
450 000
500 000
Eq
uiv
ale
nt U
SD
Man with HE, compared with returns from upp sec or post-sec. non-tertiary
Chart A7.1 – EAG 2014

• Net public and private returns increase with the level of education, both for individuals and the public
• “Net present value”: complex calculation and caution needed– Social outcomes are not included – hard to measure but
important
– No distinction along key aspects like field of study
– Contextual factors have an impact (local employment regulations, tax systems, etc)
• But useful to have a broad picture and take into account both the direct and indirect costs and benefits of HE
E.g. foregone earnings, foregone tax revenues for government, but also lesser social transfers
• The question of a potential “oversupply” of HE educated people on returns – no clear answer
15
Returns to HE: What to Keep in Mind

HE FINANCING TRENDS
16

17
State of HE Funding: Per Student Expenditures
Un
ited
Sta
tes
Sw
itze
rla
nd
De
nm
ark
Sw
ed
en
No
rwa
y
Fin
lan
d
Ne
the
rla
nd
s
Ge
rma
ny
Jap
an
Au
stra
lia
Ire
lan
d
Be
lgiu
m
Fra
nce
Au
stri
a
Un
ited
Kin
...
Sp
ain
Isra
el
Bra
zil
Ne
w Z
ea
lan
d
Slo
ven
ia
Italy
Ko
rea
Po
lan
d
Po
rtu
ga
l
Cze
ch R
ep
u...
Hu
ng
ary
EU
21
ave
rag
e
Ice
lan
d
Ch
ile
Tu
rke
y
Slo
vak
Re
pu
...
Me
xico
Est
on
ia
La
tvia
Ind
on
esi
a
02 0004 0006 0008 000
10 00012 00014 00016 00018 00020 00022 00024 00026 00028 000
OECD average
Expenditure per student (equivalent USD con-verted using PPPs)
Annual expenditure per student by educational institutions for all services, tertiary education (2011)
Chart B1.2a– EAG 2014

18
State of HE Funding: Cumulative Expenditures (Over Duration of Studies)
De
nm
ark
Sw
ed
en
Ne
the
rla
nd
s
Fin
lan
d
Sw
itze
rla
nd
Un
ited
Sta
tes
Au
stri
a
Jap
an
Ge
rma
ny
EU
21
ave
rag
e
Fra
nce
Sp
ain
Ire
lan
d
Be
lgiu
m
Italy
Cze
ch R
ep
ub
lic
Un
ited
Kin
gd
om
Ice
lan
d
Isra
el
Ne
w Z
ea
lan
d
Po
lan
d
Est
on
ia
Ko
rea
Slo
ven
ia
Slo
vak
Re
pu
blic
Hu
ng
ary
Me
xico
Tu
rke
y
0
20 000
40 000
60 000
80 000
100 000
120 000
In equivalent USD conver-ted using PPPs
OECD average
Each segment of the bar represents the annual expenditure by educational insti-tutions per student. The number of seg-ments represents the average number of years a student remains in tertiary educa-tion.
Cumulative expenditure per student by educational institutions over the average duration of tertiary studies (2011)
Chart B1.4– EAG 2014

19
Annual Spending Per Student and Rate of Change Between 2005 and 2011
-30 -20 -10 0 10 20 30 40 50 60 705 000
7 000
9 000
11 000
13 000
15 000
17 000
19 000
21 000
23 000
25 000
27 000United States
SwitzerlandDenmarkSweden
Norway FinlandNetherlands Germany
JapanIreland
BelgiumFranceAustria
SpainIsrael
United Kingdom
Brazil Italy
KoreaPolandPortugalCzech Republic
HungaryChileSlovak RepublicMexico Estonia
IcelandRussian Federation
New Zealand
SloveniaR² = 0.0789910852395619
Change in expenditure per student between 2005 and 2011 (%)
Annual expenditure per student (2011,
USD)
Tertiary education
OECD average
OECD av-erage
Tertiary Education
Chart B1.5– EAG 2014

20
State of Financing: Private Expenditures Represent a Larger Share…
Ch
ile
Ko
rea
Un
ited
Kin
gd
om
Jap
an
Un
ited
Sta
tes
Au
stra
lia
Isra
el
Ca
na
da
Ru
ssia
n F
ed
era
tion
Italy
Me
xico
Po
rtu
ga
l
OE
CD
ave
rag
e
Ne
the
rla
nd
s
Po
lan
d
Slo
vak
Re
pu
blic
Sp
ain
EU
21
ave
rag
e
Est
on
ia
Ire
lan
d
Fra
nce
Cze
ch R
ep
ub
lic
Ge
rma
ny
Slo
ven
ia
Au
stri
a
Sw
ed
en
Be
lgiu
m
Ice
lan
d
De
nm
ark
Fin
lan
d
No
rwa
y
0
10
20
30
40
50
60
70
80
90
2011 2008 2000%
Share of private expenditure on tertiary educational institutions (2000, 2008 and 2011)
Chart B3.3 – EAG 2014

21
… But With Large Differences in Recent Patterns Across Countries
Ch
ile
Ko
rea
Un
ited
Kin
gd
om
Jap
an
Un
ited
Sta
tes
Au
stra
lia
Isra
el
Ca
na
da
Ru
ssia
n F
ed
era
tion
Italy
Me
xico
Po
rtu
ga
l
OE
CD
ave
rag
e
Ne
the
rla
nd
s
Po
lan
d
Slo
vak
Re
pu
blic
Sp
ain
EU
21
ave
rag
e
Est
on
ia
Ire
lan
d
Fra
nce
Cze
ch R
ep
ub
lic
Ge
rma
ny
Slo
ven
ia
Au
stri
a
Sw
ed
en
Be
lgiu
m
Ice
lan
d
De
nm
ark
Fin
lan
d
No
rwa
y
- 10- 5 0 5
10 15 20 25 30 35 40 45 50
Difference 2000-2008 Difference 2008-2011 Difference 2000-2011
Percentage points
Change (in percentage points) in the proportion of private expenditure between 2000 and 2011
Chart B3.3 – EAG 2014

22
Fees and Student Aid – Select OECD Countries
0 25 50 75 100 0
1 500
3 000
4 500
6 000
7 500
Australia
AustriaBelgium (Fl.)
Finland
France2
Italy
Japan 3
Netherlands
New Zealand
NorwaySweden
United States1
Switzerland
Chile4
DenmarkTurkey
United Kingdom
Mexico
Average tuition fees charged by public institutions, first degrees programmes, in USD
Belgium (Fr.) (Fr.)
% of students who benefit from public loans AND/OR scholarships/grants
Chart B5.1– EAG 2014
Relationship between:• average tuition fees charged by public institutions and • proportion of students who benefit from public institutions and proportion of students who
benefit from public loans and/or scholarships/grants in tertiary-type A education (2011)
For full-time national students, in USD converted using PPPs for GDP, academic year 2010/11
23
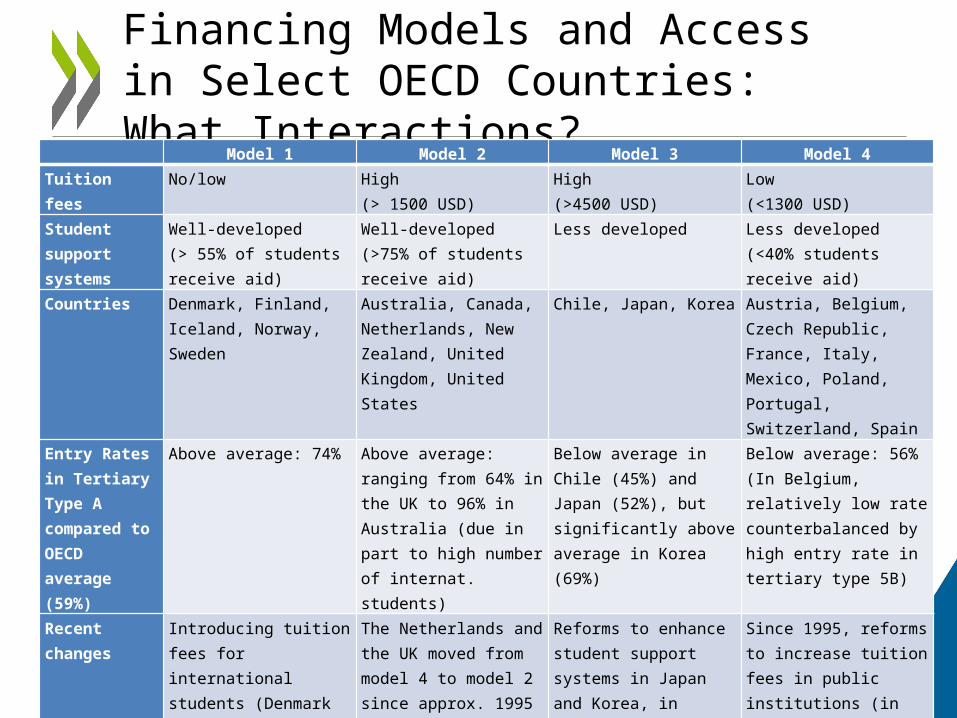
Financing Models and Access in Select OECD Countries: What Interactions?
Model 1 Model 2 Model 3 Model 4Tuition fees No/low High
(> 1500 USD)High(>4500 USD)
Low(<1300 USD)
Student support systems
Well-developed(> 55% of students receive aid)
Well-developed (>75% of students receive aid)
Less developed Less developed(<40% students receive aid)
Countries Denmark, Finland, Iceland, Norway, Sweden
Australia, Canada, Netherlands, New Zealand, United Kingdom, United States
Chile, Japan, Korea Austria, Belgium, Czech Republic, France, Italy, Mexico, Poland, Portugal, Switzerland, Spain
Entry Rates in Tertiary Type A compared to OECD average (59%)
Above average: 74%
Above average: ranging from 64% in the UK to 96% in Australia (due in part to high number of internat. students)
Below average in Chile (45%) and Japan (52%), but significantly above average in Korea (69%)
Below average: 56% (In Belgium, relatively low rate counterbalanced by high entry rate in tertiary type 5B)
Recent changes
Introducing tuition fees for international students (Denmark and Sweden, 2011)
The Netherlands and the UK moved from model 4 to model 2 since approx. 1995 and with recent fee hikes in UK
Reforms to enhance student support systems in Japan and Korea, in addition to existing fee reductions/ exemptions for top students with financial barriers
Since 1995, reforms to increase tuition fees in public institutions (in particular in Austria and Italy)

24
• Ireland is not easy to fit into the four models: tuition fees were abolished but the “student charge” represents an increasing cost to the individual
• Any increase in student charge / tuition fees should be accompanied by the development of robust student aid systems
Issues for Ireland

25
RECENT TRENDS AND IMPACT OF THE CRISIS

26
People Without an Upper Secondary Education Face A Rising Unemployment Risk
Ko
rea
Me
xico
Bra
zil
No
rwa
y
Ch
ile
Au
stra
lia
Lu
xem
bo
urg
Ne
w Z
ea
lan
d
Ne
the
rla
nd
s
Ice
lan
d
Au
stri
a
Sw
itze
rla
nd
Tu
rke
y
De
nm
ark
Isra
el
Un
ited
Kin
gd
om
Ca
na
da
Fin
lan
d
Be
lgiu
m
Ru
ssia
n F
ed
era
tion
Ita
ly
Sw
ed
en
Ge
rma
ny
OE
CD
ave
rag
e
Fra
nce
Slo
ven
ia
Un
ited
Sta
tes
Po
rtu
ga
l
EU
21
ave
rag
e
Po
lan
d
Est
on
ia
Hu
ng
ary
La
tvia
Ire
lan
d
Gre
ece
Cze
ch R
ep
ub
lic
Sp
ain
Slo
vak
Re
pu
blic
0
10
20
30
40
50
2012 2005 2010
Below upper secondary educationUnemployment rates 25-64 year-olds, by educational attainment – below upper secondary education
%

27
Those with an Upper Secondary Education Are Not Immune to Unemployment
Norway
Switzer
land
Austra
lia
Icela
nd
Nethe
rland
s
Japa
n
Ger
man
y
Czech
Rep
ublic
Russia
n Fed
erat
ionChil
e
Belgium
Isra
el
OECD a
vera
ge
Franc
e
United
Sta
tes
EU21 a
vera
ge
Eston
ia
Portu
gal
Latv
ia
Gre
ece
0
10
20
30
40
50
2012 2005 2010%
Unemployment rates 25-64 year-olds, by educational attainment – upper secondary education or post-secondary non-tertiary education

28
While People with Tertiary Education Still Have a Low Risk of Being Unemployed
Norway
Ger
man
y
Switzer
land
Austra
liaBra
zil
Nethe
rland
s
Luxe
mbo
urg
United
King
dom
Hunga
ry
New Z
ealan
dChil
e
United
Sta
tes
Poland
OECD a
vera
ge
EU21 a
vera
ge
Slovak
Rep
ublic
Latv
ia
Irelan
d
Portu
gal
Gre
ece
0
10
20
30
40
50
2012 2005 2010%
Unemployment rates 25-64 year-olds, by educational attainment – tertiary education

29
• HE-educated individuals have lower unemployment rates throughout the period
• In some countries, including Ireland and Southern and Eastern Europe, tertiary-educated people have been hit hard – but UR have increased across all education levels
• Factors leading to unemployment of HE-educated people are complex– Supply side: potential oversupply in some fields, relevance
of degrees to labour market, variations in skill level – But also demand side: economic restructuring and
destruction of jobs, features of national labour market (e.g. minimum wage, hiring/firing rules, etc)
Impact of Crisis on Unemployment Rates – Cont’d

30
Below Upper Secondary
Tertiary
2005 2012 2005 2012
Australia 81 83 134 134
Austria 74 70 158 171
Denmark 82 81 125 128
Germany 89 84 159 174
Hungary 78 78 229 208
Israel 79 71 151 152
Korea 68 71 149 147
New Zealand 81 82 125 123
Sweden 88 82 130 128
Switzerland 76 77 157 158
Turkey 69 63 149 191
United Kingdom 71 70 158 156
United States 71 63 186 174
Evolution of Earnings – Widening Gap
Trends in relative earnings of workers, by educational attainment, in 2005 and 2012
25-64 year-olds with income from employment; upper secondary education = 100
Table A6.2aEAG 2014

31
Moderate Cuts in Educational Funding So Far Despite GDP Declining
Un
ited
Kin
gd
om
Cze
ch R
ep
ub
lic
Ne
w Z
ea
lan
d
De
nm
ark
Slo
vak
Re
pu
blic
Bra
zil
Fin
lan
d
Au
stra
lia
Ire
lan
d
Ne
the
rla
nd
s
Jap
an
Sw
itze
rla
nd
Ge
rma
ny
Slo
ven
ia
Ch
ile
Ca
na
da
Po
rtu
ga
l
Me
xico
Ko
rea
OE
CD
ave
rag
e
Au
stri
a
Sp
ain
EU
21
ave
rag
e
No
rwa
y
Be
lgiu
m
Fra
nce
Sw
ed
en
Isra
el
Ice
lan
d
Un
ited
Sta
tes
Ru
ssia
n F
ed
era
tion
Po
lan
d
Est
on
ia
Italy
Hu
ng
ary
80
85
90
95
100
105
110
115
120
125
130
Change in public expenditure on educational institutions Change in Gross Domestic Product
Change in expenditure on education institutions as a percentage of GDP
Index of change (2008=100)
Impact of the economic crisis on public expenditure on education 2008-2011
Chart B2.3 – EAG 2014

32
But in Some Countries Funding Per Student in HE Has Not Kept Pace with Enrolments
EstoniaSlovak Republic
ChileHungary
KoreaCzech Republic
FinlandSlovenia Denmark
Russian FederationIsrael Japan
United KingdomItaly
PolandOECD average EU21 average
Netherlands SwitzerlandFrance
Sweden Germany AustraliaBrazil Spain
Norway Mexico Belgium PortugalAustria
United StatesIreland Iceland
80
90
100
110
120
130
140
150
Change in expenditure Change in the number of students (in full-time equivalents) Change in expenditure per student
Index of change (2008=100)
Chart B1.6. Changes in the number of students and changes in expenditure per student by educational institutions, by level of education (2005, 2010)Index of change between 2005 and 2010 (2005 = 100, 2010 constant prices )
Change in expenditure per student by educational institutions, tertiary education (2008, 2011)
Chart B1.6 – EAG 2014

33
• High employment rates and earnings signal a strong need for highly-qualified people – and a highly qualified population is important for long-term growth
• But in some countries the unemployment rate for tertiary-educated people has increased substantially
• HE needs to meet the needs of the labour market and be responsive to structural economic shifts e.g., need for HE to prepare for 21st century skills, new forms of work like entrepreneurship, etc.
The Crisis Has Revealed Some Weaknesses of HE

34
• Traditional funding schemes are under pressure – need for more effective business models. – Clarify and enhance value proposition of HEIs in a globally
competitive environment
– Identify cost-reducing/ cost-stabilising strategies where possible
– Seek alternative revenues – while recognising limitations of those relying mostly on cost-sharing
• Promote quality in a constrained environment– Range of methods to promote quality teaching and learning
– outcomes of IMHE teaching quality reviews 2012
– Funding research excellence: combining funding approaches to promote competitiveness while maintaining diversity
Implications for HEIs


