25
Overview of Maryland Medicaid Data Shannon McMahon Deputy Secretary, Health Care Financing Updating Readmission Strategies for 2015: A Focus on Medicaid April 1, 2015 0

Overview of Maryland Medicaid Data
Shannon McMahon
Deputy Secretary, Health Care Financing
Updating Readmission Strategies for 2015:
A Focus on Medicaid
April 1, 20150
Overview
1
• Medicaid Population
• Managed Care
• Expansion Populations
• Trends and Initiatives

MARYLAND MEDICAID POPULATION
2
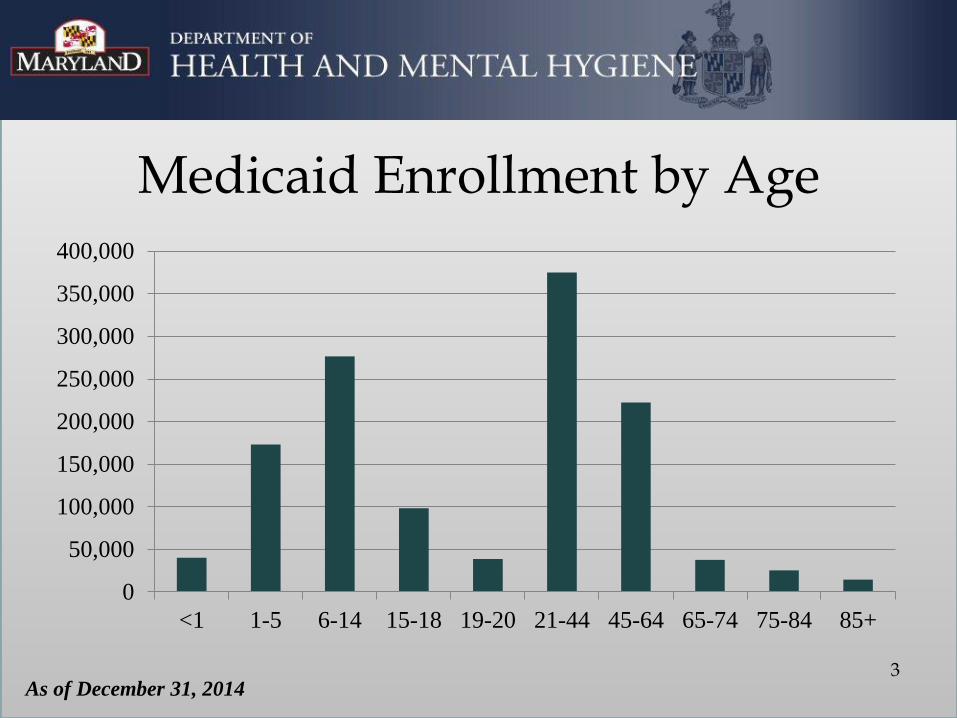
Medicaid Enrollment by Age
<1 1-5 6-14 15-18 19-20 21-44 45-64 65-74 75-84 85+
0
50,000
100,000
150,000
200,000
250,000
300,000
350,000
400,000
3As of December 31, 2014

Medicaid Enrollment by Gender
56%
44%
Gender
Female
Male
0100,000200,000300,000400,000500,000600,000700,000800,000
Gender by Coverage Group
Female
Male
4As of December 31, 2014

County Enrollment
Allegany 20,628
Anne Arundel 83,821
Baltimore City 266,096
Baltimore County 172,664
Calvert 14,090
Caroline 10,869
Carroll 21,487
Cecil 24,745
Charles 28,469
Dorchester 12,303
Frederick 37,196
Garrett 8,187
Harford 39,598
County Enrollment
Howard 39,535
Kent 4,974
Montgomery 175,281
Prince George’s 212,222
Queen Anne’s 8,531
Somerset 8,161
St. Mary’s 21,268
Talbot 7,896
Washington 38,922
Wicomico 31,256
Worcester 12,453
Out of state 1,101
Unknown 1
Total Medicaid Enrollment by County as of December 31, 2014
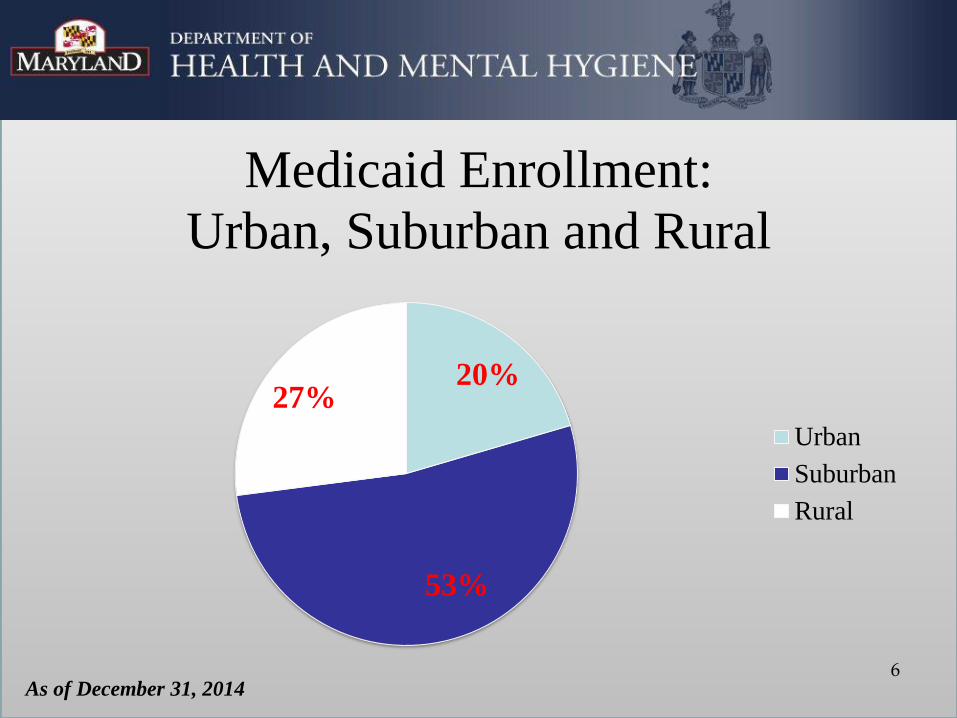
20%
53%
27%
Medicaid Enrollment:
Urban, Suburban and Rural
Urban
Suburban
Rural
6As of December 31, 2014

Chronic Health Home• Eligibility
– Severe and persistent mental illness
– Opioid substance use disorder (at risk for second chronic condition)
– Children with serious emotional disturbance
• Services– Comprehensive care management
– Care coordination
– Health promotion
– Comprehensive transitional care
– Individual and family support
– Referral to community and social supports 7

Chronic Health Home
• Provider Types
– Psychiatric Rehabilitation Programs (56)
– Mobile Treatment (10)
– Opioid Treatment Programs (4)
• Enrollment: 4,708
8As of December 31, 2014

MEDICAID MANAGED CARE
9

HealthChoice Managed Care Program
• HealthChoice is Maryland’s Medicaid managed care program
– Authority: §1115 Demonstration waiver; mandatory enrollment in HealthChoice managed care organizations began in 1997
– Budget neutrality: Total Medicaid costs—including carved-out services—must not exceed what they would have been without the waiver
• At the end of CY 2014, approximately 1,061,000 people were
enrolled in HealthChoice, including nearly 597,000 children under
age 21
• In Maryland, about 82% of Medicaid beneficiaries receive services through HealthChoice
10

Managed Care OrganizationsMCO Counties
Amerigroup Statewide (frozen in Talbot County)
Jai Medical Systems Baltimore City and Baltimore County
Kaiser Permanente Anne Arundel, Baltimore County, Calvert, Charles, Harford,
Howard, Montgomery, Prince George’s and St. Mary’s
Maryland Physicians
Care
Statewide
MedStar Anne Arundel, Baltimore City, Baltimore County, Charles,
Harford, Montgomery, Prince George’s, St. Mary’s
Priority Partners Statewide (frozen in Cecil and Frederick Counties)
Riverside Statewide minus Allegany, Garrett and Washington
United Healthcare Statewide (frozen in fifteen counties)11

HealthChoice MCO Market Share
12
AmeriGroup
25%
JAI Medical
Systems
2%
*Kaiser
1%
Maryland
Physicians Care
19%MedStar Family
Choice
6%
Priority Partners
23%
Riverside
3%
United
Healthcare
21%
As of December 31, 2014
Carved-out Services
• Mental health services and substance abuse treatment
services are managed by Value Options
• Long-term services and supports
• Comprehensive dental care for pregnant women and
children is managed by DentaQuest
• Certain drugs
13

Non-HealthChoice Populations
• Some individuals receive Medicaid services on a fee-for-service (FFS) basis:
– Dually-eligible for Medicaid and Medicare
– Institutionalized
– Spend-down
– Model Waiver for Medically-Fragile Children participants
– Family planning program waiver participants
– New Medicaid eligibles until enrolled in MCO
– Enrollees in rare and expensive case management (REM) (within HealthChoice program)
14

15
ACA Expansion Populations
• Expansion
– Childless adults
– Higher-income parents
– Former foster youth
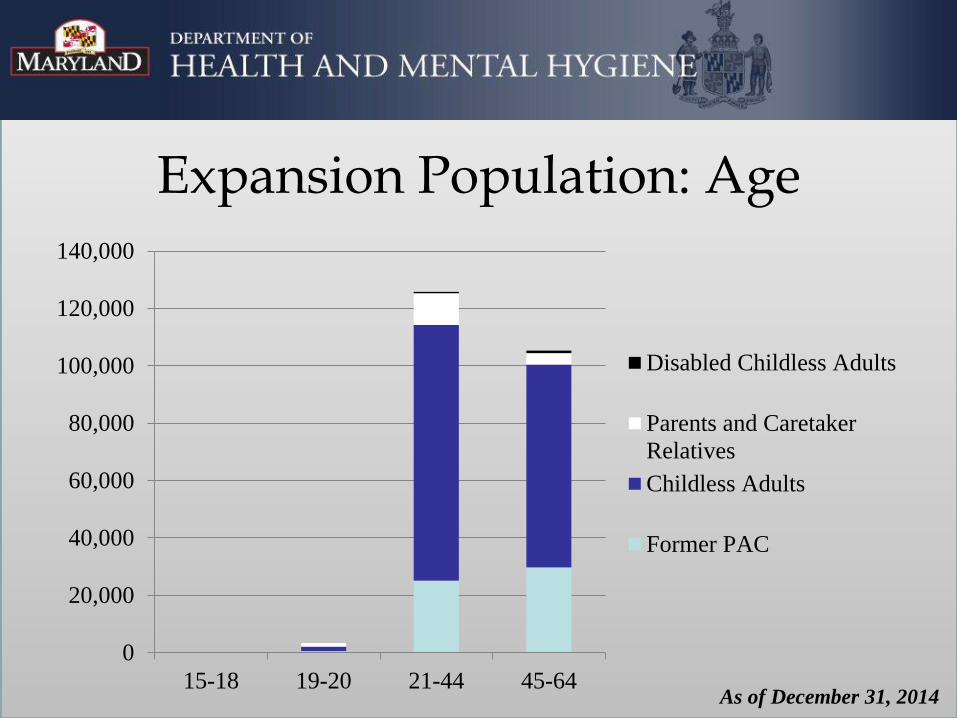
Expansion Population: Age
0
20,000
40,000
60,000
80,000
100,000
120,000
140,000
15-18 19-20 21-44 45-64
Disabled Childless Adults
Parents and Caretaker
Relatives
Childless Adults
Former PAC
As of December 31, 2014

County Enrollment
Allegany 3,611
Anne Arundel 15,948
Baltimore City 51,832
Baltimore County 29,945
Calvert 2,997
Caroline 1,682
Carroll 4,017
Cecil 4,791
Charles 5,202
Dorchester 2,202
Frederick 6,416
Garrett 1,510
County Enrollment
Harford 7,084
Howard 7,402
Kent 1,104
Montgomery 32,100
Prince George’s 34,805
Queen Anne’s 1,589
Somerset 1,524
St. Mary’s 4,012
Talbot 1,606
Washington 6,115
Wicomico 5,511
Worcester 2,962
Total Medicaid expansion enrollment by county as of December 31, 2014

Expansion Population by MCO
Amerigroup;
36,783
Jai; 10,528
Kaiser
Permanente;
3,393
MPC; 29,357
Medstar; 19,050Priority Partners;
29,054
Riverside;
11,323
UHC; 56,625
18As of December 31, 2014

TRENDS AND INITIATIVES
19
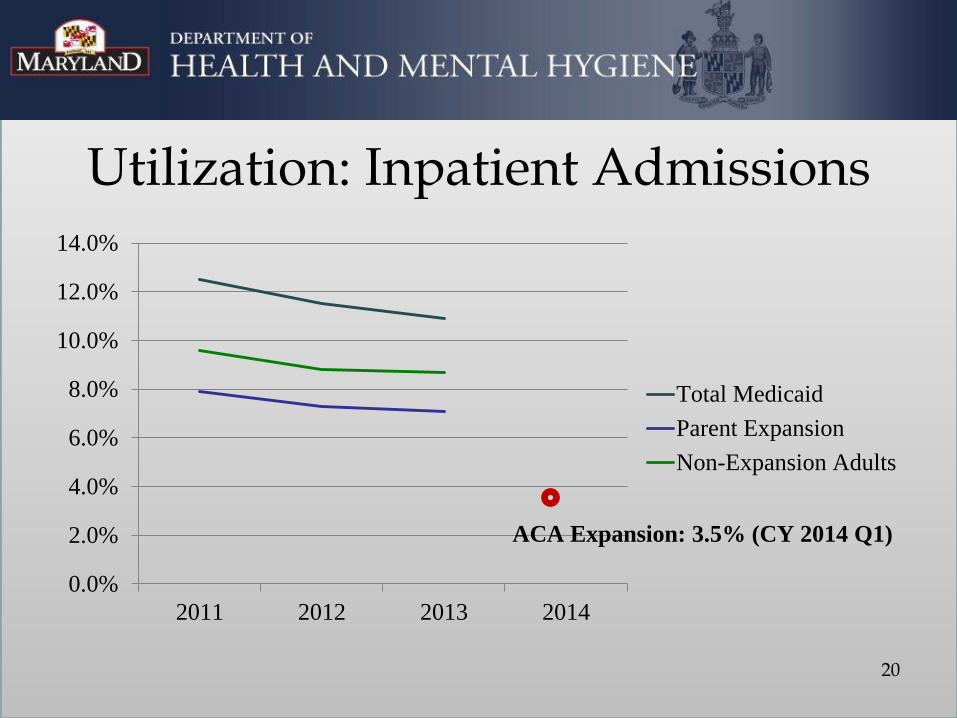
Utilization: Inpatient Admissions
0.0%
2.0%
4.0%
6.0%
8.0%
10.0%
12.0%
14.0%
2011 2012 2013 2014
Total Medicaid
Parent Expansion
Non-Expansion Adults
ACA Expansion: 3.5% (CY 2014 Q1)
20
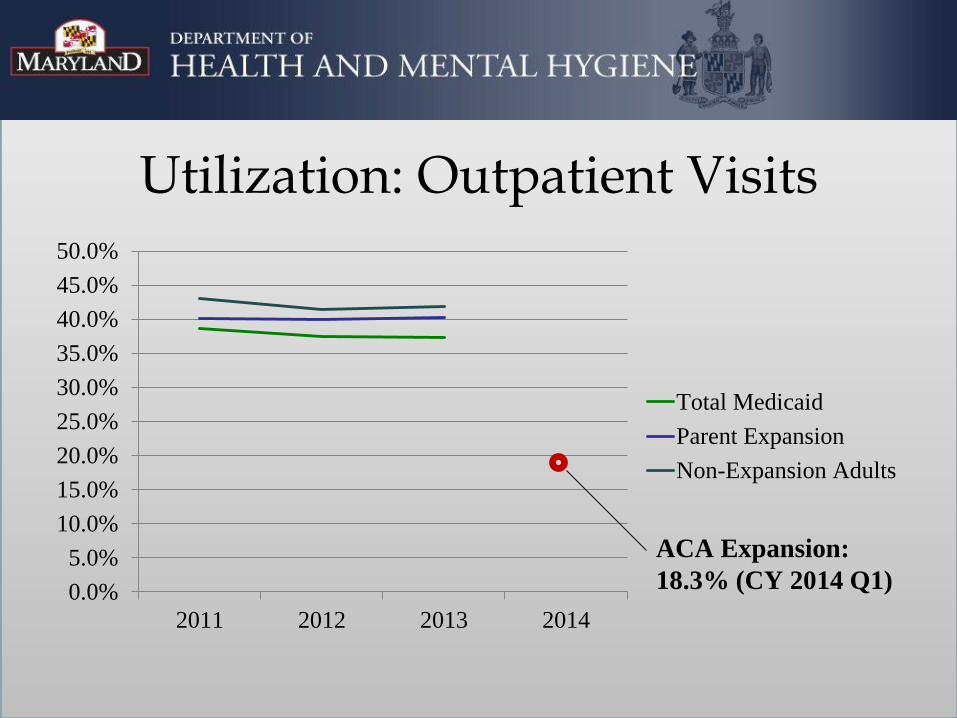
Utilization: Outpatient Visits
0.0%
5.0%
10.0%
15.0%
20.0%
25.0%
30.0%
35.0%
40.0%
45.0%
50.0%
2011 2012 2013 2014
Total Medicaid
Parent Expansion
Non-Expansion Adults
ACA Expansion:
18.3% (CY 2014 Q1)

Medicaid Readmissions: Q3, 2013-2014
22
0%
2%
4%
6%
8%
10%
12%
14%
16%
18%
20%
Commercial Medicaid Medicare FFS Other
Unadjusted Readmission Rate
0
2,000
4,000
6,000
8,000
10,000
12,000
Commercial Medicaid Medicare FFS Other
Number of Readmissions
Medicaid had an 11% reduction in the readmission rate.

Medicaid Priorities
23

Questions?
24


