30
Overview of recent tropical cyclone lightning research at CIRA/RAMMB Andrea Schumacher, CIRA / Colorado State University John Knaff, NOAA / NESDIS / STAR 21 May 2015
| Date post: | 26-Sep-2018 |
| Category: |
Documents |
| Upload: | truongnhan |
| View: | 213 times |
| Download: | 0 times |

Overview of recent tropical cyclone lightning research at
CIRA/RAMMB!!
Andrea Schumacher, CIRA / Colorado State University!John Knaff, NOAA / NESDIS / STAR!
21 May 2015!

Introduction!
� CIRA/RAMMB TC group’s main focus is on applied research and product development!
� Work closely with operational partners (e.g., NHC, CPHC, JTWC, WFOs)!
� Vast array of TC research topics: genesis, intensity change, RI/RW, structure, model diagnostics, statistical model development!
� Recent work involving TCs and lightning!� Relationships between inner core / rainband lightning and intensity
change!� TC lightning and genesis (not discussing today)!� Scaling of lightning and IR predictors based on TC structure and size!
2!

Relationship between lightning activity and TC intensity change!� Basic theory!
� Increased lightning activity in inner core à deep, active convection (hot towers) in inner core à intensification!
� Nature of relationship still uncertain!� Past research has found inner core lightning bursts precede
intensification while other studies show they precede weakening!
� Many complicating factors!� Vertical shear to be linked to both TC intensity change and lightning
activity, yet has opposite impacts!� Other related variables: SSTs, storm motion, microphysics!� Not all inner core convection is the same (inside RMW vs. outside)!
3!

Statistical analysis (DeMaria et al. 2012)!
� Data!� World Wide Lightning Location Network (WWLLN)!
� Global flashes, 2005-2010!� Provided by University of Washington !
� OTD/LIS global lightning climatology (Cecil et al. 2012)!� OTD from May 1995 to 2000, LIS from 1998-2010!� 0.5 degree global grid!� Annual mean flash rate, converted to density (flashes km-2 year-1)!
� Atlantic and E. Pacific Best Tracks (2005-2010)!� TC location and intensity every 6 hours!
� SHIPS diagnostic files (2005-2010) for TC-environment shear & SST!4!
Figure 1 from DeMaria et al. 2012

Methodology - azimuthal averaging!
� Eyewall, r=0-50 km!
� Inner Core, r=0-100 km!
� Rainband, r=200-300 km!
� For this study, azimuthal average lightning density (flashes km-2 year-1) is examined!
0 50 100 200 300
Rainband!
Eye-wall!
Inner core!
r 5!

Summary of Results!� Increase in eyewall core
lightning density preceding weakening (similar signal for rapid weakening cases)!
� Increase in rainband lightning preceding intensification!
� Largest inner core lightning outbreaks associated with TCs experiencing high shear over warm SSTs!
6!

Lightning-based Rapid Intensification Index!
� Incorporates results of DeMaria et al. 2012 (D12) into RII!
� Uses azimuthal average WWLLN lightning density!
� RII algorithm modified to include lightning predictors!� Rain band lightning favors RI!� Inner core lightning signals end of RI
period !
� Lightning/No lightning versions run !
Inner core Region
Rain band Region
7!

RII Predictor Weights!
8!
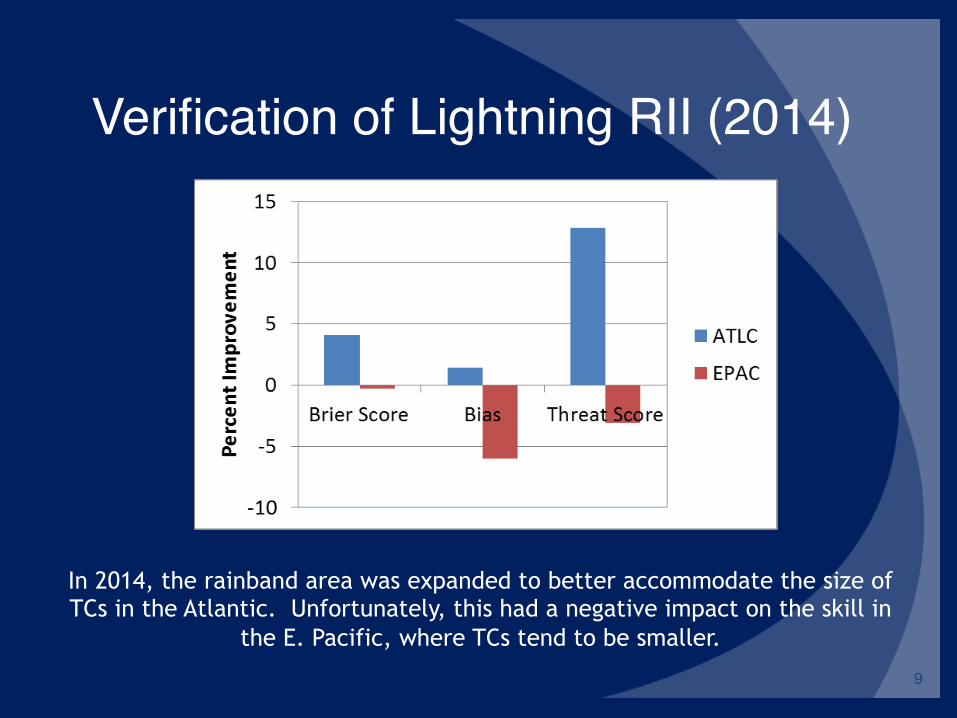
Verification of Lightning RII (2014)!
9!
In 2014, the rainband area was expanded to better accommodate the size of TCs in the Atlantic. Unfortunately, this had a negative impact on the skill in
the E. Pacific, where TCs tend to be smaller.

Relationship between TOTAL lightning and TC intensity change!
� GOES-R Risk Reduction (FY14-16) project to prepare for Geostationary Lightning Mapper (GLM)!
� Expanding on DeMaria et al. 2012!� Research suggests total lightning / IC may have stronger
correlation with deep convective activity!� Investigate asymmetric lightning predictors!
� Using Earth Networks Total Lightning Network (ENTLN) as proxy for total lightning!� Larger detection efficiencies over portions of tropical
oceans than WWLLN!� Total lightning (higher DE for IC?)!
10!

Geostationary Lightning Mapper!� Single-channel, near-infrared optical transient detector!
� Detects momentary changes in optical scene, indicating lightning!
� Will measure total lightning activity continuously with a high detection efficiency (expected 70-90%) and near-uniform spatial resolution of 10km (8km nadir, 14km edge fov)!
� Unprecedented view of lightning in tropical cyclones!� Ground-based networks!
� Lower DE over oceans (highest estimated 30-35%, Rudlosky 2014)!� Mostly CG!
� TRMM/LIS!� Low temporal frequency!
11!http://www.goes-r.gov/spacesegment/glm.html

Data!
� WWLLN, Best track, OTD/LIS climatology, and SHIPS diagnostics data same as used for DeMaria et al. 2012!
� Total Lightning Data provided by Earth Networks, Inc. (ENTLN)!� Global flashes, 2011-2014!� Adjusted to account for time variability in detection efficiency!� Provided by B. Callahan, Earth Networks!
12!
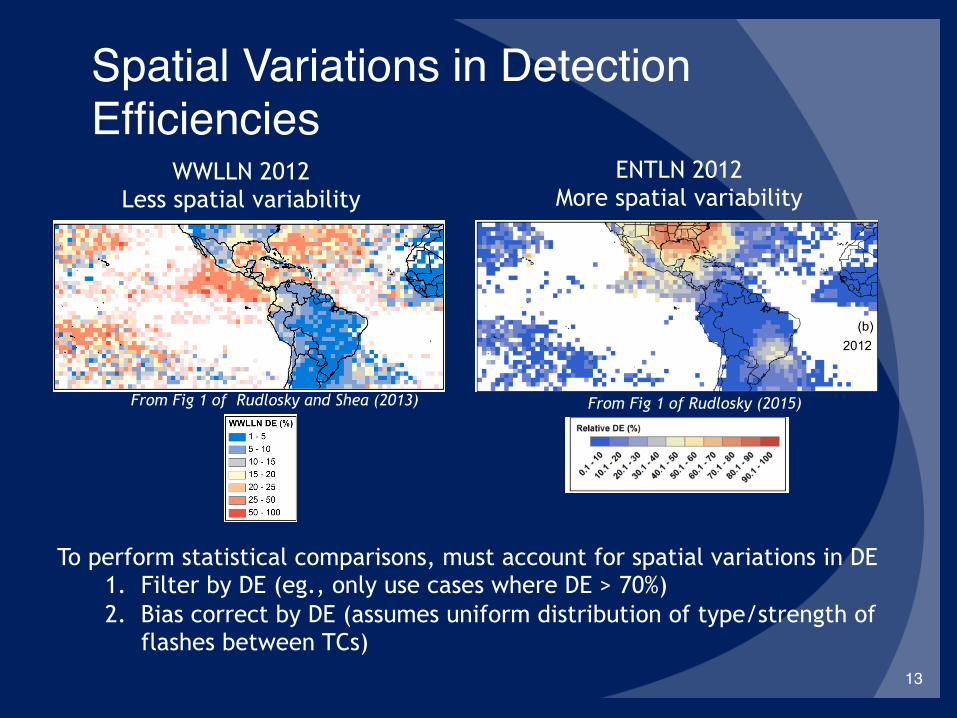
From Fig 1 of Rudlosky and Shea (2013) From Fig 1 of Rudlosky (2015)
WWLLN 2012 Less spatial variability
ENTLN 2012 More spatial variability
Spatial Variations in Detection Efficiencies!
To perform statistical comparisons, must account for spatial variations in DE 1. Filter by DE (eg., only use cases where DE > 70%) 2. Bias correct by DE (assumes uniform distribution of type/strength of
flashes between TCs) 13!

“Crude” ENTLN Total Lightning DE!
DE (year) = # ENTLN flashes (year) / # flashes LIS climatology
%
14!

Atlantic 2011-2014 (DE > 70%) N = 175
Atlantic 2011-2014 (BC by cDE) N = 778
Small sample vs. oversimplified bias correction methodology 15!

Spatial Variability – CG vs IC!
� IC detection efficiencies drop off drastically away from land!
� CG drops off less quickly!
� Ideally, bias correct CG and IC separately to get corrected total lightning!
Fierro et al. 2012 16!

Next steps!� Case studies!
� Isaac 2012 (Benjamin Trabing, Hollings Scholar Intern Summer 2015)!� Gulf of Mexico (high DE for CG and IC)!� Well observed (satellite, reconnaissance flights)!� Modeled (Co-PI A. Fierro, using WRF with lightning param)!
� Compare WWLLN vs. ENTLN and focus on differences!
� Refining bias correction methodology!� Using better DE’s (from Rudlosky 2015)!� Bias correct CG and IC differently!
� Asymmetric predictors!
� GLD-360 (waiting for data)!
� Scaling by TC size…!
17!

Scaling TC Information !Problems: How to separate the rainband region from the eyewall region or TC from its appropriate environment!
Katrina (2005, 08/28 17:45) Rank 1/90, 8/738 (1.1% globally) Vmax:140kt Lat: 26.3oN PC1: -1.51 PC2: 1.15 PC3: 2.06
V500: 11.32 m/s R5 : 18.64o Lat
Felix (2007, 9/3, 2:45) Rank 89/90, 667/738 (90.4 % globally)
Vmax:150kt Lat: 13.9oN PC1: -0.89 PC2: -0.84 PC3: 0.67
V500: 5.90 m/s R5 : 9.93o Lat
18!

Concept!
19!

How to scale TC by size!
“In the simplest terms, R5 is the radius at which the TC wind field is indistinguishable from background flow.” 20!

Examples of the effect of scaling IR data are shown. Two major hurricanes are shown. Katrina was a very large TC and Felix was a very small TC. Hurricane Katrina (2005, left) and Hurricane Felix (2007, right). Earth relative coordinates are shown at the top and scaled coordinates at the bottom. (Knaff et al. 2014b)
21!

Katrina r vs. Tb profiles!Radius! Normalized Radius!
TC Rainbands
TC core
22!

Katrina r vs. Stdev(Tb) profiles!Radius !! Normalized Radius!
TC Rainbands
TC core
23!

Potential Applications!
� Interpretation of lightning information!� Narrowing the region where the Eyewall may be located!� Possibly improved location of the likely rainbands!
� Statistical Intensity forecasting!� Where is the appropriate environment!� Improve IR-based predictors!� Improve favorable/unfavorable lightning relationships!
� Compositing studies!� Rainband region!� Environment !
24!

Lightning Density (radius) vs (scaled radius)!
25!
� Encouraging!
• Scaling makes the climatologies of lightning have more similar shapes, especially at radii greater than 150 km in scaled space!
� Discouraging!
• Magnitudes are quite different!
• Next slide !

Stratifying lightning by intensity change!
26!
� Despite what appears to be a more similar shaped climatology after scaling lightning information there are large differences between Atlantic and E. Pacific when stratified by intensity changes!
Plots of Atlantic (left) and East Pacific (right) lightning density composites shown as a function of radial distance from the storm center and future intensity changes. Rapid intensification (RI), Average Intensity Change (AIC) and Rapid Weakening (RW) represent case that have 24-h intensity changes (dV) ≥ 30 kt, 30 kt > dV < -20 kt, and dV≤ -20 kt, respectively. Top panels show the observed radial extent and the bottom panels show the composites based on scaled radial distances. (Knaff et al 2014b)

Concluding remarks on scaling!
� Objectively scaling information by TC size (R5) seems to improve some relationships, especially outside of the core region.!
� There is likely a better way to objectively scale the core region to better isolate the eyewall region (i.e. something related to the RMW)!
27!

NOAA Satellite Proving Ground at the National Hurricane Center!� Satellite Liaison (share w/ M. DeMaria) as of spring 2014!
� Lightning-based RII currently being demonstrated at the National Hurricane Center!
� Formal evaluation period: 1 August through 30 November!� Prepare product demonstrations, training April - July!� Mid-PG review in September!� Final PG evaluation in January!� http://www.goes-r.gov/users/pg-activities-01.html!
� GLD-360 lightning density & strike data also being evaluated (proxy for GOES-R GLM)!
28!

Final thoughts overall!� Some of our group’s strengths!
� Data, including extensive satellite archives!� Statistical analyses, applications, and product development!� Operational connections!� Experience!
� Always seeking collaborations!
29!
Real-time TC imagery & products: http://rammb.cira.colostate.edu/products/tc_realtime/
TC genesis product: http://rammb.cira.colostate.edu/projects/gparm/
TC research and product development: http://rammb.cira.colostate.edu/research/tropical_cyclones/
References!� DeMaria, M., R. T. DeMaria, J. A. Knaff, and D. Molenar, 2012: Tropical Cyclone
Lightning and Rapid Intensity Change, Mon. Wea. Rev., 140, 1828-1842.!
� Fierro, A. O., E. R. Mansell, C. L. Ziegler, and D. R. MacGorman, 2012: Application of a Lightning Data Assimilation Technique in the WRF-ARW Model at Cloud-Resolving Scales for the Tornado Outbreak of 24 May 2011, Mon. Wea. Rev., 140, 2609-2627.!
� Knaff, J. A., S. P. Longmore, and D. A. Molenar, 2014a: An objective satellite-based tropical cyclone size climatology. J. Climate, 27, 455-476. !
� Knaff, J.A., M. DeMaria, S. Longmore, and R.T. DeMaria, 2014b: Improving Tropical Cyclone Guidance Tools by Accounting for Variations in Size. 31st Conference on Hurricanes and Tropical Meteorology, 30 March-4 April, San Diego, CA.Rudlosky, S. D., 2015: Evaluating ENTLN performance relative to TRMM/LIS. J. Operational Meteor., 3 (2), 11–20.!
� Rudlosky, S. D. and D. T. Shea, 2013: Evaluating WWLLN performance relative to TRMM/LIS, Geophys. Res. Lett., 40, 2344-2348.!
30!


