Ultra-dense Hydrogen and Low Energy Nuclear Reactions Presenter Sveinn Ólafsson Research professor Science Institute University of Iceland University of Iceland School of Natural Science and engineering AVS 62 Ultra-dense Hydrogen and Low Energy Nuclear Reactions Sveinn Ólafsson Overview of talk 1. Fusion reactions short overview 2. Palladium Deuterium 3. Nickel - Hydrogen 4. The Ultra-dense hydrogen 5. Theoretical discussion 6. Summary University of Iceland School of Natural Science and engineering AVS 62 Ultra-dense Hydrogen and Low Energy Nuclear Reactions Reseach Professor Sveinn Ólafsson University of Iceland School of Natural Science and engineering AVS 62 /SRI Ultra-dense Hydrogen and Low Energy Nuclear Reactions Sveinn Ólafsson and Leif Holmlid AVS62 Photocatalysis session
Transcript
Ultra-dense Hydrogen and Low Energy Nuclear Reactions Presenter Sveinn Ólafsson Research professor Science Institute University of Iceland
University of Iceland School of Natural Science and engineering
AVS 62 Ultra-dense Hydrogen and Low Energy Nuclear Reactions Sveinn Ólafsson
University of Iceland School of Natural Science and engineering
AVS 62 Ultra-dense Hydrogen and Low Energy Nuclear Reactions Reseach Professor Sveinn Ólafsson University of Iceland School of Natural Science and engineering
AVS 62 /SRI Ultra-dense Hydrogen and Low Energy Nuclear Reactions Sveinn Ólafsson and Leif Holmlid
AVS62 Photocatalysis session
University of Iceland School of Natural Science and engineering
AVS 62 Ultra-dense Hydrogen and Low Energy Nuclear Reactions Sveinn Ólafsson
1. Fusion reactions short overview
University of Iceland School of Natural Science and engineering
AVS 62 Ultra-dense Hydrogen and Low Energy Nuclear Reactions Reseach Professor Sveinn Ólafsson University of Iceland School of Natural Science and engineering
AVS 62 Ultra-dense Hydrogen and Low Energy Nuclear Reactions Sveinn Ólafsson and Leif Holmlid University of Iceland School of Natural Science and engineering
AVS 62 /SRI Ultra-dense Hydrogen and Low Energy Nuclear Reactions Sveinn Ólafsson and Leif Holmlid
D + D → n + 3He + 3.3 MeV
D + D → p + 3T + 4.0 MeV
D + D → He + γ + 24 MeV
p + p → D +e+ + νe + 0.42MeV
p + p + e- → D + νe + 1.44MeV
p + D→ 3He + γ + 5.5 MeV
p + 3He → 4He + e+ + γ+ ν +18.8 MeV
R
5 fm 50.000 eV Barrier
R
Fusion reactions at the core of the Sun
H2 molecule 70 pm
H+H+
H H
He*
University of Iceland School of Natural Science
Ultra-dense Hydrogen and Low Energy Nuclear Reactions Sveinn Ólafsson University of Iceland School of Natural Science and engineering
AVS 62 Ultra-dense Hydrogen and Low Energy Nuclear Reactions Sveinn Ólafsson University of Iceland School of Natural Science and engineering
AVS 62 Ultra-dense Hydrogen and Low Energy Nuclear Reactions Reseach Professor Sveinn Ólafsson University of Iceland School of Natural Science and engineering
AVS 62 Ultra-dense Hydrogen and Low Energy Nuclear Reactions Sveinn Ólafsson and Leif Holmlid
Radioactive!
D = (pn) nucleus
University of Iceland School of Natural Science and engineering
AVS 62 /SRI Ultra-dense Hydrogen and Low Energy Nuclear Reactions Sveinn Ólafsson and Leif Holmlid
Couloumb barrier is thin, frequency of tunnelling is high
f = Evib/h ≈ 1016/s.
Molecular muonium fusion, µ-catalysed fusion known since 1947
Not drawn to scale
University of Iceland School of Natural Science
Ultra-dense Hydrogen and Low Energy Nuclear Reactions Sveinn Ólafsson
5 [fm]
R [fm]
Rd
R [fm]
Rd
Reaction is “directional” or “lined up”Fusion time is less than one nanosecond
Reaction products are the same as in the Sun !
520 fm
He*
H H
University of Iceland School of Natural Science and engineering
Ultra-dense Hydrogen and Low Energy Nuclear Reactions Sveinn Ólafsson University of Iceland School of Natural Science and engineering
AVS 62 Ultra-dense Hydrogen and Low Energy Nuclear Reactions Sveinn Ólafsson University of Iceland School of Natural Science and engineering
AVS 62 Ultra-dense Hydrogen and Low Energy Nuclear Reactions Reseach Professor Sveinn Ólafsson University of Iceland School of Natural Science and engineering
AVS 62 Ultra-dense Hydrogen and Low Energy Nuclear Reactions Sveinn Ólafsson and Leif Holmlid
µ lifetime is to short to reach beak even
University of Iceland School of Natural Science and engineering
AVS 62 /SRI Ultra-dense Hydrogen and Low Energy Nuclear Reactions Sveinn Ólafsson and Leif Holmlid
Pons and Fleischmann
Profs. Pons and Fleischmann(Courtesy Univ. of Utah)
2. Palladium-Deuterium
University of Iceland School of Natural Science and engineering
AVS 62 Ultra-dense Hydrogen and Low Energy Nuclear Reactions Reseach Professor Sveinn Ólafsson University of Iceland School of Natural Science and engineering
AVS 62 Ultra-dense Hydrogen and Low Energy Nuclear Reactions Sveinn Ólafsson and Leif Holmlid
1989
University of Iceland School of Natural Science and engineering
AVS 62 /SRI Ultra-dense Hydrogen and Low Energy Nuclear Reactions Sveinn Ólafsson and Leif Holmlid
How would scientist start a research on the possibility of cold fusion in year
2015?
University of Iceland School of Natural Science and engineering
AVS 62 Ultra-dense Hydrogen and Low Energy Nuclear Reactions Reseach Professor Sveinn Ólafsson University of Iceland School of Natural Science and engineering
AVS 62 Ultra-dense Hydrogen and Low Energy Nuclear Reactions Sveinn Ólafsson and Leif Holmlid University of Iceland School of Natural Science and engineering
AVS 62 /SRI Ultra-dense Hydrogen and Low Energy Nuclear Reactions Sveinn Ólafsson and Leif Holmlid
Combinatorical Research!
University of Iceland School of Natural Science and engineering
AVS 62 Ultra-dense Hydrogen and Low Energy Nuclear Reactions Reseach Professor Sveinn Ólafsson
B
AC
University of Iceland School of Natural Science and engineering
AVS 62 Ultra-dense Hydrogen and Low Energy Nuclear Reactions Sveinn Ólafsson and Leif Holmlid University of Iceland School of Natural Science and engineering
AVS 62 /SRI Ultra-dense Hydrogen and Low Energy Nuclear Reactions Sveinn Ólafsson and Leif Holmlid
Combinatorical Research!
University of Iceland School of Natural Science and engineering
AVS 62 Ultra-dense Hydrogen and Low Energy Nuclear Reactions Reseach Professor Sveinn Ólafsson
MetalhydrideDeuterium Driving force
University of Iceland School of Natural Science and engineering
AVS 62 Ultra-dense Hydrogen and Low Energy Nuclear Reactions Sveinn Ólafsson and Leif Holmlid University of Iceland School of Natural Science and engineering
AVS 62 /SRI Ultra-dense Hydrogen and Low Energy Nuclear Reactions Sveinn Ólafsson and Leif Holmlid
• Disassociation of hydrogen into hydrogen atoms • Diffusion of hydrogen atom within the metal
Deuterium in Palladium
D2O and LiOD
Pd
Electrochemical cellUniversity of Missouri
University of Iceland School of Natural Science and engineering
AVS 62 Ultra-dense Hydrogen and Low Energy Nuclear Reactions Reseach Professor Sveinn Ólafsson University of Iceland School of Natural Science and engineering
AVS 62 Ultra-dense Hydrogen and Low Energy Nuclear Reactions Sveinn Ólafsson and Leif Holmlid University of Iceland School of Natural Science and engineering
AVS 62 /SRI Ultra-dense Hydrogen and Low Energy Nuclear Reactions Sveinn Ólafsson and Leif Holmlid
University of Iceland School of Natural Science and engineering
AVS 62 Ultra-dense Hydrogen and Low Energy Nuclear Reactions Reseach Professor Sveinn Ólafsson University of Iceland School of Natural Science and engineering
AVS 62 Ultra-dense Hydrogen and Low Energy Nuclear Reactions Sveinn Ólafsson and Leif Holmlid
www.iccf19.com
LENR-CANR.ORGThe library includes more than 1,000 original scientific papers reprinted with permission from the authors and publishers. Bibliography of over 3,500 journal papers, news articles and books about LENR.
No need to perform the experiment, the results are in Modest Excess heat 1 - 50W for
varying time span
Not limited to Pd or Ni
Radioactivity is quenched!tiny amount of Tritium,
neutrons and protons are detected
Small reproducibility possiblewith protocols.
19 conferences since 1989
www.iscmns.org
JOURNAL OF CONDENSED MATTER NUCLEAR SCIENCE
Helium is detected,transmutations are detected
University of Iceland School of Natural Science and engineering
AVS 62 /SRI Ultra-dense Hydrogen and Low Energy Nuclear Reactions Sveinn Ólafsson and Leif Holmlid
University of Iceland School of Natural Science and engineering
AVS 62 Ultra-dense Hydrogen and Low Energy Nuclear Reactions Reseach Professor Sveinn Ólafsson University of Iceland School of Natural Science and engineering
AVS 62 Ultra-dense Hydrogen and Low Energy Nuclear Reactions Sveinn Ólafsson and Leif Holmlid
Review book 2007 Review book 2014
Conducts online PdD experiments with 0.4W excess heat or ~1012 fusion events /sec
“Nanocracks in Palladium are the active sites in Pd”
Review books
University of Iceland School of Natural Science and engineering
AVS 62 /SRI Ultra-dense Hydrogen and Low Energy Nuclear Reactions Sveinn Ólafsson and Leif Holmlid
Storms Helium bumpHiggs discovery bump 2012
University of Iceland School of Natural Science and engineering
AVS 62 Ultra-dense Hydrogen and Low Energy Nuclear Reactions Sveinn Ólafsson and Leif Holmlid
University of Iceland School of Natural Science and engineering
AVS 62 /SRI Ultra-dense Hydrogen and Low Energy Nuclear Reactions Sveinn Ólafsson and Leif Holmlid
The scientific conclusion of the Combinatorical Research
University of Iceland School of Natural Science and engineering
AVS 62 Ultra-dense Hydrogen and Low Energy Nuclear Reactions Reseach Professor Sveinn Ólafsson University of Iceland School of Natural Science and engineering
AVS 62 Ultra-dense Hydrogen and Low Energy Nuclear Reactions Sveinn Ólafsson and Leif Holmlid
Something is accidentally created, that causes “impossible” nuclear reactions
This has been be known for 25 years!
With this simple conclusion it is very strange that it has mostly not be possible to perfom funded basic research in this field only ineffective
recreational basic reseach has been possible
University of Iceland School of Natural Science and engineering
AVS 62 /SRI Ultra-dense Hydrogen and Low Energy Nuclear Reactions Sveinn Ólafsson and Leif Holmlid
3. Nickel - Hydrogen Nickel - Deuterium ?
University of Iceland School of Natural Science and engineering
AVS 62 Ultra-dense Hydrogen and Low Energy Nuclear Reactions Reseach Professor Sveinn Ólafsson University of Iceland School of Natural Science and engineering
AVS 62 Ultra-dense Hydrogen and Low Energy Nuclear Reactions Sveinn Ólafsson and Leif Holmlid
Rossi radioactivity free 1.0 MW Nickel-Hydrogen LENR powerplant is in one year engineering trial in Florida, Patent obtained in USA 2015, report in March 2016?
A prominent North Carolina investor is backing a new kind of fusion that operates at much lower temperatures than thought possible, which would make it easier to commercialize. So far the early results show promise.
This investor is chasing a new kind of fusionFortune.com SEPTEMBER 27, 2015, 12:00 PM EDT
Tom Darden 10M dollar investment
University of Iceland School of Natural Science and engineering
AVS 62 /SRI Ultra-dense Hydrogen and Low Energy Nuclear Reactions Sveinn Ólafsson and Leif Holmlid
University of Iceland School of Natural Science and engineering
AVS 62 Ultra-dense Hydrogen and Low Energy Nuclear Reactions Reseach Professor Sveinn Ólafsson University of Iceland School of Natural Science and engineering
AVS 62 Ultra-dense Hydrogen and Low Energy Nuclear Reactions Sveinn Ólafsson and Leif Holmlid
One very recent candidate theory
Nuclear Spallation and Neutron Capture Induced by Ponderomotive Wave Forcing Rickard Lundin and Hans Lidgren 1Swedish Institute of Space Physics, BKiruna, Sweden 2Le Mirabeau, 2 ave des Citronniers, MC 98000, Monaco
Rossi explanation, Neutrons in Li,D? are transmuted by unknown process over to Nickel at 1400°C
Rossi formula Nickel,LiAlH4, Li and Hydrogen isotope
Li Nineutron
But Radioactivity in not suppressed in such theory
University of Iceland School of Natural Science and engineering
AVS 62 /SRI Ultra-dense Hydrogen and Low Energy Nuclear Reactions Sveinn Ólafsson and Leif Holmlid
University of Iceland School of Natural Science and engineering
AVS 62 /SRI Ultra-dense Hydrogen and Low Energy Nuclear Reactions Sveinn Ólafsson and Leif Holmlid
Ni Li
Al O
H
D
Neutrons or Ultra dense hydrogen?
n
4. The Ultra-dense hydrogen Leif Holmlid 30+ papers 2008-2015
University of Iceland School of Natural Science and engineering
AVS 62 /SRI Ultra-dense Hydrogen and Low Energy Nuclear Reactions Sveinn Ólafsson and Leif Holmlid
Publications Leif Holmlid 2015 - 2013
University of Iceland School of Natural Science and engineering
AVS 62 Ultra-dense Hydrogen and Low Energy Nuclear Reactions Reseach Professor Sveinn Ólafsson University of Iceland School of Natural Science and engineering
AVS 62 Ultra-dense Hydrogen and Low Energy Nuclear Reactions Sveinn Ólafsson and Leif Holmlid
Heat generation above break-even from laser-induced fusion in ultra-dense deuterium Leif Holmlid AIP Advances, Volume 5, Issue 8, Pages artikel nr 087129 2015
Charged particle energy spectra from laser-induced processes: nuclear fusion in ultra-dense deuterium D(0) Leif Holmlid and Sveinn Ólafsson International Journal of Hydrogen Energy, accepted 19 Okt 2015
Muon detection studied by pulse-height energy analysis: Novel converter arrangements Leif Holmlid, Sveinn Olafsson Review of Scientific Instruments, Volume 86, Issue 8, Pages artikel nr 083306 2015
Spontaneous ejection of high-energy particles from ultra-dense deuterium D(0) Leif Holmlid, Sveinn Olafsson International journal of hydrogen energy, Volume 40, Issue 33, Pages 10559-10567 2015
Meissner Effect in Ultra-Dense Protium p(l=0, s=2) at Room Temperature: Superconductivity in Large Clusters of Spin-Based Matter Leif Holmlid, S. Fuelling Journal of Cluster Science, Volume 26, Issue 4, Pages 1153-1170 2015
MeV particles in a decay chain process from laser-induced processes in ultra-dense deuterium D(0) Leif Holmlid International Journal of Modern Physics E-Nuclear Physics, Volume 24, Issue 4, Pages artikel 1550026 2015
University of Iceland School of Natural Science and engineering
AVS 62 /SRI Ultra-dense Hydrogen and Low Energy Nuclear Reactions Sveinn Ólafsson and Leif Holmlid
Leif Holmlid publications continued
University of Iceland School of Natural Science and engineering
AVS 62 Ultra-dense Hydrogen and Low Energy Nuclear Reactions Reseach Professor Sveinn Ólafsson University of Iceland School of Natural Science and engineering
AVS 62 Ultra-dense Hydrogen and Low Energy Nuclear Reactions Sveinn Ólafsson and Leif Holmlid
Heat generation above break-even from laser-induced fusion in ultra-dense deuterium Intense ionizing radiation from laser-induced processes in ultra-dense deuterium D(-1) Frans Olofson, Leif Holmlid International Journal of Modern Physics E-Nuclear Physics, Volume 23, Issue 9, Pages 1450050 2014
Ultra-Dense Hydrogen H(-1) as the Cause of Instabilities in Laser Compression-Based Nuclear Fusion Leif Holmlid Journal of Fusion Energy, Volume 33, Issue 4, Pages 348-350 2014
TWO-COLLECTOR TIMING OF 3 14 MeV/u PARTICLES FROM LASER-INDUCED PROCESSES IN ULTRA-DENSE DEUTERIUM Leif Holmlid International Journal of Modern Physics E, Volume 22, Issue 12, Pages artikel nr 1350089 2013 Journal Article, peer-reviewed
Direct observation of particles with energy >10 MeV/u from laser-induced processes with energy gain in ultra-dense deuterium Leif Holmlid Laser and particle beams, Volume 31, Issue 4, Pages 715-722 2013
Excitation levels in ultra-dense hydrogen p(-1) and d(-1) clusters: Structure of spin-based Rydberg Matter Leif Holmlid International Journal of Mass Spectrometry, Volume 352, Pages 1-8 2013
Laser-mass spectrometry study of ultra-dense protium p(-1) with variable time-of-flight energy and flight length Leif Holmlid International Journal of Mass Spectrometry, Volume 351, Pages 61-68 2013
University of Iceland School of Natural Science and engineering
AVS 62 /SRI Ultra-dense Hydrogen and Low Energy Nuclear Reactions Sveinn Ólafsson and Leif Holmlid
University of Iceland School of Natural Science and engineering
AVS 62 Ultra-dense Hydrogen and Low Energy Nuclear Reactions Sveinn Ólafsson and Leif Holmlid University of Iceland School of Natural Science and engineering
AVS 62 /SRI Ultra-dense Hydrogen and Low Energy Nuclear Reactions Sveinn Ólafsson and Leif Holmlid
and how do they condense?
What is Rydberg atom?
University of Iceland School of Natural Science and engineering
AVS 62 /SRI Ultra-dense Hydrogen and Low Energy Nuclear Reactions Sveinn Ólafsson and Leif Holmlid
Adsorbed H
Desorbed H in 1s state
K dopant atom
Desorbed Rydberg H atom in high quantum number state
lifetime in ms
HRydberg atom generation
University of Iceland School of Natural Science and engineering
AVS 62 Ultra-dense Hydrogen and Low Energy Nuclear Reactions Reseach Professor Sveinn Ólafsson University of Iceland School of Natural Science and engineering
AVS 62 Ultra-dense Hydrogen and Low Energy Nuclear Reactions Sveinn Ólafsson and Leif Holmlid
Rydberg state lowest energy state
H2
Styrene catalyst Fe2O3:K or similiar
Rydberg Matter Clusters: Theory of Interaction and Sorption Properties Michael I. Ojovan J Clust Sci (2012) 23:35–46 DOI 10.1007/s10876-011-0410-6
University of Iceland School of Natural Science and engineering
AVS 62 /SRI Ultra-dense Hydrogen and Low Energy Nuclear Reactions Sveinn Ólafsson and Leif Holmlid
Rydberg matter Frozen plasma?
University of Iceland School of Natural Science and engineering
AVS 62 Ultra-dense Hydrogen and Low Energy Nuclear Reactions Reseach Professor Sveinn Ólafsson
of electrons in areas far from inner core states. As a consequence a stable metal-likeRM condensate is formed which has however densities characteristic to that of a gasand an extended lifetime. The most important parameters of RM made of excited Csatoms are given in Table 1.
Van der Waals Interactions With RM Clusters
Clusters of excited atoms including Cs and K RM with the quantum–mechanicallevel of excitation from 4–7 to 10–15 were identified experimentally having thenumber of excited atoms N as high as hundreds [7, 9, 10, 13, 15, 23]. Consider a RM
Fig. 2 Schematic of an electron-confining well resulting from exchange–correlation interactions in RM(after [29])
Table 1 Estimated characteristics of Cs RM
Main quantum–mechanicalnumber, n
Interatomic distances,Rii, nm
Equilibrium density,N(0), 1/cm3
Decay constant,kRM, 1/s
6 (Ground state) 0.6 9.1 9 1021 0
10 6.7 6.5 9 1018 650
11 9.1 2.5 9 1018 1540
12 12.0 1.1 9 1018 0.04
13 15.3 5.3 9 1017 0.2
14 18.9 2.8 9 1017 3.5 9 10-6
15 23.1 1.6 9 1017 2.7 9 10-5
Data in this table are given accordingly to Ref. [1]. However recent experimental studies of Holmlid [30]have shown that the bond distances and densities given in [1] are underestimated. For example Holmlid’sresults indicate a bond distance at n = 10 of 15.3 nm, not 6.7 nm as given in [1]
The method used here to measure the bond dis-tances in D(-1) and D(1) is laser-induced CE.1, 2, 5 The5 ns long laser pulse excites electrons in the materialto give bare nuclei exposed to their full Coulomb repul-sion. This may mean an ionization process but may alsoinvolve only an excitation (displacement) of the shieldingelectrons from the conduction band into higher localized(nonshielding) orbitals in the material. The potential energybetween the two exposed charges is
W = e2
4πε0d, (1)
where d is the distance between the two ions. This energy istransformed almost completely to kinetic energy between thetwo ionic fragments during their mutual repulsion. The kineticenergy release (KER) sometimes appears mainly as kineticenergy in one light fragment, ejected from a large cluster. ForD(-1), the KER is often observed as kinetic energy in two dif-ferent fragments, and the relative masses of the fragments willdetermine their fraction of the KER. Calculations of such en-ergy fractionation are used for the interpretation of the resultshere.
The CE fragmentation processes in the material D(-1) in-dicate a common KER of 630 eV.1, 2, 5 This means an inter-atomic distance of 2.3 ± 0.1 pm, a factor of approximately65 smaller than in D(1). In the case of D(-1), the typical frag-mentation is to a D atom + large fragment, but two equal frag-ments of large clusters are also often observed, as describedabove and in Table I.
The distance d for D(1) and D(3) is given by
d = 2.9 n2B a0, (2)
where nB is the Bohr model principal quantum number for theelectron in the atom equal to 1 or 3, and a0 is the Bohr radiusequal to 52.9 pm. The factor 2.9 is found both from theory12
and with higher precision from rotational spectroscopy of RMclusters.24, 25 For RM with nB=3 or above, the ions leaving theCE are easily neutralized by picking up nearly resonant con-duction band electrons from the RM phase. These Rydbergspecies are easily field ionized by the weak electric field inthe detector. The typical KER for D(1) is 9.4 eV, while forD(3) the KER is 1.04 eV.26
B. Detection and calibration
The interpretation of the TOF spectra is of course depen-dent on the accurate calibration of the TOF measurements inthe apparatus. Since the particles observed are only acceler-ated by the CE and not by any voltage in the apparatus, thecalibration cannot use known ions or anything similar. Due tothe high kinetic energy of the particles detected here, they arenot deflected by the dynode potential in the detector like slowions or slow field ionizable particles but instead hit a stain-less steel plate (catcher foil) inside the detector, from which
Time-of-flight (µs)
0.0 0.5 1.0 1.5 2.0
Sig
nal (
coun
ts)
0
20
40
60
80
100
4<->4
2<->2
6(3+)
2<->10
6<->2
14<->14
2<->6
FIG. 10. A TOF spectrum used for calibration of the time-of-flight experi-ments from the position of the narrow 2↔2 peak.
positively charged particles are ejected or scattered. This isthe same method as used in Refs. 5–7. The flight distance tothe catcher foil plate is 101 mm, and this is the distance usedfor calibration of the results found here. TOF spectra fromD(-1) without an accelerating potential have been calibratedpreviously, giving the same flight distance.1, 5 The match ofdifferent peaks here to the theoretical TOF is good using thiscalibration, and there is no indication of any substantial error.Internal checks of the correctness of the calibration have alsobeen done. For example, the first edge of the TOF peaks ob-served should be at the large mass limit of heavy fragments ina CE process. The first TOF peak is mainly due to break-upfor example indicated as 2↔12 (2+).1, 5 This description in-dicates a process D7
3+ → D+ + D62+, where the D+ carries
away most of the KER of 2 × 630 eV=1260 eV. The errorin the TOF may be of the order of 10 ns from this observa-tion, which is the error likely from the MCS channel start.The match of different peaks to calculated TOF is good, andthere is no indication of any error larger than 10 ns in thecalibration.
Other checks may involve any sharp and uniquely identi-fied peaks in the spectra. The peaks assigned 2↔2 and 4↔4from symmetric fragmentation fulfill these requirements. Anexample of a spectrum with these two peaks is shown inFig. 10. The peak 2↔2 has a FWHM of 28 ns, while the peakposition agrees with theory within ±5 ns. Thus, the TOF cal-ibration is accurate within ±5 ns at this peak, meaning a rela-tive error of ±1%. This transfers to an accuracy of ±1 mm inthe flight distance of 101 mm.
VI. CONCLUSIONS
Ultradense deuterium can be produced in larger quanti-ties than previously by using the novel source described. Theproperties of the source and of the material produced are stud-ied as a function of several experimental parameters. Thisgives a useful background for further work on the develop-ment of small-scale laser-ignited nuclear fusion for energyproduction.
Downloaded 28 Aug 2013 to 130.236.171.186. This article is copyrighted as indicated in the abstract. Reuse of AIP content is subject to the terms at: http://rsi.aip.org/about/rights_and_permissions
University of Iceland School of Natural Science and engineering
AVS 62 Ultra-dense Hydrogen and Low Energy Nuclear Reactions Sveinn Ólafsson and Leif Holmlid
favourable compared the system of isolated excited atoms. All RM atoms remainexcited until gradual de-excitation followed by complete disintegration of RM.
Bonding of excited atoms in the RM is metallic e.g. similar to that of metallicbonding in alkali metals. Similarly to conventional metallic systems the valenceelectrons of RM are delocalised. The ionic system of RM can be considered asembedded in a sea of valence electrons which surround the ionic cores (Fig. 1). Thedistribution of valence electrons is however non-uniform and resembles a foamstructure [17, 18] The characteristic distances at which electron–ion interactionpotentials and density of electrons change are however significantly largercompared to conventional metals. In addition to that many of inner (core) statesof excited atoms are empty. Because of that RM valence electrons can be capturedto those inner states e.g. allowing electrons to recombine to lower energy states.Such kinds of events lead to deexcitation and final disintegration of RM [6].
Interaction of a highly excited valence electron with RM ions and electrons of thesystem can be described using the pseudopotential concept [1, 2]. Fermi was the firstwho analysed motion of electrons in highly excited atoms taking into account theirinteractions with surrounding atoms where he suggested the pseudopotentialconcept [19]. Fermi has also noted that it is not necessary to know all details of thescattering potentials since there are many effective interaction potentials, whichreproduce the phase shifts and yield to similar scattering events. This concept yetmodified is currently applied to effectively describe many quantum–mechanicalsystems [20–22]. RM valence electrons interact both with ions and their coreelectrons, and other valence electrons. The interactions with ions and core electronscan be described using a smooth potential, corresponding to interaction forcessmoothly changing with distance at large distances from ions which arecharacteristic to RM due to its low density. RM valence electrons spend almostall time far from ionic cores with classical orbit radii increasing as the second power
Fig. 1 Distribution of valenceelectrons in RM resembles thestructure of a foam. Valenceelectrons form an ‘‘electronicfoam’’ or bubble sea with cellswhich are essentially empty. RMions are vibrating in the centresof electronic cells. The effectiveinteraction potential for RMelectrons along line A–B isshown in Fig. 4
Theory of Interaction and Sorption Properties 37
123Amorphous
2D hexagonal
Any cluster structure is possible
University of Iceland School of Natural Science and engineering
AVS 62 /SRI Ultra-dense Hydrogen and Low Energy Nuclear Reactions Sveinn Ólafsson and Leif Holmlid
FIG. 1. Cut through source with detector at 90o toward the laser beam. Fastparticles form the laser fragmentation hit the catcher foil. The source can betilted around the laser focus and moved up and down in the chamber.
possible by controlled tilting of the 20 mm diameter gas feedtube by three external micrometer screws relative to the com-pressed Viton o-ring seal in the vacuum wall. Most impor-tant is that the source can be moved in the vertical directionin a controlled way by rotation of support screws. The lowermetal (Pt) tube with 6 mm outer diameter and wall thicknessof 100 µm is heated by an ac current though its wall. Theupper end of the 20 mm diameter tube passing the vacuumwall is at zero potential. The lower end is connected to a Cuclamp and supported thick flexible Cu cables which supplythe ac current. This clamp which also tightens the Pt tubeagainst the emitter holder tube is seen in Fig. 2. The cur-rent through the tube is up to 28 A, at a total power of 22 W.The D2 gas is heated in the tube to a temperature higher thanthe emitter. The main heat loss from the source is through the
FIG. 2. (Color online) Photo of the emitter and the lower part of the source.The copper block and the cables carry the heating current to the lower end ofthe Pt tube.
Cu clamp and cables. It is estimated that the highest emittertemperature at the center of the Pt tube is 475 K (200 ◦C) at28 A. In the results section, the current through the source isused as parameter since no definite temperature of the sourcecan be specified. The base pressure in the vacuum cham-ber is <1 × 10⁻⁶ mbar. Deuterium gas (>99.8% D2) is ad-mitted at a pressure in the chamber up to 1 × 10⁻⁵ mbar.The flow rate through the external needle valve is close to5 × 10−2 mbar dm3 s−1.
III. ANALYSIS
The methods used for the analysis of the material leavingthe source have been described in several publications.1, 2, 23
A Nd:YAG laser with an energy of <200 mJ per each 5 nslong pulse at 10 Hz is used at 532 nm. The laser beam is fo-cused with an f=400 mm spherical lens at the center of theUHV chamber. The intensity in the beam waist of (nomi-nally) 70 µm diameter is relatively low, ≤1012 W cm−2 ascalculated for a Gaussian beam. The diverging laser beamstops in a beam dump at the chamber wall. The detector isa dynode-scintillator-photomultiplier setup that is describedin detail elsewhere23 and shown in Fig. 1. The detector ishere located at an angle of 60o from the incoming laserbeam and measures the TOF spectra of neutral particles sinceno accelerating voltage is employed. The fast particles im-pact on a stainless steel foil in the detector, and fast ionsejected from there are drawn toward a Cu-Be dynode heldat −7.0 kV inside the detector. The total effective flight dis-tance for the ions from the laser focus to the catcher foil is101 mm, as found by direct measurement and internal cali-bration (see Sec. V). The photomultiplier (PMT) is ElectronTubes 9128B with single electron rise time of 2.5 ns andtransit time of 30 ns. Blue glass filters in front of the PMTdecrease the pulsed laser light signal observed by the PMTstrongly. The signal from the PMT is collected by a multi-channel scaler (EG&G Ortec Turbo-MCS) with preamplifier.The dwell time per channel used here is 5 ns. Each spectrumconsists of a sum of the fragment signals from 500 or 250 lasershots.
IV. RESULTS
The TOF spectra shown in the figures are interpreted inthe same way as done previously for D(-1).1–8 Predicted val-ues for the TOF for different cluster sizes and different frag-mentation patterns are given in Table I. Several entries thereare included for comparison and checking purposes and arenot always observed. In the final column in the table, the num-bers are given of the figures where the corresponding TOFpeaks are observed. A short description of the background forthe Coulomb explosion fragmentation processes is given inthe discussion.
A. Start of the source
In Fig. 3, a new experiment is shown, after several dayswith no D2 feed. In the two first spectra (from the bottom
Downloaded 28 Aug 2013 to 130.236.171.186. This article is copyrighted as indicated in the abstract. Reuse of AIP content is subject to the terms at: http://rsi.aip.org/about/rights_and_permissions
Efficient source for the production of ultradense deuterium D(-1) for laser-induced fusion (ICF)REVIEW OF SCIENTIFIC INSTRUMENTS 2011Patrik U. Andersson, Benny Lönn, and Leif Holmlida)Atmospheric Science, Department of Chemistry, University of Gothenburg, SE-412 96, Göteborg, Sweden
Styrene catalyst Fe2O3:K
University of Iceland School of Natural Science and engineering
AVS 62 /SRI Ultra-dense Hydrogen and Low Energy Nuclear Reactions Sveinn Ólafsson and Leif Holmlid
Time of flight analysis
+University of Iceland School of Natural Science and engineering
AVS 62 /SRI Ultra-dense Hydrogen and Low Energy Nuclear Reactions Sveinn Ólafsson and Leif Holmlid
TABLE I. Asymmetric and symmetric fragmentation of D(-1) clusters with flight times in the present experiments. The symmetric case 6(3+) contains a fewdifferent processes not treated in detail here.
Total charge Total cluster mass Name t1 (ns) t2 (ns) t3 (ns) Figures
upwards), no gas admission is used. A signal due to D(1)is mainly observed. Some intensity from symmetric frag-mentation of large clusters of D(-1) also exists. After D2
feed for 3 h with no other changes, fast TOF peaks fromD(-1) are found directly, as shown. This means that smallD(-1) clusters, mainly D3 and D4, are formed by the D2 gas
Time-of-flight (µs)
0 1 2 3 4 5 6 7 8
Sig
nal (
coun
ts)
0
100
200
300
400
500
600
no D2 gas
D2 gas
D(1)
D(-1)
4<->4
16<->16
6<->6
6(3+)
8<->212<->2
D(1)(2+)
14<->2
6<->2
FIG. 3. Experimental proof that the D(-1) clusters are due to the D2 gas inlet.No admission of D2 prior to the experiment during several days. With no D2admission, peaks due to D(1) dominate, while small D(-1) clusters are formedin the cluster growth process after D2 admission.
in its interaction with the emitter. The large clusters whichwere fragmented symmetrically with no gas admitted are ap-parently replaced by the smaller clusters. Only a few asym-metric fragments from large clusters are observed with gasadmission, like 12↔2. It is probable that the increased deu-terium density on the emitter during gas admission increasesthe rate of new cluster formation, thus forming small clusterswhich give mainly symmetric fragmentation, as observed.
B. Spatial variation of D(1) and D(-1)
The different forms of condensed atomic D occupy dif-ferent regions in space around the catalytic emitter. Figure 4gives evidence for this. The emitter is there moved from alow position at 0 mm relative to the laser beam (with beamwaist 0.1 mm) to a position 0.4 mm relative to the laser beam,thus with the beam passing below the emitter. The emitteris then moved down again to show that the results can bereproduced. Note the two different TOF scales at the bottom(broken scale). To the left it is seen that the fast D(-1) peaksdisappear when the laser is 0.3 mm below the emitter, andinstead peaks from D(1) are observed. At the 0.4 mm posi-tion, only clusters of D(1) and possibly also of D(3) are ob-served and no atomic D fragments from D(1) or D(-1). Thelaser beam passes through several regions with varying den-sity and forms of deuterium, varying with the emitter position.A sketch of this is shown in Fig. 5. The results indicate thatthe layer of D(-1) is of the order of 0.2–0.3 mm thick. ThatD(-1) is falling from the emitter is not observed in this way,
Downloaded 28 Aug 2013 to 130.236.171.186. This article is copyrighted as indicated in the abstract. Reuse of AIP content is subject to the terms at: http://rsi.aip.org/about/rights_and_permissions
2 14Cluster breakup
University of Iceland School of Natural Science and engineering
AVS 62 /SRI Ultra-dense Hydrogen and Low Energy Nuclear Reactions Sveinn Ólafsson and Leif Holmlid
FIG. 4. The source tube is lifted up from the laser beam a total distance of 0.4 mm, and then moved down again. The results are interpreted with the help of thesketch in Fig. 5. At a distance of 0.4 mm from the emitter, no D(-1) is observed but only higher excitation levels D(1) and D(3).
but can be observed by laser probing on surfaces mountedclosely below the emitter. This will be reported in full else-where.
Emitter
D(3)
D(1)
D(-1)
Laser beamposition
0.1 mm0.2 mm0.3 mm0.4 mm
Viewed region
FIG. 5. (Color online) The laser beam position in the cloud below the emitteris shown for the data in Fig. 4. The approximate regions in space for differentforms of condensed deuterium are indicated.
C. Deuterium gas supply
In Fig. 6, an experiment is shown where the D2 gas feedwas turned off after a few hours of experiment. Only the sig-nal from D(-1) is shown. Each spectrum took approximately3 min. After 15 min with no gas feed, in the middle of thesequence of spectra, the fast D(-1) peaks start to decreasestrongly in intensity. At the same time, the slow peaks due tothe slightly larger asymmetric CE fragments also disappear.(These peaks are probably delayed due to rotational excita-tion, description to be submitted.) The TOF peaks in the laterpart of the experiment are instead due to symmetric fragmen-tation of large clusters, with few small fragments released.Thus, the buildup process of D(-1) with small clusters andatoms attached to the larger clusters appears to be interrupted.The symmetric fragmentation of stable clusters seen in Fig.4 is observed also here. It is not possible to conclude thatD(1) starts to form instead of D(-1), since all intensity ob-served still seems to be due to D(-1). After renewed D2 admis-sion, the fast D(-1) peaks did not reappear within 1 h. Thus,the fast TOF peaks around 500 ns are not characteristic of
Downloaded 28 Aug 2013 to 130.236.171.186. This article is copyrighted as indicated in the abstract. Reuse of AIP content is subject to the terms at: http://rsi.aip.org/about/rights_and_permissions
The method used here to measure the bond dis-tances in D(-1) and D(1) is laser-induced CE.1, 2, 5 The5 ns long laser pulse excites electrons in the materialto give bare nuclei exposed to their full Coulomb repul-sion. This may mean an ionization process but may alsoinvolve only an excitation (displacement) of the shieldingelectrons from the conduction band into higher localized(nonshielding) orbitals in the material. The potential energybetween the two exposed charges is
W = e2
4πε0d, (1)
where d is the distance between the two ions. This energy istransformed almost completely to kinetic energy between thetwo ionic fragments during their mutual repulsion. The kineticenergy release (KER) sometimes appears mainly as kineticenergy in one light fragment, ejected from a large cluster. ForD(-1), the KER is often observed as kinetic energy in two dif-ferent fragments, and the relative masses of the fragments willdetermine their fraction of the KER. Calculations of such en-ergy fractionation are used for the interpretation of the resultshere.
The CE fragmentation processes in the material D(-1) in-dicate a common KER of 630 eV.1, 2, 5 This means an inter-atomic distance of 2.3 ± 0.1 pm, a factor of approximately65 smaller than in D(1). In the case of D(-1), the typical frag-mentation is to a D atom + large fragment, but two equal frag-ments of large clusters are also often observed, as describedabove and in Table I.
The distance d for D(1) and D(3) is given by
d = 2.9 n2B a0, (2)
where nB is the Bohr model principal quantum number for theelectron in the atom equal to 1 or 3, and a0 is the Bohr radiusequal to 52.9 pm. The factor 2.9 is found both from theory12
and with higher precision from rotational spectroscopy of RMclusters.24, 25 For RM with nB=3 or above, the ions leaving theCE are easily neutralized by picking up nearly resonant con-duction band electrons from the RM phase. These Rydbergspecies are easily field ionized by the weak electric field inthe detector. The typical KER for D(1) is 9.4 eV, while forD(3) the KER is 1.04 eV.26
B. Detection and calibration
The interpretation of the TOF spectra is of course depen-dent on the accurate calibration of the TOF measurements inthe apparatus. Since the particles observed are only acceler-ated by the CE and not by any voltage in the apparatus, thecalibration cannot use known ions or anything similar. Due tothe high kinetic energy of the particles detected here, they arenot deflected by the dynode potential in the detector like slowions or slow field ionizable particles but instead hit a stain-less steel plate (catcher foil) inside the detector, from which
Time-of-flight (µs)
0.0 0.5 1.0 1.5 2.0
Sig
nal (
coun
ts)
0
20
40
60
80
100
4<->4
2<->2
6(3+)
2<->10
6<->2
14<->14
2<->6
FIG. 10. A TOF spectrum used for calibration of the time-of-flight experi-ments from the position of the narrow 2↔2 peak.
positively charged particles are ejected or scattered. This isthe same method as used in Refs. 5–7. The flight distance tothe catcher foil plate is 101 mm, and this is the distance usedfor calibration of the results found here. TOF spectra fromD(-1) without an accelerating potential have been calibratedpreviously, giving the same flight distance.1, 5 The match ofdifferent peaks here to the theoretical TOF is good using thiscalibration, and there is no indication of any substantial error.Internal checks of the correctness of the calibration have alsobeen done. For example, the first edge of the TOF peaks ob-served should be at the large mass limit of heavy fragments ina CE process. The first TOF peak is mainly due to break-upfor example indicated as 2↔12 (2+).1, 5 This description in-dicates a process D7
3+ → D+ + D62+, where the D+ carries
away most of the KER of 2 × 630 eV=1260 eV. The errorin the TOF may be of the order of 10 ns from this observa-tion, which is the error likely from the MCS channel start.The match of different peaks to calculated TOF is good, andthere is no indication of any error larger than 10 ns in thecalibration.
Other checks may involve any sharp and uniquely identi-fied peaks in the spectra. The peaks assigned 2↔2 and 4↔4from symmetric fragmentation fulfill these requirements. Anexample of a spectrum with these two peaks is shown inFig. 10. The peak 2↔2 has a FWHM of 28 ns, while the peakposition agrees with theory within ±5 ns. Thus, the TOF cal-ibration is accurate within ±5 ns at this peak, meaning a rela-tive error of ±1%. This transfers to an accuracy of ±1 mm inthe flight distance of 101 mm.
VI. CONCLUSIONS
Ultradense deuterium can be produced in larger quanti-ties than previously by using the novel source described. Theproperties of the source and of the material produced are stud-ied as a function of several experimental parameters. Thisgives a useful background for further work on the develop-ment of small-scale laser-ignited nuclear fusion for energyproduction.
Downloaded 28 Aug 2013 to 130.236.171.186. This article is copyrighted as indicated in the abstract. Reuse of AIP content is subject to the terms at: http://rsi.aip.org/about/rights_and_permissions
The CE fragmentation processes in the material D(-1) indicate a common KER of 630 eV. This means an interatomic distance of 2.3 ± 0.1 pm,
There should be no peaks here!University of Iceland School of Natural Science and engineering
AVS 62 /SRI Ultra-dense Hydrogen and Low Energy Nuclear Reactions Sveinn Ólafsson and Leif Holmlid
Laser Intensitydependency
Frequency dependency
Author's personal copy
pulse, including absorption and heating due to the laser pulse, (3)interaction during the laser pulse, including chemical interactionbetween the surface and deuterium, (4) interaction during theplasma expansion, including evaporation and radiation. Whilethe previous study [7] mainly investigated the properties in phase1 above, the present study is mainly concerned with phase 3, thusthe interaction during the laser pulse.
2. Theory
Ultra-dense deuterium D(!1) has been investigated experimen-tally in our laboratory in a large number of published studies[1,2,8–11,23,24]. The observed kinetic energy release of up to630 eV corresponds to a bond distance of 2.3 ± 0.1 pm in theD(!1) clusters under normal conditions [8,9] . Experiments evenshow a D–D distance down to 2.14 ± 0.03 pm in equilibrium atroom temperature [11]. Due to the extremely high density ofD(!1), of the order of 1029 cm!3 (140 kg cm!3) this material is be-lieved to be very useful as target material for inertial confinementfusion (ICF) using intense pulsed lasers [8,9,25]. The best descrip-tion of D(!1) so far is that it is an inverted or contracted form ofthe dense (metallic) form D(1). This is based on the general ideasof dense hydrogen materials by Ashcroft and other authors[26,27]. The D–D values found in the experiments are close tothe theoretically expected distance for an inverted D(!1) materialof d!1 = (me/mD)1/2 d1 equal to 2.5 pm [8]. Only hydrogen isotopeatoms should give an ultra-dense material form, since the innerelectrons in all other atoms will prevent the formation of such amaterial. A similar ultra-dense protium material called p(!1) orH(!1) also exists [28].
D(1) and D(!1) are probably the two lowest excitation levels ofdeuterium Rydberg Matter (RM) [29–31]. For a recent review ofRM, see Ref. [32]. The energy level of D(!1) is slightly lower thanthat of D(1) [10]. These condensed deuterium forms are more com-plex than ordinary RM since they are quantum materials. The onlygood quantum numbers in RM in general are the orbital quantumnumber l and electron and nuclear spin quantum numbers. This isalso the case for D(!1), where the spin quantum numbers seem tobe most important. The interconversion between D(1) and D(!1) isfacile and even gives an oscillation between these two forms ofmatter [9]. Further details of the conversion are given in Ref.[23]. The experiments show that the D(!1) clusters have the formD2N, with N an integer. This shape is shown Fig. 1.
3. Experimental
The apparatus has been described in several publications, forexample in [3,33]. It has a base pressure <1 " 10!6 mbar. The lay-out of the setup used is shown in Fig. 2. The central source part hasbeen described separately [10]. The emitter in the source is a cylin-drical (extruded) sample of an industrial iron oxide catalyst doped
with K (initially at 8 wt.%) [34,35]. It is of the styrene catalyst typeShell S-105 which is an efficient hydrogen abstraction and transfercatalyst. The emitter is mounted in the tight-fitting opening of ametal tube which is connected to the D2 gas feed. The source metaltube is heated by an AC current through its wall up to 400 K. Deu-terium gas (>99.8% D2) is admitted through the source at a pres-sure up to 1 " 10!5 mbar in the chamber. The D(!1) formed fallsdown as clusters to a plate below the source. The D(!1) phase isat a slightly lower energy level than D(1) [10], which means thatit will be formed spontaneously. On the plate which is sloping at45! angle towards the horizontal, a foil of the surface material un-der test is mounted. A Nd:YAG laser with an energy of <200 mJ pereach 5 ns long pulse at 10 Hz is used at 532 nm. The laser beam isfocused at the test surface with an f = 400 mm spherical lens. Theintensity in the beam waist of (nominally) 30 lm diameter is rela-tively low, 64 " 1012 W cm!2 as calculated for a Gaussian beam.
Two different types of experiment have been done to study theefficiency of the laser-induced fusion on various materials. One ofthese is here called delayed TOF (time-of-flight), and employs ascintillator-PMT (photomultiplier) detector at a distance of112 cm from the center of the apparatus. The 5 cm thick plasticscintillator (BC-408, Saint-Gobain Crystals) has an entrance areaof 20 " 26 mm2 for the particle flux from the laser focus. The pho-tomultiplier (PMT) is Electron Tubes EMI 9813B with single elec-tron rise time of 2 ns and transit time of 46 ns. Blue glass filtersin front of the PMT decrease the observed laser signal. The cathodeof the PMT is covered by a light-tight Al foil and black plastic tape,leaving only 1 mm2 open for the impinging light to decrease thevery high signal. The signal is normally observed on a fast,300 MHz digital oscilloscope with or without a fast preamplifier.Many experiments have also employed pulse counting and a fastmulti-channel scaler with 5 ns time bins. Two different construc-tion parts in the particle beam to this detector are used to blocklow-energy particles or delay high-energy particles as shown inFig. 2. The inner one (closest to the target) is a box of stainless steelplate. The entrance slit to this box is at a distance of approximately73 mm from the center. Closer to the detector, at a distance of64 cm from the target, a beam-flag with 2–3 Al foils (each 15 lmthick) can be moved into the beam or completely out from thebeam. By moving these two blocking items, the signal to the detec-
Fig. 1. Shape of the chain or ‘‘bead’’ clusters D2N forming the superfluid phaseD(!1). Each pair D2 revolves around their common center of mass where theelectrons also are centered.
Detector
Valve
Laserbeam
Beam dump
D(-1) source abovelaser target
PMTFilter
Scintillator
Beam-flagand collector
Focusinglens
Al foil and tape
Inner plate box
Horizontal cut
Vertical cut
Fig. 2. Schematic horizontal cut of the apparatus, showing the details of thescintillator-PMT detector.
L. Holmlid / Nuclear Instruments and Methods in Physics Research B 296 (2013) 66–71 67
2.3 ± 0.1 pm!
University of Iceland School of Natural Science and engineering
AVS 62 /SRI Ultra-dense Hydrogen and Low Energy Nuclear Reactions Sveinn Ólafsson and Leif Holmlid
The Icelandic Research Fund 2016 Sveinn Ólafsson Detailed project description
Rydberg matter of Hydrogen, the ultra dense state, and the entangling Grann lattice structure Page 5 of 17
Laser pulse excites a Hydrogen cluster at time to resulting later in a measurement of breakup
cluster at time t1. The experiment gives the flight time ∆t of a cluster that can contain N atoms
and total has total mass N·mH. When the kinetic energy of the cluster at speed v=r(t)/∆t is
equated to the Coulomb potential energy at the initial distance ro the relation ro ~ ∆t2 is
obtained. The equation shows that the shorter the measured time of flight is the closer are the
initial cluster parts.
The time of flight figure shows the main surprise in LH’s work [14]. The bond distances ro ~
∆t2 are very short (0.6-2.3) pm, compared to the bond distance in a H2 molecule which is
70pm. Holmlid’s work is so varied and extensive that here we give only few references [5-
14], from his publication list. The full list can be found on his website.
The next figure page (6) shows the chemical state diagram that the Hydrogen atom can
form going from standard H2 molecule to Rydberg matter states and down to the ultra dense
state.
L. Holmlid / International Journal of Mass Spectrometry 352 (2013) 1– 8 5
Time-of -flight (µs)1.00.80.60.40.20.0
Sign
al (c
ount
s)
0
10
20
30
40
50
60
70
80
s=12160 eV2<->10
s=22<->10 (3+ )
s=12580 eV
Fig. 5. TOF results for the state D(s = 1) measured with the detector at 101 mm dis-tance, at 90◦ angle toward the laser beam. The signal is generated on the back of asteel foil with laser penetration through a small hole. The s = 1 curve is taken withlaser pulse energy 90 mJ and the s = 2 curve just before with 120 mJ. The process2 ↔ 10(+3) is a D+ ion repelled by a D5
2+ ion.
These results agree well with the here predicted state with s = 2,giving a value of the D–D distance in an RM structure of d = 2.9rq s2 = 2.23 pm. Higher precision studies on the high-charge CE ofD4 clusters [4] give the D–D bond distance as 2.15 ± 0.02 pm atlow (room) temperature. This agrees with the theoretical valuederived here within 4%. The dimensional factor d/rn = 2.9 used forRM in general [28] is known to vary with the surrounding struc-ture, and the 4% departure here means a dimensional factor of 2.80instead of 2.9. In one high-resolution rotational spectroscopy studyof large RM clusters [30], this factor was observed to vary down to2.816 ± 0.004 from the maximum value of 2.900 ± 0.001. It is notconsidered unlikely that the dimensional factor in this somewhatdifferent situation with spin instead of orbital angular momentacan be as low as 2.80 (thus a slightly shorter D–D distance thanpredicted by theory).
4.2. Lowest state d(s = 1)
Experimental evidence for d(s = 1) exists but requires more carethan the normal state s = 2. By studying the signal from a cold part ofthe d(−1) layer on a surface in Fig. 5, it is possible to observe fasterfragments than those corresponding to s = 2, with kinetic energyup to 2160 eV. This corresponds to a CE process 2 ↔ 10 with a totalKER of 2580 eV at s = 1, thus a fragmentation of d6 clusters. The coldlayer is found on the back side of a metal foil where the intense laserbeam has bored a hole in the metal foil. The flux leaving from theback side at a large angle from the laser beam contains such fastfragments, if the laser intensity is relatively low. At higher laserintensity, the slower TOF peaks signifying d4(s = 2) and other s = 2cluster fragments are obtained. In Fig. 5 also the s = 2 signal obtainedat large laser intensity is included for comparison. It is apparent thatsome s = 2 contribution exists at the lower laser intensity as well,and that some s = 1 signal is formed also at the higher laser intensity.The fastest limits for the two processes are indicated in the figure.The limiting process for s = 2 described as 2 ↔ 10(+3) in Fig. 5 is aD+ ion repelled by a D5
2+ ion.There exist previously published results which also give good
agreement with the expected energies from D(−1) in state s = 1.For example, in Ref. [3] several different time-of-flight peaks wereinterpreted (Table 1 in [3]). A few of them could only be under-stood as due to 2 ↔ 1 repulsions, thus repulsions between a doublycharged ion and a singly charged ion. This may be feasible for
example as d52+ ↔ d+ as concluded above. The observation of such
a process implies only a lifetime on the femtosecond scale of thed5
2+ ion before the CE process is completed. However, the accumu-lated evidence from numerous TOF and TOF-MS studies on D(−1)by now does not support the dominating formation of such dou-bly charged ions in the CE process at the laser intensity used there.See for example Ref. [9], Table 1. Thus, it is likely that the peaksobserved at very short TOF in the experiments in [3] should beinterpreted in a different way. These short TOFs fit well into thepresent d(s = 1) description. The reinterpreted peaks are given inTable 2. Two of them (less common) require the ejection of d2 frag-ments which was not known to exist by the time of the study in Ref.[3]. However, the ejection of such fragments from d(s = 2) has beendemonstrated for example in Ref. [9] and should also to be possiblefrom d(s = 1). That strong TOF peaks in [3] now can be reinterpretedas 2 ↔ 16 and 2 ↔ 2 for d(s = 1) supports the theoretical descriptiongiven here.
Further results in Ref. [3] were also interpreted as due to 2 ↔ 1CE processes, mainly results found by TOF-MS. When the initialkinetic energy was determined to be larger than 630 eV which isthe maximum for d(s = 2), it is possible that d(s = 1) is involved aswell. However, the results are not so clear-cut as the TOF resultsdescribed above. In Table 4 in Ref. [3], an initial kinetic energy of800 V per deuteron was observed as the limit found at the high-est laser pulse energy. This deuteron energy is too low to be easilyunderstood as due to d(s = 1) but within the range later identifiedfor complete fragmentation of clusters d4(s = 2) (process named8(4 + )S) giving four D fragments [4]. It should also be observed thatother effects exist that may decrease the observed kinetic energyof the fragments, like rotational excitation of d(−1) clusters whichis in the multi-eV range [11].
In another study [15] higher energy peaks were observed andinterpreted as due to 2 ↔ 1 CE processes. The energy observed perdeuteron in the TOF-MS results was up to 1020 eV. In this exper-iment, a short focusing length lens was used giving considerablyhigher laser intensity than in the studies described just above. Theinterpretation used in terms of 2 ↔ 1 processes seems correct andthere is no direct evidence for d(s = 1) in the TOF-MS results. How-ever, the TOF results also given in [15] gave peak energies of 1400 eVper deuteron, which agrees reasonably well with 2 ↔ 2 and 2 ↔ 3CE processes in d(s = 1) at 1290 and 1550 eV respectively. The mainexplanation for this peak provided in [15] (a 3+ against 1+ chargerepulsion process) is less likely in view of the new improved modelfor d(−1). Thus, this fast peak observed at high laser intensity isproposed to be due to d(s = 1).
4.3. Normal states p(s = 2) and p(s = 3)
Originally it was believed that the p–p distance in p(−1) wasdifferent from the d–d distance in d(−1). In Ref. [3], a p–p distanceof 3.7 pm was determined from an experimentally observed KER of390 eV. However, it is now found that this value is not the true valuefor the p–p distance. Instead, this value of 3.7 pm is probably dueto a cluster break-up as p+ ↔ (p2
+ − pN) which gives this approxi-mate distance of 3.7 pm between the two centered charges from atrue p–p distance of 5.0 pm corresponding to s = 3. In Figs. 6 and 7,results are shown that give values of p–p distances at 2.3 pm (s = 2)and 5.0 pm (s = 3). In Fig. 6, the first signal rise is constant inde-pendent of the accelerating voltage over a large range. This showsthat the particles giving this signal are neutral H atoms and haveenergy 620 eV, thus from fragmentation p+ ↔ pN
+ with N of theorder of 25 with s = 2. In Table 3, a detailed interpretation of theTOF results in Fig. 7 is given. The first rise of the signal in Fig. 7with an initial kinetic energy of 296 ± 27 eV agrees with the fullKER value from a state p(s = 3) which is 287 eV, but agrees also just
FIG. 1. Principle of the copper (Cu) cylinder setup. The temperature is read from the resistance of an NTC resistor fastenedto the outer surface of the Cu cylinder as shown in the left-hand figure. The chamber is pumped continuously at the deuteriumpressure of 1.0 mbar. No heat (left figure) is used in most experiments, while the highest gain is found for the constructionto the right where D(0) from a slightly heated source is collected on the Cu surface.
III. EXPERIMENTAL
The layout of the basic experimental setup is shown to the left in Fig. 1. A Nd:YAG laserwith nominal pulse energy of < 0.4 J at the laser was employed, with 5 ns pulses at 1064 nmand normally 10 Hz repetition rate. The laser was used at 1064 nm to maintain a more constantenergy calibration, not depending strongly on the tuning of the frequency doubling crystal used togive 532 nm light. Further, 1064 nm light seems to give less reflection than 532 nm from the Cusurfaces, thus improving the thermal calibration of the setup. The laser beam was normally focused
All article content, except where otherwise noted, is licensed under a Creative Commons Attribution 3.0 Unported license. See:http://creativecommons.org/licenses/by/3.0/ Downloaded to IP: 85.228.100.223 On: Mon, 10 Aug 2015 13:46:17
Calorimetry confirms break even fusion
But is this only fusion ?
There is more to this
University of Iceland School of Natural Science and engineering
AVS 62 /SRI Ultra-dense Hydrogen and Low Energy Nuclear Reactions Sveinn Ólafsson and Leif Holmlid
Laser induced results
2nd Reading
October 8, 2015 10:17 WSPC/S0218-3013 143-IJMPE 1550080
L. Holmlid
H(0)source
Target
62cm
95cm
Lens
195cm
Firstcollector
Secondcollector
Thirdcollector
Laser
Fig. 1. Principle of the apparatus used, vertical cut, with three simultaneous collectors. Theinner diameter of the tube is 100 mm.
PMT high voltage is 1600V. The signal from the PMT is analyzed by a 2048 chan-nel multi-channel analyzer (MCA) (Ortec EASY-MCA-2k with Maestro software).A preamplifier (Ortec VT120) with bandwidth 10–350MHz and gain 200 is usedfor the MCA measurements. A pulse-shaping amplifier (Ortec 440A) with shapingtime 0.5µs was used for the MCA spectra with total acqusition time of 500 s. Thecalibration of the PS detector used a 137Cs emitter to find the zero-signal cutoffin straight-line Kurie-like plots. With this cutoff corresponding to Q = 512keV,the calibration of 0.67 keV per channel was found. Thus, 1500 channels correspondto 1MeV for electrons in the PS. Since ions generate much fewer photons in thePS, the energy for ions at 1500 channels is much higher than 1 MeV. Protons at1.2MeV give five times fewer photons than electronsa which means that a peak at1.2MeV as found in the experiments indicates 6 MeV protons.
The main information about the ejected particles is obtained from three collec-tors located in the direction normal to the target plate, at varying distances fromthe target as shown in Fig. 1. They are named first, second and third in order ofincreasing distance from the target. The first collector can be rotated to vertical orhorizontal orientation (as also shown in the photos in Fig. 2). It is 1.5mm thick Alat a distance of 64 cm. When rotated to the vertical orientation, it allows passageof most of the particles to the other collectors. It covers 1.2 × 10⁻² sr above thetarget when closed. The second collector is a wire loop at a distance of 95 cm from
FIG. 1. Cut through source with detector at 90o toward the laser beam. Fastparticles form the laser fragmentation hit the catcher foil. The source can betilted around the laser focus and moved up and down in the chamber.
possible by controlled tilting of the 20 mm diameter gas feedtube by three external micrometer screws relative to the com-pressed Viton o-ring seal in the vacuum wall. Most impor-tant is that the source can be moved in the vertical directionin a controlled way by rotation of support screws. The lowermetal (Pt) tube with 6 mm outer diameter and wall thicknessof 100 µm is heated by an ac current though its wall. Theupper end of the 20 mm diameter tube passing the vacuumwall is at zero potential. The lower end is connected to a Cuclamp and supported thick flexible Cu cables which supplythe ac current. This clamp which also tightens the Pt tubeagainst the emitter holder tube is seen in Fig. 2. The cur-rent through the tube is up to 28 A, at a total power of 22 W.The D2 gas is heated in the tube to a temperature higher thanthe emitter. The main heat loss from the source is through the
FIG. 2. (Color online) Photo of the emitter and the lower part of the source.The copper block and the cables carry the heating current to the lower end ofthe Pt tube.
Cu clamp and cables. It is estimated that the highest emittertemperature at the center of the Pt tube is 475 K (200 ◦C) at28 A. In the results section, the current through the source isused as parameter since no definite temperature of the sourcecan be specified. The base pressure in the vacuum cham-ber is <1 × 10⁻⁶ mbar. Deuterium gas (>99.8% D2) is ad-mitted at a pressure in the chamber up to 1 × 10⁻⁵ mbar.The flow rate through the external needle valve is close to5 × 10−2 mbar dm3 s−1.
III. ANALYSIS
The methods used for the analysis of the material leavingthe source have been described in several publications.1, 2, 23
A Nd:YAG laser with an energy of <200 mJ per each 5 nslong pulse at 10 Hz is used at 532 nm. The laser beam is fo-cused with an f=400 mm spherical lens at the center of theUHV chamber. The intensity in the beam waist of (nomi-nally) 70 µm diameter is relatively low, ≤1012 W cm−2 ascalculated for a Gaussian beam. The diverging laser beamstops in a beam dump at the chamber wall. The detector isa dynode-scintillator-photomultiplier setup that is describedin detail elsewhere23 and shown in Fig. 1. The detector ishere located at an angle of 60o from the incoming laserbeam and measures the TOF spectra of neutral particles sinceno accelerating voltage is employed. The fast particles im-pact on a stainless steel foil in the detector, and fast ionsejected from there are drawn toward a Cu-Be dynode heldat −7.0 kV inside the detector. The total effective flight dis-tance for the ions from the laser focus to the catcher foil is101 mm, as found by direct measurement and internal cali-bration (see Sec. V). The photomultiplier (PMT) is ElectronTubes 9128B with single electron rise time of 2.5 ns andtransit time of 30 ns. Blue glass filters in front of the PMTdecrease the pulsed laser light signal observed by the PMTstrongly. The signal from the PMT is collected by a multi-channel scaler (EG&G Ortec Turbo-MCS) with preamplifier.The dwell time per channel used here is 5 ns. Each spectrumconsists of a sum of the fragment signals from 500 or 250 lasershots.
IV. RESULTS
The TOF spectra shown in the figures are interpreted inthe same way as done previously for D(-1).1–8 Predicted val-ues for the TOF for different cluster sizes and different frag-mentation patterns are given in Table I. Several entries thereare included for comparison and checking purposes and arenot always observed. In the final column in the table, the num-bers are given of the figures where the corresponding TOFpeaks are observed. A short description of the background forthe Coulomb explosion fragmentation processes is given inthe discussion.
A. Start of the source
In Fig. 3, a new experiment is shown, after several dayswith no D2 feed. In the two first spectra (from the bottom
Downloaded 28 Aug 2013 to 130.236.171.186. This article is copyrighted as indicated in the abstract. Reuse of AIP content is subject to the terms at: http://rsi.aip.org/about/rights_and_permissions
Particle Decay
Mesons,electrons positron, helium
and neutrons observed
Target contains catalyst that increases and maintains
the D(0), p(0) phase
University of Iceland School of Natural Science and engineering
AVS 62 /SRI Ultra-dense Hydrogen and Low Energy Nuclear Reactions Sveinn Ólafsson and Leif Holmlid
Leif Holmlid International Journal of Modern Physics E Vol. 24, No. 11 (2015) 1550080
Nuclear particle decay in a multi-MeV beam ejected by pulsed-laser impact on ultra-dense hydrogen H(0)
Just published
byLeif Holmlid
Total rate estimation
107-1010 s-1
University of Iceland School of Natural Science and engineering
AVS 62 /SRI Ultra-dense Hydrogen and Low Energy Nuclear Reactions Sveinn Ólafsson and Leif Holmlid
2nd Reading
October 8, 2015 10:17 WSPC/S0218-3013 143-IJMPE 1550080
Nuclear particle decay in a multi-MeV beam
-100 0 100 200 300 400 500
Sig
nal (
V)
e-4
e-3
e-2
e-1
M
Time (ns)
-100 0 100 200 300 400 500
Sig
nal (
V)
e-4
e-3
e-2
e-1A-> M -> N
τ1 τ2
τ2 = 38 ns
τ2 = 12 ns
A-> M -> N
τ1 τ2
τ2 = 13 ns
τ1 = 12 ns
M
Fig. 7. Matching of an intermediate particle from D(0) with Eq. (3) to the signal decay inFig. 6(c), second collector signal, bias −50 V, first collector open.
exist, or differences in the time of ejection from the target. Of course, a delay isincluded in the calculations in Figs. 8 and 9, lower panel as can be seen directly inthe figures.
The signal at the third collector with the first collector closed in Fig. 4(e) showsa special oscillatory behavior. This behavior was reproduced identically in a secondexperiment and also in other later experiments with a slightly different setup. Thereason for the oscillations is probably lepton pair formation by MeV neutral particleimpact.25 At a low voltage on the collector, the ratio between positive and negativecharges emitted varies with the voltage. A positive voltage due to a larger lossof negative charges (electrons) increases the loss of positive charges (positrons)which drives the collector more negative, and conversely, giving an oscillation ofthe voltage. The dominating period of the oscillation in Fig. 4(e) is close to 93 ns
1550080-11
University of Iceland School of Natural Science and engineering
AVS 62 /SRI Ultra-dense Hydrogen and Low Energy Nuclear Reactions Sveinn Ólafsson and Leif Holmlid
The difference observed between the signals for D(0) and p(0) is intriguing. The kaon KL0 may be formed in this case of
p(0) instead of K± in the case of D(0). This could mean that a down quark replaces an up quark in the laser-induced processes in p(0) relative to D(0).
These results show directly that the signal at long distance is mainly due to a mixture of intermediate particles formed by decay in the beam. The decaying signals have time constants of approximately 12 and 26 ns for ultra-dense deuterium D(0) and 52 ns for ultra-dense protium p(0). These decay time constants agree well with those for decay of light mesons.
These particles with narrow MeV energy distributions are formed by stepwise decay from particles like HN (0). The main result is that a decaying particle flux is formed by the laser-induced processes. The final muons produced may be useful for muon catalyzed fusion.
pulse, including absorption and heating due to the laser pulse, (3)interaction during the laser pulse, including chemical interactionbetween the surface and deuterium, (4) interaction during theplasma expansion, including evaporation and radiation. Whilethe previous study [7] mainly investigated the properties in phase1 above, the present study is mainly concerned with phase 3, thusthe interaction during the laser pulse.
2. Theory
Ultra-dense deuterium D(!1) has been investigated experimen-tally in our laboratory in a large number of published studies[1,2,8–11,23,24]. The observed kinetic energy release of up to630 eV corresponds to a bond distance of 2.3 ± 0.1 pm in theD(!1) clusters under normal conditions [8,9] . Experiments evenshow a D–D distance down to 2.14 ± 0.03 pm in equilibrium atroom temperature [11]. Due to the extremely high density ofD(!1), of the order of 1029 cm!3 (140 kg cm!3) this material is be-lieved to be very useful as target material for inertial confinementfusion (ICF) using intense pulsed lasers [8,9,25]. The best descrip-tion of D(!1) so far is that it is an inverted or contracted form ofthe dense (metallic) form D(1). This is based on the general ideasof dense hydrogen materials by Ashcroft and other authors[26,27]. The D–D values found in the experiments are close tothe theoretically expected distance for an inverted D(!1) materialof d!1 = (me/mD)1/2 d1 equal to 2.5 pm [8]. Only hydrogen isotopeatoms should give an ultra-dense material form, since the innerelectrons in all other atoms will prevent the formation of such amaterial. A similar ultra-dense protium material called p(!1) orH(!1) also exists [28].
D(1) and D(!1) are probably the two lowest excitation levels ofdeuterium Rydberg Matter (RM) [29–31]. For a recent review ofRM, see Ref. [32]. The energy level of D(!1) is slightly lower thanthat of D(1) [10]. These condensed deuterium forms are more com-plex than ordinary RM since they are quantum materials. The onlygood quantum numbers in RM in general are the orbital quantumnumber l and electron and nuclear spin quantum numbers. This isalso the case for D(!1), where the spin quantum numbers seem tobe most important. The interconversion between D(1) and D(!1) isfacile and even gives an oscillation between these two forms ofmatter [9]. Further details of the conversion are given in Ref.[23]. The experiments show that the D(!1) clusters have the formD2N, with N an integer. This shape is shown Fig. 1.
3. Experimental
The apparatus has been described in several publications, forexample in [3,33]. It has a base pressure <1 " 10!6 mbar. The lay-out of the setup used is shown in Fig. 2. The central source part hasbeen described separately [10]. The emitter in the source is a cylin-drical (extruded) sample of an industrial iron oxide catalyst doped
with K (initially at 8 wt.%) [34,35]. It is of the styrene catalyst typeShell S-105 which is an efficient hydrogen abstraction and transfercatalyst. The emitter is mounted in the tight-fitting opening of ametal tube which is connected to the D2 gas feed. The source metaltube is heated by an AC current through its wall up to 400 K. Deu-terium gas (>99.8% D2) is admitted through the source at a pres-sure up to 1 " 10!5 mbar in the chamber. The D(!1) formed fallsdown as clusters to a plate below the source. The D(!1) phase isat a slightly lower energy level than D(1) [10], which means thatit will be formed spontaneously. On the plate which is sloping at45! angle towards the horizontal, a foil of the surface material un-der test is mounted. A Nd:YAG laser with an energy of <200 mJ pereach 5 ns long pulse at 10 Hz is used at 532 nm. The laser beam isfocused at the test surface with an f = 400 mm spherical lens. Theintensity in the beam waist of (nominally) 30 lm diameter is rela-tively low, 64 " 1012 W cm!2 as calculated for a Gaussian beam.
Two different types of experiment have been done to study theefficiency of the laser-induced fusion on various materials. One ofthese is here called delayed TOF (time-of-flight), and employs ascintillator-PMT (photomultiplier) detector at a distance of112 cm from the center of the apparatus. The 5 cm thick plasticscintillator (BC-408, Saint-Gobain Crystals) has an entrance areaof 20 " 26 mm2 for the particle flux from the laser focus. The pho-tomultiplier (PMT) is Electron Tubes EMI 9813B with single elec-tron rise time of 2 ns and transit time of 46 ns. Blue glass filtersin front of the PMT decrease the observed laser signal. The cathodeof the PMT is covered by a light-tight Al foil and black plastic tape,leaving only 1 mm2 open for the impinging light to decrease thevery high signal. The signal is normally observed on a fast,300 MHz digital oscilloscope with or without a fast preamplifier.Many experiments have also employed pulse counting and a fastmulti-channel scaler with 5 ns time bins. Two different construc-tion parts in the particle beam to this detector are used to blocklow-energy particles or delay high-energy particles as shown inFig. 2. The inner one (closest to the target) is a box of stainless steelplate. The entrance slit to this box is at a distance of approximately73 mm from the center. Closer to the detector, at a distance of64 cm from the target, a beam-flag with 2–3 Al foils (each 15 lmthick) can be moved into the beam or completely out from thebeam. By moving these two blocking items, the signal to the detec-
Fig. 1. Shape of the chain or ‘‘bead’’ clusters D2N forming the superfluid phaseD(!1). Each pair D2 revolves around their common center of mass where theelectrons also are centered.
Detector
Valve
Laserbeam
Beam dump
D(-1) source abovelaser target
PMTFilter
Scintillator
Beam-flagand collector
Focusinglens
Al foil and tape
Inner plate box
Horizontal cut
Vertical cut
Fig. 2. Schematic horizontal cut of the apparatus, showing the details of thescintillator-PMT detector.
L. Holmlid / Nuclear Instruments and Methods in Physics Research B 296 (2013) 66–71 67
University of Iceland School of Natural Science and engineering
AVS 62 /SRI Ultra-dense Hydrogen and Low Energy Nuclear Reactions Sveinn Ólafsson and Leif Holmlid
103 10410−20
10−15
10−10
10−5
100
105
1010
1015
R [fm]
Rat
e [s−1
]
Rate of barrier crossing as function of distance R
<−−ppµ<−−pdµ
<−−ddµ
<−−p−p = 1.9e+01
<−−p−d = 9.6e−02
<−−d−d = 1.4e−05
<−−ddµ exp
<−−dtµ exp
p+pp+dd+d
Simple Tunnelling fusion rate model for Coulomb potentialRate = Gamov probability of crossing the barrier x attempt frequency
Reaction crossections are not includedCalculation are shown for f = 1016/s.
0.520 pms=1
2.3 pm
Author's personal copy
pulse, including absorption and heating due to the laser pulse, (3)interaction during the laser pulse, including chemical interactionbetween the surface and deuterium, (4) interaction during theplasma expansion, including evaporation and radiation. Whilethe previous study [7] mainly investigated the properties in phase1 above, the present study is mainly concerned with phase 3, thusthe interaction during the laser pulse.
2. Theory
Ultra-dense deuterium D(!1) has been investigated experimen-tally in our laboratory in a large number of published studies[1,2,8–11,23,24]. The observed kinetic energy release of up to630 eV corresponds to a bond distance of 2.3 ± 0.1 pm in theD(!1) clusters under normal conditions [8,9] . Experiments evenshow a D–D distance down to 2.14 ± 0.03 pm in equilibrium atroom temperature [11]. Due to the extremely high density ofD(!1), of the order of 1029 cm!3 (140 kg cm!3) this material is be-lieved to be very useful as target material for inertial confinementfusion (ICF) using intense pulsed lasers [8,9,25]. The best descrip-tion of D(!1) so far is that it is an inverted or contracted form ofthe dense (metallic) form D(1). This is based on the general ideasof dense hydrogen materials by Ashcroft and other authors[26,27]. The D–D values found in the experiments are close tothe theoretically expected distance for an inverted D(!1) materialof d!1 = (me/mD)1/2 d1 equal to 2.5 pm [8]. Only hydrogen isotopeatoms should give an ultra-dense material form, since the innerelectrons in all other atoms will prevent the formation of such amaterial. A similar ultra-dense protium material called p(!1) orH(!1) also exists [28].
D(1) and D(!1) are probably the two lowest excitation levels ofdeuterium Rydberg Matter (RM) [29–31]. For a recent review ofRM, see Ref. [32]. The energy level of D(!1) is slightly lower thanthat of D(1) [10]. These condensed deuterium forms are more com-plex than ordinary RM since they are quantum materials. The onlygood quantum numbers in RM in general are the orbital quantumnumber l and electron and nuclear spin quantum numbers. This isalso the case for D(!1), where the spin quantum numbers seem tobe most important. The interconversion between D(1) and D(!1) isfacile and even gives an oscillation between these two forms ofmatter [9]. Further details of the conversion are given in Ref.[23]. The experiments show that the D(!1) clusters have the formD2N, with N an integer. This shape is shown Fig. 1.
3. Experimental
The apparatus has been described in several publications, forexample in [3,33]. It has a base pressure <1 " 10!6 mbar. The lay-out of the setup used is shown in Fig. 2. The central source part hasbeen described separately [10]. The emitter in the source is a cylin-drical (extruded) sample of an industrial iron oxide catalyst doped
with K (initially at 8 wt.%) [34,35]. It is of the styrene catalyst typeShell S-105 which is an efficient hydrogen abstraction and transfercatalyst. The emitter is mounted in the tight-fitting opening of ametal tube which is connected to the D2 gas feed. The source metaltube is heated by an AC current through its wall up to 400 K. Deu-terium gas (>99.8% D2) is admitted through the source at a pres-sure up to 1 " 10!5 mbar in the chamber. The D(!1) formed fallsdown as clusters to a plate below the source. The D(!1) phase isat a slightly lower energy level than D(1) [10], which means thatit will be formed spontaneously. On the plate which is sloping at45! angle towards the horizontal, a foil of the surface material un-der test is mounted. A Nd:YAG laser with an energy of <200 mJ pereach 5 ns long pulse at 10 Hz is used at 532 nm. The laser beam isfocused at the test surface with an f = 400 mm spherical lens. Theintensity in the beam waist of (nominally) 30 lm diameter is rela-tively low, 64 " 1012 W cm!2 as calculated for a Gaussian beam.
Two different types of experiment have been done to study theefficiency of the laser-induced fusion on various materials. One ofthese is here called delayed TOF (time-of-flight), and employs ascintillator-PMT (photomultiplier) detector at a distance of112 cm from the center of the apparatus. The 5 cm thick plasticscintillator (BC-408, Saint-Gobain Crystals) has an entrance areaof 20 " 26 mm2 for the particle flux from the laser focus. The pho-tomultiplier (PMT) is Electron Tubes EMI 9813B with single elec-tron rise time of 2 ns and transit time of 46 ns. Blue glass filtersin front of the PMT decrease the observed laser signal. The cathodeof the PMT is covered by a light-tight Al foil and black plastic tape,leaving only 1 mm2 open for the impinging light to decrease thevery high signal. The signal is normally observed on a fast,300 MHz digital oscilloscope with or without a fast preamplifier.Many experiments have also employed pulse counting and a fastmulti-channel scaler with 5 ns time bins. Two different construc-tion parts in the particle beam to this detector are used to blocklow-energy particles or delay high-energy particles as shown inFig. 2. The inner one (closest to the target) is a box of stainless steelplate. The entrance slit to this box is at a distance of approximately73 mm from the center. Closer to the detector, at a distance of64 cm from the target, a beam-flag with 2–3 Al foils (each 15 lmthick) can be moved into the beam or completely out from thebeam. By moving these two blocking items, the signal to the detec-
Fig. 1. Shape of the chain or ‘‘bead’’ clusters D2N forming the superfluid phaseD(!1). Each pair D2 revolves around their common center of mass where theelectrons also are centered.
Detector
Valve
Laserbeam
Beam dump
D(-1) source abovelaser target
PMTFilter
Scintillator
Beam-flagand collector
Focusinglens
Al foil and tape
Inner plate box
Horizontal cut
Vertical cut
Fig. 2. Schematic horizontal cut of the apparatus, showing the details of thescintillator-PMT detector.
L. Holmlid / Nuclear Instruments and Methods in Physics Research B 296 (2013) 66–71 67
2.3 ± 0.1 pm!100kW/mole D(0)
University of Iceland School of Natural Science and engineering
AVS 62 /SRI Ultra-dense Hydrogen and Low Energy Nuclear Reactions Sveinn Ólafsson and Leif Holmlid
2,23 pms=2
Not drawn to scale
6. Summary
1. Ultra dense hydrogen can be the source of all or part of Cold fusion LENR related phenomena.
2. Laser induced fusion in Ultra dense hydrogen seemingly produces mesons, possibly in a proton or neutron meson spallation process. (Full 4π calorimetric high energy particle detection exp. needed)
3. If confirmed, such process releases similar or higher energy than fission of Uranium 200MeV.
4. Rossi Ni-H product commercialized 2016? 5. Limited energy system disruption starts 2016 and takes 5-20 years? 6. Funded basic research in cold fusion starting 2016-2017? 7. Full scale energy system disruption possible 2020-2030? 8. Theory possible 2017-2019?
University of Iceland School of Natural Science and engineering
AVS 62 /SRI Ultra-dense Hydrogen and Low Energy Nuclear Reactions Sveinn Ólafsson and Leif Holmlid
083306-3 L. Holmlid and S. Olafsson Rev. Sci. Instrum. 86, 083306 (2015)
FIG. 1. Detector part from vacuum components. The PMT part and the PSpart are indicated. Without the PS part, a metal blind flange is used to closethe tube.
MCA spectra of 500 s duration. When the converter is to bechanged, the PMT enclosure is opened and closed in darkness,with the HV o↵, with no other change in position of the detec-tor. Another MCA was also used, giving the same beta-likedistributions. Most experiments were run in darkness, evenwith black cloth covering the detector parts to avoid any lightleakage.
The electron energy scale of the PS is calibrated bymeasuring the beta emission from a 137Cs probe (37 kBq,Gammadata, Uppsala, Sweden). Measurements are made inair with and without a 20 µm thick Al foil in front of thescintillator. The shifting of the beta signal with a blue-filterin front of the PMT is verified, proving that the beta particlesinteract with the PS. A plot of the square root of the number ofcounts (signal-background) (Kurie-like plot) gives zero signaldue to 137Cs at 765 channels with gain = 1 in the amplifierOrtec 440 A and gain 200 in the preamplifier. Q = 512 keVgives the approximate calibration of 0.67 keV/channel. Asimilar calibration of only the PMT in Fig. 2 without the PSgives zero intercept signal due to 137Cs at 170 channels withthe same electronics. This gives an approximate calibrationof 3.0 keV/channel. A tentative linear scale is used to tag thevarious features relative to these calibrations.
The time variation of the total signal was measured bya multi-channel scaler (MCS) with 1 s dwell time per chan-nel (EG&G Ortec Turbo-MCS). The pulse signal from the
FIG. 2. A 137Cs probe at the PMT with no metal flange. The approximateKurie plot shows the zero signal intercept at 170 channels corresponding toQ= 512 keV.
PMT was analyzed after recording by a fast digital oscil-loscope (Tektronix TDS 3032, 300 MHz). A GM detector(Rados RDS-80) gives slightly higher signal where the PMTindicates enhanced external signal. The gamma signal wasmeasured with Mirion Technologies PDS-100G without anyhigher signal detected at the apparatus. In Table I, some rangesof interest for electrons and muons in Fe, Al, and in thescintillator material are collected.
The place of origin of the beta-type signal must also beknown. From tests with a 137Cs beta emitter, it is apparent thatbeta electrons even with relatively high energy (Q = 512 keV)cannot penetrate the thick metal walls used here for the PMTenclosure without large energy loss. Thus, the electrons
TABLE I. Ranges for a few energies of electrons and negative muons in thematerials used. Data from the electron database at NIST,36 from muon rangesin Ref. 39 and from manufacturer’s data.37
ParticleEnergy(MeV)
Range insteel (mm)
Range inAl
Range in plasticscintillator (µm)
Range inair (m)
e� 0.03 9 µm 10 0.018e� 0.1 69 µm 150 0.143e� 0.3 410 µm 700 1.1e� 1 0.77 2.0 mm 4000 4.4e� 10 7.6 26 mm 46µ� 10 1.3 3.4 mm 7.1µ� 20 4.3 11.4 mm 24
This article is copyrighted as indicated in the article. Reuse of AIP content is subject to the terms at: http://scitationnew.aip.org/termsconditions. Downloaded to IP:130.208.168.119 On: Fri, 07 Aug 2015 14:15:15
University of Iceland School of Natural Science and engineering
AVS 62 /SRI Ultra-dense Hydrogen and Low Energy Nuclear Reactions Sveinn Ólafsson and Leif Holmlid
117 keV using the electron energy scale from 137Cs calibration
of the PS. The conversion factor for the glass converter isunknown but probably much larger, corresponding to particleenergies of MeV size similar to those measured by time-of-flight in vacuum [3,6].
A signal of a similar shape is observed also without glassconverter in Figs. 4 and 5, but much lower. This signal isapparently due to particle conversion in the glass envelope ofthe PMT of the same type as taking place in the glass con-verters. (A thick clear glass plate instead of the blue-filter givesa similar but slightly smaller signal). One example with thedetector at 3 m distance from the apparatus is shown in Fig. 8,
spectrum 2. The other spectra in that figure are measuredconsecutively before and after spectrum 2. They show alsovery high particle energies, similar to laser-induced spectrawhen the detector is mounted on the chamber. Such laser-induced pulses have been shown (submitted) to be due toparticles delayed by gas in the chamber and with the PSscintillation energy shifted by the blue-filter. The particlesobserved here in Fig. 8 have apparently moved to the detector,before interacting with the structure in the detector. That theparticles from the blue-filter have the same energy as thescintillations of the ions in the PS is probably a coincidence.
Other glass filters and filters of other materials functionalso well as converters, with one further example in the threeconsecutive energy spectra in Fig. 9. Also two identical filterssimultaneously give an interesting behavior, as seen in Fig. 10.There, the spectrum using two blue-filters is taken as number2 of three consecutive spectra. That the signal in spectrum 2 isnot just doubled but increased further indicates that theinteraction of the particles with the glass material is complex.
Such conversion processes have also been tested by otherfilters. In Fig. 11, four consecutive spectra are shown (startingwith no filter, from the top of the list) where a grey filter with
optical density OD2 is used separately and also combinedwitha blue-filter. In the lower panel, it is shown that the grey filter(transmission thus only 1%) both decreases the number ofcounts (but less than a factor of 10) at low energies relative tothe blue-filter and shifts the intensity at large energies to the
left, to lower energies. This energy shift is much less than afactor of 100, and the decrease in the number of counts is alsomuch less than a factor of 100. Thus, the main signal both at
high and low energies is not caused by photons in the visiblerange, but by high energy photons or electrons which are onlypartially absorbed or scattered by the grey filter.
These mechanisms have been checked further. The greyfilter can be placed on the other side of the blue-filter, outsidethe blue-filter from the PMT. This gives a signal similar to theblue-filter alone, thus with no interaction of the grey filterwith the particles or photons from the blue-filter. A 20 mm
Fig. 8 e High-intensity spectra at 3 m distance from thechamber. The high-energy intensity is probably due toparticles with up to 20 MeV energy. Spectra measuredconsecutively in direct order 1e3. Two blue-filters wereused for spectrum 1. Changing converter took 60 s.
Fig. 10 e Effect of two blue-filters, spectra taken in directorder 1e3. At 3 m distance from chamber. Note the high-energy tail in spectrum 2.
i n t e r n a t i o n a l j o u r n a l o f h y d r o g e n en e r g y x x x ( 2 0 1 5 ) 1e96
Please cite this article in press as: Holmlid L, Olafsson S, Spontaneous ejection of high-energy particles fromultra-dense deuteriumD(0),International Journal of Hydrogen Energy (2015), http://dx.doi.org/10.1016/j.ijhydene.2015.06.116
Spontaneous
083306-3 L. Holmlid and S. Olafsson Rev. Sci. Instrum. 86, 083306 (2015)
FIG. 1. Detector part from vacuum components. The PMT part and the PSpart are indicated. Without the PS part, a metal blind flange is used to closethe tube.
MCA spectra of 500 s duration. When the converter is to bechanged, the PMT enclosure is opened and closed in darkness,with the HV o↵, with no other change in position of the detec-tor. Another MCA was also used, giving the same beta-likedistributions. Most experiments were run in darkness, evenwith black cloth covering the detector parts to avoid any lightleakage.
The electron energy scale of the PS is calibrated bymeasuring the beta emission from a 137Cs probe (37 kBq,Gammadata, Uppsala, Sweden). Measurements are made inair with and without a 20 µm thick Al foil in front of thescintillator. The shifting of the beta signal with a blue-filterin front of the PMT is verified, proving that the beta particlesinteract with the PS. A plot of the square root of the number ofcounts (signal-background) (Kurie-like plot) gives zero signaldue to 137Cs at 765 channels with gain = 1 in the amplifierOrtec 440 A and gain 200 in the preamplifier. Q = 512 keVgives the approximate calibration of 0.67 keV/channel. Asimilar calibration of only the PMT in Fig. 2 without the PSgives zero intercept signal due to 137Cs at 170 channels withthe same electronics. This gives an approximate calibrationof 3.0 keV/channel. A tentative linear scale is used to tag thevarious features relative to these calibrations.
The time variation of the total signal was measured bya multi-channel scaler (MCS) with 1 s dwell time per chan-nel (EG&G Ortec Turbo-MCS). The pulse signal from the
FIG. 2. A 137Cs probe at the PMT with no metal flange. The approximateKurie plot shows the zero signal intercept at 170 channels corresponding toQ= 512 keV.
PMT was analyzed after recording by a fast digital oscil-loscope (Tektronix TDS 3032, 300 MHz). A GM detector(Rados RDS-80) gives slightly higher signal where the PMTindicates enhanced external signal. The gamma signal wasmeasured with Mirion Technologies PDS-100G without anyhigher signal detected at the apparatus. In Table I, some rangesof interest for electrons and muons in Fe, Al, and in thescintillator material are collected.
The place of origin of the beta-type signal must also beknown. From tests with a 137Cs beta emitter, it is apparent thatbeta electrons even with relatively high energy (Q = 512 keV)cannot penetrate the thick metal walls used here for the PMTenclosure without large energy loss. Thus, the electrons
TABLE I. Ranges for a few energies of electrons and negative muons in thematerials used. Data from the electron database at NIST,36 from muon rangesin Ref. 39 and from manufacturer’s data.37
ParticleEnergy(MeV)
Range insteel (mm)
Range inAl
Range in plasticscintillator (µm)
Range inair (m)
e� 0.03 9 µm 10 0.018e� 0.1 69 µm 150 0.143e� 0.3 410 µm 700 1.1e� 1 0.77 2.0 mm 4000 4.4e� 10 7.6 26 mm 46µ� 10 1.3 3.4 mm 7.1µ� 20 4.3 11.4 mm 24
This article is copyrighted as indicated in the article. Reuse of AIP content is subject to the terms at: http://scitationnew.aip.org/termsconditions. Downloaded to IP:130.208.168.119 On: Fri, 07 Aug 2015 14:15:15
University of Iceland School of Natural Science and engineering
AVS 62 /SRI Ultra-dense Hydrogen and Low Energy Nuclear Reactions Sveinn Ólafsson and Leif Holmlid
Spontaneous
University of Iceland School of Natural Science and engineering
AVS 62 /SRI Ultra-dense Hydrogen and Low Energy Nuclear Reactions Sveinn Ólafsson and Leif Holmlid
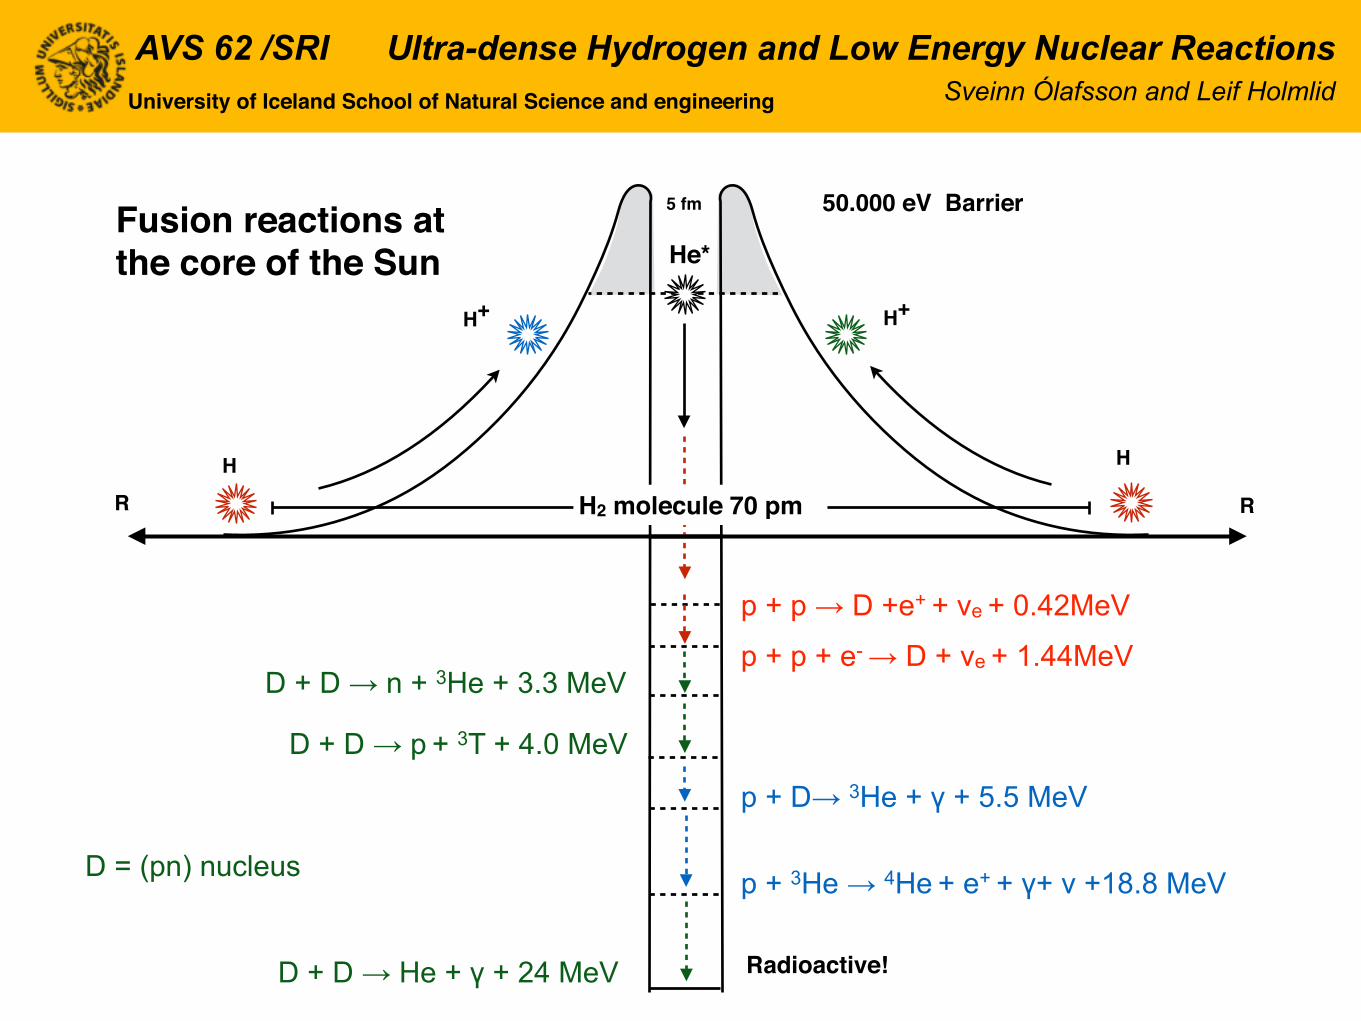
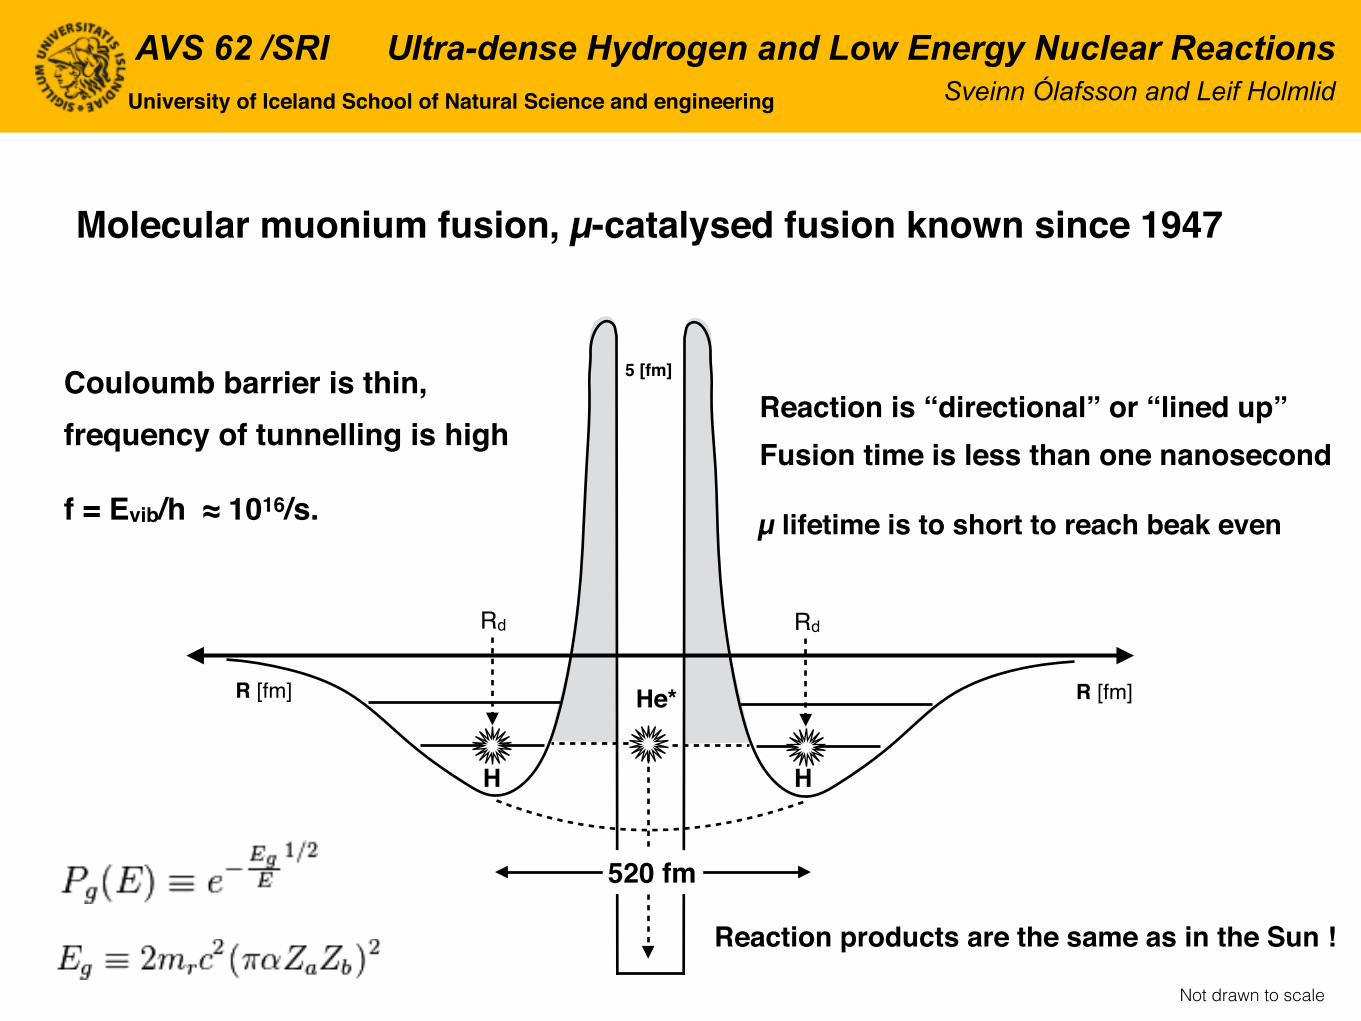
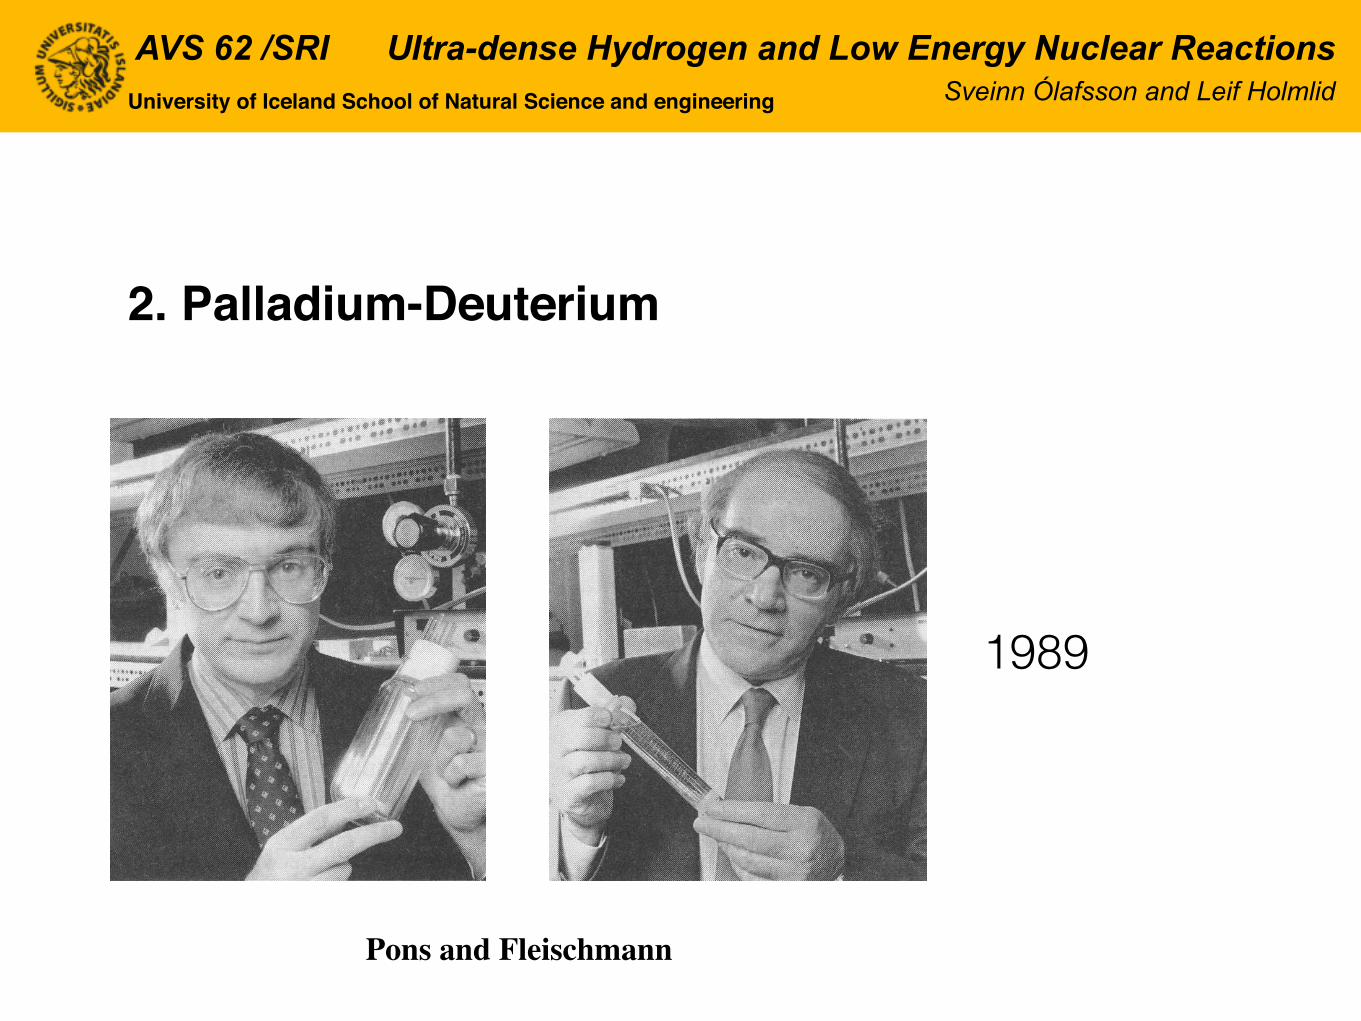
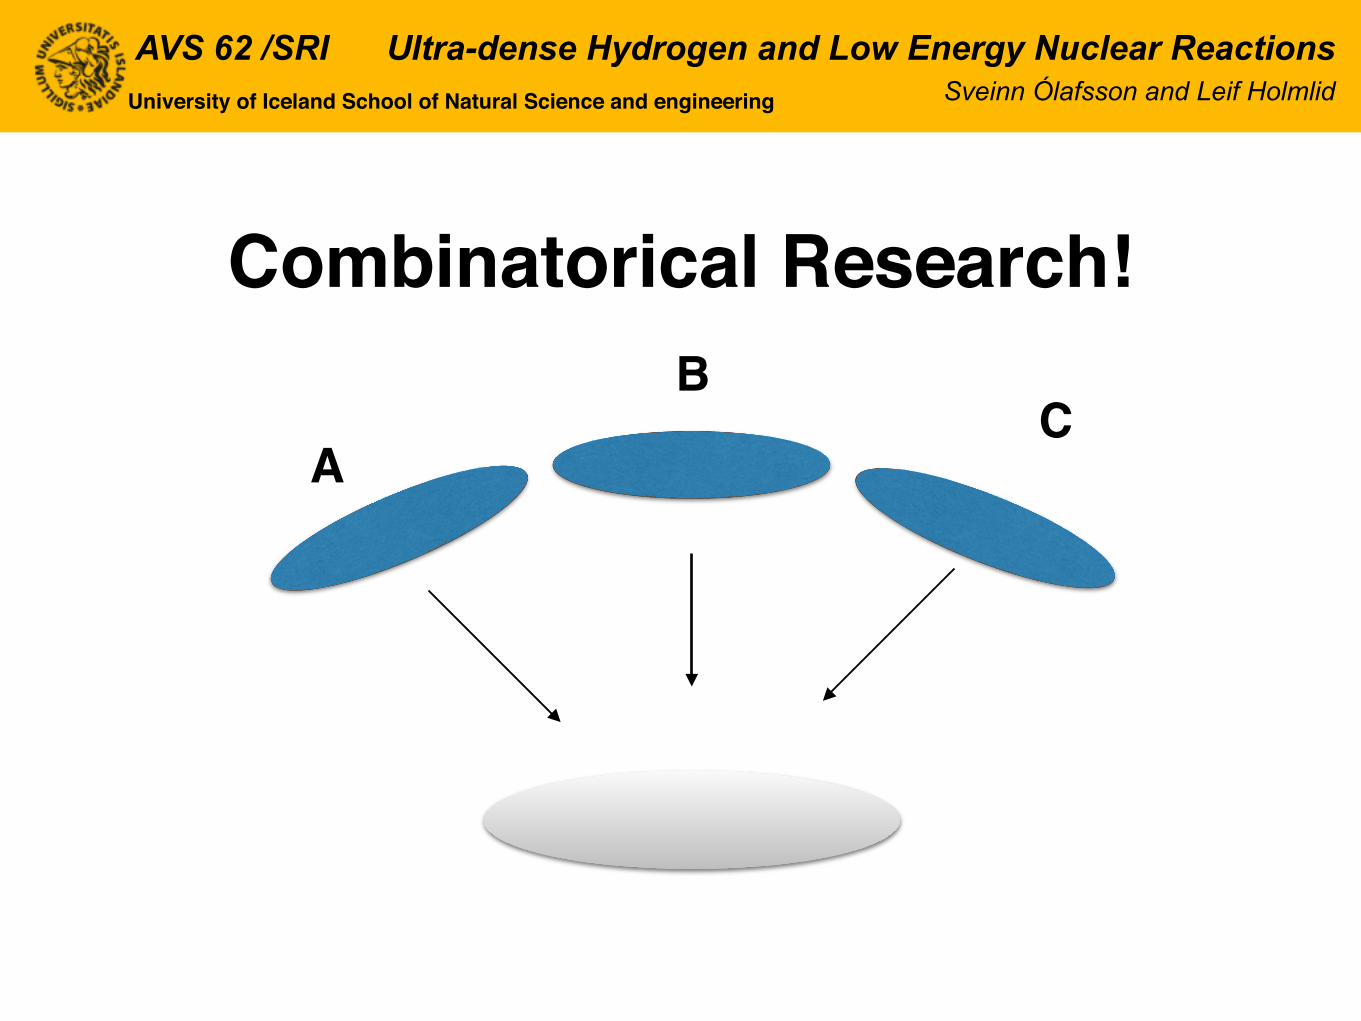
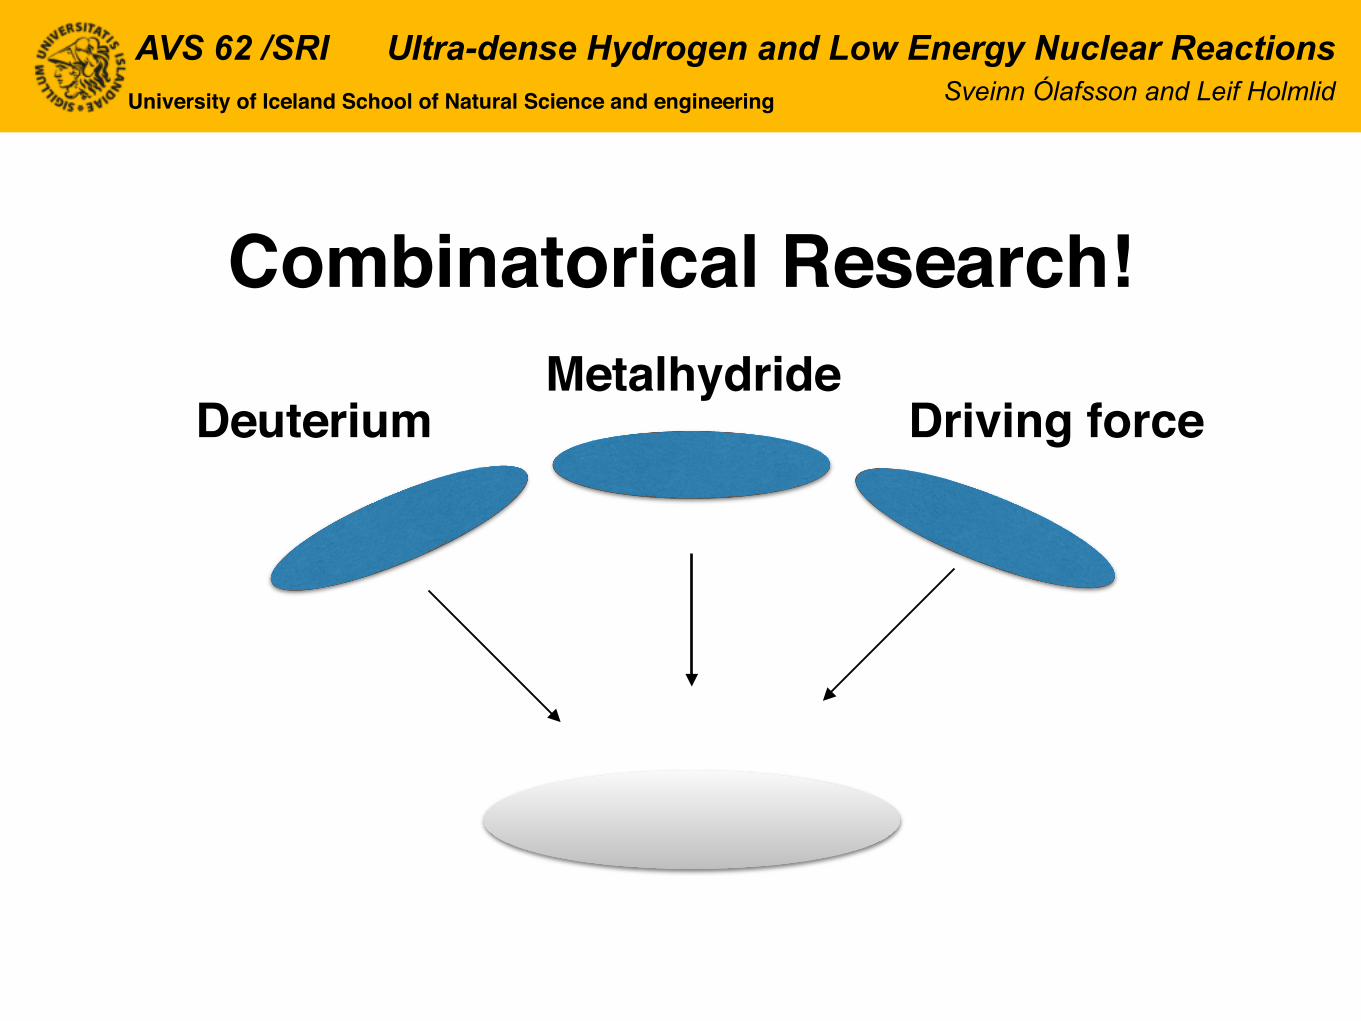
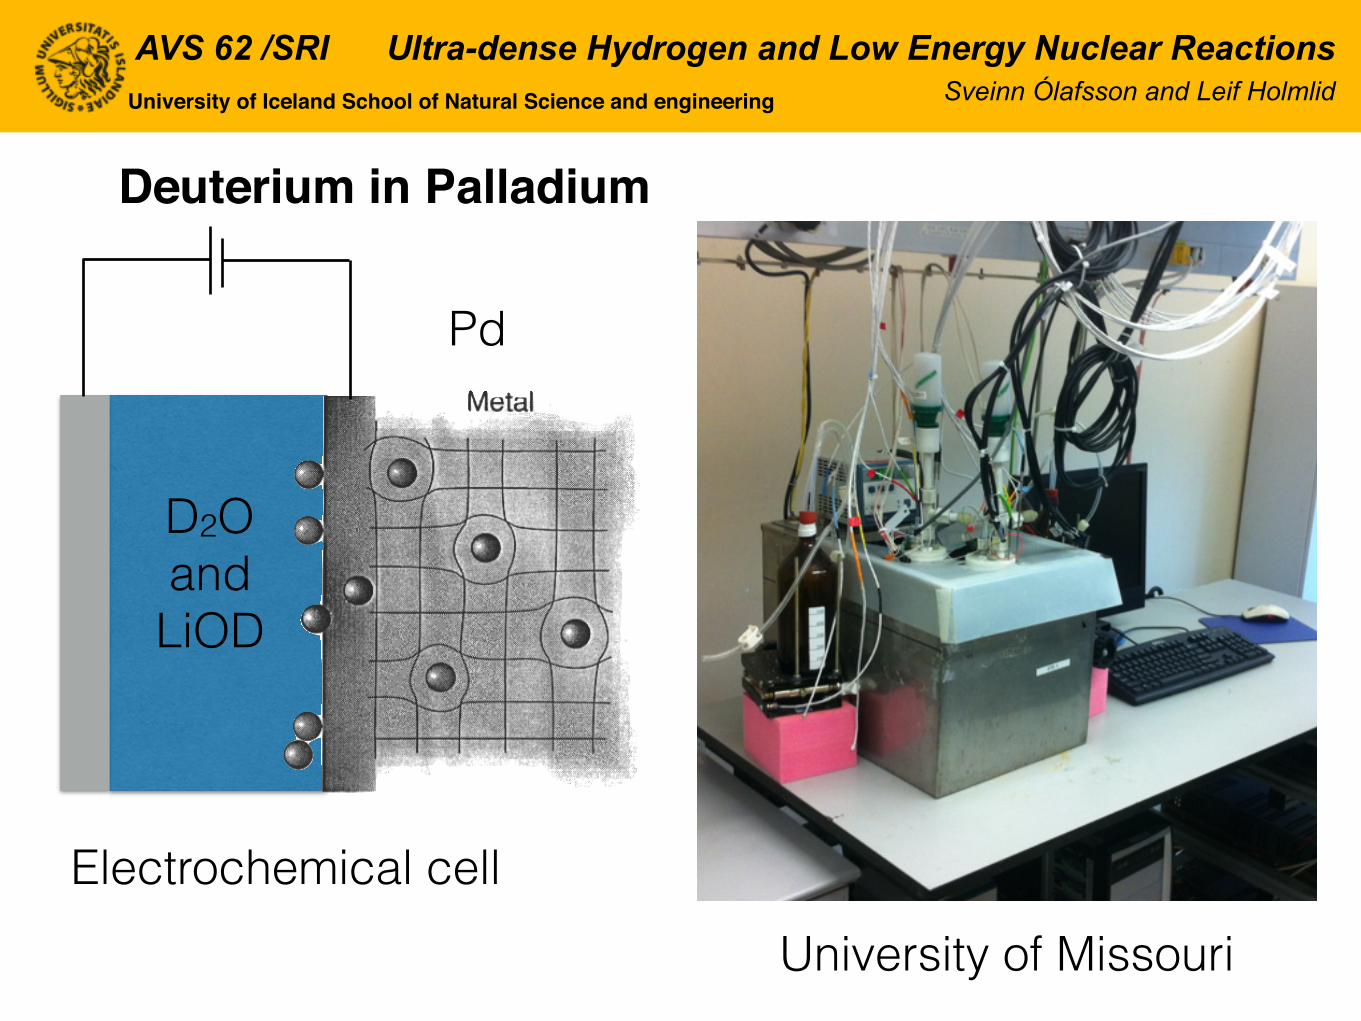
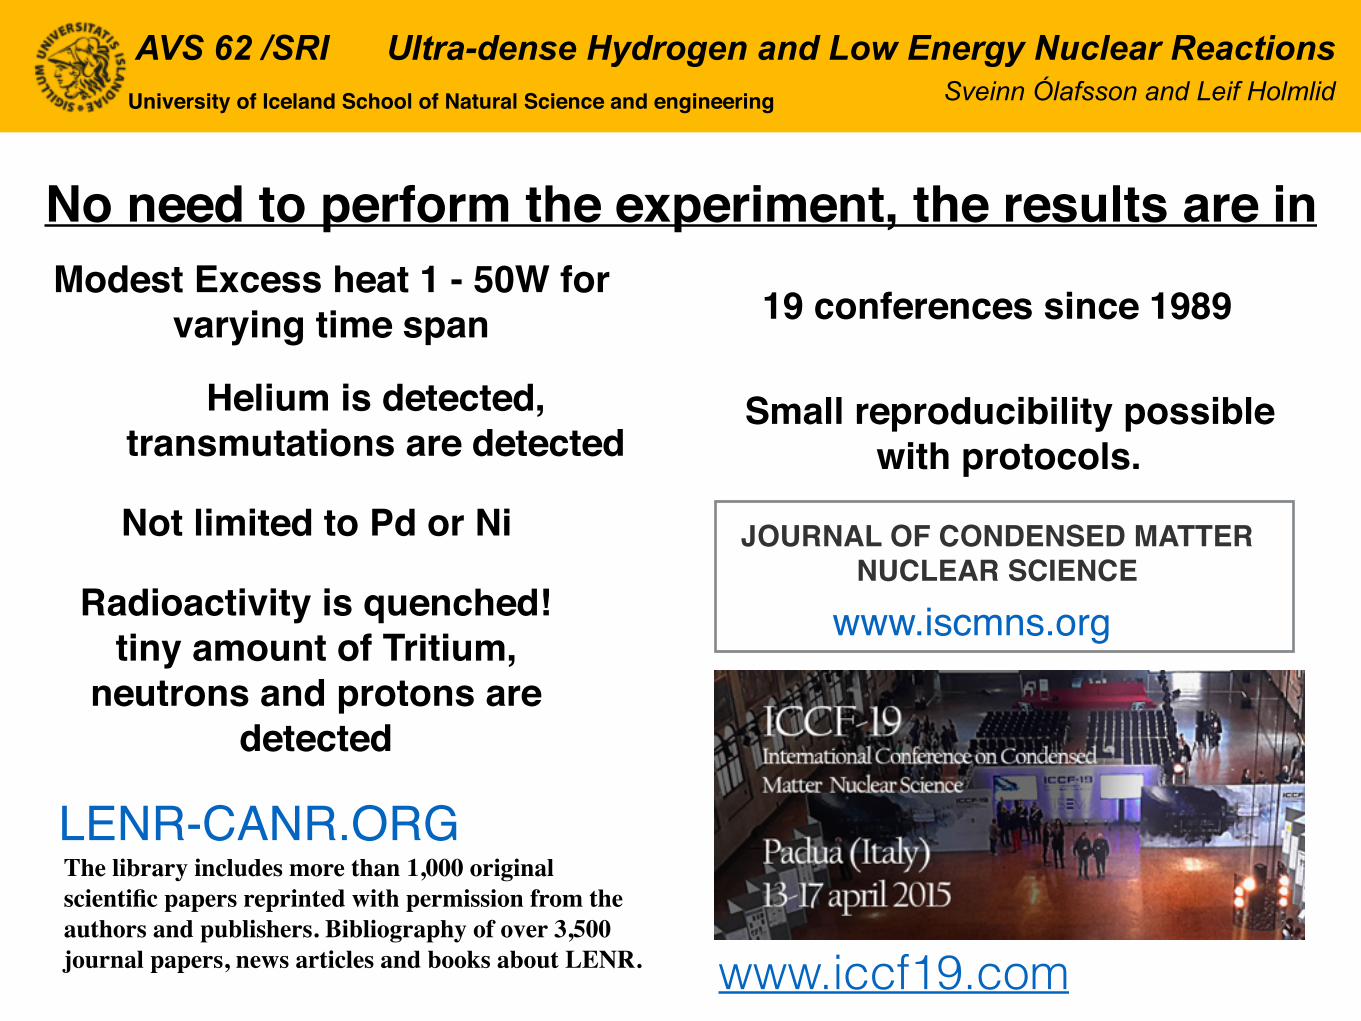
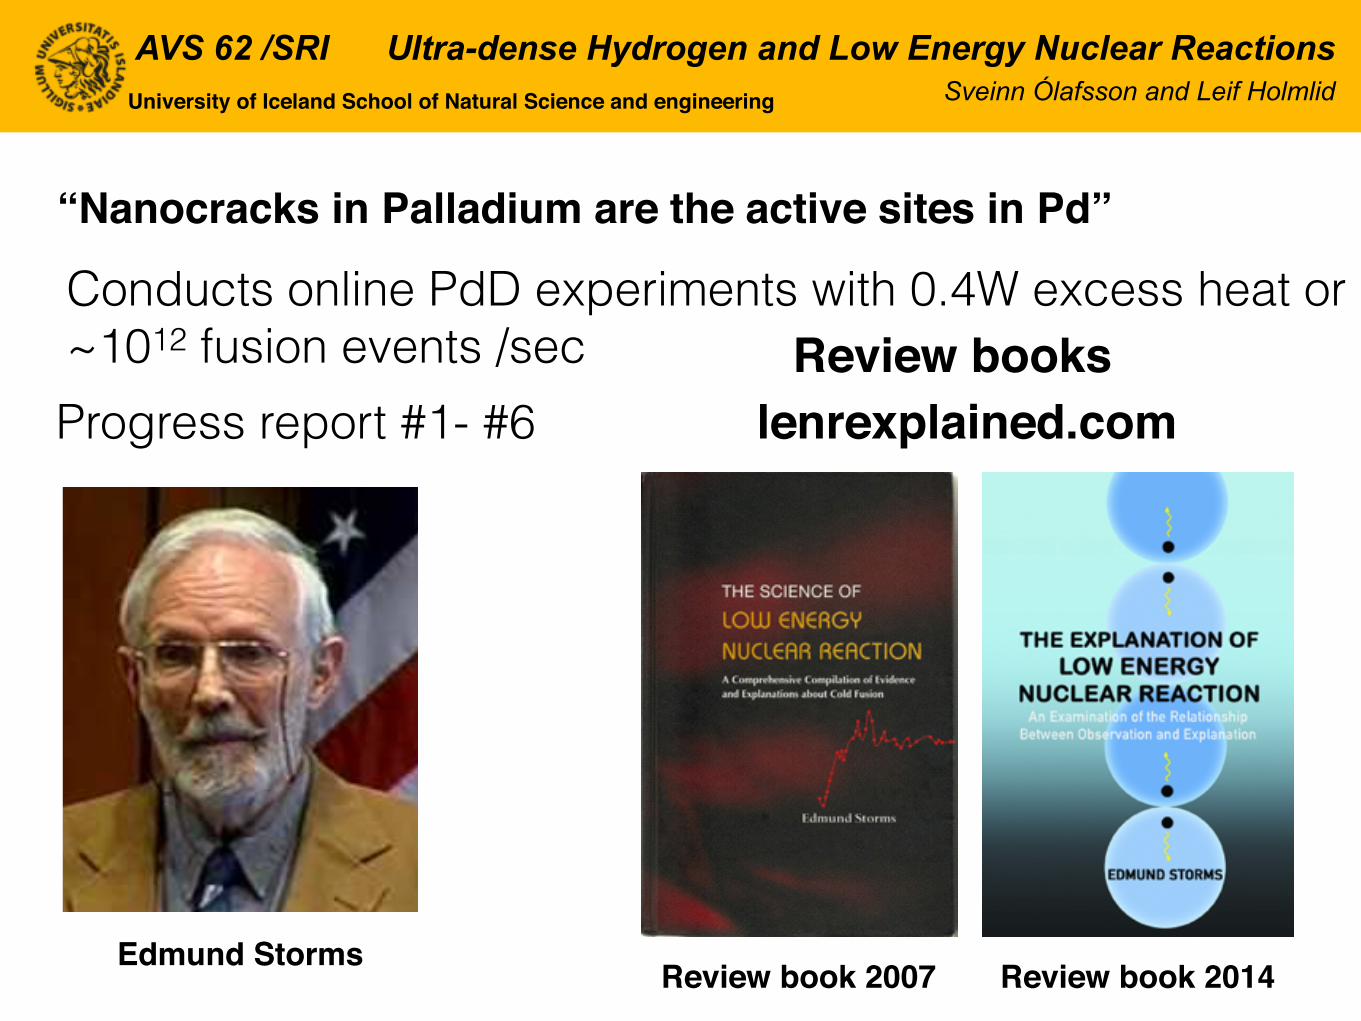
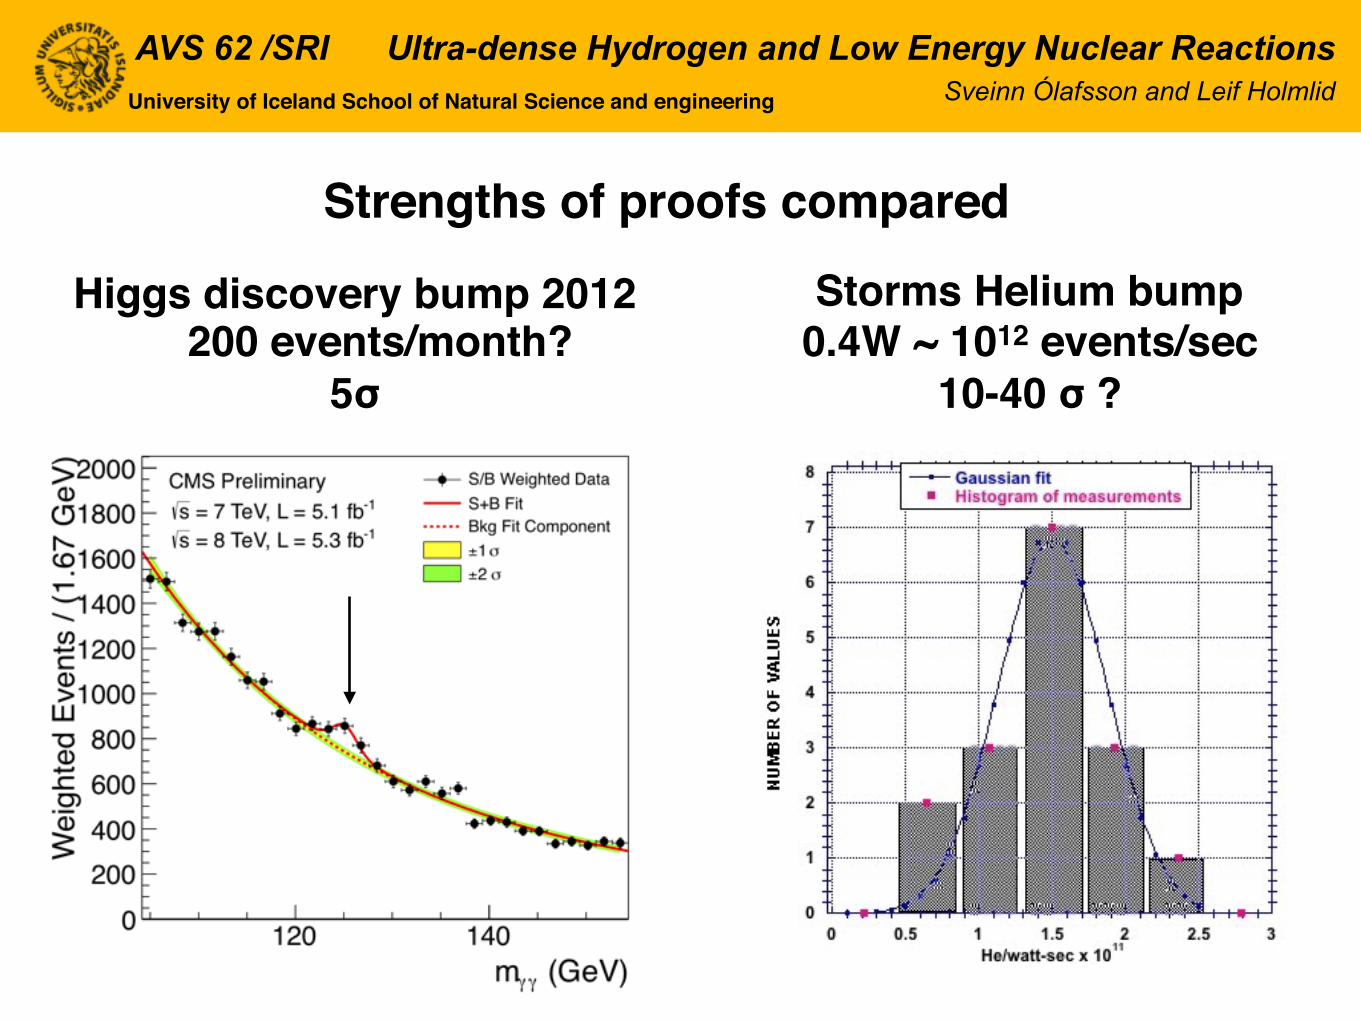
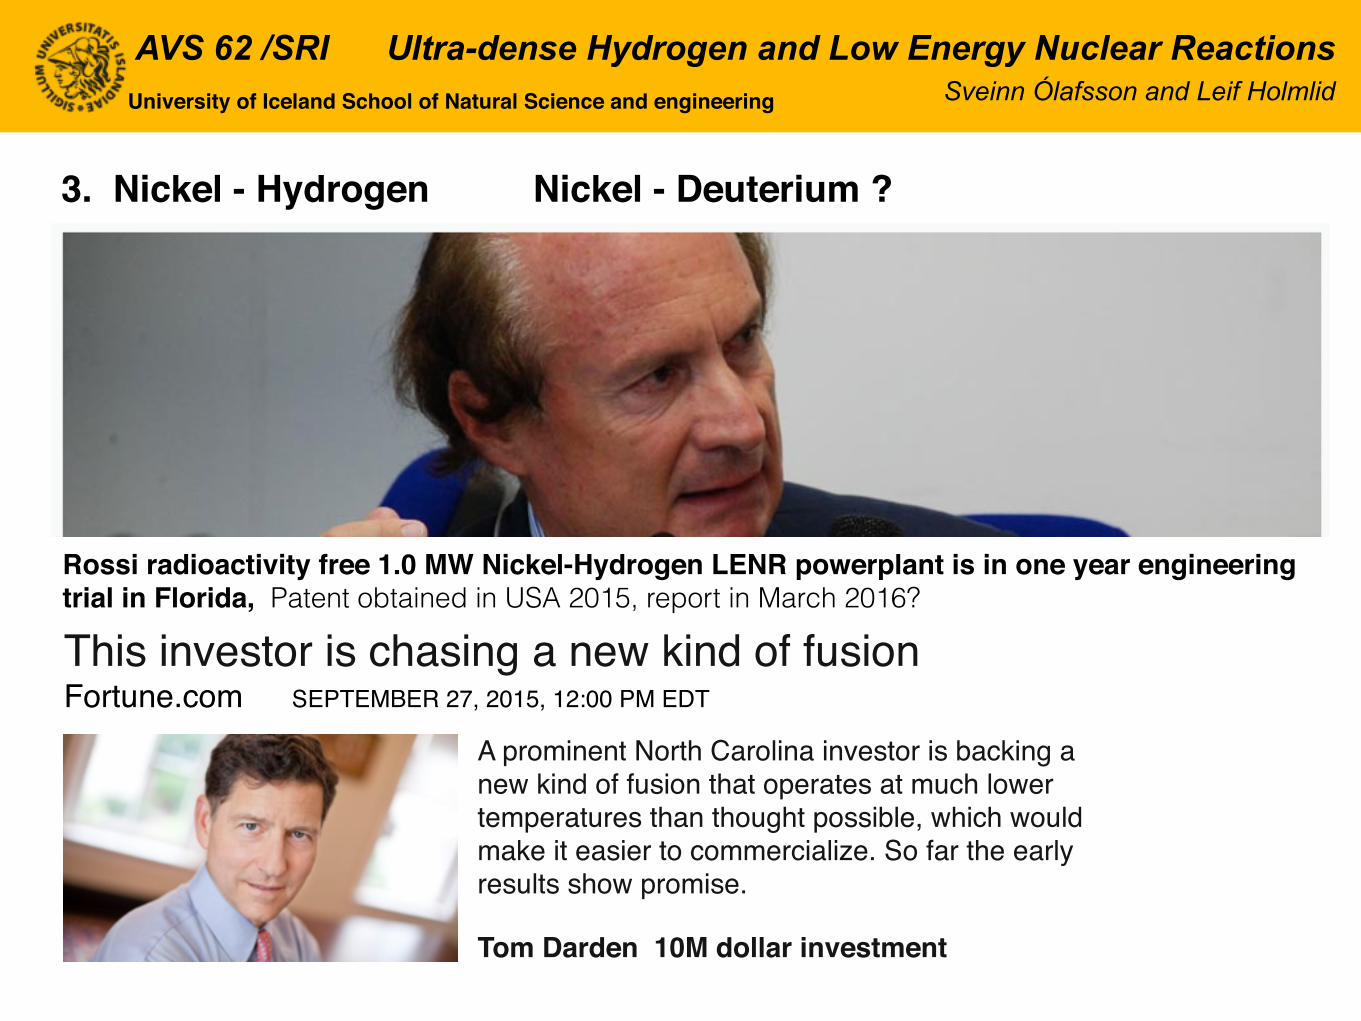
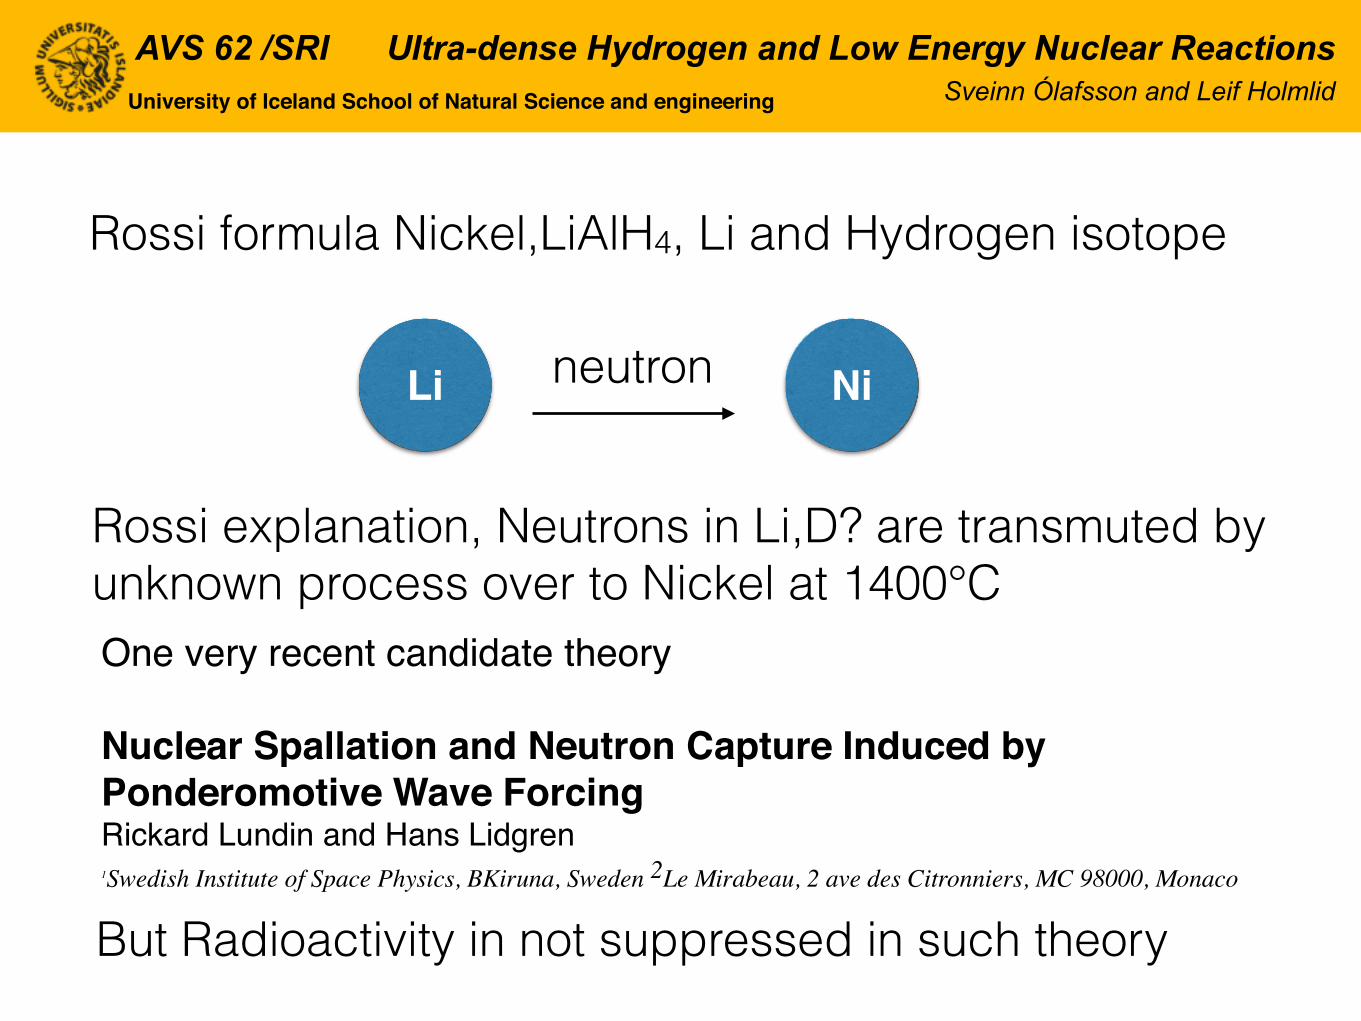
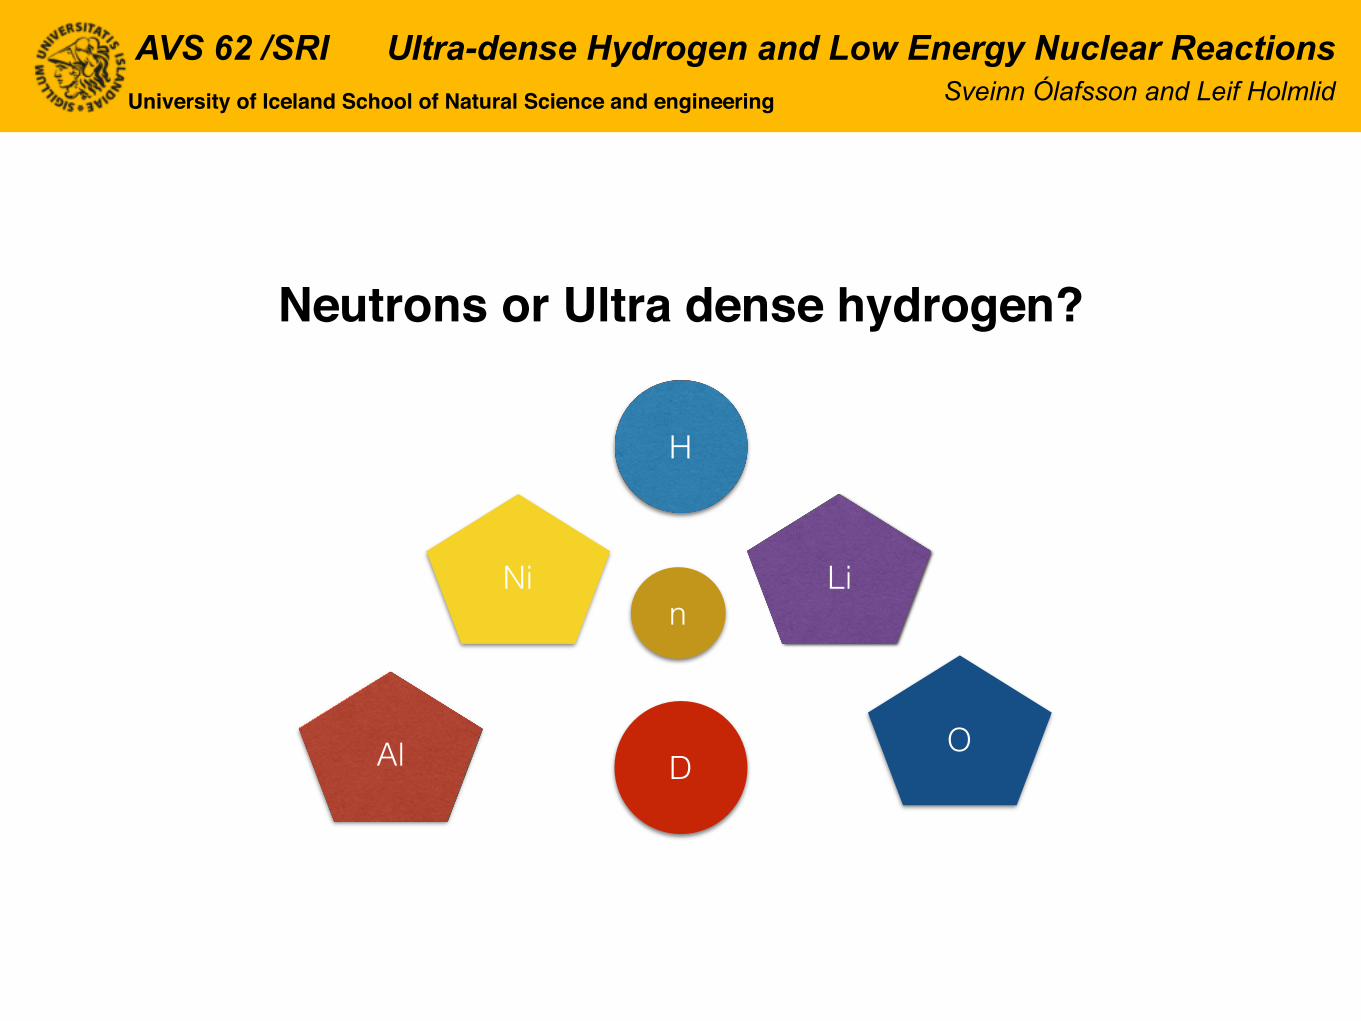
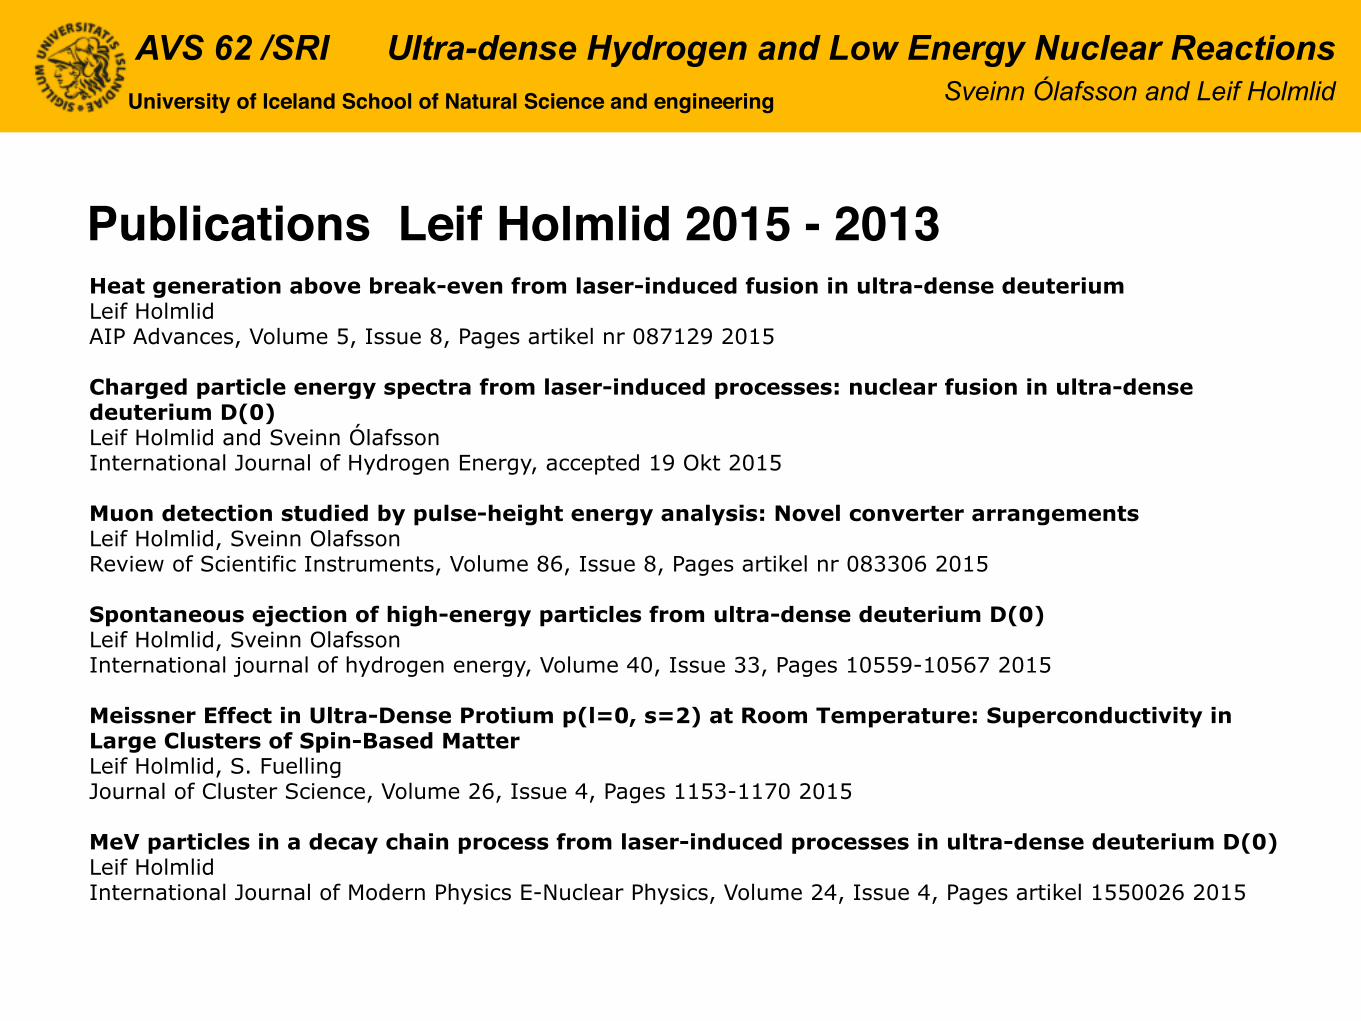
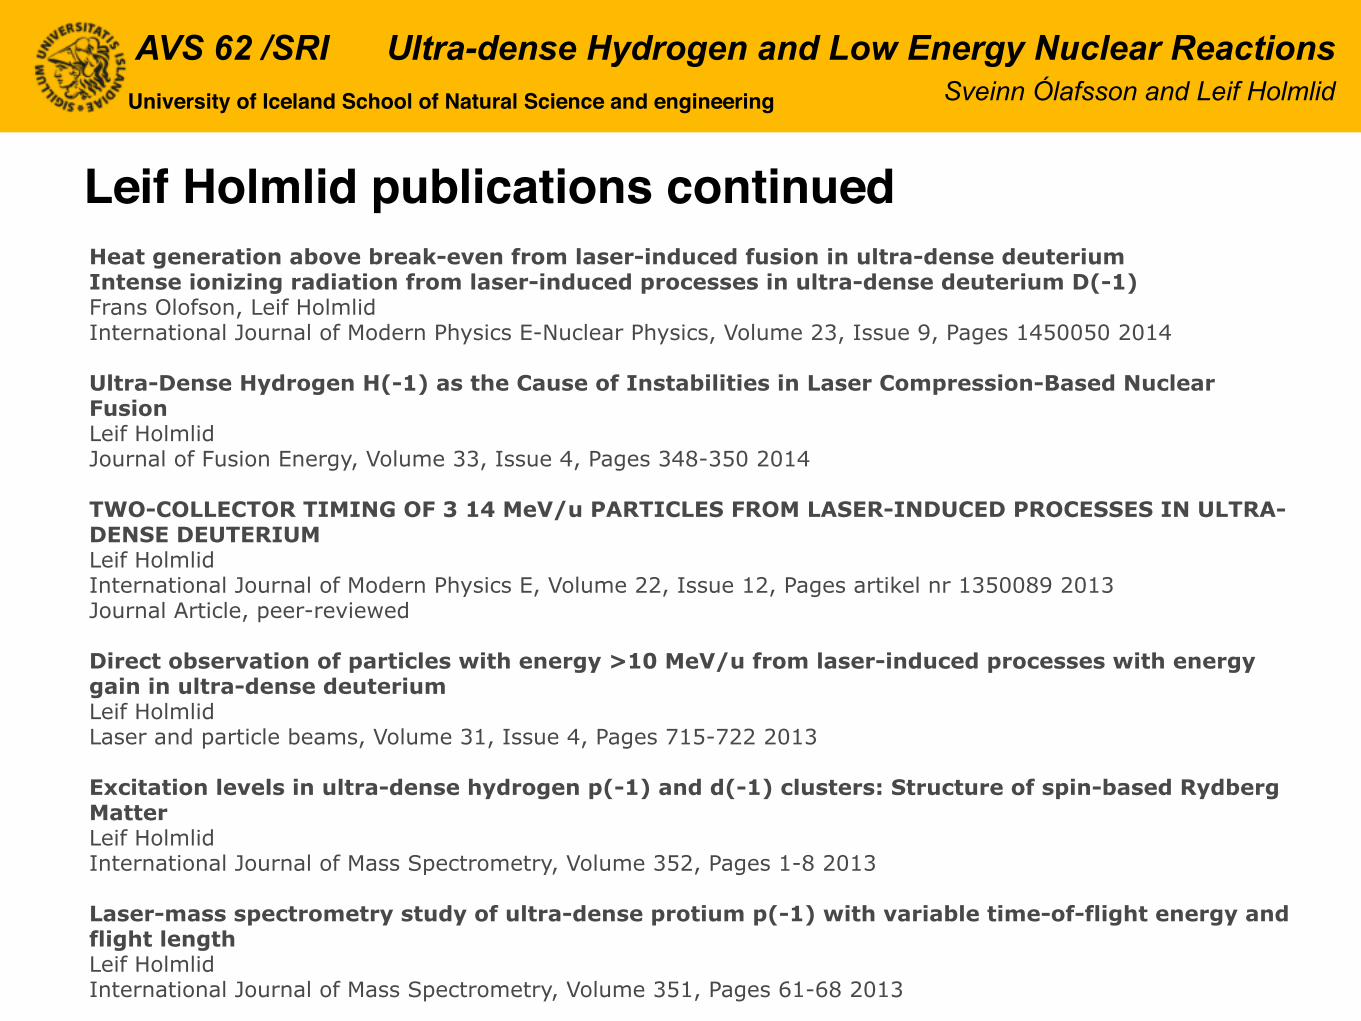
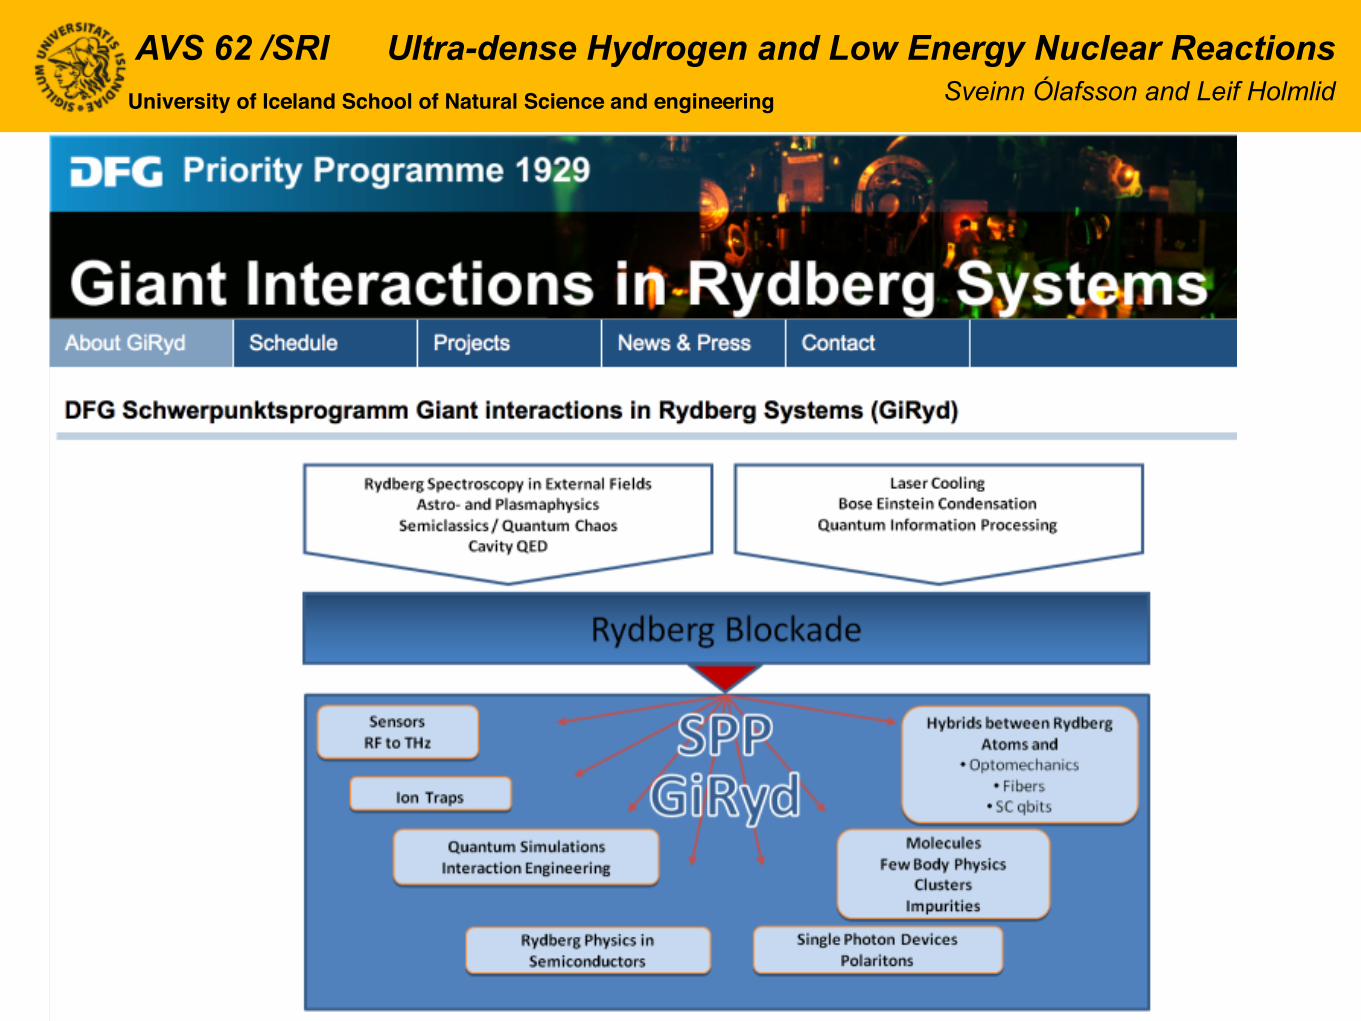
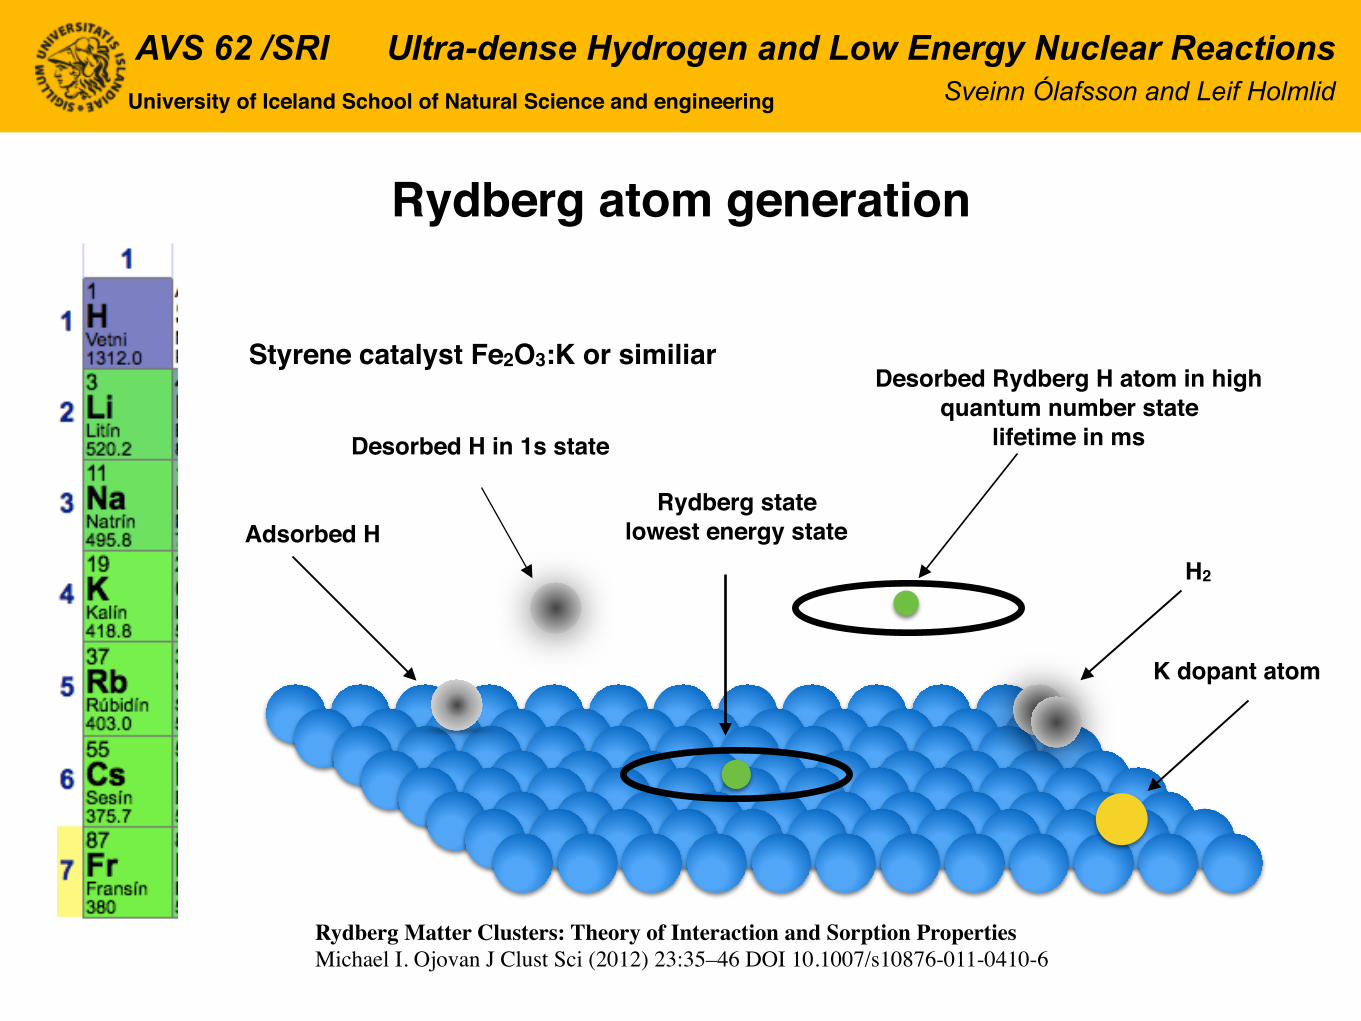
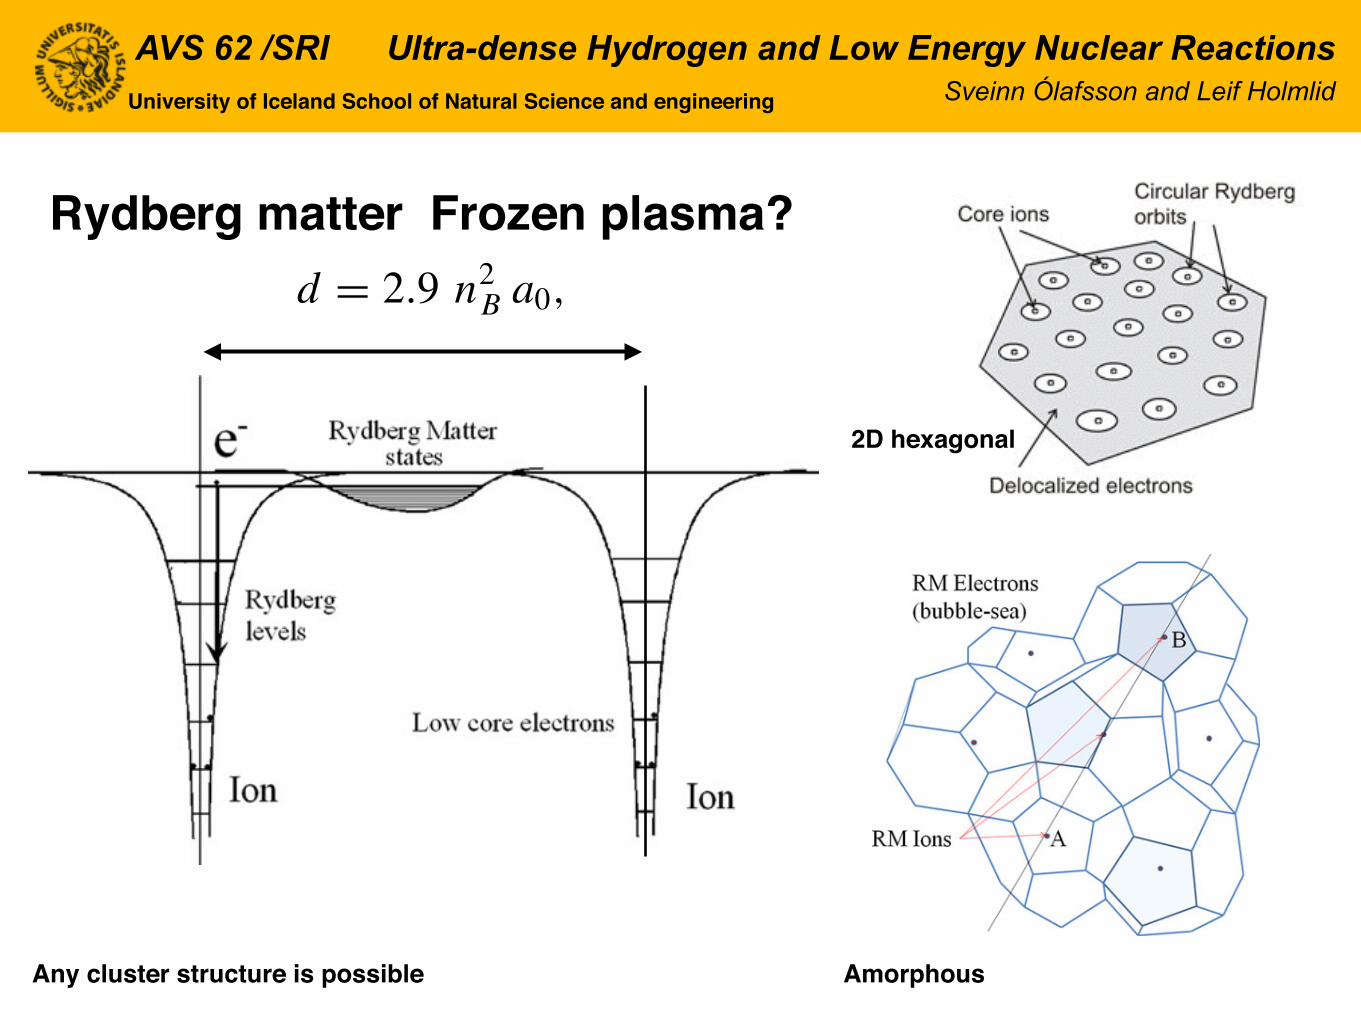
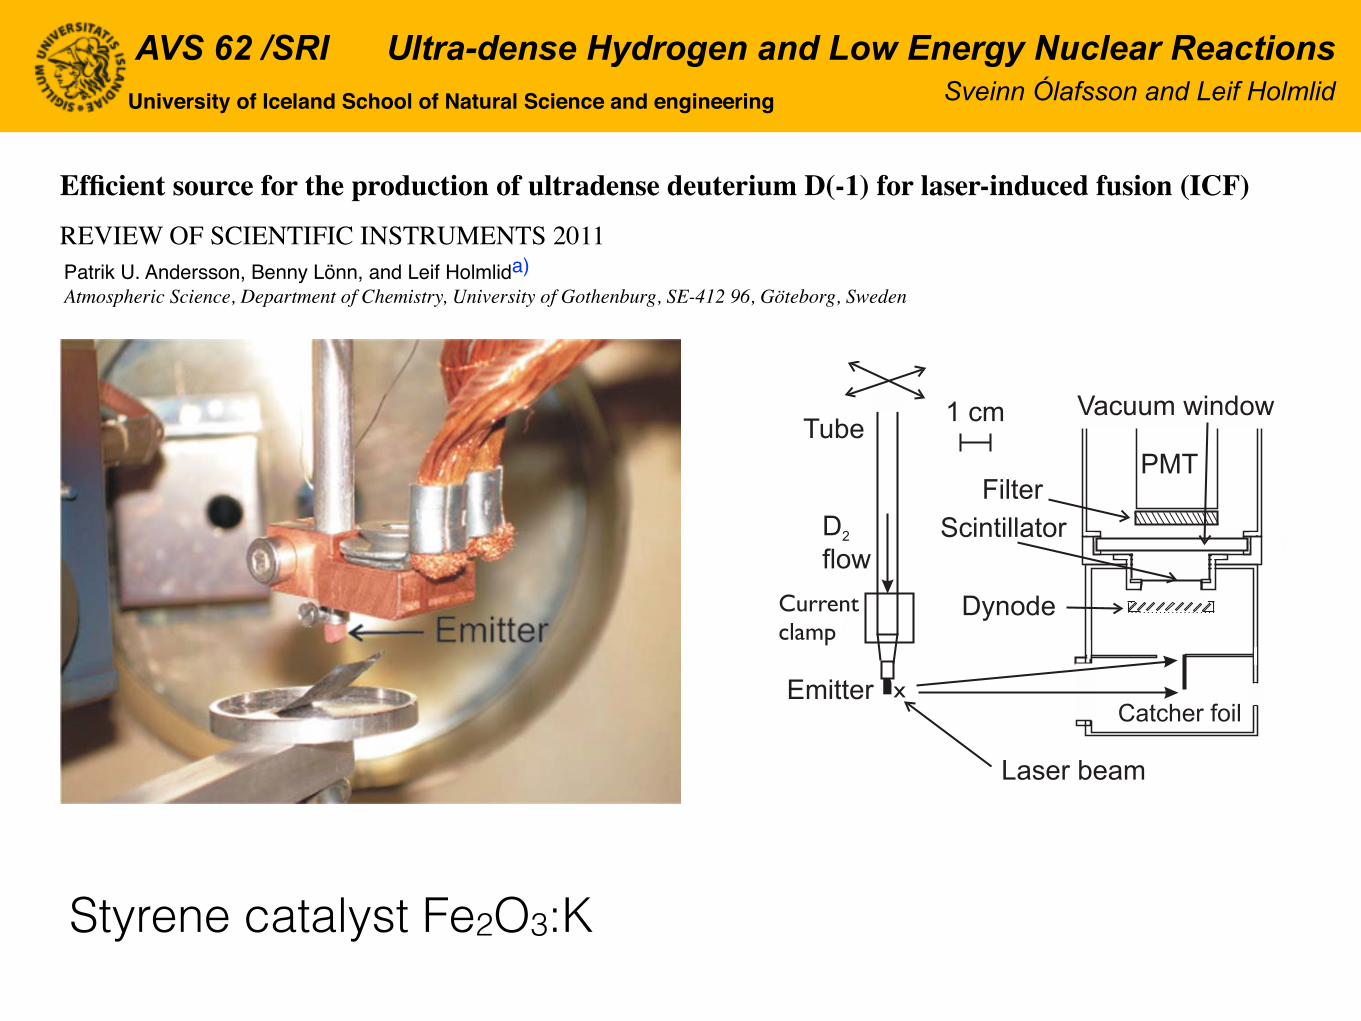
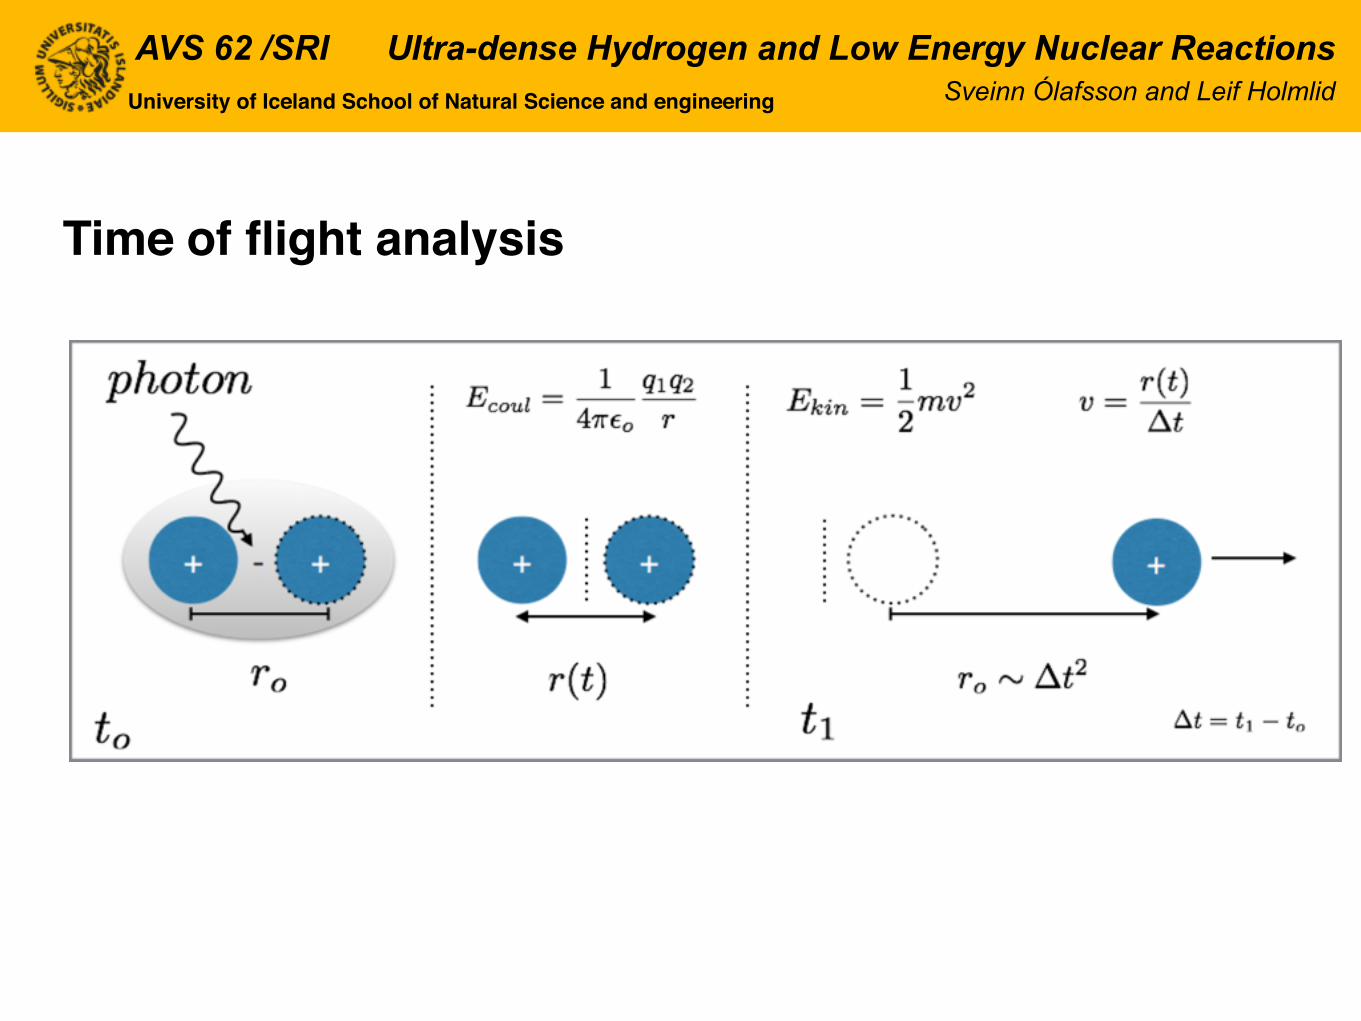
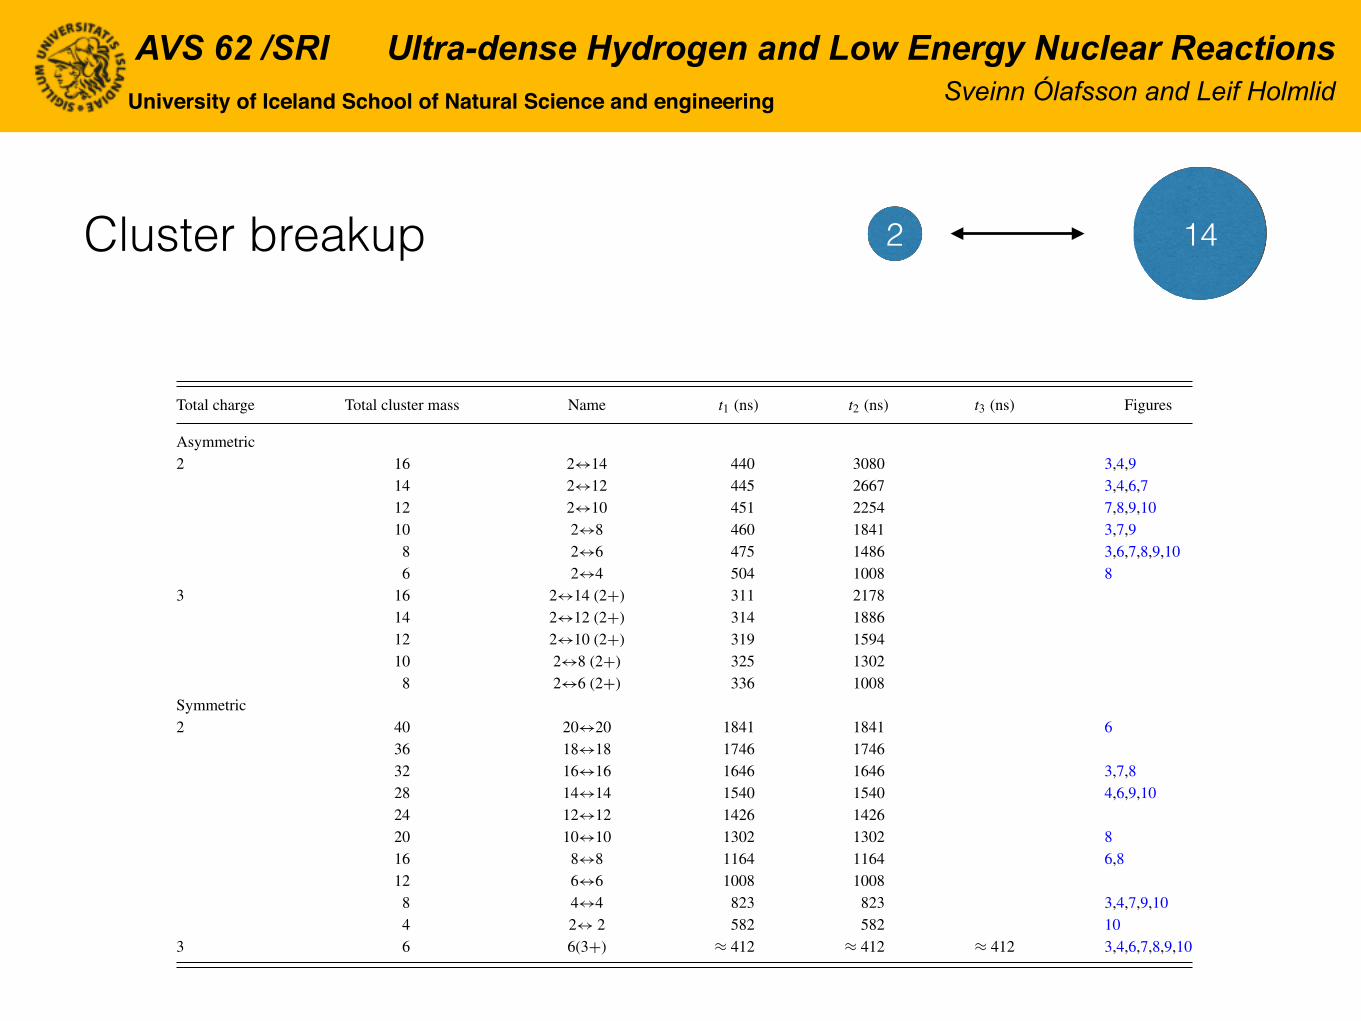
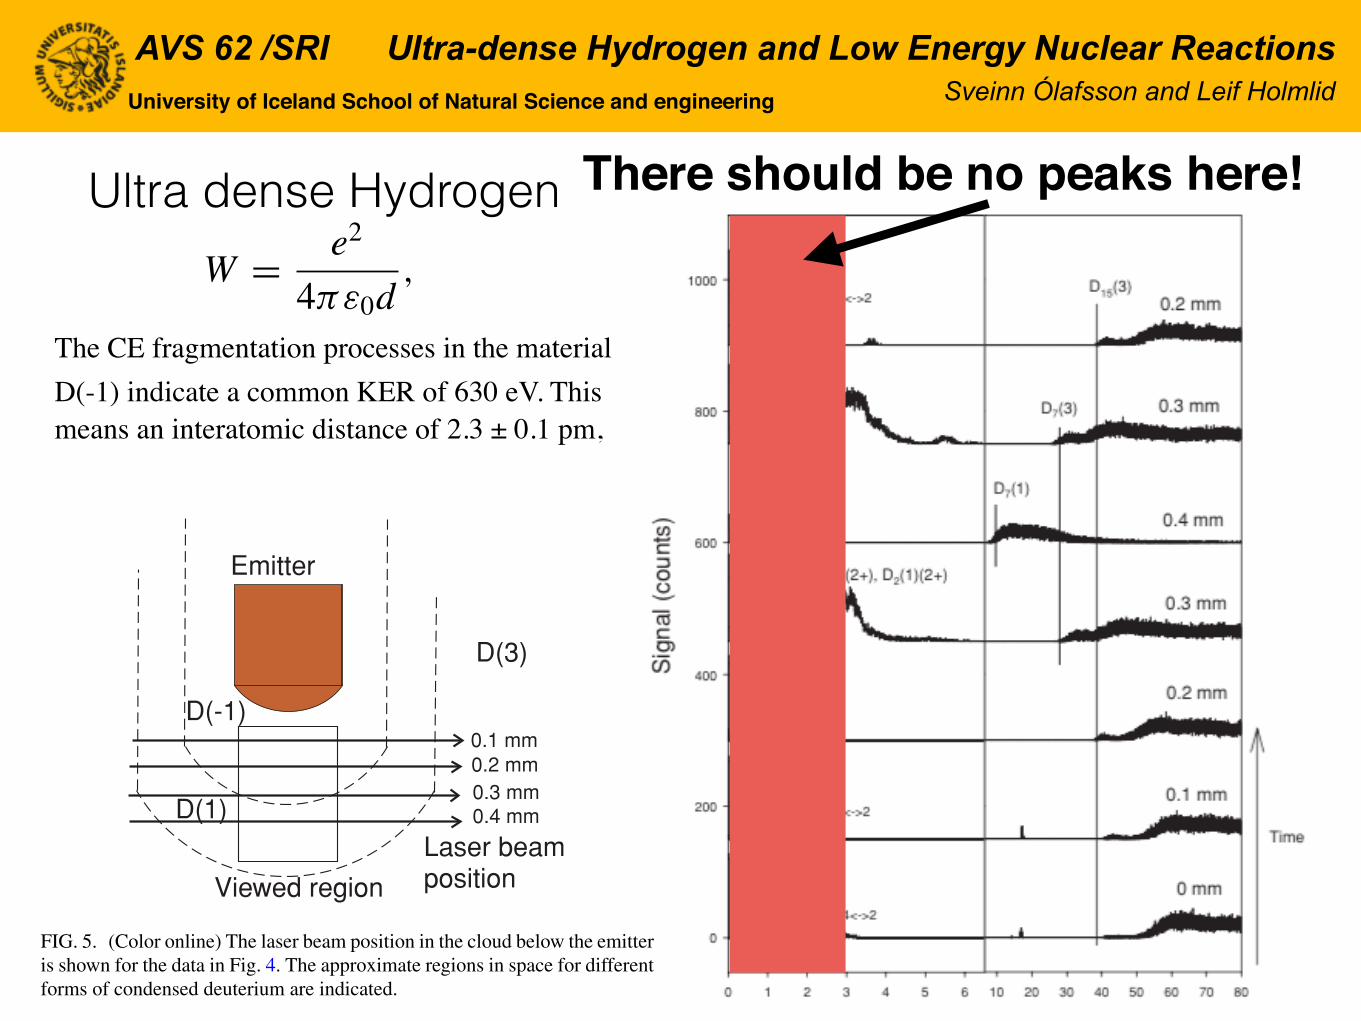
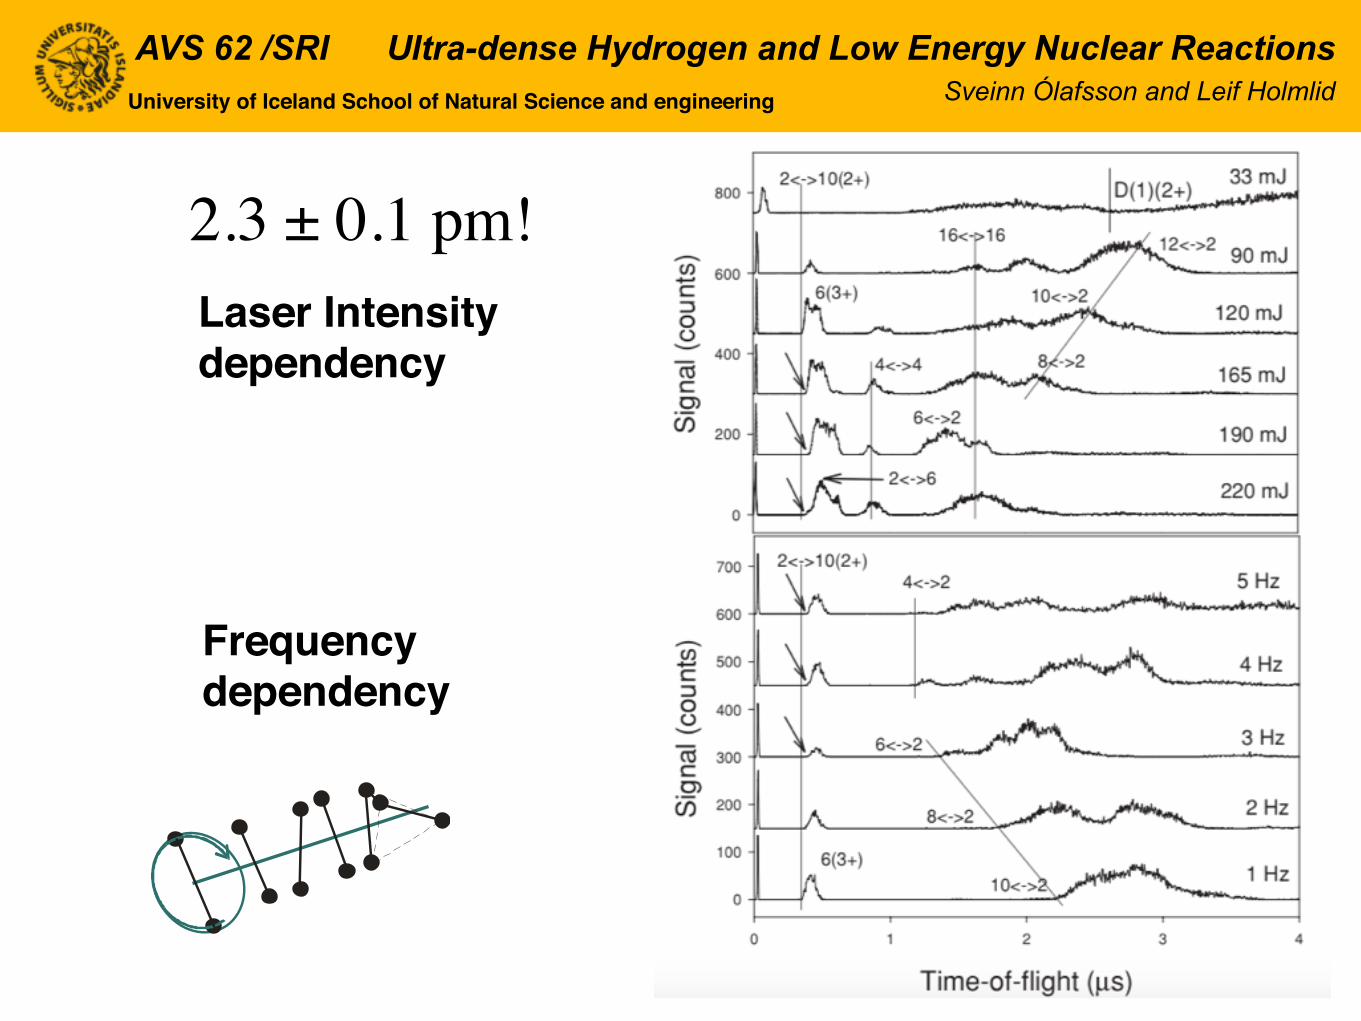
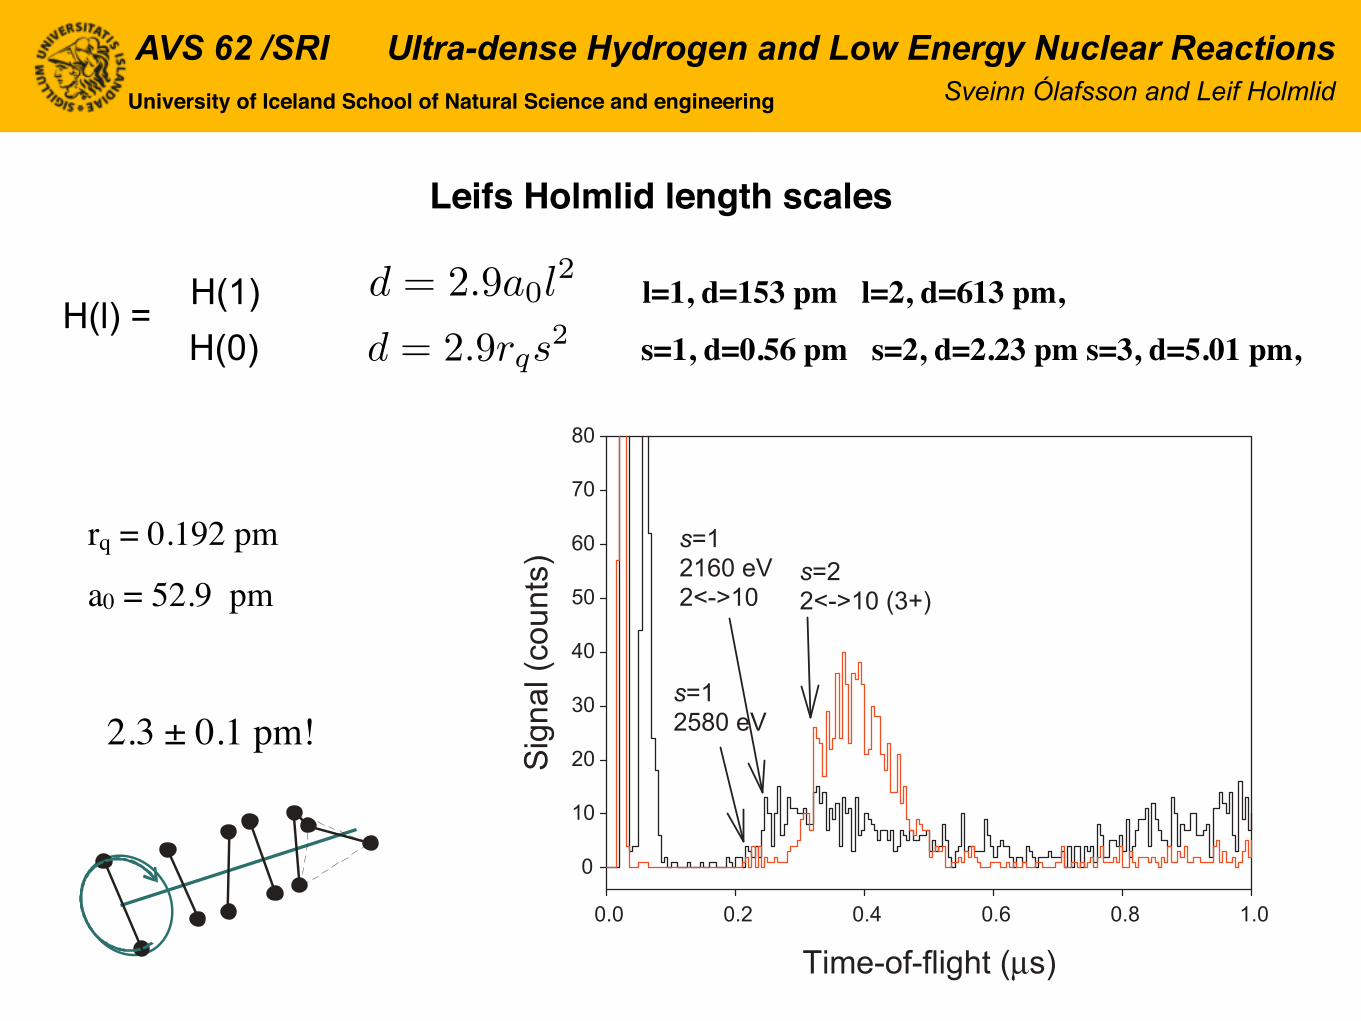
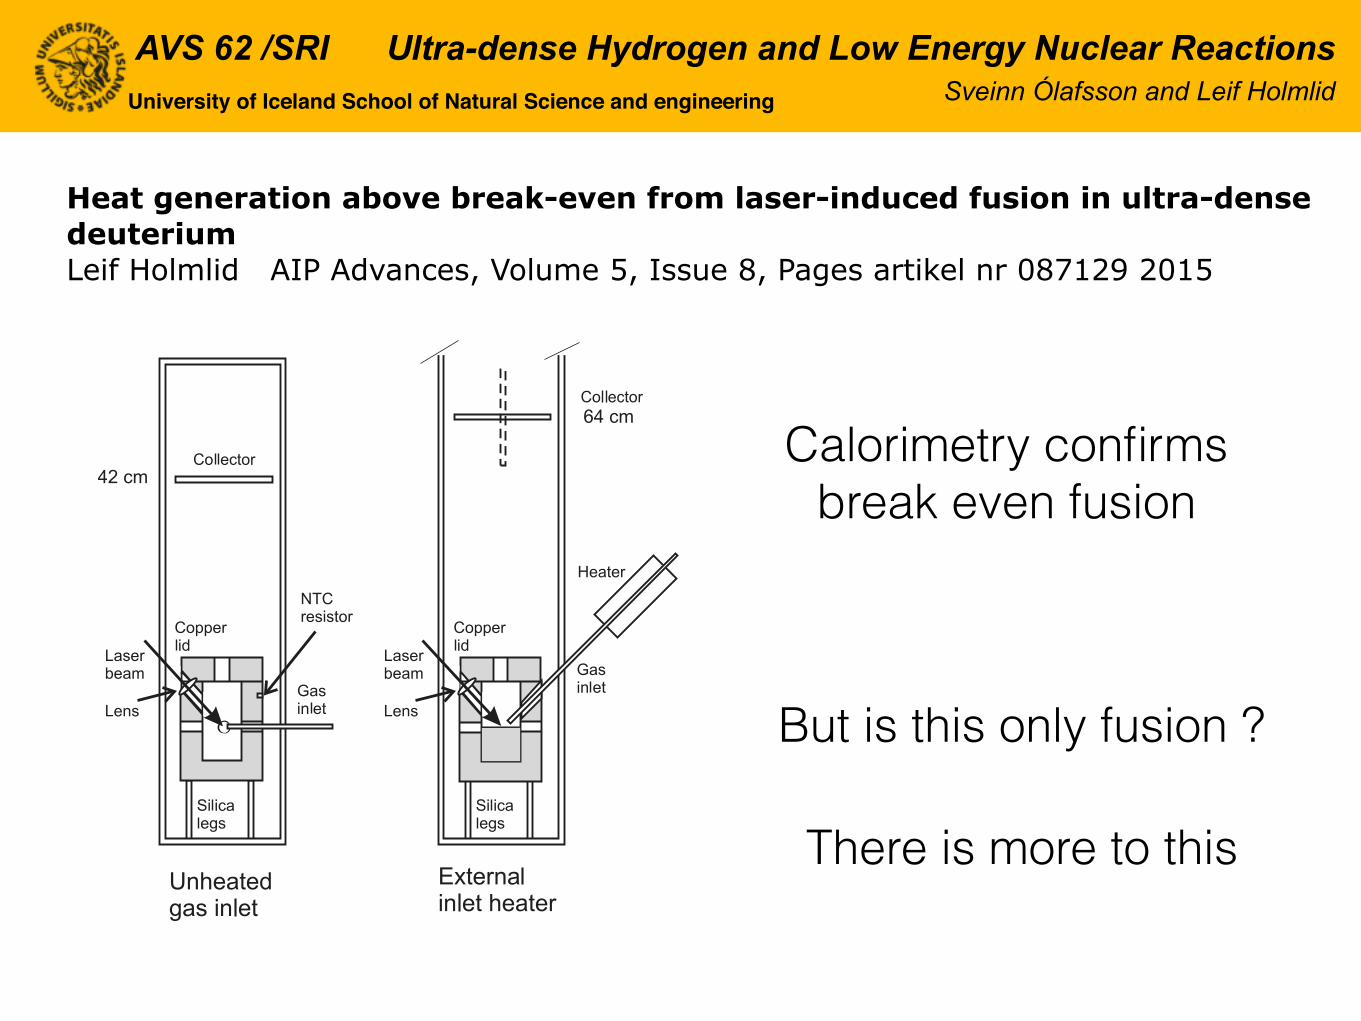
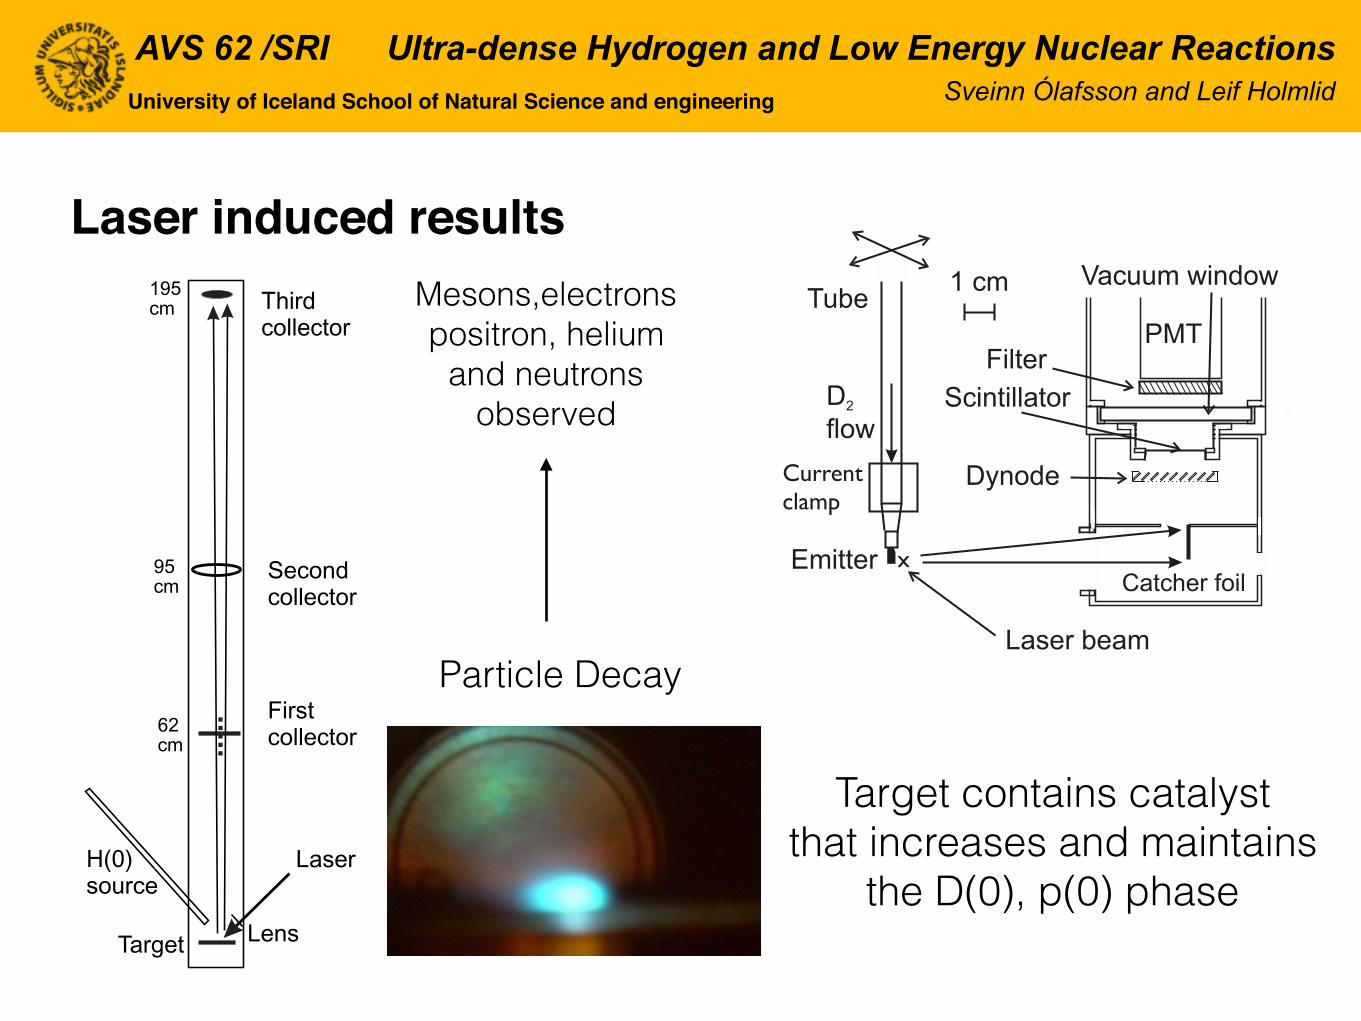
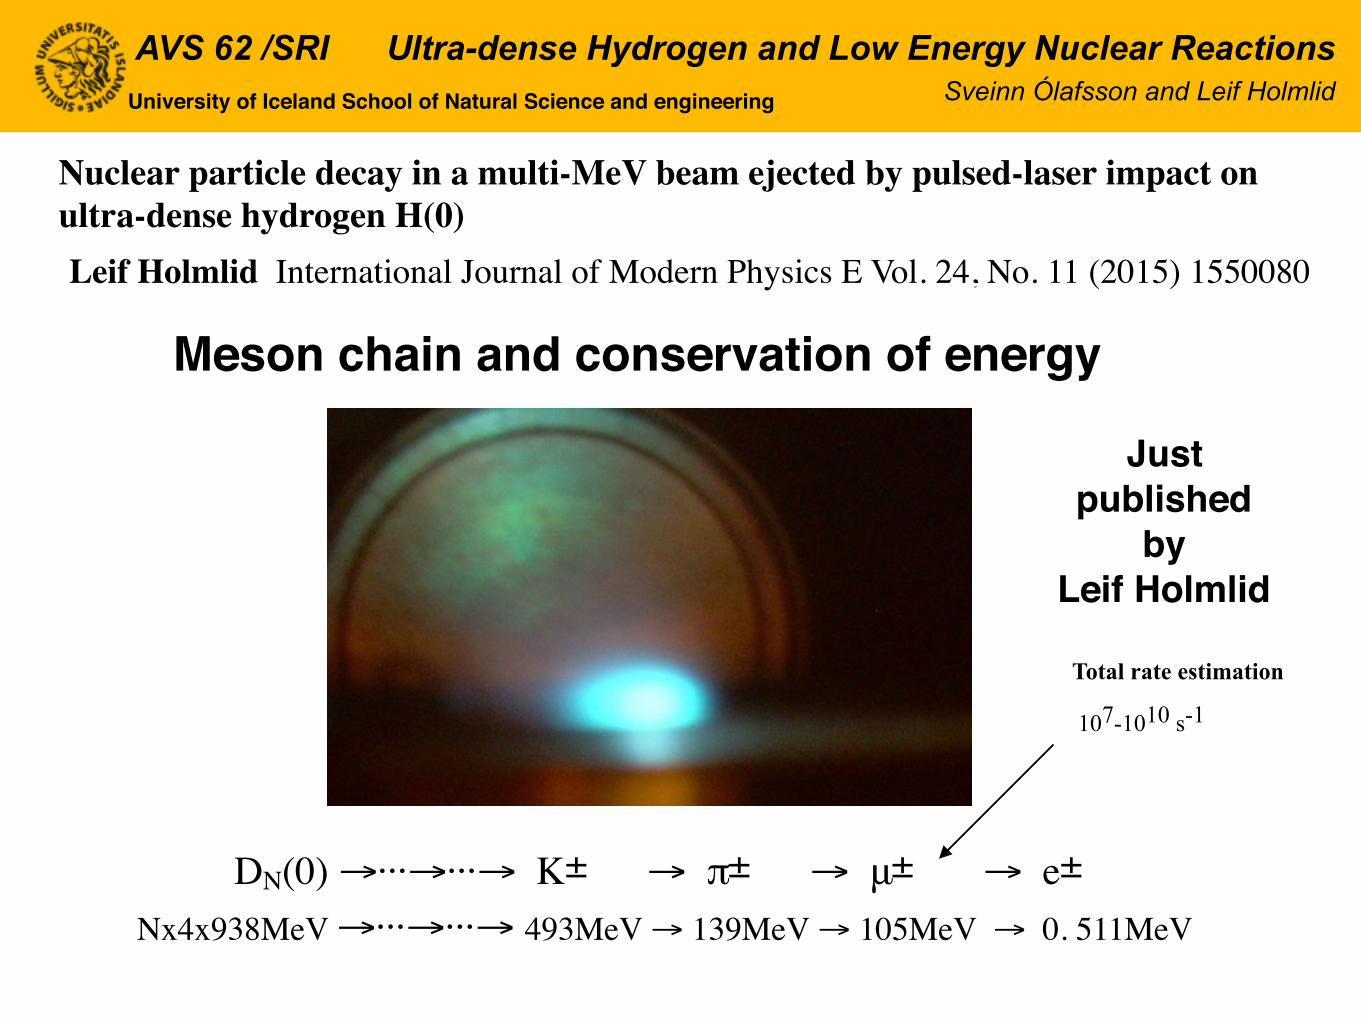
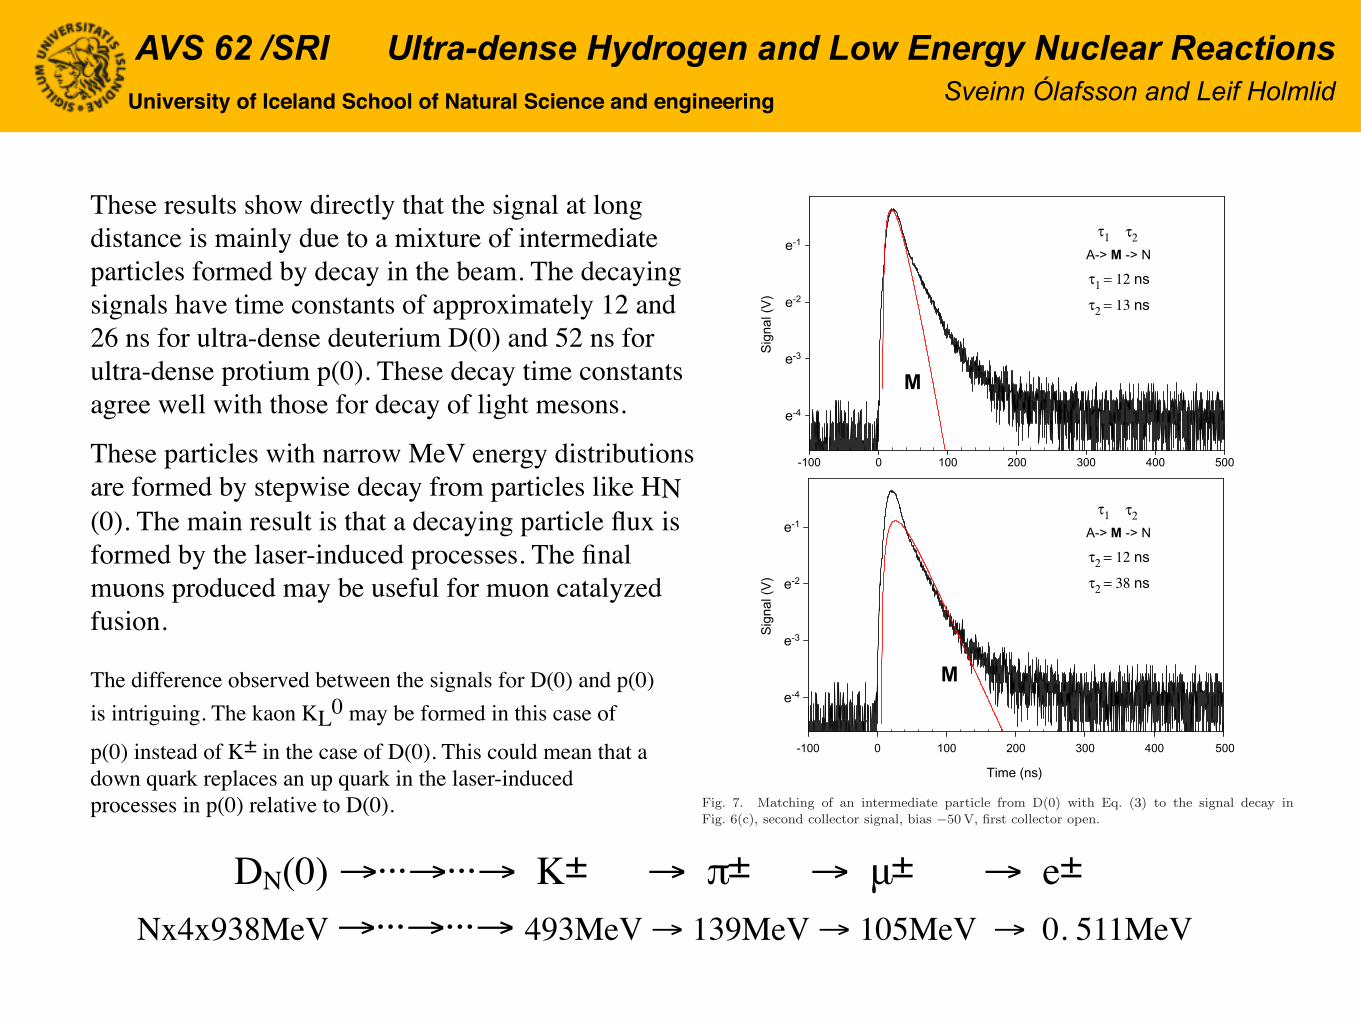
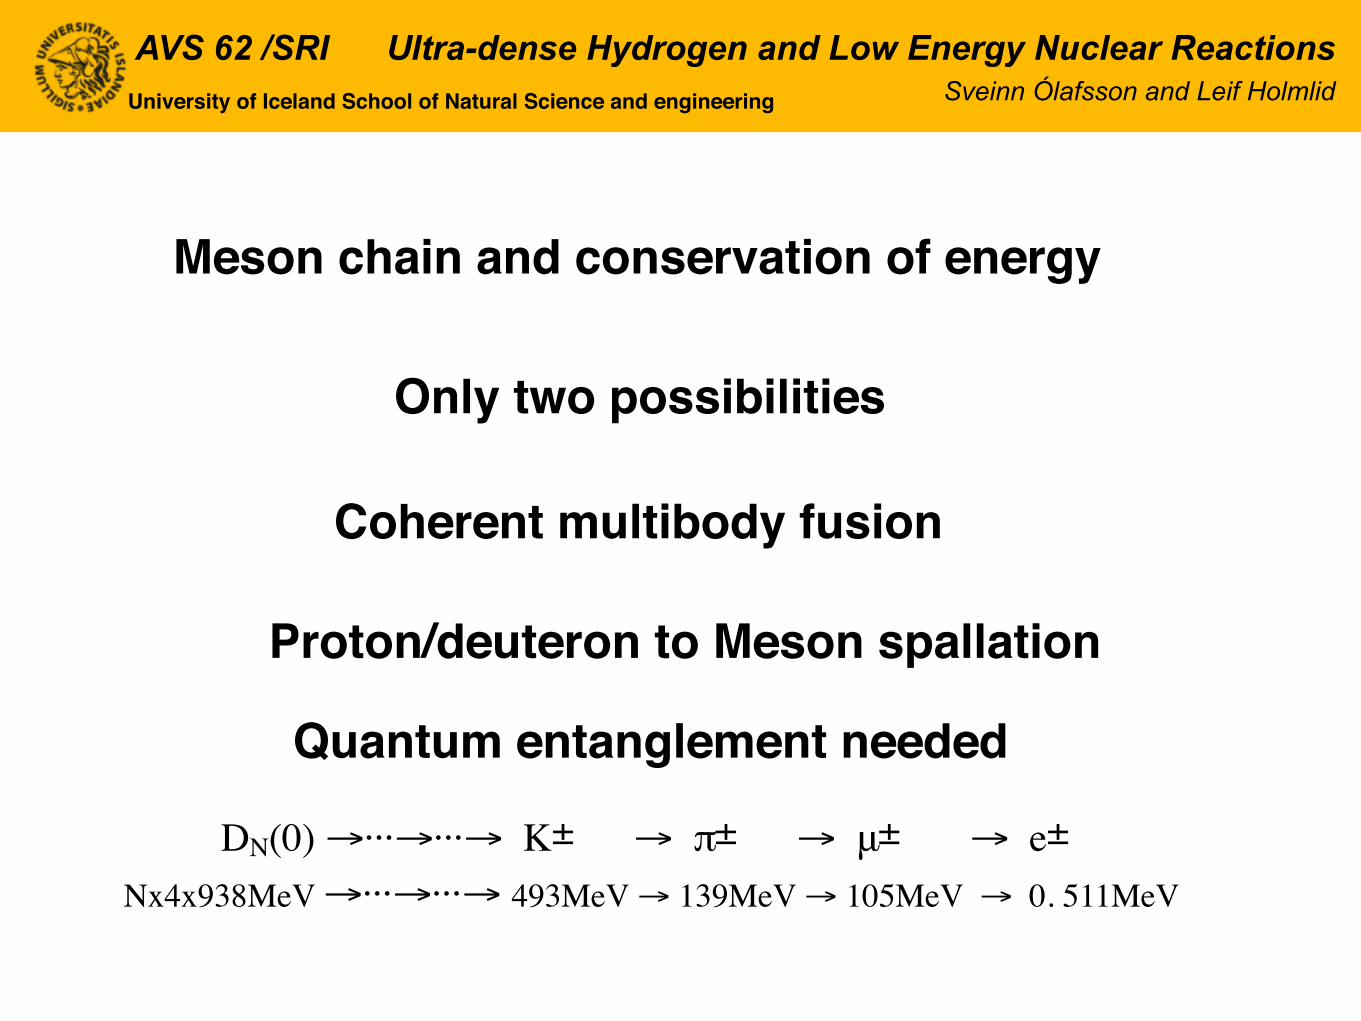
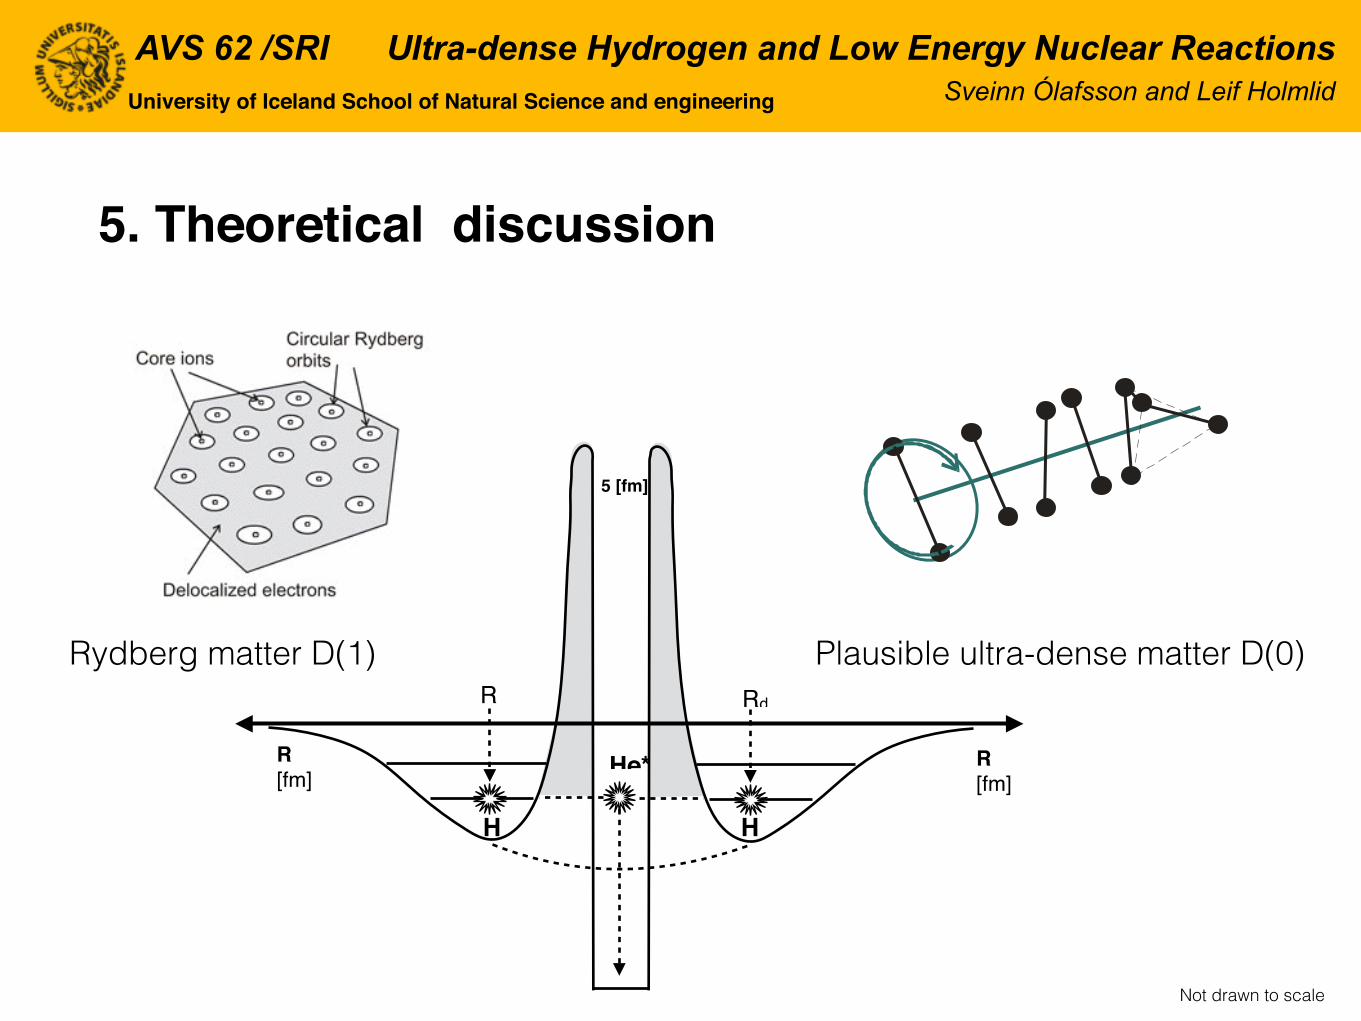
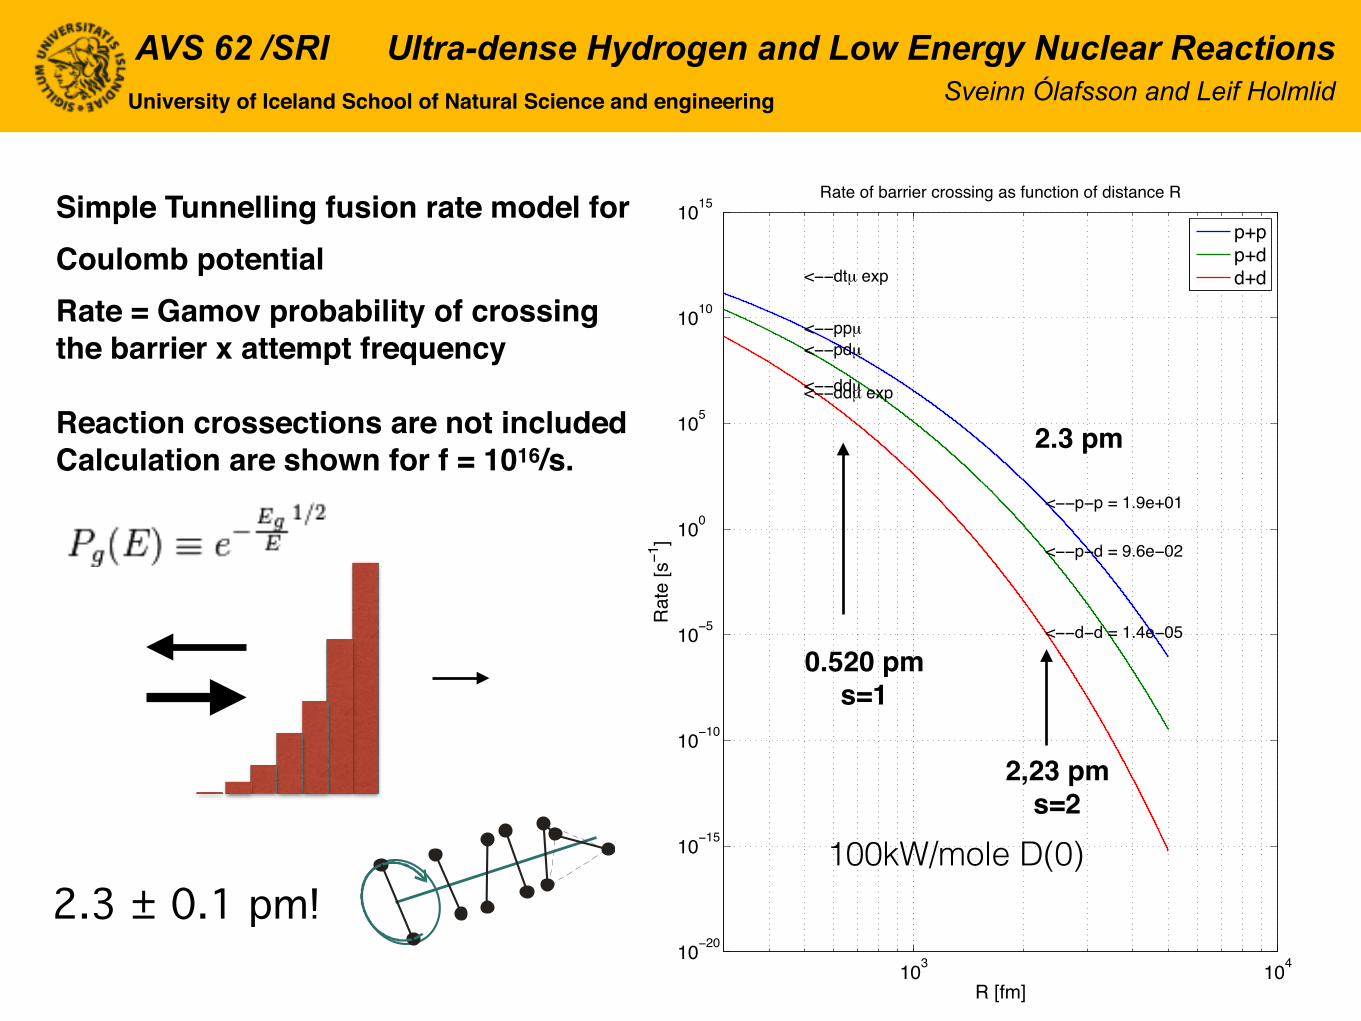
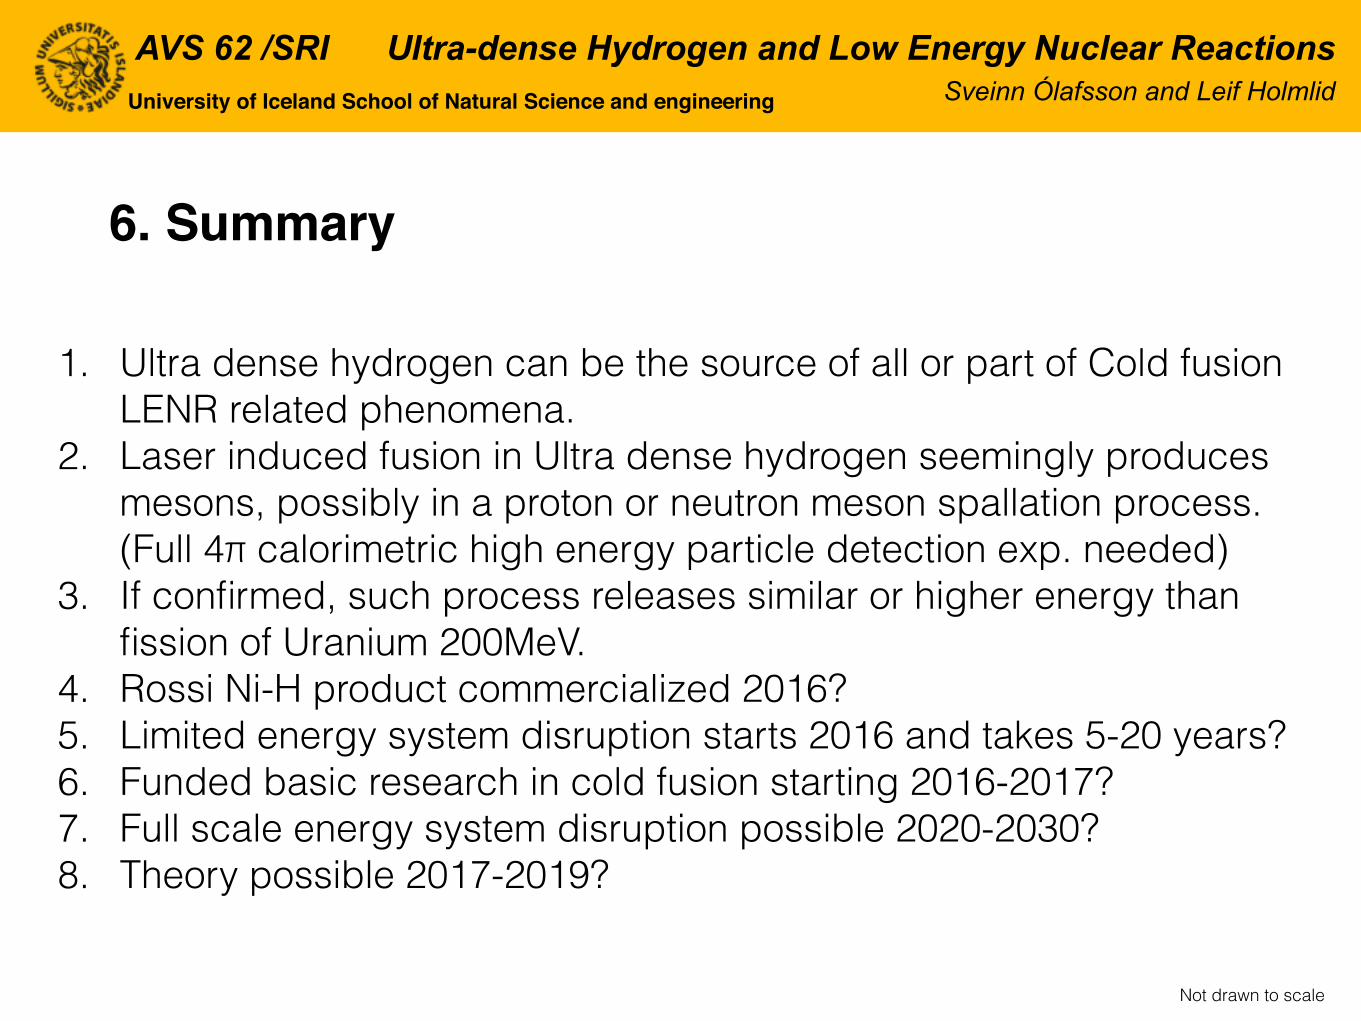
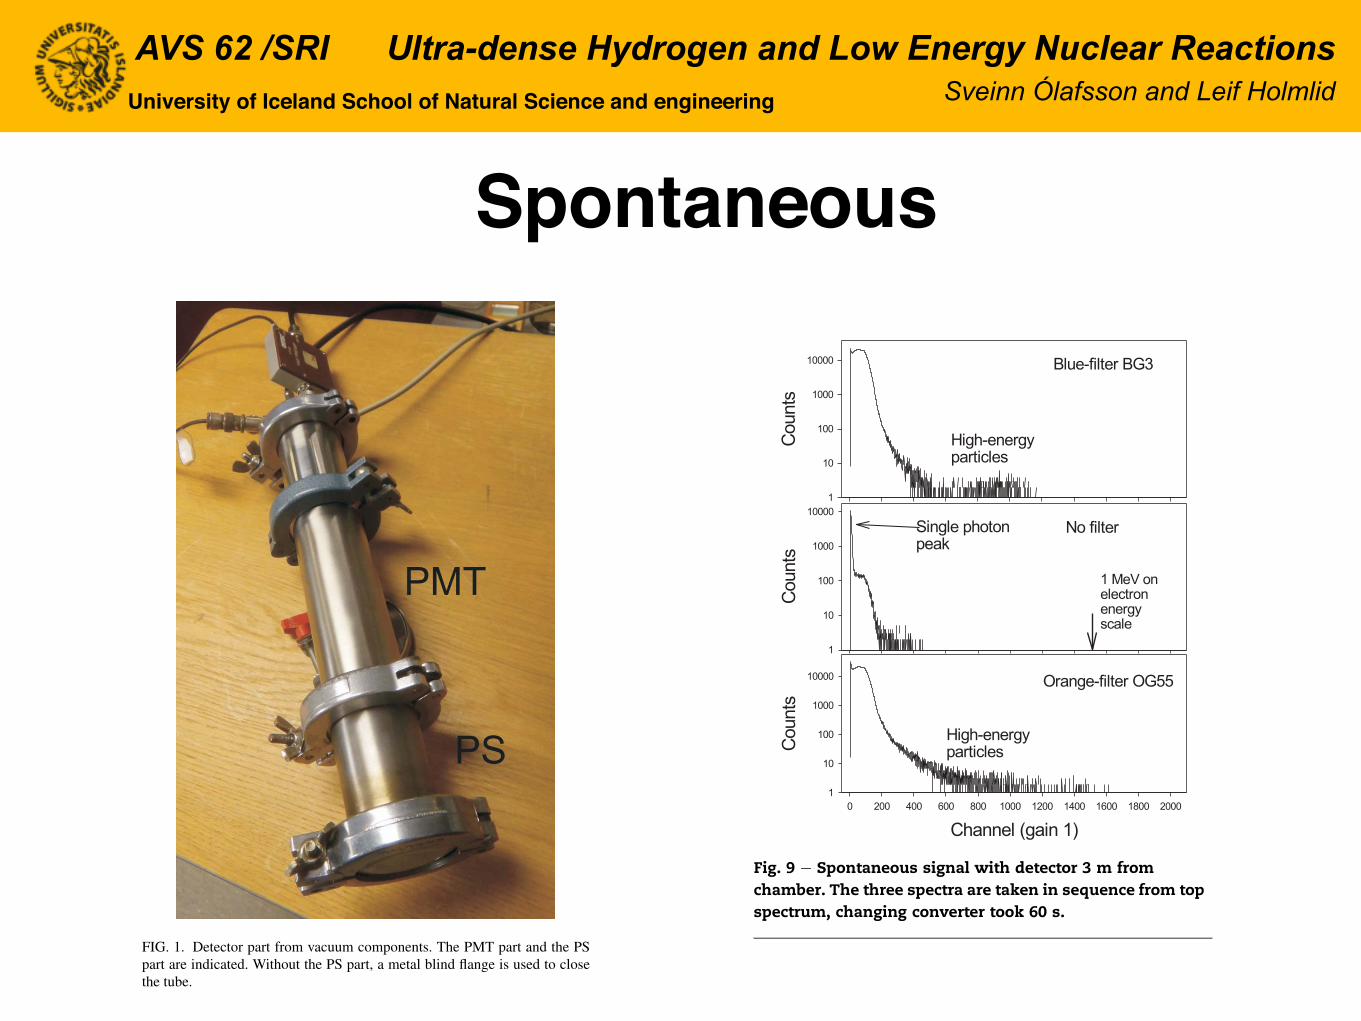
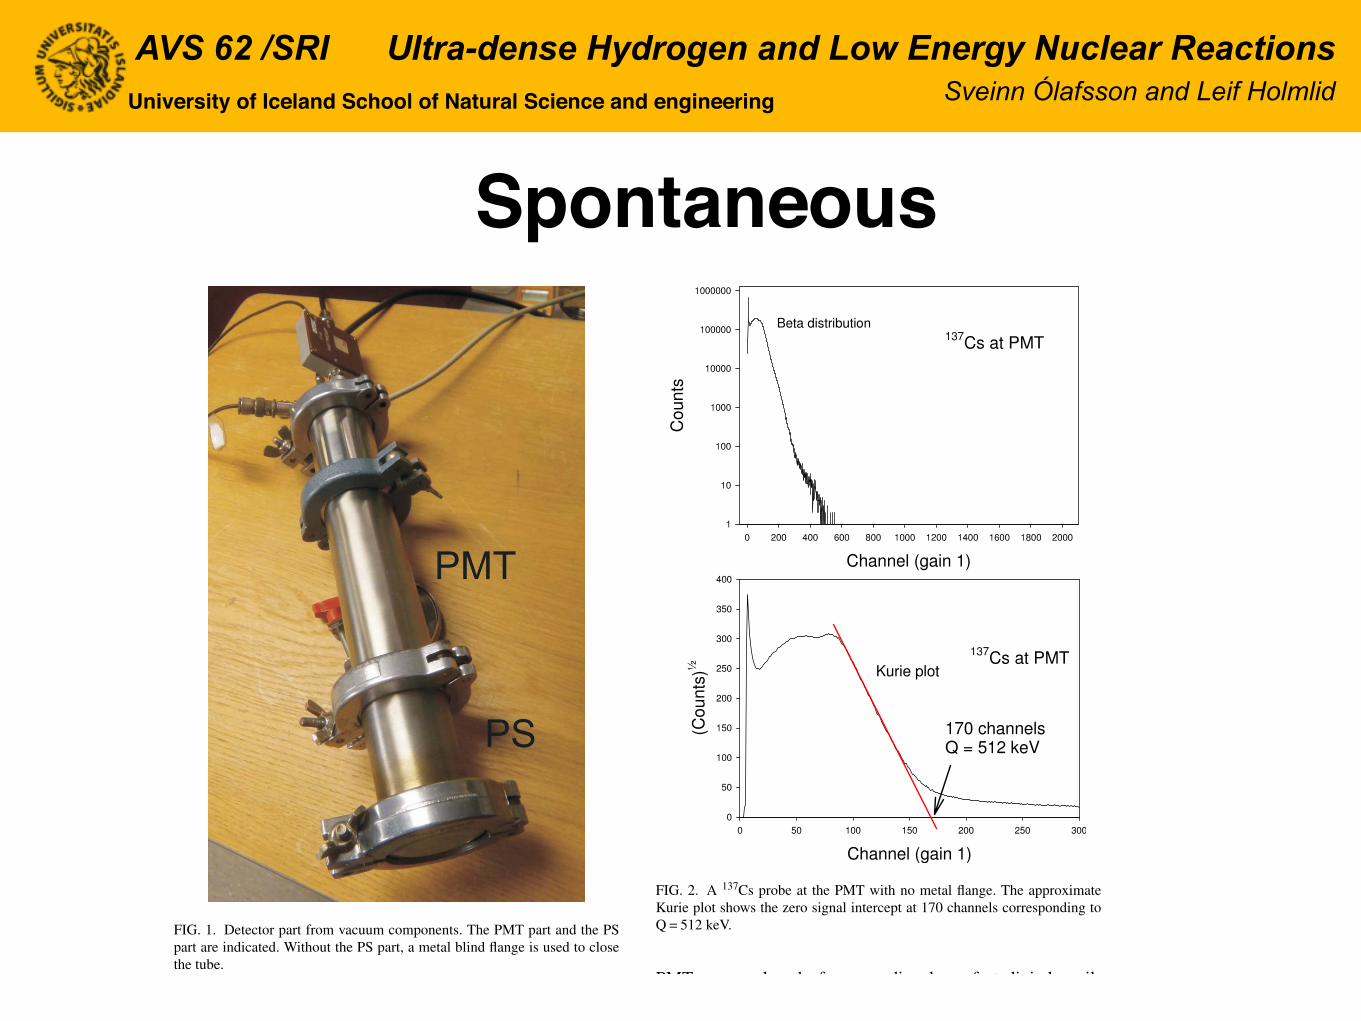


![US 20110005506A1 I - LENR-CANR.orglenr-canr.org/acrobat/RossiAmethodandaa.pdf · [0003] Many of the above alternative energy sources have already been explored and operatively tested](https://static.documents.pub/doc/80x56/5e6a037f9376943084363f2d/us-20110005506a1-i-lenr-canrorglenr-canrorgacrobat-0003-many-of-the-above.jpg)


