35
Poverty Relief Program Presentation to Portfolio Committee on Social Development 16/10/2002
| Date post: | 31-Dec-2015 |
| Category: |
Documents |
| Upload: | antoinette-jaydin |
| View: | 46 times |
| Download: | 0 times |

Poverty Relief Program
Presentation
to
Portfolio Committee
on
Social Development
16/10/2002
Poverty Relief Program
Presentation
to
Portfolio Committee
on
Social Development
16/10/2002

Overview of the IDT Overview of the IDT • PFMA Schedule II Public Entity
• Executive Authority-Minister of Public Works
• Board of Trustees-Accounting Authority
• Transformed from Grant Making (1990) to Development Planning, Integration and Coordination
• PFMA Schedule II Public Entity
• Executive Authority-Minister of Public Works
• Board of Trustees-Accounting Authority
• Transformed from Grant Making (1990) to Development Planning, Integration and Coordination

Purpose of the IDT Purpose of the IDT
“To make measurable difference in the levels of poverty and underdevelopment through delivering innovative and sustainable development programmes in partnership with others”.
“To make measurable difference in the levels of poverty and underdevelopment through delivering innovative and sustainable development programmes in partnership with others”.

Mission Mission
“The IDT, with strategic partners, will enable poor communities to access resources, and to recognise and unlock their potential to continuously improve the quality of their lives”.
“The IDT, with strategic partners, will enable poor communities to access resources, and to recognise and unlock their potential to continuously improve the quality of their lives”.
Core Business Core Business • Development Programme Management
• Leveraging Resources
• Institutional and Capacity Building
• Development Programme Management
• Leveraging Resources
• Institutional and Capacity Building

How Does IDT Function How Does IDT Function
• Head Office in Pretoria
• Regional or Satellite Offices in all Provinces
• Four Business Units
Programme Management
Corporate Affairs
Finance & IT
Human Resources
• Head Office in Pretoria
• Regional or Satellite Offices in all Provinces
• Four Business Units
Programme Management
Corporate Affairs
Finance & IT
Human Resources

Govt Programmes Managed Govt Programmes Managed
Programme Department Value Community Production Centres Public Works R12,1 mill Clean and Green Public Works R1,5 mill Integrated Waste Management Flemish Government R3,0 mill School Building EC Provincial Education Department R505,0 mill School Building KZN Provincial Education Department R20,0 mill School Building NW Provincial Education Department R24,0 mill Working for Water Water Affairs and Forestry R20,0 mill Integrated Rural Development Provincial and Local Government (Undetermined) Zivuseni Poverty Relief Gauteng Provincial Government R70,0 mill

Programme HistoryProgramme History
Name: Poverty Relief Programme
Client: Department of Social Development
Allocations:
Name: Poverty Relief Programme
Client: Department of Social Development
Allocations:
Financial Year Amount Allocated 1998/99 R203 million 1999/00 R40 million 2000/01 R120 million 2001/02 R50 million 2002/03 R100 million Total R513 million

Issues Raised by PC Nov 2002Issues Raised by PC Nov 2002
• Impact of Programme
• Accessibility of the Programme
• Access to Finance
• Access to Markets
• Capacity Building and Support to Projects
• Project Location
(All addressed by report and this presentation)
• Impact of Programme
• Accessibility of the Programme
• Access to Finance
• Access to Markets
• Capacity Building and Support to Projects
• Project Location
(All addressed by report and this presentation)

PRP: A Partnership ModelPRP: A Partnership Model
• National Department of Social Development
• Provincial Departments of Social Development
• Independent Development Trust
• Clusters/Projects
• National Department of Social Development
• Provincial Departments of Social Development
• Independent Development Trust
• Clusters/Projects

Roles of the IDTRoles of the IDT
• Receive programme funds
• Capture approved projects
• Develop disbursement systems
• Disburse funds
• Provide reports to DSD
• Programme management support
• Receive programme funds
• Capture approved projects
• Develop disbursement systems
• Disburse funds
• Provide reports to DSD
• Programme management support

Programme ObjectivesProgramme Objectives
• Food Security
• HIV/AIDS Support Structures
• Youth Skills and Employment
• Women’s Income Generating Projects
• Aged
• People with Disabilities
• Social Finance
• Food Security
• HIV/AIDS Support Structures
• Youth Skills and Employment
• Women’s Income Generating Projects
• Aged
• People with Disabilities
• Social Finance
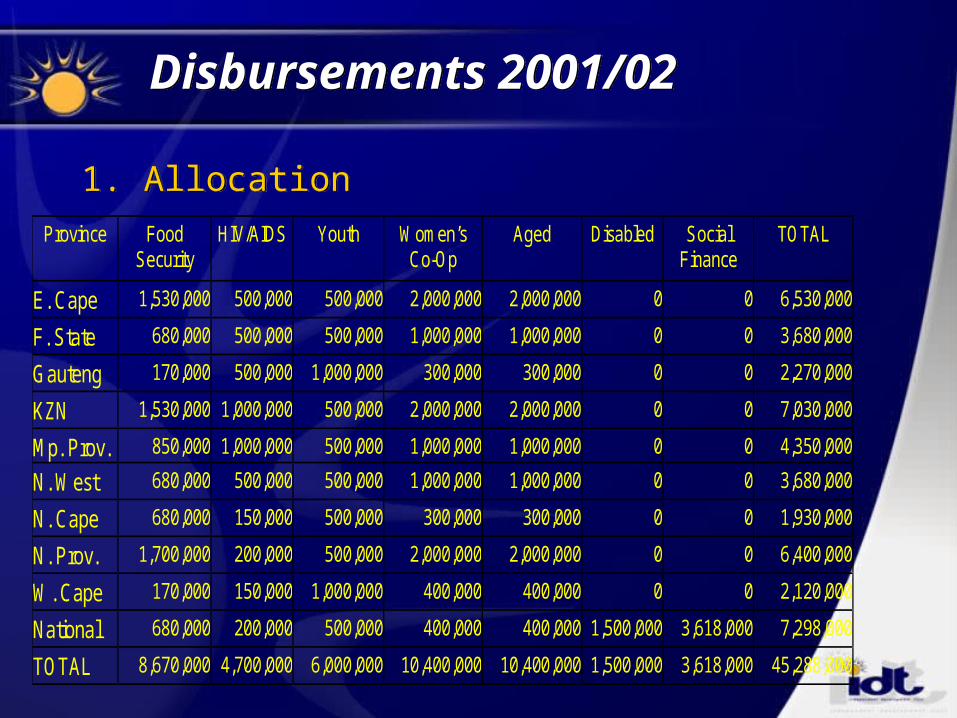
Disbursements 2001/02Disbursements 2001/02
1. Allocation1. AllocationProvince Food
Security HIV/AIDS Youth Women’s
Co-Op Aged Disabled Social
Finance TOTAL
E. Cape 1,530,000 500,000 500,000 2,000,000 2,000,000 0 0 6,530,000
F. State 680,000 500,000 500,000 1,000,000 1,000,000 0 0 3,680,000
Gauteng 170,000 500,000 1,000,000 300,000 300,000 0 0 2,270,000
KZN 1,530,000 1,000,000 500,000 2,000,000 2,000,000 0 0 7,030,000
Mp. Prov. 850,000 1,000,000 500,000 1,000,000 1,000,000 0 0 4,350,000
N. West 680,000 500,000 500,000 1,000,000 1,000,000 0 0 3,680,000
N. Cape 680,000 150,000 500,000 300,000 300,000 0 0 1,930,000
N. Prov. 1,700,000 200,000 500,000 2,000,000 2,000,000 0 0 6,400,000
W. Cape 170,000 150,000 1,000,000 400,000 400,000 0 0 2,120,000
National 680,000 200,000 500,000 400,000 400,000 1,500,000 3,618,000 7,298,000
TOTAL 8,670,000 4,700,000 6,000,000 10,400,000 10,400,000 1,500,000 3,618,000 45,288,000

Disbursements 2001/02Disbursements 2001/02
2. Distribution of Funds/Province2. Distribution of Funds/Province
14%
8%
5%
16%10%8%4%
14%
5%
16%
EC FS GP KZN MP NW NC
NP WC NL

Disbursements 2001/02Disbursements 2001/02
3. Distribution of Funds/Objective3. Distribution of Funds/Objective
19%
10%
13%24%
23%
3% 8%Food
HIV
Urban
Coops
Elderly
Disabled
Finance

Disbursements 2001/02Disbursements 2001/02
4. Expenditure/Province4. Expenditure/Province Province Amount allocated No. of projects Amount paid Balance % Paid
Eastern Cape 6,530,000 60 6,370,000 160,000 98%
Free State 3,680,000 36 3,410,000 270,000 93%
Gauteng 2,170,000 18 2,170,000 0 100%
KwaZulu Natal 7,030,000 70 6,888,000 142,000 98%
Mpumalanga 3,850,000 45 3,720,000 130,000 97%
North West 3,630,000 36 3,562,000 68,000 98%
Northern Cape 1,920,000 15 1,900,000 20,000 99%
Limpopo 6,640,000 56 5,616,400 1,023,600 85%
Western Cape 1,670,000 7 1,502,000 168,000 90%
National 2,560,000 18 2,040,000 520,000 80%
TOTALS 39,680,000 361 37,178,400 2,501,600 94%

Disbursements 2002/03Disbursements 2002/03
1. Allocation1. AllocationProvince Food Security HIV/AIDS Youth Women’s Co-
Op Aged Disabled Social
Finance TOTAL
E. Cape 3,780,000 1,250,000 500,000 5,000,000 5,000,000 - - 15,530,000
F. State 1,680,000 1,250,000 500,000 2,500,000 2,500,000 - - 8,430,000
Gauteng 420,000 1,250,000 1,000,000 750,000 750,000 - - 4,170,000
KZN 3,780,000 2,500,000 500,000 5,000,000 5,000,000 - - 16,780,000
Mp. Prov. 2,100,000 2,500,000 500,000 2,500,000 2,500,000 - - 10,100,000
N. West 1,680,000 1,250,000 500,000 2,500,000 2,500,000 - - 8,430,000
N. Cape 1,680,000 375,000 500,000 750,000 750,000 - - 4,055,000
N. Prov. 4,200,000 500,000 500,000 5,000,000 5,000,000 - - 15,200,000
W. Cape 420,000 175,000 1,000,000 1,000,000 1,000,000 - - 3,595,000
National 1,680,000 500,000 500,000 1,000,000 1,000,000 1,500,000 4,000,000 10,180,000
TOTAL 21,420,000 11,550,000 6,000,000 26,000,000 26,000,000 1,500,000 4,000,000 96,470,000

Disbursements 2002/03Disbursements 2002/03
2. Distribution of Funds/Province2. Distribution of Funds/Province
16%
9%
4%
17%10%9%
4%
16%
4% 11%
EC
FS
GP
KZN
MP
NW
NC
NP
WC
NL

Disbursements 2002/03Disbursements 2002/03
3. Distribution of Funds/Objective3. Distribution of Funds/Objective
22%
12%
6%27%
27%
2% 4%FoodHIVUrbanCoopsElderlyDisabledFinance

Disbursements 2002/03Disbursements 2002/03
4. Expenditure • Disbursement Delayed Due to Community
Mobilisation
• 1ST Tranche Payment Scheduled for October/November 2002
• 2nd Tranche Payment Scheduled for January/February 2003
4. Expenditure • Disbursement Delayed Due to Community
Mobilisation
• 1ST Tranche Payment Scheduled for October/November 2002
• 2nd Tranche Payment Scheduled for January/February 2003

Monitoring & ReportingMonitoring & Reporting
• A Comprehensive ME&R system was developed and Piloted in 2001.
• Baseline Data for each Project has been Collected and Analysed.
• Problems are experienced in implementation affecting Data Quality
• However very useful information is available
• A Comprehensive ME&R system was developed and Piloted in 2001.
• Baseline Data for each Project has been Collected and Analysed.
• Problems are experienced in implementation affecting Data Quality
• However very useful information is available

Monitoring & ReportingMonitoring & Reporting
1. Project Types1. Project Types
Province Food Security HIV/AIDS Urban Regen Women’s Coops Elderly Centres TOTAL Eastern Cape 9 10 1 20 20 60 Free State 4 11 1 10 10 36 Gauteng 1 10 2 3 2 18 KwaZulu Natal 9 19 1 20 20 69 Limpopo 12 4 1 18 21 56 Mpumalanga 5 20 1 10 10 46 National 8 4 1 3 2 18 North West 4 10 1 11 10 36 Northern Cape 5 3 1 3 3 15 Western Cape 1 0 1 4 1 7 TOTAL 58 91 11 102 99 361

Monitoring & ReportingMonitoring & Reporting
2. Project Distribution/Objective
2. Project Distribution/Objective
0
20
40
60
80
100
120
No.
Food HIV Urban Coops Elderly

Monitoring & ReportingMonitoring & Reporting
3. Project Location3. Project Location
77%
23%
Rural
Urban

Monitoring & ReportingMonitoring & Reporting
4. Nodal Targeting4. Nodal Targeting
32%
68%
Inside Node
Outside Node

Monitoring & ReportingMonitoring & Reporting
5. Number of Beneficiaries5. Number of BeneficiariesProvince Women Children Youth Disabled Men Total No.Projects Eastern Cape 1605 1200 439 156 507 3907 30 Free State 417 124 392 34 126 1093 12 KwaZulu Natal 3356 2295 684 172 1219 7726 53 Limpopo 4069 3272 2139 311 1055 10846 54 Mpumalanga 1238 632 513 71 463 2917 31 North West 817 643 601 73 409 2543 28 Northern Cape 1268 231 799 80 388 2766 12 TOTAL 12770 8397 5567 897 4167 31798 220

Monitoring & ReportingMonitoring & Reporting
6. Percentage/Beneficiary Group
6. Percentage/Beneficiary Group
40%
26%
18%
3%
13%
WomenChildrenYouthDisabledMen

Social FinanceSocial Finance
• To ensure sustainability PRP targeting that 60% of projects participate in Social Finance.
• R10,9 Mill allocated for this over 3 years
• Funds will strengthen existing community organisations
• UNDP has agreed to partner the PRP by providing expertise
• To ensure sustainability PRP targeting that 60% of projects participate in Social Finance.
• R10,9 Mill allocated for this over 3 years
• Funds will strengthen existing community organisations
• UNDP has agreed to partner the PRP by providing expertise

Training & Access to MarketsTraining & Access to Markets
• Project Training occurred Mar-Aug/02
• Development practitioners (Provincial Support Teams) were appointed in each province
• They were tasked to:
- Realign Business Plans
- Build Institutions
- Link Projects to other role players & markets
- Develop capacity building programmes
• Project Training occurred Mar-Aug/02
• Development practitioners (Provincial Support Teams) were appointed in each province
• They were tasked to:
- Realign Business Plans
- Build Institutions
- Link Projects to other role players & markets
- Develop capacity building programmes

Training & Access to Markets (Cont) Training & Access to Markets (Cont)
• PST’s have now submitted their reports
• Training programmes are scheduled for Nov 02 to Feb 03
• Academic institutions like UOFS have offered to get involved in this process with their students.
• PST’s have now submitted their reports
• Training programmes are scheduled for Nov 02 to Feb 03
• Academic institutions like UOFS have offered to get involved in this process with their students.

Continued Project SupportContinued Project Support
• Some of the projects funded in 98/99 to 2000/01 are funded in the current 3 year programme
• The Women’s Coops objective is allocated R52 Mill over 3 years for this purpose
• DSD is also approaching other Depts. (e.g DTI) to take over projects that have potential
• The evaluation of the PRP, in 2003, will also inform exit strategy

IDT Support in Project IdentificationIDT Support in Project Identification
• IDT supports DSD to develop procedures for PRP
• In project identification, IDT developed project selection criteria
• Provinces use criteria to identify their projects
• IDT also supports provinces to target pockets of poverty
• Project identification takes place once in 3 years
• IDT supports DSD to develop procedures for PRP
• In project identification, IDT developed project selection criteria
• Provinces use criteria to identify their projects
• IDT also supports provinces to target pockets of poverty
• Project identification takes place once in 3 years

Achievements Achievements
• Managing development projects
• Improved Institutional Arrangements
• Community Participation
• Meeting Set Targets
• Managing development projects
• Improved Institutional Arrangements
• Community Participation
• Meeting Set Targets

ChallengesChallenges
• Disbursement Timeframes
• Dedicated Staff
• Cooperation of Commercial Banks
• Disbursement Timeframes
• Dedicated Staff
• Cooperation of Commercial Banks

ENDEND


