F ield tracer experiments investigating atmo-spheric dispersion around buildings and in ur-ban areas are essential for understanding and
addressing urban air pollution, toxic contaminantdispersal, and indoor/outdoor contaminant exchange.Results from field studies are used to identify andunderstand the physical processes governing disper-sion and to formulate mathematical equations de-scribing the processes. Field data are also necessaryto evaluate and validate computer models that simu-late atmospheric dispersion. The primary objective ofthe U.S. Department of Energy’s (DOE’s) Chemicaland Biological National Security Program (CBNP)URBAN 2000 tracer and meteorological study, de-scribed in this paper, is to provide tracer concentra-tions and meteorological observations throughout anurban area and beyond for evaluating a hierarchy ofatmospheric models (Brown et al. 2001) being devel-
oped by CBNP scientists. CBNP is an applied researchand development program that focuses emerging sci-ence and technology on countering the challengingthreat of chemical and biological weapons attackagainst civilian populations (U.S. Department of En-ergy 2001). The atmospheric dispersion models be-ing developed will be used to simulate toxic agentdispersal in urban environments and beyond. Thesemodels will allow personnel in intelligence, law en-forcement, and emergency management to ad-equately plan against, train for, and respond to po-tential terrorist attacks.
Over the years, many tracer field studies have beenconducted investigating dispersion in individual streetcanyons (e.g., Huang et al. 2000; DePaul and Sheih1985), around individual buildings (e.g., Oikawa andMeng 1997; Jones and Griffiths 1984; Ogawa andOikawa 1982), through multibuilding and industrialcomplexes (e.g., Thistle et al. 1995; Guenther et al.1990; Sagendorf et al. 1980), and through urban ar-eas (e.g., Cooke et al. 2000; McElroy 1997; Allwineet al. 1992; Gryning and Lyck 1984). Additionally, nu-merous wind tunnel and laboratory studies have beenconducted investigating flows and diffusion aroundidealized structures, individual buildings, and indus-trial complexes (e.g., Zhang et al. 1996; Higson et al.1994; Mirzai et al. 1994; Ramsdell 1990; Huber 1989;Hosker 1987; Hosker 1984; Huber and Snyder 1982;Allwine et al. 1980; Abbey 1976). These previous fieldand laboratory studies are certainly a rich resource of
OVERVIEW OF URBAN 2000A Multiscale Field Study of Dispersion
through an Urban Environment
K. J. ALLWINE, J. H. SHINN, G. E. STREIT, K. L. CLAWSON, AND M. BROWN
AFFILIATIONS: ALLWINE—Pacific Northwest National Laboratory,Richland, Washington; SHINN—Lawrence Livermore NationalLaboratory, Livermore, California; STREIT AND BROWN—Los AlamosNational Laboratory, Los Alamos, New Mexico; CLAWSON—FieldResearch Division, NOAA Air Resources Laboratory, Idaho Falls,IdahoCORRESPONDING AUTHOR: Dr. K. J. Allwine, Pacific NorthwestNational Laboratory, Richland, WA 99352E-mail: [email protected]
A unique atmospheric tracer and meteorological study shows the complicated patterns of
contaminant transport around buildings, through an urban area, and into the surrounding region
522 APRIL 2002|
data for model development and evaluation. In fact,existing field and wind tunnel data have been and arebeing used for testing and evaluating CBNP-devel-oped models and model components.
The justification for URBAN 2000 given such anextensive set of existing data, is based on one over-riding requirement that is not addressed by existingdata—that a short duration, small release be trackedaround an individual building, through multiplebuildings, through an urban area, and continuinginto the surrounding region tens-of-kilometers to ahundred kilometers from the release location underthe same meteorological conditions. This release willmimic a small terrorist attack in an urban area wherethe release must be tracked through the urban areaand into the surrounding region. The suite of CBNPmodels currently under development is formulatedto explicitly resolve mechanically altered flowsaround individual buildings and through the urbanarea, and to explicitly resolve meteorological flowsinfluencing the urban area and surrounding region.No single atmospheric dispersion model can yet re-solve all scales of atmospheric motion simulta-neously, so current models must still be formulatedwhere the scale of motion not resolved is eithertreated as boundary conditions (in the case of mesos-cale flows in building models) or parameterized (inthe case of urban effects in mesoscale models).Having tracer and meteorological data from URBAN2000 at various scales for the same meteorologicalconditions allows for urban parameterizations (sim-plified formulations) in mesoscale atmospheric mod-els to be properly evaluated. Additionally, the influenceof mesoscale flows on results from building-scalemodels can be evaluated.
The URBAN 2000 comprehensive urban disper-sion field campaign was conducted in Salt Lake City,Utah, during October 2000. It is the first comprehen-sive field tracer study that concurrently resolvedmultiple interacting scales of motion. Atmosphericmeteorological and tracer experiments were con-ducted to investigate transport and diffusion arounda single downtown building, through the downtownarea, and into the greater Salt Lake City (SLC) urbanarea. The study area was extended beyond the urbanscale by embedding the URBAN 2000 study in DOE’sVertical Transport and Mixing (VTMX) tracer andmeteorological study conducted simultaneously in thegreater Salt Lake Valley (SLV; Doran et al. 2002). Theresults of the urban dispersion field experiments willalso be used to better understand meteorological andfluid dynamical processes governing dispersion inurban areas. URBAN 2000 was designed to investi-
gate the urban nocturnal boundary layer (stable toneutral atmospheric conditions), whereas a secondmajor field campaign being planned for 2003 will bedesigned to investigate the daytime boundary layer(neutral to unstable).
In addition to providing an extensive dataset formodel evaluations, some specific scientific questionsaddressed by the URBAN 2000 field study include thefollowing: 1) Are street canyons preferred pathwaysof tracer transport during nighttime light wind speedconditions? 2) Do short duration (5–15 min) oscilla-tions in the approach flow wind direction and speedaffect tracer dispersion near the release building,through the downtown area, and into the greater ur-ban area? 3) Does the tracer mix rapidly in the verti-cal within the urban area? 4) Does the tracer remaintrapped in the urban area, ventilating at a muchslower rate than expected from mean advective trans-port? 5) Do diurnal thermally driven flows (e.g.,downslope winds, valley winds, lake breezes) stronglyinfluence winds in downtown SLC?
Planning URBAN 2000 initially required approvalby applicable government agencies (city and state)and completion of environmental documentation.Design considerations involved balancing scientificobjectives with constraints on budgets, site permis-sions, and available instrumentation. Field operationsin SLC required coordination with city services (po-lice, transportation, parking, etc.), conducting fieldoperations during regular city activities, access to in-strument sites, and last, but not least, acceptable pub-lic perception of releases of safe, inert tracer gases intothe atmosphere. Considerable negotiations and com-promises during the year of planning and preparationfor the URBAN 2000 study resulted in successful andgenerally problem-free field operations during Octo-ber 2000. The success of the study was due largely tothe support of government agencies, private compa-nies, and individuals in and around SLC. In spite ofour detailed planning for URBAN 2000, a couple ofunexpected problems arose near the end of our fieldoperations. We made news (unwanted) around thecountry as “unleashing gas attacks” on SLC. And oneof our tracer samplers was destroyed by a bomb squad.Needless to say, we learned from these two events that,when conducting future urban tracer studies, thepublic should be fully informed of our scientific stud-ies and the police should be provided with detailedmaps of all our sampler locations.
Urban tracer/meteorological studies are typicallyvery costly (can be several million dollars) and logis-tically complicated. Many compromises are requiredbetween accomplishing desired scientific objectives
523APRIL 2002AMERICAN METEOROLOGICAL SOCIETY |
and actually deploying instruments and making suc-cessful measurements. For example, measuring thevertical distribution of tracer within the urban canopyat several locations would be very desirable for deter-mining the effects of building-altered flows on verti-cal diffusion. Initially, it would seem obvious that withall the buildings in an urban area, determining thevertical distribution of tracer could easily be accom-plished by locating tracer samplers at various locationson many buildings. However, for numerous reasons,ranging from liability concerns to logistical difficul-ties, locating tracer samplers on and around manybuildings is not practical. For the URBAN 2000 studywe had tracer samplers on rooftops of five buildings.Gaining permissions (from different property own-ers) to locate the samplers on the buildings in SLCrequired considerable effort before the study period.During the study, placing and retrieving the tracersamplers on the buildings for each tracer experimentrequired considerable time in arranging building ac-cess from security personnel and in negotiating thebuildings.
This paper summarizes the URBAN 2000 study bydescribing the experimental design, instrument lay-out, experiments, meteorological conditions, andsome initial findings. The URBAN 2000 study shouldbe of general interest to all investigating urban dis-persion, urban air quality, and atmospheric transportand diffusion.
THE URBAN 2000 FIELD STUDY. Scientistsfunded by CBNP, the U.S. Department of Defense(DOD) Defense Threat Reduction Agency (DTRA),the U.S. Army Research Office (ARO), and the UnitedKingdom’s Defense Evaluation and Research Agency(DERA) participated in the URBAN 2000 field efforts.Project leadership was shared byDOE’s Pacific Northwest,Lawrence Livermore, and LosAlamos National Laboratoriesunder CBNP funding. OtherCBNP-funded investigatorswere from the National Oceanicand Atmospheric Administra-tion’s (NOAA’s) Air ResourcesLaboratory Field Research Divi-sion, DOE’s Brookhaven Na-tional Laboratory, and IndianaUniversity. Investigators fromDOD’s Dugway Proving Ground(DTRA funded), CoherentTechnologies (ARO and CBNPfunded), Vaisala Corporation,
and Litton Industries were key collaborators in thestudy.
Site description. The VTMX program chose the SLVas the site of its first experimental campaign becauseof many attractive features for studying vertical trans-port and mixing processes in the nocturnal stableboundary layer. SLC was a natural choice for the site ofthe first CBNP urban dispersion experiments becauseof the significant benefit of combining resources withVTMX and the fact that SLC has a well-developeddowntown area. A nearly 5-block-by-5-block area(∼1.5 km2) has buildings ranging in height from a fewstories to 40 stories, and has numerous parking lots,parking structures, and open areas that are character-istic of many U.S. cities (Fig. 1). SLC is Utah’s statecapital and is the central city to 1.7 million inhabit-ants residing within an hour’s drive from downtown.The city’s daytime population increases from 182,000residents to over 370,000 as 40% of Salt Lake County’sworkforce and 20% of the state’s total workforce com-mute to jobs located within the city limits.
The SLC metropolitan area is located in a largemountain valley about 50 km long and 25 km wide,with the high Wasatch Mountains on the east,Oquirrh Mountains on the west, Great Salt Lake justto the northwest, and Traverse Mountains to thesouth (Fig. 2). The valley is bisected nearly north tosouth by the Jordan River, which flows from the fresh-water Utah Lake in Utah County through a gap in theTraverse Mountains and north to the Great Salt Lake.The average elevation of SLC is approximately 1320 mabove sea level and the greater metropolitan area cov-ers approximately 288 km2.
SLC has a semiarid continental climate with fourwell-defined seasons. Precipitation is typically low
FIG. 1. Aerial view of downtown SLC looking toward the northeast intoCity Creek Canyon. (Photograph from Don Green Photography, Salt LakeCity, Utah.)
524 APRIL 2002|
during October and surface winds through downtownshow a pronounced diurnal cycle of winds from thesoutheast during nighttime and from the northwestduring daytime. Synoptic disturbances can interruptthe diurnal processes, but are infrequent occurrencesduring October. The near-persistent southeast windsduring the night allowed the tracer sampling networkconsolidated to the northwest of the release site forthe nighttime tracer and meteorological experiments.
Meteorological measurements. The URBAN 2000 com-prehensive meteorological and tracer field campaignwas conducted during October 2000 and was high-lighted by seven nightlong intensive operation peri-ods (IOPs) in which extensive meteorological mea-surements were made and tracer gases were releasedand tracked across SLC. The instruments were de-ployed over three experimental domains identified asurban, downtown, and building. Meteorological in-struments deployed by CBNP-funded investigatorsand other collaborators (DPG, DERA, and the VaisalaCorporation) over the 3 experimental domains con-
sisted of 29 temperature dataloggers for mapping the surfacetemperature across the urbanarea; 15 two-dimensional (2D)sonic anemometers for measur-ing the horizontal componentsof winds and turbulence; 9three-dimensional (3D) sonicanemometers for measuring thehorizontal and vertical compo-nents of winds and turbulence;a Doppler lidar for mapping thewinds across the urban area; aradar wind profiler giving ver-tical profiles of winds; a lidarceilometer for characterizingthe vertical structure of theboundary layer; 3 acousticsodars for vertical profiling ofwinds; 15 surface weather sta-tions; 1 mobile van for mappingtemperature; and 1 energy bud-get station measuring net radia-tion, sensible heat flux, latentheat flux, and 3 levels of tem-perature to 18 m above groundlevel (AGL). Most instrumentsystems were operated continu-ously throughout October, withthe exception of the lidars, thetemperature van, and some of
the 2D and 3D sonic anemometers that only operatedduring IOPs.
VTMX operated numerous meteorological instru-ments around the SLV (regional domain) during themonth of October. These consisted of 6 radar windprofilers; 5 radio acoustic sounding system (RASS)temperature profilers; 5 sodars; an infrared Dopplerlidar for mapping the radial (from instrument) com-ponent of winds; a high-resolution Raman water va-por lidar to measure water vapor fluctuations; 2 aero-sol lidars for providing mixing depths and nocturnallayering information; 4 tethered balloons; 3 sites forrawinsondes; 10 three-dimensional sonic anemom-eters; 14 surface weather stations to supplement thenetwork of 29 existing stations; and 25 temperatureloggers. Figure 2 shows VTMX surface weather sta-tions and existing surface weather stations in the re-gional domain. Refer to Doran et al. (2002) in this is-sue for a detailed description and deployment of theVTMX instrument systems.
Locations of meteorological systems deployed inthe urban domain are shown in Fig. 3. CBNP investi-
FIG. 2. Map of Salt Lake Valley (regional domain) showing terrain eleva-tions (m) and locations of VTMX tracer samplers, surface meteorologi-cal stations, and valley release locations.
525APRIL 2002AMERICAN METEOROLOGICAL SOCIETY |
gators and collaborators de-ployed 7 of the 19 surfaceweather stations; 1 of the 2 in-strumented towers; the radarwind profiler; the 2 sodars; theDoppler lidar; and the 29 tem-perature loggers shown in theurban domain. Weather stationswere located primarily on build-ing tops to measure 5-min-average winds, temperature, andrelative humidity in flows at thetop of the urban canopy. Thenetwork of 29 temperature log-gers was located at 3 m AGL onlight poles measuring 5-min-average temperature across theSLC urban area, with the pri-mary intent of characterizingthe SLC urban heat island. Aradar wind profiler was oper-ated continuously at the RagingWaters site (located at the inter-section of 1700 South and theJordan River) giving 1-h-averagewinds from 70 to 2160 m AGL in55-m-interval range gates, and1-h-average winds from 75 to3725 m in 96-m-interval rangegates. A sodar was also operatedat the Raging Waters site giving15-min-average winds from 30to 300 m in 10-m-interval range gates. The towernear the southeast corner of the downtown studydomain was actually a construction lift instrumentedwith two 2D sonic anemometers at 7.3 and 11 mAGL, and three temperature sensors at 7.8, 12.5, and18 m AGL operating at 1 Hz. Net radiation, latentheat flux, and sensible heat flux were also measuredat 12 m AGL on the construction lift using a net ra-diometer, krypton hygrometer, and 1D sonic an-emometer with a fine-wire thermocouple, respec-tively. The Doppler lidar was operated by CoherentTechnologies and was deployed during the later half(beginning 19 October) of the October study periodfrom the higher terrain just east of downtown scan-ning through downtown measuring the radial com-ponent of winds.
In the downtown domain shown in Fig. 4, investi-gators operated nine surface weather stations measur-ing winds, temperature, and relative humidity; threeinstrumented towers measuring wind and turbulenceprofiles; and one sodar measuring wind profiles. The
FIG. 3. Map of greater SLC area (urban domain) showing terrain elevations(m) and locations of CBNP tracer samplers and meteorological measure-ment sites. VTMX tracer samplers and surface weather stations, and ex-isting surface weather stations shown in Fig. 2 are also shown here.
sodar was operated by DPG on top of the 35-m-highFederal Building collecting 10-min-average wind datafrom 15 m above the building top to 200 m above thebuilding top in 5-m-interval range gates. Seven of thesurface weather stations, operated by DPG, were at-tached at 3 m AGL on light poles collecting 1-min-average wind and temperature data along downtownstreets. The other two surface weather stations wereoperated on building tops acquiring wind and tem-perature data near the top of the urban canopy. Eachof the three 10-m-high meteorological towers, oper-ated by DERA, contained two 3D sonic anemometersat 5 and 10 m above the surface. Two towers werelocated ∼50 m apart on the top of a 20-m-high park-ing structure and the other tower was located on thetop of a 35-m-high parking structure. The primaryintent of the three towers was to provide turbulencedata for model validation points within the urbancanopy. The data from the six sonic anemometers onthe three towers were collected continuously at a21-Hz sampling rate.
526 APRIL 2002|
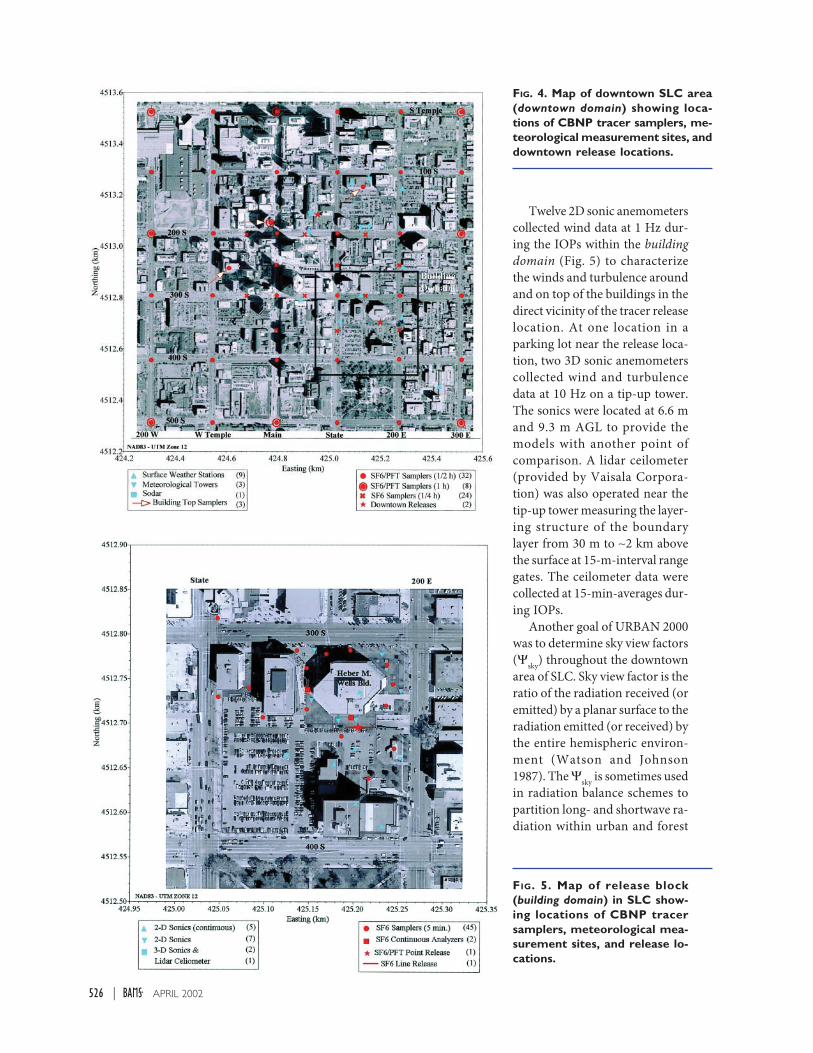
Twelve 2D sonic anemometerscollected wind data at 1 Hz dur-ing the IOPs within the buildingdomain (Fig. 5) to characterizethe winds and turbulence aroundand on top of the buildings in thedirect vicinity of the tracer releaselocation. At one location in aparking lot near the release loca-tion, two 3D sonic anemometerscollected wind and turbulencedata at 10 Hz on a tip-up tower.The sonics were located at 6.6 mand 9.3 m AGL to provide themodels with another point ofcomparison. A lidar ceilometer(provided by Vaisala Corpora-tion) was also operated near thetip-up tower measuring the layer-ing structure of the boundarylayer from 30 m to ∼2 km abovethe surface at 15-m-interval rangegates. The ceilometer data werecollected at 15-min-averages dur-ing IOPs.
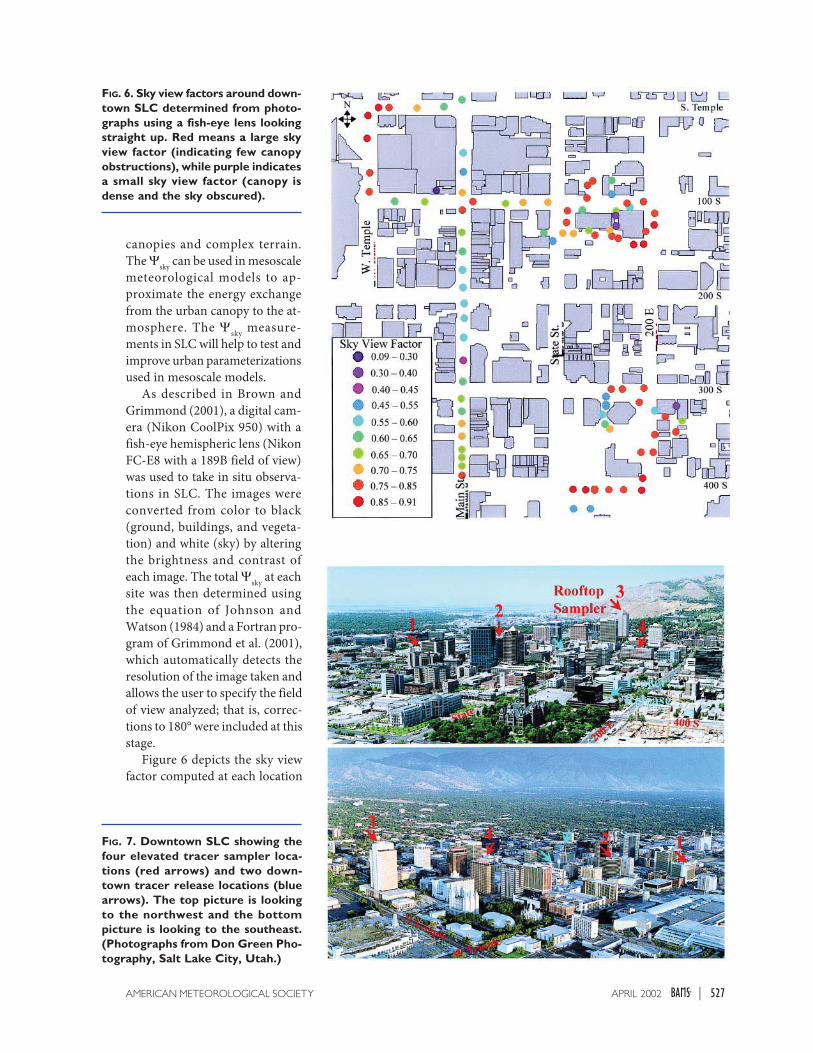
Another goal of URBAN 2000was to determine sky view factors(Ψsky) throughout the downtownarea of SLC. Sky view factor is theratio of the radiation received (oremitted) by a planar surface to theradiation emitted (or received) bythe entire hemispheric environ-ment (Watson and Johnson1987). The Ψsky is sometimes usedin radiation balance schemes topartition long- and shortwave ra-diation within urban and forest
FIG. 4. Map of downtown SLC area(downtown domain) showing loca-tions of CBNP tracer samplers, me-teorological measurement sites, anddowntown release locations.
FIG. 5. Map of release block(building domain) in SLC show-ing locations of CBNP tracersamplers, meteorological mea-surement sites, and release lo-cations.
527APRIL 2002AMERICAN METEOROLOGICAL SOCIETY |
canopies and complex terrain.The Ψsky can be used in mesoscalemeteorological models to ap-proximate the energy exchangefrom the urban canopy to the at-mosphere. The Ψsky measure-ments in SLC will help to test andimprove urban parameterizationsused in mesoscale models.
As described in Brown andGrimmond (2001), a digital cam-era (Nikon CoolPix 950) with afish-eye hemispheric lens (NikonFC-E8 with a 189B field of view)was used to take in situ observa-tions in SLC. The images wereconverted from color to black(ground, buildings, and vegeta-tion) and white (sky) by alteringthe brightness and contrast ofeach image. The total Ψsky at eachsite was then determined usingthe equation of Johnson andWatson (1984) and a Fortran pro-gram of Grimmond et al. (2001),which automatically detects theresolution of the image taken andallows the user to specify the fieldof view analyzed; that is, correc-tions to 180° were included at thisstage.
Figure 6 depicts the sky viewfactor computed at each location
FIG. 6. Sky view factors around down-town SLC determined from photo-graphs using a fish-eye lens lookingstraight up. Red means a large skyview factor (indicating few canopyobstructions), while purple indicatesa small sky view factor (canopy isdense and the sky obscured).
FIG. 7. Downtown SLC showing thefour elevated tracer sampler loca-tions (red arrows) and two down-town tracer release locations (bluearrows). The top picture is lookingto the northwest and the bottompicture is looking to the southeast.(Photographs from Don Green Pho-tography, Salt Lake City, Utah.)
528 APRIL 2002|
in the downtown area of SLC. Red means that Ψsky islarge, indicating few canopy obstructions; whilepurple indicates that Ψsky is small, meaning that thecanopy is dense and the sky is obscured. Clearly Ψskyis smallest in narrow alleyways and in regions closeto tall buildings. One should also note that the manytrees along open streets contributed to reduced Ψsky.The Ψsky observed in downtown SLC ranged from 0.33to 0.90, with an average of 0.70. A histogram of thecomputed sky view factors showed the majority in the0.5–0.9 range.
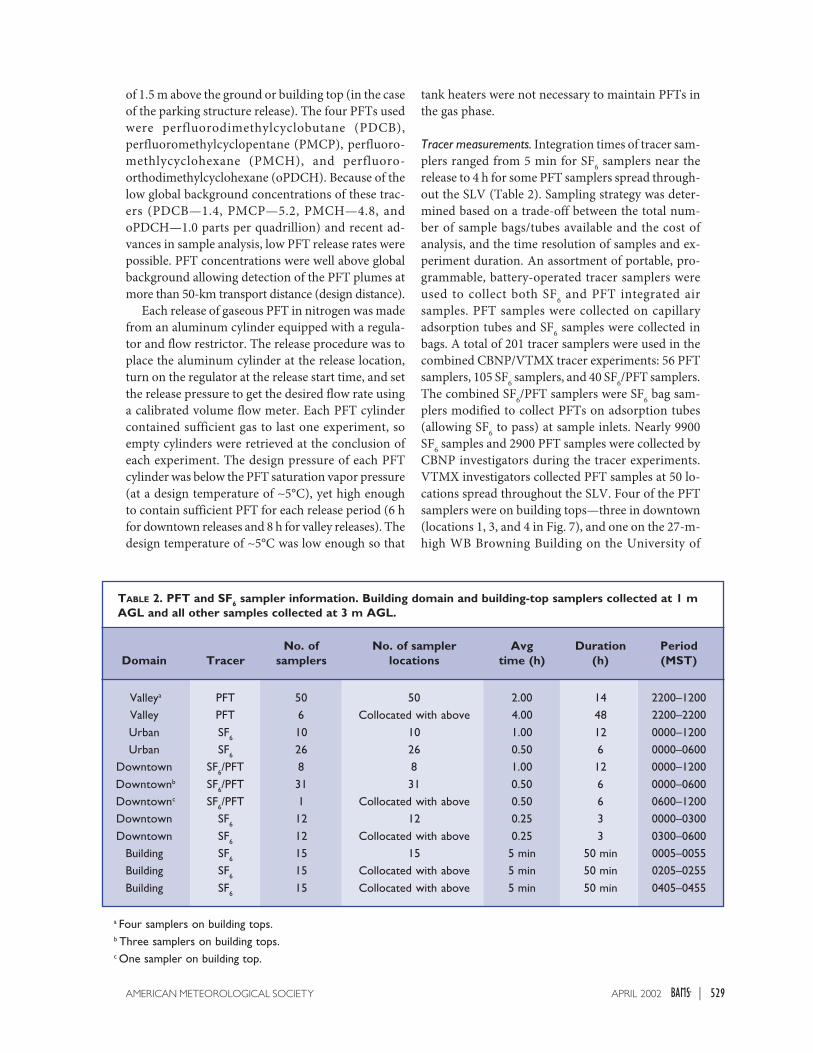
Tracer releases. Eighteen 1-h-long sulfur hexafluoridetracer (SF6) releases occurred from one location indowntown SLC (Fig. 5); twelve 6-h-long perfluoro-carbon tracer (PFT) releases occurred from two lo-cations in downtown SLC (Figs. 4 and 7), and twelve8-h-long PFT releases occurred from two locationsaround the greater SLC area (Fig. 2) during the sevenIOPs. PFTs were released by VTMX investigators, butare included here because CBNP investigators fieldedPFT samplers as part of their experiments.
The SF6 was released at ground level approximately15 m south of the 35-m-high Heber M. Wells build-ing (Figs. 5 and 7) in downtown SLC near the inter-section of 400 South and 200 East. The nearest “up-wind” building from the release is the 40-m-high CityCenter building located approximately 80 m directlysouth of the Heber M. Wells building. During the first4 tracer IOPs (2, 4, 5, and 7) SF6 was released at 1 g s−1
from a 30-m-long line source for three 1-h periodsfrom 0000 to 0100, 0200 to 0300, and 0400 to 0500Mountain Standard Time (MST = UTC − 7 h). Notethat the IOP numbers are a subset of the 10 VTMX
meteorological and tracer experiments when tracerswere released. (VTMX IOPs 1, 3, and 6 were meteo-rological-only experiments, no tracers were released.)For the last IOP (10), SF6 was released for the sametime periods and release rate as during the first fourIOPs, except the release was from a point rather thana line source. The SF6 tracer experiment during IOP9 was conducted earlier in the night to better coin-cide with the expected higher winds through down-town SLC. The tracer was released at 2 g s−1 from apoint source for three 1-h periods from 2100 to 2200,2300 to 0000, and 0100 to 0200 MST. The release rateof SF6 was monitored throughout each experimentand was within 5% of the desired rate. The SF6 cylin-der was weighed at the beginning and ending of eachexperiment as a second check on the amount of tracergas released during each experiment. The SF6 releaserate was chosen to allow the tracer plume well abovethe approximate 3 parts per trillion (ppt) global back-ground concentration at more than 15-km transportdistance (design distance) from the release point.
Table 1 gives the PFT release rates for the six IOPs(2, 4, 5, 7, 8, and 10) during which four different PFTswere simultaneously released from four pointsources—two located in downtown SLC and twosouth of the city in the SLV. The same PFT was al-ways released from the same location allowing trans-port from different release locations to specific recep-tor locations to be investigated. One downtown PFTwas released at ground level with the SF6 tracer(southerly release location in Figs. 4 and 7), and theother downtown PFT was released from the top of a35-m-high parking structure (northerly release loca-tion in Figs. 4 and 7). PFTs were released at a height
PFT Nearby street Height Time Extent Ratename Location intersection (m AGL) (MST) (h) (ms s−1)
PMCP SE Salt Lake Valley 900 E & 6400 S 1.5 2200–0600 8 1.20(Wheeler Farm)
PMCH Downtown near 200 E & 400 S 1.5 0000–0600 6 0.43Heber M. Wells Building
oPDCH Downtown on top State & 200 S 36.0 0000–0600 6 0.15Regents Parking
TABLE 1. PFT tracer release data for four point sources for all IOPs.
529APRIL 2002AMERICAN METEOROLOGICAL SOCIETY |
of 1.5 m above the ground or building top (in the caseof the parking structure release). The four PFTs usedwere perfluorodimethylcyclobutane (PDCB),perfluoromethylcyclopentane (PMCP), perfluoro-methlycyclohexane (PMCH), and perfluoro-orthodimethylcyclohexane (oPDCH). Because of thelow global background concentrations of these trac-ers (PDCB—1.4, PMCP—5.2, PMCH—4.8, andoPDCH—1.0 parts per quadrillion) and recent ad-vances in sample analysis, low PFT release rates werepossible. PFT concentrations were well above globalbackground allowing detection of the PFT plumes atmore than 50-km transport distance (design distance).
Each release of gaseous PFT in nitrogen was madefrom an aluminum cylinder equipped with a regula-tor and flow restrictor. The release procedure was toplace the aluminum cylinder at the release location,turn on the regulator at the release start time, and setthe release pressure to get the desired flow rate usinga calibrated volume flow meter. Each PFT cylindercontained sufficient gas to last one experiment, soempty cylinders were retrieved at the conclusion ofeach experiment. The design pressure of each PFTcylinder was below the PFT saturation vapor pressure(at a design temperature of ∼5°C), yet high enoughto contain sufficient PFT for each release period (6 hfor downtown releases and 8 h for valley releases). Thedesign temperature of ∼5°C was low enough so that
tank heaters were not necessary to maintain PFTs inthe gas phase.
Tracer measurements. Integration times of tracer sam-plers ranged from 5 min for SF6 samplers near therelease to 4 h for some PFT samplers spread through-out the SLV (Table 2). Sampling strategy was deter-mined based on a trade-off between the total num-ber of sample bags/tubes available and the cost ofanalysis, and the time resolution of samples and ex-periment duration. An assortment of portable, pro-grammable, battery-operated tracer samplers wereused to collect both SF6 and PFT integrated airsamples. PFT samples were collected on capillaryadsorption tubes and SF6 samples were collected inbags. A total of 201 tracer samplers were used in thecombined CBNP/VTMX tracer experiments: 56 PFTsamplers, 105 SF6 samplers, and 40 SF6/PFT samplers.The combined SF6/PFT samplers were SF6 bag sam-plers modified to collect PFTs on adsorption tubes(allowing SF6 to pass) at sample inlets. Nearly 9900SF6 samples and 2900 PFT samples were collected byCBNP investigators during the tracer experiments.VTMX investigators collected PFT samples at 50 lo-cations spread throughout the SLV. Four of the PFTsamplers were on building tops—three in downtown(locations 1, 3, and 4 in Fig. 7), and one on the 27-m-high WB Browning Building on the University of
a Four samplers on building tops.b Three samplers on building tops.c One sampler on building top.
No. of No. of sampler Avg Duration PeriodDomain Tracer samplers locations time (h) (h) (MST)
Downtown SF6 12 Collocated with above 0.25 3 0300–0600Building SF6 15 15 5 min 50 min 0005–0055Building SF6 15 Collocated with above 5 min 50 min 0205–0255
Building SF6 15 Collocated with above 5 min 50 min 0405–0455
TABLE 2. PFT and SF6 sampler information. Building domain and building-top samplers collected at 1 mAGL and all other samples collected at 3 m AGL.
530 APRIL 2002|
Utah campus. The heights of the buildings at locations1, 3, and 4 in Fig. 7 are 56, 121, and 36 m, respectively.A total of nearly 2600 PFT samples were collected byVTMX investigators during six PFT experiments.
The SF6 bag samples were analyzed using a gaschromatography–electron capture detector (GC–ECD) tuned for SF6 analysis. The PFTs are being ana-lyzed by Brookhaven National Laboratory using aGC–ECD system specially developed at Brookhavento resolve up to 15 PFTs and detect at global back-ground levels. In addition to the fixed tracer samplers,four instrumented vans with fast-response (1 Hz) SF6analyzers with electron capture detectors were drivenalong arcs at 1, 2, 4, and 6 km from the SF6 release to
provide real-time plume tracking. Two additionalfast-response analyzers operated at fixed sites indowntown. A mobile Fourier transform infrared(FTIR) spectrometer was operated during the firsttracer experiment and mapped SF6 concentrations inthe downtown area.
Tracer samplers were distributed to resolve thevarious scales-of-motion being studied. For the build-ing domain, 45 SF6 samplers were placed at 15 loca-tions in the near vicinity of the tracer release (Fig. 5)and collected samples at nominally 1 m AGL. Threesamplers were located at each sampling site to allowcollection of 5-min-average samples during each ofthe 3 h that SF6 was released. Additionally, one infra-
red spectrophotometer and onemicro gas chromatograph con-tinuously measured SF6 fromfour points and eight points, re-spectively, in the vicinity of theHeber M. Wells study building.
For the downtown domain,40 SF6/PFT samplers and 24 SF6samplers were located in a 5-by-5 block downtown area (Fig. 4)and collected samples on lightpoles near streetside at 3 mAGL. At three locations (loca-tions 1, 2, and 4 in Fig. 7), fourof the SF6/PFT samplers (twosamplers at location 2 in Fig. 7)were located on building tops,giving an indication of the ver-tical distribution of tracer. Theheights of the buildings at loca-tions 1, 2, and 4 in Fig. 7 are 56,64, and 36 m, respectively.Thirty-one of the 40 SF6/PFTsamplers collected 0.5-h inte-grated samples over the period0000–0600 MST, and 8 of the 40SF6/PFT samplers collected 1-hintegrated samples over the pe-riod 0000–1200 MST to extendthe tracer sampling throughthe morning transition period.Figure 4 shows 12 SF6 samplingsites at midblock locations onthe streets near the release loca-tion. Twelve SF6 samplers col-lected 0.25-h integrated samplesfrom 0000 to 0300 MST, andanother 12 collected 0.25-h in-tegrated samples from 0300 to
FIG. 8. Hourly averaged meteorological conditions for Oct 2000 measuredat 3 m above the rooftop on a 11-m-high building with unobstructed ex-posure to the winds. The weather station was located at the center ofthe Salt Lake Valley near the intersection of 900 West and 3300 South(Fig. 3). Note that the IOP numbers are a subset of the 10 within VTMXwhen tracers were released.
531APRIL 2002AMERICAN METEOROLOGICAL SOCIETY |
0600 MST at these 12 sampling locations (2 samplersper location).
For the urban domain, 36 SF6 samplers were lo-cated on 2-, 4-, and 6-km arcs (Fig. 3) from the down-town SF6 release location. The samplers were locatedprimarily in the 90° downwind sector (northwestfrom downtown) to track the nighttime release. Foursamplers were located to the southeast of downtownto measure the SF6 “plume” after wind reversal afterthe morning transition period. Twenty-six of the SF6samplers collected 0.5-h integrated samples from0000 to 0600 MST, and 10 samplers collected 1-h in-tegrated samples from 0000 to 1200 MST.
METEOROLOGICAL CONDITIONS. Table 3gives the times and general meteorology of the sevenIOPs during which the tracers were released. Basedon daily weather forecasts given by the University ofUtah meteorology faculty and students as part of theirVTMX efforts, CBNP releases of SF6, and sampling
of SF6 and PFTs, and VTMX releases and samplingof PFTs were accomplished at the same time. TheIOPs in Table 3 are a subset of the 10 IOPs withinVTMX (Doran et al. 2002) during which tracer ex-periments were conducted. IOP start time is the starttime of the earliest tracer release, and stop time is theending time of the last tracer sampler (excluding thesix multiday PFT samplers).
The typical meteorological conditions investigatedwere weak synoptic influence with clear skies, weakwinds aloft, and strong surface cooling leading towell-developed nocturnal drainage winds. IOPs 4, 5,7, and 8 exhibited these desired characteristics, withconditions during IOPs 4 and 7 being altered by ap-proaching upper-level troughs with accompanyingstrong southerly surface winds eroding the surfaceinversions after 0500 MST. A downslope wind stormoccurred during IOP 2 with strong easterly windsemerging after 0000 MST into the SLV from Parley’sCanyon and other major canyons (Fig. 2) in the
TABLE 3. Overview of six SF6 and six PFT tracer experiments.
Starta Stopb
IOP Date Date
no. (DOY)c MST (DOY) MST Tracersd Meteorology
2 6 Oct 2000 2200 7 Oct 2000 1200 SF6 line; Strong easterly downslope winds after(280) (281) PFTs 0000–0300 MST penetrating 1–2 km
into valley at the surface4 8 Oct 2000 2200 9 Oct 2000 1200 SF6 line; Clear skies, weak winds, well-
(282) (283) PFTs developed drainage; approachingtrough eroded inversions after0500 MST
5 14 Oct 2000 2200 15 Oct 2000 1200 SF6 line; Clear skies, weak winds, well-(288) (289) PFTs developed drainage
7 17 Oct 2000 2200 18 Oct 2000 1200 SF6 line; Clear skies, weak winds, well-(291) (292) PFTs developed drainage; approaching
trough eroded inversions after0500 MST
8 19 Oct 2000 2200 20 Oct 2000 1200 PFTs only Clear skies, weak winds, well-(293) (294) developed drainage
9 20 Oct 2000 2100 21 Oct 2000 0900 SF6 point Cloudy skies, weak to moderate(294) (295) only winds, weak drainages; affected by
approaching troughs
10 25 Oct 2000 2200 26 Oct 2000 1200 SF6 point; Cloudy skies, moderate winds, weak(299) (300) PFTs drainages; affected by approaching
troughs
a Start of tracer sampling.b End of tracer sampling.c Day of year.d SF6 point and line releases, PFT point releases only.
532 APRIL 2002|
Wasatch Mountains. Cold air continued to build eastof the Wasatch Mountains, eventually spilling overinto the northeast portion of SLV near SLC, and lead-ing to wind gusts in excess of 20 m s−1 penetrating 1–2 km into the valley at the surface. Conditions dur-ing IOPs 9 and 10 were considerably affected byapproaching upper-level troughs. Skies were partlycloudy to overcast, and nocturnal surface inversionswere weaker than during the other IOPs. Southerlywinds were enhanced, especially during IOP 10, lead-ing to stronger southeasterly winds through down-town SLC. Figure 8 shows the meteorology near thesurface at the center of the valley for the month ofOctober 2000, and provides a visual summary of theoccurrences of well-established diurnal flows duringclear conditions—the desirable experimental condi-tions. The meteorological conditions during each ofthe seven tracer IOPs are identified.
The SLC area experiences pronounced diurnal cir-culations, with winds from the southeast during thenighttime established between 1800 and 2000 MST.The tracer releases and sampling were started between2200 and 0000 MST, during well-established noctur-nal flows. All tracer releases were stopped at0600 MST and nearly all SF6 and half the PFT sam-pling was stopped at 0600 MST. The winds beganswitching to upvalley (from the northwest) at about0800 MST, allowing for the tracer plume advected tothe northwest during the nighttime to be carried backto the southeast across the sampling grid. Samplingon a subset of SF6 samplers was extended to 1200 MSTto allow for the investigation of the effects of the windreversal during the morning transition period.Sampling on all VTMX PFT samplers was throughnoon to investigate the effects of wind reversal ontransport and diffusion throughout the entire valley.
PFT sampling at six sites within the valley was ex-tended up to 48 h from the release start to investigatethe possibility for multiday tracer residence in theSLV.
Figure 8 shows surface winds during IOP 10 ofapproximately 2–4 m s−1 from the south-southeast inthe center of the SLV during the SF6 release and pri-mary sampling period (0000–0600 MST). The 5-min-averaged winds at two locations (“Master Muffler”and “Warehouse” in Fig. 3) near downtown SLC var-ied from the east-northeast through south during the0000–0600 MST period (Fig. 9). Both surface weatherstations were located on building tops (Master Muf-fler building—4 m high, Warehouse building—20 mhigh) with unobstructed exposure to the winds. The7-m AGL winds at the Master Muffler surfaceweather station south of downtown were less than2 m s−1 from the east-northeast through the south-east during the early portion of the sampling period,increasing to 3 m s−1 from the east-southeast throughthe south during the later half of the period (0300–0600 MST). The Warehouse surface weather stationnorthwest of downtown showed stronger winds thanthe Master Muffler station and more from the south-erly direction. Winds were generally 2–4 m s−1 fromthe east-southeast through the south-southeast dur-ing the first half of the sampling period and 4–6 m s−1
from the east-southeast through the south during thelater half.
Nighttime wind speeds around downtown SLCduring the majority of the tracer IOPs were generallylight (< 2–3 m s−1) and the wind direction varied pri-marily through a 90° sector centered on winds fromthe southeast. Even higher wind speed IOPs, such asIOP 10, had considerable variation in the speed anddirection of winds approaching downtown SLC.
PRELIMINARY TRACERRESULTS. A brief discussionof results from one of the 18-h-long SF6 releases is given next asan example of the tracer resultsavailable from URBAN 2000.Data from the 145 SF6 bag sam-plers for IOP 10 (26 October2000) are discussed. A completedataset for any tracer release willinclude, not only all the bagsampler data, but also tracerdata from the eight real-timeanalyzers and the extensive cov-erage of meteorological and tur-bulence data.
FIG. 9. Five-min-average wind speed (m s−1) and wind direction on build-ing tops west (Warehouse) and south of downtown (Master Muffler).Numbers denote the ending hour (0100–0600 MST) in which measure-ment occurred.
533APRIL 2002AMERICAN METEOROLOGICAL SOCIETY |
FIG. 10. Half-hourly average SF6 concentration isopleths (ppt) for the 0000–0100 MST release on 26 Oct 2000(IOP 10). Ending times are shown in each panel. Black star is release point and black dots sampler locations.The isopleths include the following: cyan—30, blue—300, orange—3000, and red—30 000. (left panels) A por-tion of the urban domain and (right panels) the downtown domain.
534 APRIL 2002|
The SF6 concentrations isopleths for the first 1-htracer release (0000–0100 MST) during IOP 10 areshown in Fig. 10. The isopleths are intended to iden-tify the general coverage of the tracer plume at groundlevel. Tracer distributions are not resolved aroundindividual buildings other than around the Heber M.Wells building near the release location. Half-hour-averaged concentration isopleths are displayed forthree periods with ending times of 0030, 0100, and0130 MST. The last half-hour period shows the rateof diminishing concentrations after the tracer releasewas stopped. Figure 10 has two panels for each of thethree time periods showing the ground-level concen-tration isopleths for a portion of the urban domain outto 6 km from the release, and the ground-level con-centration isopleths for the downtown domain. Thelowest isopleth is 30 ppt, which is roughly a factor of10 above background, giving a clear indication of theextent of the tracer plume. Additional isopleths plot-ted are 300, 3000, and 30,000 ppt.
The mean transport speed of the tracer plume inthe urban domain is roughly 2 m s−1 (based on its lead-ing edge; Fig. 10), commensurate with the speed ofwinds approaching the downtown area. The plumetransport direction in the urban domain is to thenorthwest, also commensurate with the winds west ofdowntown. The tracer plume in the downtown do-main moves generally to the west near the source,pushing more to the northwest after two to three cityblocks (∼0.5 km) from the release location. Thisplume behavior is consistent with winds more froman easterly direction to the east of downtown, switch-ing more southerly west of downtown. This behaviorin the winds near downtown SLC is thought to be theinteraction of the easterly downslope winds from theWasatch Mountains to the east of downtown andfrom the southeasterly downvalley winds through theSLV. The land–lake breeze effect from the Great SaltLake to the northwest of the SLV is also favorable tosoutheasterly winds in the SLV.
A revealing character of thetracer plume in Fig. 10 is theconsiderable horizontal spreadof the half-hourly averagedplume in the downtown domain.Throughout the 1-h release pe-riod the tracer took differentpathways around buildings andalong roadways in the first twoto three blocks from the releaselocation. Analysis of data fromthe 5-min-averaged tracer sam-plers and the fast-response ana-lyzers in the vicinity of the re-lease will help identify theimportance of the variousmechanisms (e.g., flow channel-ing, vorticies, wake turbulence)governing initial plume spread.
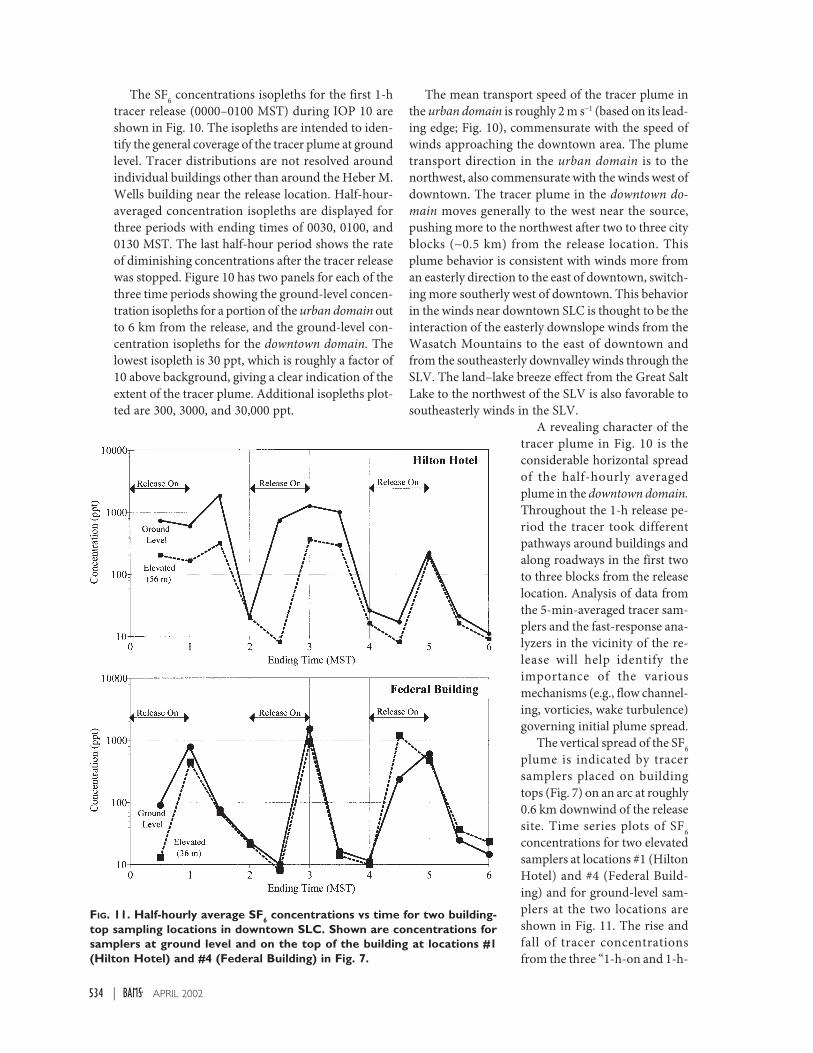
The vertical spread of the SF6plume is indicated by tracersamplers placed on buildingtops (Fig. 7) on an arc at roughly0.6 km downwind of the releasesite. Time series plots of SF6concentrations for two elevatedsamplers at locations #1 (HiltonHotel) and #4 (Federal Build-ing) and for ground-level sam-plers at the two locations areshown in Fig. 11. The rise andfall of tracer concentrationsfrom the three “1-h-on and 1-h-
FIG. 11. Half-hourly average SF6 concentrations vs time for two building-top sampling locations in downtown SLC. Shown are concentrations forsamplers at ground level and on the top of the building at locations #1(Hilton Hotel) and #4 (Federal Building) in Fig. 7.
535APRIL 2002AMERICAN METEOROLOGICAL SOCIETY |
off” SF6 releases for IOP 10 are clearly shown. Alsoevident is the nearly complete vertical mixing of thetracer plume through the urban canopy, especially atthe Federal Building site approximately 550 m to thenorth-northwest of the release location. The elevatedsampler (Hilton Hotel) approximately 600 m to theeast-northeast of the release site showed near-complete mixing through ∼60 m above ground levelfor the third tracer release during IOP 10.
SUMMARY AND FUTURE DIRECTIONS. Amajor urban tracer and meteorological field campaign(URBAN 2000) was conducted in SLC, Utah duringOctober 2000 as part of the DOE’s Chemical and Bio-logical National Security Program (CBNP). CBNP isan applied research and development program thatfocuses emerging science and technology on counter-ing the challenging threat of chemical and biologicalweapons attacks against civilian populations. To ad-equately plan against, train for, and respond to po-tential attacks, atmospheric models are being devel-oped, tested, and evaluated within the CBNPModeling and Prediction Initiative to provide usersin intelligence, law enforcement, and emergencymanagement with an integrated set of computer-based modeling tools by 2004. Results from the URBAN2000 study will be used to evaluate and improve thehierarchy of atmospheric models being developed forsimulating toxic agent dispersal from potential terror-ist activities in urban environments. In addition, theresults will be used to identify and further understandthe meteorological and fluid dynamic processes gov-erning dispersion in urban environments. Thestrength of the URBAN 2000 study is that it providesa dataset that resolves interacting scales of motionfrom the individual building up through the regionalscale under the same meteorological conditions.
The hierarchy of atmospheric dispersion modelsunder development by CBNP investigators coverstransport distances ranging from dispersion aroundindividual buildings (tens of meters), to dispersionthrough the urban area (hundreds of meters to a fewkilometers) and dispersion beyond the urban area tothe regional-scale (tens of kilometers to 100 km). Toadequately evaluate the hierarchy of models, URBAN2000 was conducted to resolve transport scales concur-rently, so that various models can be evaluated usingthe same meteorological conditions. URBAN 2000 wasdesigned to investigate the urban nocturnal bound-ary layer (stable to neutral atmospheric conditions),whereas the second major field campaign planned for2003 will be designed to investigate the urban daytimeboundary layer (neutral to unstable). Planning for the
URBAN 2003 field campaign is currently under waywith DTRA. The combination of data from the alreadycompleted URBAN 2000 (nighttime) field campaignand the planned URBAN 2003 field campaign willallow the suite of CBNP dispersion models to be evalu-ated over a broad range of atmospheric conditions.
Work will continue during 2002 on the reduction,verification, analysis, archiving, and publication ofresults from the URBAN 2000 field campaign. Modelevaluation workshops will be held to allow CBNPmodel developers and experimentalists to interact onall aspects of the data interpretation and model evalu-ation. It is anticipated that complete meteorologicaland tracer datasets for some of the seven tracer IOPswill be made available to the general scientific com-munity for model evaluation during 2002. The URBAN2000 study should be of general interest to all inves-tigating urban dispersion, urban air quality, and at-mospheric transport and diffusion.
ACKNOWLEDGMENTS. Many individuals, busi-nesses, and scientists contributed to the successful outcomeof the URBAN 2000 study. The collaboration of the CBNP-funded scientists was essential for the success of the experi-ments. And no less important to the success of the studywas the collaboration of the VTMX scientists, especiallytheir scientific director, Dr. Chris Doran and the principalinvestigator for the PFT experiments, Dr. Jerome Fast.Numerous businesses and government agencies generouslyallowed instruments placed and field operations conductedon their property or premises. We would especially like tothank Mr. Ben Gustafson of Gustafson Construction, Inc.,whose work and connections provided us with certain keyequipment and facilities. The support of the DOE CBNPstaff is much appreciated, especially Drs. Page Stoutlandand Richard Wheeler who were continually supportive ofthe work. This work was supported by the U.S. Departmentof Energy, under Contract DE-AC06-76RLO 1830 at thePacific Northwest National Laboratory. Pacific NorthwestNational Laboratory is operated for the U.S. Departmentof Energy by Battelle Memorial Institute.
REFERENCESAbbey, R. F., Jr., 1976: Concentration measurements
downwind of buildings: Previous and current experi-ments. Preprints, Third Symp. on Atmospheric Tur-bulence, Diffusion and Air Quality, Raleigh, NC,Amer. Meteor. Soc., 247–254.
Allwine, K. J., R. N. Meroney, and J. A. Peterka, 1980:Rancho Seco building wake effect on atmospheric
536 APRIL 2002|
diffusion: Simulation in a meteorological wind tunnel.U.S. Nuclear Regulatory Commission Tech. Doc.NUREG/CR-1286, 176 pp. [Available from U.S. NuclearRegulatory Commission, Washington, DC 20555.]
——, B. K. Lamb, and R. Eskridge, 1992: Winter-timedispersion in a mountain basin at Roanoke, Virginia:Tracer study. J. Appl. Meteor., 31, 1295–1311.
Brown, M., and S. Grimmond, 2001: Sky view factormeasurements in downtown Salt Lake City—Datareport for the DOE CBNP URBAN field experiment,October 2000. Los Alamos National Laboratory Rep.LA-UR-01-1424, 43 pp. [Available from Los AlamosNational Laboratory, Los Alamos, NM 87545.]
——, and Coauthors, 2001: Multiscale modeling of airflow in Salt Lake City and the surrounding region.Los Alamos National Laboratory Tech. Rept. LA-UR-01-509, 15 pp. [Available from Los Alamos Na-tional Laboratory, Los Alamos, NM 87545.]
Cooke, K. M., S. Di Sabatino, P. G. Simmonds, G.Nickless, R. E. Britter, and F. Caton, 2000: Tracersand dispersion of gaseous pollutants in an urbanarea—Birmingham Tracer Experiments. NERC/URGENT Project No. GST/02/1974, 88 pp.
DePaul, F. T., and C. M. Sheih, 1985: A tracer study ofdispersion in an urban street canyon. Atmos.Environ., 19, 555–559.
Doran, J. C., J. D. Fast, and J. Horel, 2002: The VTMX2000 campaign. Bull. Amer. Meteor. Soc., 83, 537–551.
Grimmond, C. S. B., S. K. Potter, H. N. Zutter, and C.Souch, 2001: Rapid methods to estimate sky view fac-tors applied to urban areas. Int. J. Climatol., 21, 903–913.
Gryning, S., and E. Lyck, 1984: Atmospheric dispersionfrom elevated sources in an urban area: Comparisonbetween tracer experiments and model calculations.J. Climate Appl. Meteor., 23, 651–660.
Guenther, A., B. Lamb, and E. Allwine, 1990: Buildingwake dispersion at an arctic industrial site: Fieldtracer observations and plume model evaluations.Atmos. Environ., 24A, 2329–2348.
Higson, H. L., R. F. Griffiths, D. D. Jones, and D. J. Hall,1994: Concentration measurements around an iso-lated building: A comparison between wind tunneland field data. Atmos. Environ., 28, 1827–1836.
Hosker, R. P., 1984: Flow and diffusion near obstacles.Atmospheric Science and Power Production, DOE/TIC-27601, D. Randerson, Ed., U.S. Dept. of Energy,241–326. [Available from National Technical Infor-mation Service, U.S. Department of Commerce,Springfield, VA 22161.]
——, 1987: The effects of buildings on local dispersion.Modeling the Urban Boundary Layer, Amer. Meteor.Soc., 95–160.
Huang, H., Y. Akutsu, M. Arai, and M. Tamura, 2000:A two-dimensional air quality model in an urbanstreet canyon: Evaluation and sensitivity analysis.Atmos. Environ., 34, 689–698.
Huber, A. H., 1989: The influence of building width andorientation on plume dispersion in the wake of abuilding. Atmos. Environ., 23, 2109–2116.
——, and W. H. Snyder, 1982: Wind tunnel investiga-tion of the effects of a rectangular-shaped buildingon dispersion of effluents from short adjacent stacks.Atmos. Environ., 16, 2837–2848.
Johnson, G. T., and I. D. Watson, 1984: The determina-tion of view-factors in urban canyons. J. ClimateAppl. Meteor., 23, 329–335.
Jones, C. D., and R. F. Griffiths, 1984: Full-scale experi-ments on dispersion around an isolated building us-ing an ionized air tracer technique with very shortaveraging time. Atmos. Environ., 18, 903–916.
McElroy, J. L., 1997: Diffusion from low-level urbansources: Reexamination using recently available ex-perimental data. J. Appl. Meteor., 36, 1027–1030.
Mirzai, M. H., J. K. Harvey, and C. D. Jones, 1994: Windtunnel investigation of dispersion of pollutants dueto wind flow around a small building. Atmos.Environ., 28, 1819–1826.
Ogawa, Y., and S. Oikawa, 1982: A field investigation ofthe flow and diffusion around a model cube. Atmos.Environ., 16, 207–222.
Oikawa, S., and Y. Meng, 1997: A field study of diffu-sion around a model cube in a suburban area.Bound.-Layer Meteor., 84, 399–410.
Ramsdell, J. V., 1990: Diffusion in building wakes forground-level releases. Atmos. Environ., 24B, 377–388.
Sagendorf, J. F., N. R. Ricks, G. E. Start, and C. R.Dickson, 1980: Diffusion near buildings as determinedfrom atmospheric tracer experiments. U.S. NuclearRegulatory Commission Tech. Doc. NUREG/CR-1394, 25 pp. [Available from U.S. Nuclear RegulatoryCommission, Washington, DC 20555.]
Thistle, H. W., D. R. Murry, M. R. Ratte, and M. R.Carroll, 1995: Atmospheric tracer concentrationsfrom elevated source in urban core. J. Environ. Eng.,121, 5–15.
U.S. Department of Energy, 2001: Chemical and Biologi-cal National Security Program 2000 annual report.U.S. Department of Energy DOE/NN-0015, 218 pp.
Watson, I., and G. Johnson, 1987: Graphical estimationof sky view-factors in urban environments. J.Climatol., 7, 193–197.
Zhang, Y. Q., S. P. Arya, and W. H. Snyder, 1996: A com-parison of numerical and physical modeling of stableatmospheric flow and dispersion around a cubicalbuilding. Atmos. Environ., 30, 1327–1345.