1 Abstract-- This paper demonstrates the results from a detailed study of the overvoltage protection of a particular 400/150 kV 400 MVA power transformer. The work presented here is based on real-life power system substation design and data and initiated by Danish TSO Energinet.dk as a consequence of a serious transformer overvoltage damage. A simulation model for the entire system consisting of overhead line, transformer, surge arrester and earth grid has been created in PSCAD/EMTDC. Main focus has been put on the earth grid, which has been submodeled in details in MATLAB using an electromagnetic transient approach based on the thin-wire program made by J.H.Richmond in 1974 for NASA. The earth grid model is verified with excellent agreement compared to already published results. The overvoltage performance of the particular case is analyzed, and it is showed that the transformers LIWL have probably been exceeded. It is clearly illustrated that the transient performance of the earth grid plays an important role in the overall overvoltage protection system design. Index Terms—Earth grid design, transient behaviour, overvoltage protection, PSCAD/EMTDC, MATLAB, LIWL, dynamic resistance, overvoltage protection simulation I. INTRODUCTION On the 18 th of June 2002 a heavy thunderstorm swept over North-Jutland in Denmark resulting in a serious fault in Energinet.dk’s 400/150 kV transformer placed at the Nordjyllandsværket 400 kV transformer station (NVV5). According to Energinet.dk, the fault was caused by a lightning transient on the 150 kV transmission grid. Apparently the transient lightning voltage exceeded the LIWL of the transformer. Contact Address: Asc. Prof. Claus Leth Bak Institute of Energy Technology Aalborg University Pontoppidanstraede 101 DK-9220 Aalborg East, Denmark E-mail: [email protected]Fig. 1 illustrates the record breaking amount of lightnings over Denmark on the day of the damage, the 18 th of June 2002. Fig. 1. The intensity of lightnings over Denmark on the 18 th of June 2002 This incident has caused speculations within Energinet.dk about the effectiveness of the lightning protection of the transformers now used at Energinet.dk’s power stations. The possibility of this happening again to any of the other power transformers in Eltra’s possession is likewise of major concern. The main concern of the project is to make a simulation model of that part of the substation which surrounds the transformer, see Fig. 2, and to simulate a double exponential lightning impulse current directly on a phase line, which will propagate towards the transformer in the form of a travelling wave. The main emphasis will be put on investigating the overvoltage distribution in the system with respect to the LIWL of the transformer and to simulate the components that are most likely to have caused the exceeding of the LIWL and thereby the damage of the transformer. These are the 150 kV surge arresters, the earth grid with respect to GPR and the transformer itself. The 150 kV overhead line between Overvoltage Protection of Large Power Transformers – a real life study case Claus Leth Bak, Institute of Energy Technology, Aalborg University, Denmark, Wojciech Wiechowski, Institute of Energy Technology, Aalborg University, Denmark, Kristin E. Einarsdottir, Rafhönnun, Iceland, Einar Andresson, RTS Electrical Engineering Consultants, Iceland, Jesper M. Rasmussen, AKE, Denmark, Jan Lykkegaard, Energinet.dk (TSO), Denmark -649- V-5 28th International Conference on Lightning Protection
Transcript
1
Abstract-- This paper demonstrates the results from a
detailed study of the overvoltage protection of a particular 400/150 kV 400 MVA power transformer. The work presented here is based on real-life power system substation design and data and initiated by Danish TSO Energinet.dk as a consequence of a serious transformer overvoltage damage. A simulation model for the entire system consisting of overhead line, transformer, surge arrester and earth grid has been created in PSCAD/EMTDC. Main focus has been put on the earth grid, which has been submodeled in details in MATLAB using an electromagnetic transient approach based on the thin-wire program made by J.H.Richmond in 1974 for NASA. The earth grid model is verified with excellent agreement compared to already published results. The overvoltage performance of the particular case is analyzed, and it is showed that the transformers LIWL have probably been exceeded. It is clearly illustrated that the transient performance of the earth grid plays an important role in the overall overvoltage protection system design.
I. INTRODUCTION On the 18th of June 2002 a heavy thunderstorm swept over North-Jutland in Denmark resulting in a serious fault in Energinet.dk’s 400/150 kV transformer placed at the Nordjyllandsværket 400 kV transformer station (NVV5). According to Energinet.dk, the fault was caused by a lightning transient on the 150 kV transmission grid. Apparently the transient lightning voltage exceeded the LIWL of the transformer. Contact Address:
Asc. Prof. Claus Leth Bak Institute of Energy Technology Aalborg University Pontoppidanstraede 101 DK-9220 Aalborg East, Denmark E-mail: [email protected]
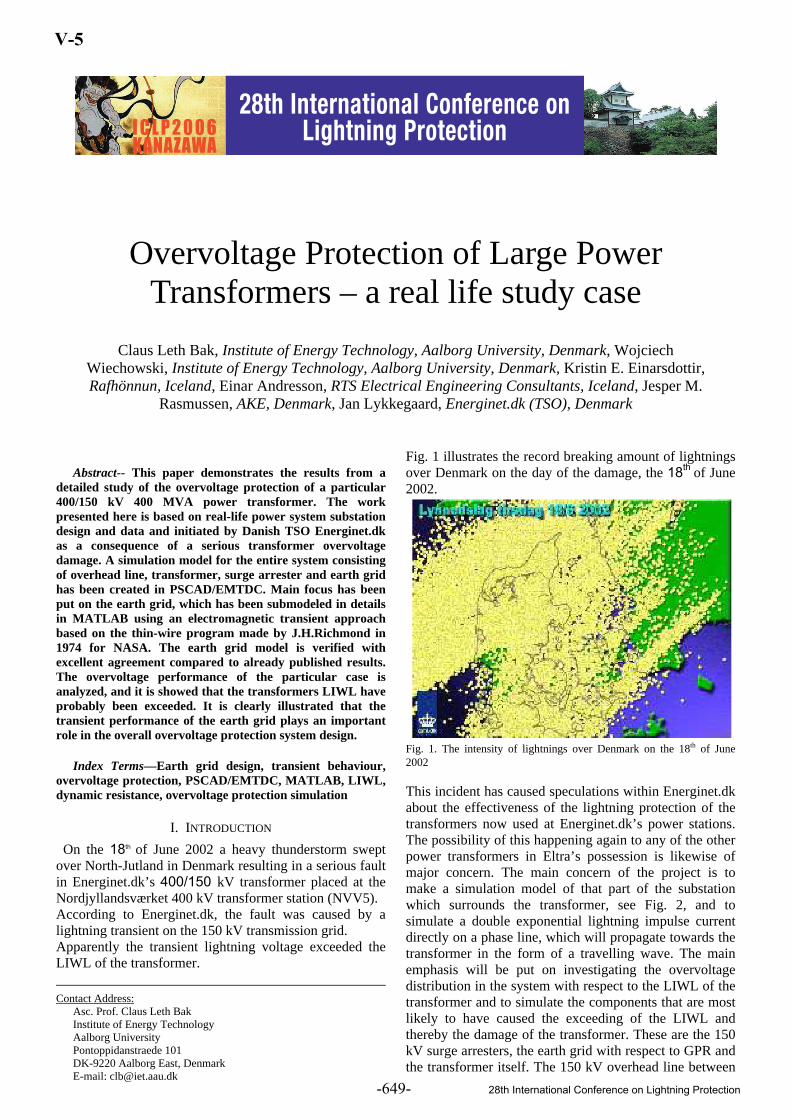
Fig. 1 illustrates the record breaking amount of lightnings over Denmark on the day of the damage, the 18th
of June 2002.
Fig. 1. The intensity of lightnings over Denmark on the 18th of June 2002 This incident has caused speculations within Energinet.dk about the effectiveness of the lightning protection of the transformers now used at Energinet.dk’s power stations. The possibility of this happening again to any of the other power transformers in Eltra’s possession is likewise of major concern. The main concern of the project is to make a simulation model of that part of the substation which surrounds the transformer, see Fig. 2, and to simulate a double exponential lightning impulse current directly on a phase line, which will propagate towards the transformer in the form of a travelling wave. The main emphasis will be put on investigating the overvoltage distribution in the system with respect to the LIWL of the transformer and to simulate the components that are most likely to have caused the exceeding of the LIWL and thereby the damage of the transformer. These are the 150 kV surge arresters, the earth grid with respect to GPR and the transformer itself. The 150 kV overhead line between
Overvoltage Protection of Large Power Transformers – a real life study case
Claus Leth Bak, Institute of Energy Technology, Aalborg University, Denmark, Wojciech Wiechowski, Institute of Energy Technology, Aalborg University, Denmark, Kristin E. Einarsdottir, Rafhönnun, Iceland, Einar Andresson, RTS Electrical Engineering Consultants, Iceland, Jesper M.
Rasmussen, AKE, Denmark, Jan Lykkegaard, Energinet.dk (TSO), Denmark
-649-
V-5
28th International Conference on Lightning Protection
2
the 150 kV substation, NVV3, and the 400 kV substation, NVV5, is included in the simulation. The results will then be used to determine a possible weakness in the overall overvoltage protection design.
Fig. 2. Overview of the system, with the overhead line, the surge arrester, the transformer and the earth grid This paper presents a description of the real-life power system with sufficient details to be able to study the overvoltage protection of the power transformer in details and a description of the transformer damage. A number of causes capable of resulting in such a damage is listed and a hypothesis is postulated. Hypothesis: The transformer was not adequately protected at the 150 kV side, so the LIWL was exceeded. The action of this hypothesis was to model the system (fig. 2.) in such details that a realistic simulation of the overvoltage protection behaviour could be performed and in this way spread some light on the possible cause of the transformer damage. The simulation model is used further to analyze possible improvements of the overvoltage protection, mainly regarding the design of the earth grid. This will be presented in another paper.
II. SYSTEM DESCRIPTION
A. The substation The damaged power transformer is located at a normal outdoor switchyard with proper shielding of both 150 and 400 kV overhead line connections plus grounding systems and rods at the entire substation area. Fig. 3. shows a photograph of the transformer location at the substation.
Fig. 3. A photograph of the 400/150 kV power transformer and its nearest surroundings
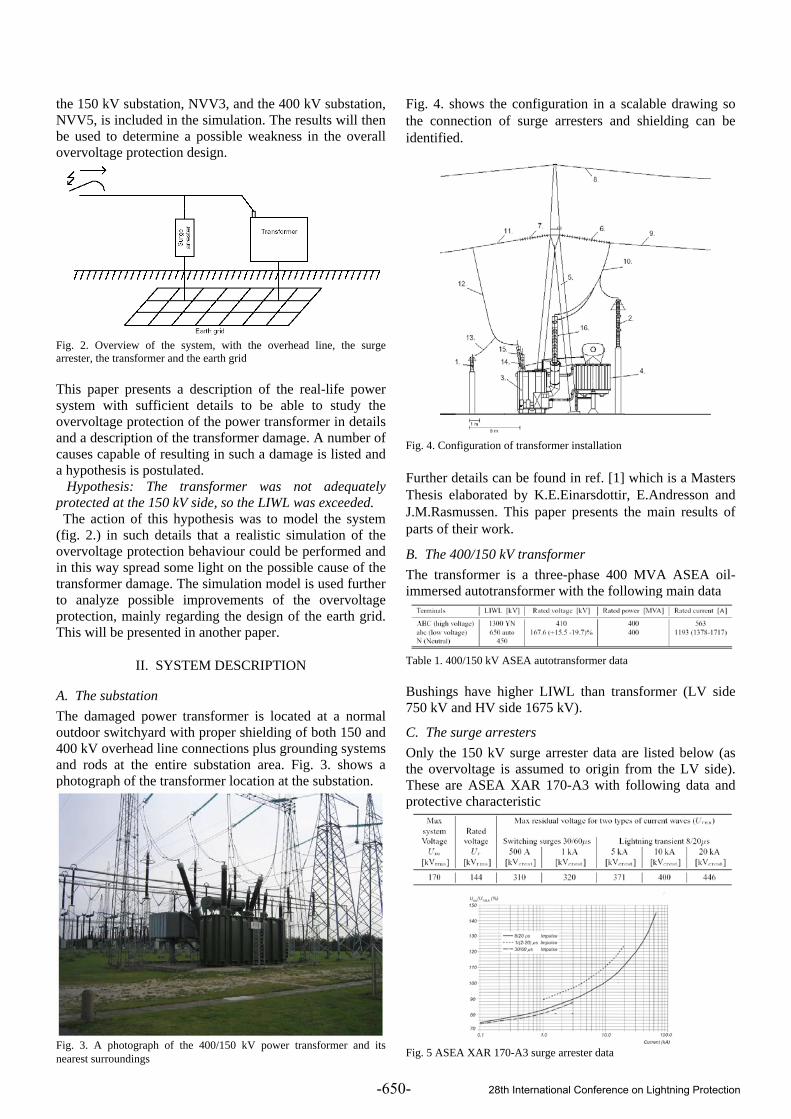
Fig. 4. shows the configuration in a scalable drawing so the connection of surge arresters and shielding can be identified.
Fig. 4. Configuration of transformer installation Further details can be found in ref. [1] which is a Masters Thesis elaborated by K.E.Einarsdottir, E.Andresson and J.M.Rasmussen. This paper presents the main results of parts of their work.
B. The 400/150 kV transformer The transformer is a three-phase 400 MVA ASEA oil-immersed autotransformer with the following main data
Table 1. 400/150 kV ASEA autotransformer data Bushings have higher LIWL than transformer (LV side 750 kV and HV side 1675 kV).
C. The surge arresters Only the 150 kV surge arrester data are listed below (as the overvoltage is assumed to origin from the LV side). These are ASEA XAR 170-A3 with following data and protective characteristic
Fig. 5 ASEA XAR 170-A3 surge arrester data
-650- 28th International Conference on Lightning Protection
3
D. The earth grid The surge arresters are connected to the same earth system as the power transformer, although no direct connection between surge arrester ground terminal and transformer exists, which is recommended in certain literature, i.e. [2] and transformer manufacturer ABB. The earth grid is a slightly irregular meshed grid of approximately 140 x 135 m or about 19000 m2 in size. It is made of 95 mm2 bare stranded copper wires and is buried at a depth of approximately 1 m. Earth rods are located at the periphery of the earth grid at 8 - 42 m distance from each other. These are of the type Elpress, each consisting of a 6 m long steel pipe and a 95 mm2 copper wire and located at minimum 1 m from each foundation as required by the IEC-1024-1 standard [3]. Fig.6 shows that the transformer and the surge arresters are positioned at the outskirts of the earth grid, with the 150 kV surge arresters located only eight meters from the periphery. The squares and irregular boxes are the equipment foundation blocks. All three surge arresters are interconnected forming a relatively large mesh size to the periphery of 21x7.5 m and a mesh size of 4x16 m towards the transformer. The surge arresters are connected to the transformer neutral point as may be seen in Fig. 6, with a conductor length of 15 m from the phase A surge arrester, grid depth included. No earth rods are located very close to the surge arresters.
Fig.6. Earth grid in the surrounding of the transformer. The 150 kV connection is towards the top of the figure. Figure scalable with coordinates shown to the left. Figure shows only part of earth grid. The transformer is mounted on support units over a well that will drain any oil spill from the transformer. According to Energinet.dk a gravel may have been used as a fill up material when mounting the transformer and the surge arresters. This gravel may therefore embrace the earth conductors between the transformer and the surge arresters. The dynamic behavior of the earth system with respect to lightning impulses is the main focus of this project and described in section III. The static resistance of the entire earth grid is calculated based on the Schwartz equation from IEEE-80 [4] and amounts to Rstatic = 0,375 Ω with a specific resistivity of the soil ρ = 100 Ωm
E. The transformer damage The lightning activity in Denmark on the 18th of June was very heavy. There were more than 110 thousand
lightnings over Denmark that day and over 10 thousand lightnings in an area with a radius of 50 km around the transformer substation. About 8500 positive and negative sky to earth lightnings were registered and 4-5% of these had an amplitude over 30 kA and nearly all were negative (99%). Some of these were located (taking accuracy of lightning detection system into consideration) very close to the overhead lines of the substation. Fig. 7. shows the damage after opening the transformer at the ABB factory.
Fig. 7. The damaged transformer, a) The three phases with the faulty phase furthest to the left. b) The faulty winding seen from the outside after various paper layers have been removed. The transformer winding connection (autotransformer) is shown in fig. 8, where it is seen that the fault occurred between two layers of the series winding.
Fig. 8. a) The electrical diagram showing where the fault has occurred and b) the fault occur between two layers in the series winding. After disassembling the transformer was repaired and put back into service after app. one year.
III. MODELLING AND SIMULATION In order to simulate the overvoltage amplitude at the transformer terminals, models are created of transformer,- surge arrester, earth grid and overhead line. These are combined in a model of the total system implemented in the PSCAD/EMTDC software together with a double-exponential lightning surge source. The models of each component will be discussed briefly in the following sections. Further explanations to the models, especially concerning the earth grid model, can be found in [1] and is intended to be the main topic of a future paper.
A. ASEA Autotransformer model The transformer must be modeled sufficiently to posses terminal properties, which reflects its high frequency behaviour sufficiently to achieve realistic results of overvoltage stresses. Normally [5], transformers are modeled as a single capacitance from line terminal to ground. More detailed models are normally used for studying the internal voltage distribution of the windings. This work uses an approach originally proposed by [6]
-651- 28th International Conference on Lightning Protection
4
which represents each phase winding as one single winding possessing capacitive, inductive and resistive behaviour as illustrated in figure 9.
Fig. 9. Transformer winding with one end grounded, l is the total length of the winding, x is the distance from the top of the winding to an arbitrary point in the winding and b) an equivalent electrical circuit of the winding [6] Depending on available transformer construction data and the need for a very precise model, the concept in fig. 9 can be less or more complex, i.e. the degree of “lumpedness” and the inclusion of self- and mutual (between parts of the winding) inductances and resistive damping. This work has used a combination of capacitances (originating from ABB data, see fig. 10) and resistances and inductances calculated on a simplified representation of the transformer geometry.
Fig. 10. Capacitance values for the autotransformer windings [ABB] The main purpose of extending the transformer model to include both inductance and resistance was chosen in order to be able to verify the high frequency terminal behaviour of the transformer, as this is very important for reliable results in the complete model. This was accomplished by implementing the model [1] in PSCAD and simulating the same situation as the transformer is tested against in the factory test. This is the Hagenguth test [7] pp. 165 which impresses reduced, full and chopped lightning impulse voltages to the transformer terminals and measures the ground return current to check for damages happened during the testing. The factory test was available for the present transformer and this approach was carried out with satisfactory results [1], which allowed the believing in a sufficient model of the transformer, although it is quite complicated to get results with more than just the main features (rise time, peak value and decaying) of the ground return current close to the actual test results. This model consists of 63 partial lumped capacitances, 26 lumped inductances (air core
assumed concerning high frequency behaviour) and 26 resistances for each phase.
B. ZnO surge arrester The non-linear surge arrester dynamics are modeled using the approach proposed by [8], which is a simplified model of the IEEE model with model parameters described as proposed in [9], [10]. Figure 11 shows the Fernandez approach.
Fig. 11. The model proposed by Fernandez L1 represents the inductance in the electric path through the ZnO blocks and is determined using the dimensions of the surge arrester. A0 and A1 represents the nonlinear resistivity of the ZnO blocks and can be estimated from the surge arrester residual voltage, see section II C C0 represents the terminal capacitance of the surge arrester. R is included to avoid numerical instability. The surge arrester model, see fig. 12., is verified against manufacturer residual voltage data and excellent agreement achieved (maximum 1,5 % error).
Fig. 12. Surge arrester model and double exponential test circuit in PSCAD.
C. Earth grid The purpose of making a model of the earth system is to calculate the voltage between the surge arrester ground terminal and the neutral point of the transformer, which results from a difference in GPR under the two components, when a lightning current surges through the surge arrester into the earth grid. An electromagnetic field approach is the best choice when the need for calculation of transient voltages between points of the earth grid is present [11]. The earth grid model is a transient electromagnetic program written in the C-based programming language of MATLAB. It is based on the thin wire structure program originally written in Fortran
-652- 28th International Conference on Lightning Protection
5
code by J. H. Richmond, [12], [13]. The model performs an electromagnetic analysis on wire structures in the complex frequency domain, based on closed form expressions and Simpson’s rule of integration for the solution of electromagnetic fields. Its function is to determine the electric near fields at the surface of the wire structure, due to the longitudinal current flowing in each section of the wire. The electric field calculation is then used to determine the dynamic impedance, both self and mutual, of the wire structure in order to determine the current distribution in the overall grid. The grid is divided into segments and the current distribution is approximated by defining every two segments as a dipole with a piecewizesinusoidal current distribution given with sinusoidal expansion functions, as it is very close to the natural current distribution on a perfectly conducting thin wire. A sinusoidal dipole is used as a test source, as this is probably the only finite line source with simple closed-form expressions for the near-zone fields, and the mutual impedances between two sinusoidal dipoles may be determined from exponential integrals [13], pp. 7. The thin wire approach has been used by L. Grcev et al. [14] [15] [16] [11] [17] to determine the electric fields in earth grids caused by lightning surge currents. L. Grcev refers to Richmond’s thin wire program in [15], pp.394, but he additionally includes image theory in his model to account for reflections due to interface of air and earth, as this is not included in Richmond’s program. L. Grcev also describes in his articles how to implement an injected current, also not included in Richmond’s program. As Richmond’s thin wire program was not specifically designed for calculating electromagnetic fields in earth grids, the program needed to be adapted to the problem presented in this report. All unnecessary functions to the presented problem have been eliminated from the program, which now has the main function of calculating antenna problems in a homogeneous conducting medium. Reflections of the electric field due to the interface of air and earth have been taken into consideration with the modified image theory, and to make injection of surge current possible, the modifications suggested by L. Grcev have been implemented in the program. Only the front time of the current wave is of interest as this provides the highest frequency and thereby the highest electric fields. All simulations are therefore made in the frequency domain, using the frequency corresponding to the desired current front time at each time, and a conversion of the current wave from the time-domain to the frequency domain by Fourier transforms is therefore not needed. The basic model (before implementing modified image theory and injection current) has been verified thoroughly with results presented in Richmond’s notes [12]. After implementation of modified image theory and the injection current, the model was verified by comparing results with the results presented in [15] with very good agreement. The following assumptions and limitations are made in the model of the earth grid: 1. The wire structure is made of straight cylindrical metallic conductors.
2. The wire is subject to the thin wire approximation, and the conductor radius is therefore assumed much smaller than the wavelength, with wire length much greater than the wire radius (At least 30 times greater [12], pp.12]). 3. Image theory is applied to compensate for the effects of a ground plane, i.e. the interface between air and earth is taken into consideration. This limits the frequency range of the model to a few megahertz [16] 4. The media of earth and air are assumed homogeneous with a horizontal ground plane boundary between them. 5. The current on wire ends is assumed to be zero. 6. For accuracy, the longest wire segment should not greatly exceed 1/4 wavelength, [13]. 7. Soil ionization is not taken into consideration. The MATLAB made program is called TEMP and details can be found in [1] and a future paper. Verification is performed against two situations: 1) 15 m long horizontal electrode According to [15] verification is carried out against a 15 m long horizontal electrode (fig. 13) buried at 1 m depth (soil resistivity 2000 Ω/m) with a wire radius of 0,007 m with energization by injecting time-harmonic currents of 1 A at three different frequencies; 50 Hz, 2,247 MHz and 6,741 MHz.
Fig. 13. A linear electrode energized at one of the ends. Results from TEMP is compared with results from Grcev [15], where the x-component of the electrical field is plotted along a path on the surface boundary and shown in fig. 14.
Fig. 14. Left: Red dots TEMP results compared to results from [Grcev(1)] and right: The results from TEMP shown as complete curve 2) 60 x 60 m earth grid Second verification is against a square grid, see fig. 15. according to [15]. The results from TEMP compared with results from [15] may be seen in fig 15. The X-component of the electric field is plotted along the profile X (see fig. 16) which is 40 m long (the profile is the black arrow in Fig. 16), and the voltage between the endpoints of the profile is plotted in the frequency domain. The voltage is determined by integrating the electric field along the profile X in Fig. 15. Verification 1 and 2 shows a good agreement, and so the TEMP program can be assumed useful for calculating the transient response of an earth grid.
-653- 28th International Conference on Lightning Protection
6
Fig. 15. A 60 x 60 m earth grid which is energized in a vertical segment in the middle. The voltage is measured between the origin and the end of the profile X.
Fig. 16. Upper two graphs are results from [grcev(1)] with comparison between TEMP (red dots) and Grcev results shown. Lower graph is TEMP field strength results to be compared with upper right graph from [15]
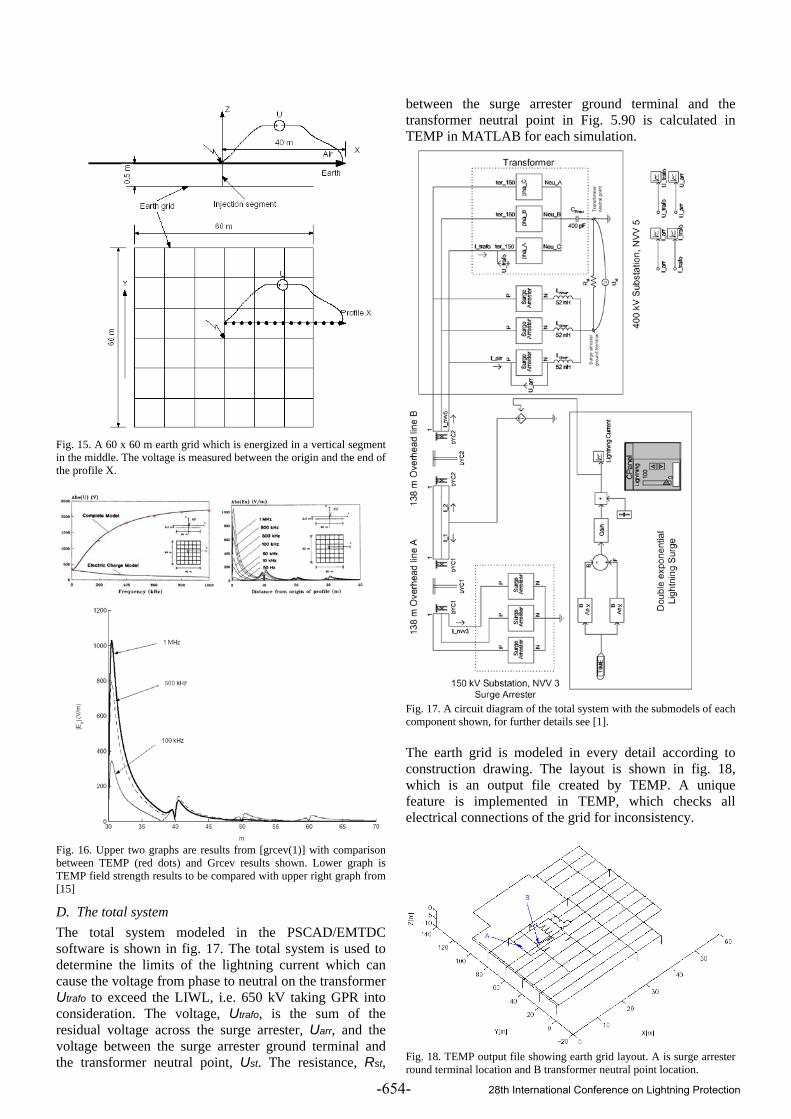
D. The total system The total system modeled in the PSCAD/EMTDC software is shown in fig. 17. The total system is used to determine the limits of the lightning current which can cause the voltage from phase to neutral on the transformer Utrafo to exceed the LIWL, i.e. 650 kV taking GPR into consideration. The voltage, Utrafo, is the sum of the residual voltage across the surge arrester, Uarr, and the voltage between the surge arrester ground terminal and the transformer neutral point, Ust. The resistance, Rst,
between the surge arrester ground terminal and the transformer neutral point in Fig. 5.90 is calculated in TEMP in MATLAB for each simulation.
Fig. 17. A circuit diagram of the total system with the submodels of each component shown, for further details see [1]. The earth grid is modeled in every detail according to construction drawing. The layout is shown in fig. 18, which is an output file created by TEMP. A unique feature is implemented in TEMP, which checks all electrical connections of the grid for inconsistency.
Fig. 18. TEMP output file showing earth grid layout. A is surge arrester round terminal location and B transformer neutral point location.
-654- 28th International Conference on Lightning Protection
7
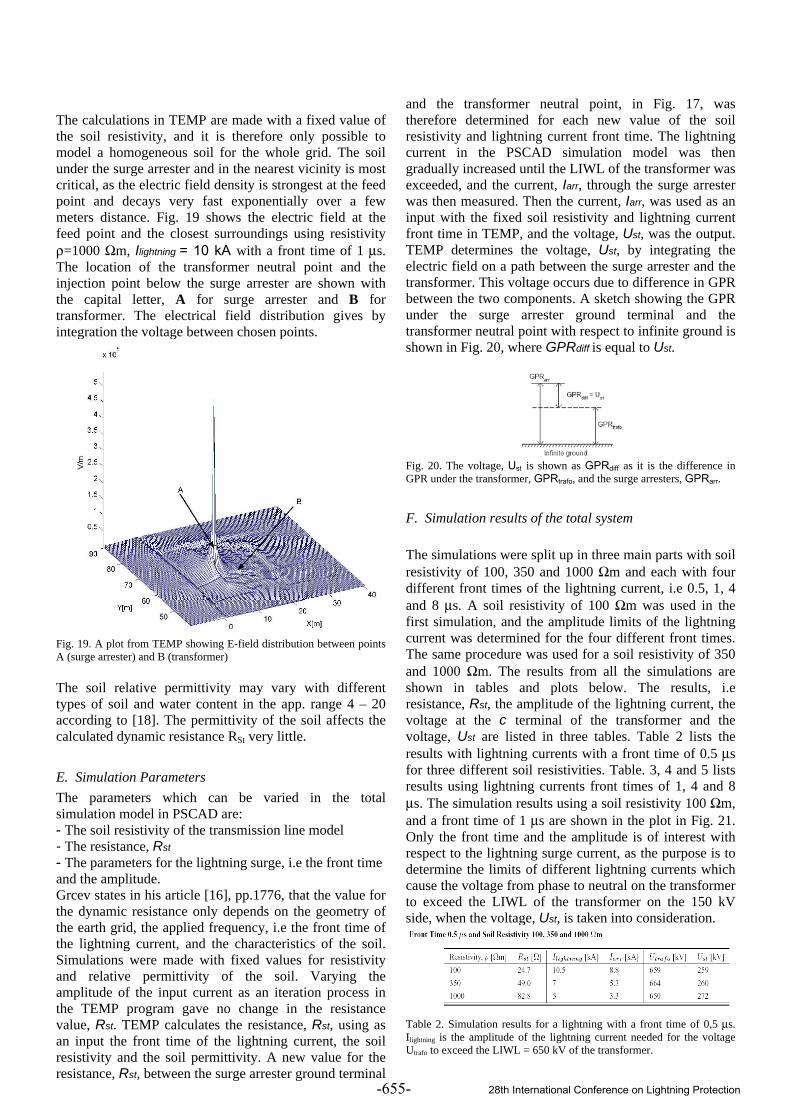
The calculations in TEMP are made with a fixed value of the soil resistivity, and it is therefore only possible to model a homogeneous soil for the whole grid. The soil under the surge arrester and in the nearest vicinity is most critical, as the electric field density is strongest at the feed point and decays very fast exponentially over a few meters distance. Fig. 19 shows the electric field at the feed point and the closest surroundings using resistivity ρ=1000 Ωm, Ilightning = 10 kA with a front time of 1 μs. The location of the transformer neutral point and the injection point below the surge arrester are shown with the capital letter, A for surge arrester and B for transformer. The electrical field distribution gives by integration the voltage between chosen points.
Fig. 19. A plot from TEMP showing E-field distribution between points A (surge arrester) and B (transformer) The soil relative permittivity may vary with different types of soil and water content in the app. range 4 – 20 according to [18]. The permittivity of the soil affects the calculated dynamic resistance RSt very little.
E. Simulation Parameters The parameters which can be varied in the total simulation model in PSCAD are: - The soil resistivity of the transmission line model - The resistance, Rst - The parameters for the lightning surge, i.e the front time and the amplitude. Grcev states in his article [16], pp.1776, that the value for the dynamic resistance only depends on the geometry of the earth grid, the applied frequency, i.e the front time of the lightning current, and the characteristics of the soil. Simulations were made with fixed values for resistivity and relative permittivity of the soil. Varying the amplitude of the input current as an iteration process in the TEMP program gave no change in the resistance value, Rst. TEMP calculates the resistance, Rst, using as an input the front time of the lightning current, the soil resistivity and the soil permittivity. A new value for the resistance, Rst, between the surge arrester ground terminal
and the transformer neutral point, in Fig. 17, was therefore determined for each new value of the soil resistivity and lightning current front time. The lightning current in the PSCAD simulation model was then gradually increased until the LIWL of the transformer was exceeded, and the current, Iarr, through the surge arrester was then measured. Then the current, Iarr, was used as an input with the fixed soil resistivity and lightning current front time in TEMP, and the voltage, Ust, was the output. TEMP determines the voltage, Ust, by integrating the electric field on a path between the surge arrester and the transformer. This voltage occurs due to difference in GPR between the two components. A sketch showing the GPR under the surge arrester ground terminal and the transformer neutral point with respect to infinite ground is shown in Fig. 20, where GPRdiff is equal to Ust.
Fig. 20. The voltage, Ust is shown as GPRdiff as it is the difference in GPR under the transformer, GPRtrafo, and the surge arresters, GPRarr.
F. Simulation results of the total system The simulations were split up in three main parts with soil resistivity of 100, 350 and 1000 Ωm and each with four different front times of the lightning current, i.e 0.5, 1, 4 and 8 μs. A soil resistivity of 100 Ωm was used in the first simulation, and the amplitude limits of the lightning current was determined for the four different front times. The same procedure was used for a soil resistivity of 350 and 1000 Ωm. The results from all the simulations are shown in tables and plots below. The results, i.e resistance, Rst, the amplitude of the lightning current, the voltage at the c terminal of the transformer and the voltage, Ust are listed in three tables. Table 2 lists the results with lightning currents with a front time of 0.5 μs for three different soil resistivities. Table. 3, 4 and 5 lists results using lightning currents front times of 1, 4 and 8 μs. The simulation results using a soil resistivity 100 Ωm, and a front time of 1 μs are shown in the plot in Fig. 21. Only the front time and the amplitude is of interest with respect to the lightning surge current, as the purpose is to determine the limits of different lightning currents which cause the voltage from phase to neutral on the transformer to exceed the LIWL of the transformer on the 150 kV side, when the voltage, Ust, is taken into consideration.
Table 2. Simulation results for a lightning with a front time of 0,5 μs. Ilightning is the amplitude of the lightning current needed for the voltage Utrafo to exceed the LIWL = 650 kV of the transformer.
-655- 28th International Conference on Lightning Protection
8
Table 3. Simulation results for a lightning with a front time of 1,0 μs. Ilightning is the amplitude of the lightning current needed for the voltage Utrafo to exceed the LIWL = 650 kV of the transformer.
Table 4. Simulation results for a lightning with a front time of 4,0 μs. Ilightning is the amplitude of the lightning current needed for the voltage Utrafo to exceed the LIWL = 650 kV of the transformer.
Table 5. Simulation results for a lightning with a front time of 8,0 μs. Ilightning is the amplitude of the lightning current needed for the voltage Utrafo to exceed the LIWL = 650 kV of the transformer.
Fig. 21. The simulation with a soil resistivity of 100 Ωm, relative soil permittivity of 10, and a front time of 1 μs. The resistance, Rst, was calculated in TEMP from the parameters of the soil and the front time. Upper: The voltage, Utrafo, at terminal c of the transformer and the voltage, Uarr, over the surge arrester. Lower: The current, Iarr, through the surge arrester and the current, Itrafo, at terminal c of the transformer. The simulation results of the total system showed that the resistance, Rst, between the surge arrester ground terminal and the transformer neutral point increases with higher soil resistivity and faster front times of the lightning current. A slower front time of the lighting increases the maximum limit of the lightning current. The two plots in Fig. 22 show the voltage from phase to neutral of the transformer as a function of the lightning current with a variation of the soil resistivity and lightning current front time. If the main part of the soil under the transformer and the surge arrester consists of gravel instead of loam (from the construction work) the soil resistivity will be higher and thereby cause higher voltage, Ust. The lightnings
registered by DEFU (Danish Electricity Research Counsil) on July 18th were divided into four main categories, see Table 6. Thereby the front times of the registered lightnings correspond to the front times 0.5, 1, 4 and 8 μs from Table. 2, 3, 4 and 5.
Fig. 22. The plots show the amplitude of the lightning current Ilightning which will cause the voltage Utrafo to exceed its LIWL, when different values of the soil resistivity and front times were used. Table 6 shows a categorization of the lightnings registered on the day of the transformer fault.
Table 6. The registered lightnings at the day of the damage were categorized into four groups, which were used in the simulations. As may be seen the lightnings with a front time of under 1 μs are not likely to have caused the voltage from phase to neutral on the transformer to exceed it’s LIWL, as they are characterized with a low amplitude. A lightning with a front time larger than 1 μs is therefore more likely to exceed the limits in Table 3, 4 or 5 due to the higher amplitude. The front time of the lightnings, which were registered in the area around the NVV5 substation, is between 1-5 μs and had amplitudes up to 25 kA. The worst case amplitude of the lightning current was only 5 kA, see Fig. 22, which was with a front time of 0.5 μs and a soil resistivity of 1000 Ωm. This corresponds to burying the grid wires in gravel, which according to Energinet.dk, may have been the case. Reducing the soil resistivity down to 100 Ωm, keeping the same front time yielded 10.5 kA in lightning current which is over a 100 % increase in tolerated lightning current. The lightning current amplitude was 7.5 kA for 1 μs and a soil resistivity of 1000 Ωm. The tolerated lightning current went up with higher front times up to 61.5 kA for a front time of 8 μs and a soil resistivity of 100 Ωm. The simulations clearly showed that front times and soil resistivity have an immense influence on the amplitude of the tolerated lightning current which causes the voltage
-656- 28th International Conference on Lightning Protection
9
from phase to neutral on the transformer to exceed it’s LIWL of 650 kV. In the worst case (see table 2 with ρ = 1000 Ωm) 272 kV out of 650 kV (i.e. with USt = 0 the voltage at the transformer would have had the safe value of 378 kV) originates from the earth grid. In other words; when designing overvoltage protection systems it will be of great importance to include some margin to the LIWL in order to be sure that the LIWL is not exceeded because of bad earth grid dynamic performance.
IV. CONCLUSIONS This paper has shown the analysis of an overvoltage protection scheme based on a real-life 400/150 kV power transformer lightning overvoltage damage. The damage to the transformer initiated the speculation, whether todays overvoltage protection design was adequate or the transformer damage could be caused by inherent weaknesses in the overall design. Main focus was laid on the dynamic behaviour of the earth grid as this acts as the most “unknown” factor of the overvoltage protection system. The system consisting of overhead line, surge arrester, transformer and earth grid has been modelled in PSCAD/EMTDC. The earth grid model is based on the electromagnetic thin-wire approach and implemented in MATLAB, which calculates the dynamic resistance, which in turn is used in an iterative manner in the simulation model of the total system. Simulations shows that the transient performance of the earth grid plays a major role concerning the amplitude of the transformer terminal overvoltage. This can for lightnings with a steep front and/or high soil resistivity give rise to overvoltages with a magnitude of 50-70 % higher than when not considering the dynamic resistance of the earth grid. Such overvoltages might exceed the designed insulation coordination margin and thereby harm the power system equipment. Further work includes the design (layout) of the earth grid, in such a way that its contribution to the voltage stress of a surge arrester protected component is minimized. This will be presented in a future paper.
V. ACKNOWLEDGEMENT The Authors wish to gratefully acknowledge the long ongoing, valuable cooperation with Danish TSO Energinet.dk.
VI. REFERENCES [1] Kristin Erla Einarsdóttir, Einar Andresson, Jesper Møller
Rasmussen and Claus Leth Bak (supervisor), Masters Thesis “Overvoltage Protection of Large Power Transformers Taking the Transient Electromagnetic Behaviour of the Earth Grid into Consideration”, Institute of Energy Technology, Aalborg University, June 2004.
[2] Olav Vaag Thorsen og Magnus Dalva, “Høyspenningsteknik”, 3rd edition, Universitetsforlaget, 1993.
[3] IEC-1024-1, ”Protection of Structures against Lightning, Part 1”, Publication IEC-1024-1, IEC, 1st edition, 1990.
[4] IEEE-80, “IEEE Guide for Safety in AC Substation Grounding”, 1st edition, 2000.
[5] Dennis Wood, “Introduction to PSCAD v3”, Manitoba HVDC Research Cener Inc., 1.4 edition, 2001.
[6] J.R.Biswas and C.K.Roy, “Studies on impulse Behaviour of a Transformer Winding with Simulated Faults by Analogue Modelling”, URL http://ieeexplore.ieee.org, 1992
[7] Dieter Kind, “Einführung in die Hochspannungs_Versuchstechnik”, Friedr. Vieweg + Sohn Gmbh Verlag, Braunschweig, 1st edition, 1972.
[8] F.Fernández and R. Diaz, “Metal-Oxide Surge Arrester Model for Fast Transient Simulatons,URL http://www.herrera.unt.edu.ar/alta-tension/publicationes/Paper1vf.pdf, 16.12.2003.
[9] M. Gianettoni and P. Pinceti, A Simplified Model for Zinc Oxide Surge arresters, URL http://ieeexplore.ieee.org, 1998.
[10] A.A.Beznosov, K.P.Kadomskaya & E.A.Borisov, Mathematical Models of Metal-Oxide Surge Arresters and Estimation of their Effect on Calculated value of Limited Overvoltages, URL http://ieeexplore.ieee.org, 2002.
[11] Leonid Grcev, Computer Analysis of Transient Voltages in Large Grounding Systems, URL http://ieeexplore.ieee.org, 1996.
[12] J.H.Richmond, Computer Program for Thin-wire Structures in a homogeneous conducting medium, URL http://ieeexplore.ieee.org, 1974.
[13] J.H.Richmond, Radiation and Scattering by Thin-wire Structures in a homogeneous conducting medium, URL http://ieeexplore.ieee.org, 1974.
[14] Frank E. Menter & Leonid D. Grcev, Transient Electromagnetic Fields Near Large Earthing Systems, URL http://ieeexplore.ieee.org, 1996.
[15] Leonid Grcev, Computation of Transient Voltages Near Complex Grounding Systems Caused by Lightning Currents, URL http://ieeexplore.ieee.org, 1992.
[16] Farid Dawalibi & Leonid Grcev, An Electromagnetic Model for Transients in Grounding Systems, URL http://ieeexplore.ieee.org, 1990.
[17] Leonid Grcev, More Accurate Modelling of Earthing Systems Transient Behaviour, URL http://aub.dtv.dk, 1993.
[18] Third Demining Technologies Information Forum (DTIF) Workshop on Ground Penetrating Radar in Support of Humanitarian Demining, URL http://www.maic.jmu.edu/ dtif/ conferences/Ispra2/papers.html, 2004.
-657- 28th International Conference on Lightning Protection