Page 1
Ownership Concentration, Asymmetric Information, and the
Positive Announcement Effect of New Equity Placements
Xueping WU*
Department of Economics and Finance, City University of Hong KongTat Chee Avenue 83, Kowloon, Hong KongTel: (852) 2788 7577; Fax: (852) 2788 8806
email: [email protected]
Zheng WANG
Tel: (852) 2788 7059; Fax: (852) 2788 8806email: [email protected]
This version: March 15, 2002
* Corresponding author. Both authors are from the Department of Economics and Finance of City University of
Hong Kong. We wish to thank Espen Eckbo, Ned Elton, Lawrence Khoo and Sheridan Titman for helpful
discussions and comments on an earlier version of the draft. WU gratefully acknowledges financial support from the
City University of Hong Kong (DAG project No. 7100183).
Page 2
Ownership Concentration, Asymmetric Information, and the
Positive Announcement Effect of New Equity Placements
Abstract
The existing literature has shown that new equity financing can have a positive announcement effect
(especially in private placements). The two widely cited explanations are Wruck's (1989) ownership
concentration changes hypothesis and Hertzel and Smith's (1993) asymmetric information mitigation
hypothesis. However, these two hypotheses are premised on a debatable idea that private investors play
an active, value-enhancing role through new equity purchases (as challenged by Barclay, Holderness and
Sheehan 2001). Further questioning the validity of these hypotheses, this paper shows that both the
hypotheses are based on results obtained from using an unusual measure of announcement return that
biases the related tests in favor of these hypotheses. Using a standard return measure and a unique Hong
Kong data set that can isolate the factors that underlie the two hypotheses, we find no evidence for these
two hypotheses. A more interesting and important finding is that positive announcement returns of equity
placements (including some non-private placements) reflect an endogenously determined information
effect, consistent with a generalized Myers-Majluf model.
Key Words: Equity Placement, Announcement Effect, Ownership Structure, Asymmetric Information,
Investment Opportunities
JEL Classification Code: G14, G32
Page 3
2
Ownership Concentration, Asymmetric Information, and the Positive Announcement
Effect of Seasoned Equity Placements
1. Introduction
The existing finance literature has shown that new equity financing can have a positive announcement
effect (especially in private placements). A great deal of theoretical and empirical analysis has been
devoted to understanding the phenomenon. It has been a tradition to view private placements differently
from ordinary placements. In ordinary placements, both existing and new investors are deemed to be
passive and the adverse-selection effect of equity financing becomes a well-known result (Myers and
Majluf 1984). In contrast, in private placements, new equity sales may enable investors participating in
new equity purchases (or private investors) to play an active, organizational or informational role. Two
hypotheses, changes in ownership concentration (Wruck 1989) and mitigation of asymmetric information
(Hertzel and Smith, 1993), have become well-cited explanations for the positive announcement effect of
private placements. Both the hypotheses are premised on the idea that the active role of private investors
can be value enhancing.
Wruck (1989) finds that the announcement returns are related to changes in ownership
concentration, consistent with the non-linear relationship between firm value and ownership structure
suggested by Morck, Shleifer and Vishny (1988). Wruck argues that new equity blocks placed cause
substantially changes in ownership concentration, thus creating a monitoring effect or a management
entrenchment effect.
Using the same definition for announcement returns as introduced by Wruck (1989), Hertzel and
Smith (1993) find that the announcement returns are related to placement price discounts and new block
sizes (or fraction placed). They argue that price discounts reflect information costs that the new investors
Page 4
3
incur in private placement. As a result, the gain of firm value should be related to fraction placed (a
proxy for the amount of valuation uncertainties to be mitigated). They hypothesize that in private
placement new blockholders play a role mitigating asymmetric information, or creating a certification
effect.
In this paper, we start with showing that both the above hypotheses are based on results obtained
from using an unusual measure of announcement return and are questionable. The announcement return
measure concerned (introduced by Wruck and also adopted by Hertzel and Smith) is the sum of a
standard announcement return measure plus an additional term that includes the exclusive compensations
to new blockholders.1 This introduces a problem: the measure they use obviously has a built-in
relationship to ownership concentration changes (as in Wruck 1989) and more directly to fraction placed
(as in Hertzel and Smith 1993), two explanatory variables used in the empirical tests of the above two
hypotheses, respectively. As a result, their tests are biased in favor of their respective hypotheses.
1 Wruck (1989) claims that this new return measure is originated from Bradley and Wakeman (1983) who conduct an
event study of stock repurchases. The return measure is defined as the change in firm value due to the valuation
effect of a corporate event divided by the pre-announcement firm value. But Wruck seems to ignore a key difference
between new equity issues and stock repurchases. Unlike in stock repurchases, there are usually new investors
created in new equity issues. While this return measure means correctly the return to old shareholders (both
participating and non-participating) in Bradley and Wakeman (1983), it is neither an appropriate measure of the
return to old shareholders nor the return to both old and new shareholders in new equity issues. Besides, Bradley and
Wakeman only use the return measure that Wruck refers to in the wealth transfer analysis. After all, in their cross-
sectional analysis of announcement effects, Bradley and Wakeman follow the literature to employ a standard
measure of announcement return to non-participating shareholders.
Page 5
4
Once it is recognized that private investors may not necessarily have a value-enhancing role, it
will become more convincing that there is no monitoring or certification effect in private placements.
This seems to be the case. Barclay, Holderness and Sheehan (2001) have already cast doubt on the above
two hypotheses. Using U.S. data, they find that new blockholders are usually not active in association
with private placement (a situation deemed more likely to occur with non-private placements). Thus, the
positive announcement effect of seasoned equity placements remains largely unexplained.
The main purpose of the paper is twofold. First, we add further evidence to the literature that the
monitoring or certification effect is absent in private placements. Second, we shed new light on the
determinants of the positive announcement effect of new equity placements that include some non-
private placements.
To these ends, we make use of a unique data set from Hong Kong. The major form of seasoned
equity offerings (SEOs) in Hong Kong is placements. Placements, both private and non-private (or
ordinary), are typically “firm commitment underwritten” offers through investment banks or brokerage
firms to new investors, who have no connections to corporate insiders of the issuers. In addition, the
concentration of controlling ownership in Hong Kong is notably high, with an average controlling
ownership of about 40 percent. In our sample, new equity placed is on average more than 10 percent of
existing shares outstanding. As a result, a new equity issue to non-existing shareholders causes a
substantial change in the concentration of controlling ownership in private as well as ordinary
placements.
These unique characteristics of the Hong Kong data provide us an opportunity to examine any
potential relationship between announcement effects of new equity issues and ownership concentration
changes, not only in private placements but also in non-private placements. The direct comparison
between our private and non-private placements can help isolate and test the monitoring effect. Unlike
Page 6
5
ordinary placements, private placements usually generate new substantial (block) shareholders. If new
blockholders are active investors, this creates a monitoring effect (Wruck 1989). However, we will show
that ordinary placements (where the monitoring effect is apparently absent) can also have, on average, a
positive announcement effect. This suggests that factor(s) other than the monitoring effect is causing the
positive announcement effect.
Our results are rich and interesting. We leave an overview to the conclusion of this paper. For the
moment, two main points should be highlighted. First, we find positive announcement effects in both
private and non-private placements in Hong Kong. Interestingly, we do not find significant difference in
announcement effects between these two samples. A positive announcement effect in ordinary placement
is inconsistent with the Myers and Majluf (1984) model. However, there is a literature that allows for
positive announcement effects in ordinary equity placement (see Ambarish, John and Williams, 1987;
Cooney and Kalay, 1993; Wu and Wang, 2001).2
Second, using an announcement return measure common in the event studies literature, we find
no evidence of either a monitoring or a certification effect in private placement. Instead, we find that
positive announcement returns in both private and non-private placements simply reflect an
endogenously determined information effect, consistent with the generalized Myers-Majluf framework of
Wu and Wang (2001). An endogenous-determined information effect is purely related to information
asymmetries regarding assets-in-place and new investments. These information asymmetries create an
effect conditional on the news to the market that contains no new information except about the equity
2 For example, Cooney and Kalay (1993) and Wu and Wang (2001) suggest that the Myers-Majluf model can be
generalized to predict positive as well as negative announcement effects of seasoned equity issues. See the literature
review in Section 2.
Page 7
6
placement itself. This effect is fundamentally different from an exogenously driven information effect:
for example, the certification effect that requires an additional assumption that the active, informational
involvement of new investors is value enhancing.
To the extent that an endogenously determined information effect produces positive
announcement returns in SEOs, the understanding of a generalized Myers-Majluf framework is
important. The Myers-Majluf model has been generalized to be consistent with both positive and
negative announcement effects (Cooney and Kalay, 1993; Wu and Wang, 2001). By introducing private
benefits of control into managers/controlling shareholders' wealth objective function, Wu and Wang
(2001) show that it is incentive compatible for managers to undertake negative net present value (NPV)
projects. Unlike the original Myers-Majluf model, the generalized Myers-Majluf model allows the
market to assign positive probabilities to both future underinvestment and future overinvestment. As a
result, the pre-announcement equilibrium stock price is lower than that predicted by the original Myers-
Majluf model. Consequently, SEO announcement effects are likely to be positive if asymmetric
information arises more from new investments than from assets-in-place (see Cooney and Kalay, 1993;
Wu and Wang, 2001). In this situation, the adverse-selection effect can be overwhelmed by good news
about new investments (however, this never occurs in the original Myers-Majluf model).
The remainder of this paper is organized as follows. Section 2 surveys the literature. Section 3
describes the data and offers sample statistics. Section 4 discusses the validity of the announcement
return measure that Wruck (1989) introduces into the literature on private placements. Section 5 presents
the empirical evidence concerning SEO announcement effects using Hong Kong data. Section 6
examines the determinants of announcement effects. Section 7 concludes the paper.
2. The Positive Announcement Effect of SEOs: Hypotheses and Theories in the Literature
In this section, we review major models and hypotheses concerning the positive announcement
Page 8
7
effect of seasoned equity offerings (SEOs), along with related previous empirical studies. In the U.S.
market, the positive announcement effect, found largely in the case of private placements, has been
explained in the literature by two widely cited hypotheses: changes in ownership concentration and
mitigation of asymmetric information (Section 2.1). However, there are also other theories, such as those
that directly generalize the adverse-selection model of Myers and Majluf (1984), that can predict positive
announcement effects of SEOs (Section 2.2).
2.1 Hypotheses to Explain Positive Announcement Effect in Private Placement
The positive announcement effect of SEOs has been found especially in association with private equity
issues, where issuers are mostly small. The evidence is also international (e.g., Wruck, 1989 and Hertzel
and Smith, 1993, for the U.S.; Kato and Schallheim, 1993 and Kang and Stulz, 1996, for Japan;
Cronqvist and Nilsson, 2000, for Sweden). Since private placements are highly concentrated, and are
deemed to involve active new investors, it seems to be understandable that their positive announcement
effect may not fit into the adverse-selection framework of Myers and Majluf (1984).
The existing literature offers two widely cited hypotheses. First, Wruck (1989) argues that private
equity sales are usually highly concentrated. Therefore, insiders’ ownership structure is significantly
changed after the placement. By introducing and using a non-standard measure of announcement return,
Wruck finds a significant relationship between the announcement returns and ownership concentration
changes. In particular, the relationship shows that private sales that cause managers to be more aligned
with the interests of shareholders add value. Conversely, private sales that cause management
entrenchment or less interest-alignment with shareholders destroy value. Thus, new private equity sales
induce a nonlinear relationship between firm value and ownership, in line with the Morck, Schleifer and
Vishny (1988) hypothesis. From this evidence, Wruck concludes that the monitoring/entrenchment effect
can explain the positive announcement effect of private equity placements.
Hertzel and Smith (1993) provide a second alternative hypothesis. They argue that private equity
Page 9
8
placements are a solution to the Myers-Majluf adverse selection problem. They emphasize that private
investors are not organizational active but instead are informational active. Private equity sales tend to
reduce asymmetric information because managers can better communicate with a small number of private
investors. It follows that placement discounts must reflect compensations for information costs borne by
private investors. Using the same definition for announcement returns as introduced by Wruck (1989),
Hertzel and Smith find a significant relationship between the announcement returns and new block sizes
(or fraction placed). The larger the new investment (or fraction placed), the more difficult it is for the
private investors to value the uncertain investment, as they argue. Thus, they interpret that the above
relationship is consistent with a certification effect. The certification comes from the value-enhancing,
informational involvement of private investors, which is deemed to cause a positive shift in the market’s
assessment of the firm value of the issuers.
Both the above two hypotheses are premised on private investors' active involvement through
new equity purchases. However, Barclay, Holderness and Sheehan (2001) have recently challenged this
premise directly. Using a sample of the U.S. seasoned equity issues much larger than used in previous
studies, Barclay et al. find that private investors are actually not active. Thus, it is unlikely that private
investors fulfill a value-enhancing, organizational or informational role: as such, this finding casts doubt
on the monitoring and certification hypotheses.
2.2 Can Announcement Effects also be Positive in Non-Private Equity Issues?
Suppose investors behave passively in both private and non-private equity issues. There will be little
difference in the role that new investors play through the two forms of placements. However, unlike in
private equity issues, the announcement effects in non-private equity issues have been found to be
negative on average (especially in the U.S. market, see the surveys by Smith, 1986, and Eckbo and
Masulis, 1995). There are two major theories in the literature that explains the negative market reaction
to non-private equity issues: the underinvestment model of Myers and Majluf (1984) and the
Page 10
9
overinvesment-driven agency model of Stulz (1990) and Jung, Kim and Stulz (1996) (detailed in Section
2.2.1). However, these models do not adequately explain all phenomena observed. There are some
theories that are consistent with both positive and negative announcement effects. The multiple-signal
model of Ambarish, John and Williams (1987) allows the possibility of positive announcement effects in
new equity issues, and links positive (negative) announcement effects to overinvestments
(underinvestments) of the issuers (Section 2.2.2.) Also, direct extensions of the Myers-Majluf framework
can generate models with both positive and negative announcement effects (Section 2.2.3).
2.2.1 Models that Explain Negative Announcement Effects
There are two major models that explain negative SEO announcement effects. The first is the
underinvestment model of Myers and Majluf (1984). This model, built on the adverse-selection problem
of Akerlof (1970), produces two well-known predictions. First, firms may skip positive NPV projects if
they are forced to issue new equity for financing investment—hence creating a problem of
underinvestment. Second, the issuing firms’ stock prices always drop at the announcement of new issues.
In their model, Myers and Majluf make three major assumptions, that managers act in the interest of
existing (passive) shareholders, that managers accept only non-negative NPV projects, and that managers
know more than outside investors about both the value of assets-in-place and the NPV of investment
opportunities of their firms. Myers and Majluf argue that a new issue must signal an overvaluation of a
firm’s assets-in-place, because the managers would forego (positive) new investments if they knew that
the current stock price of their firm was undervalued.
The Myers-Majluf model does not imply that there is no good news signaled by new issues. But,
in the Myers-Majluf logic, since the market has always expected good investment opportunities, the
Page 11
10
decision to issue equity mainly signals an overvaluation of the firm’s assets-in-place—bad news that
overwhelms the good news that managers are able to undertake (already much expected) good projects.3
The literature has extended the Myers-Majluf model to predict that new issues cause smaller
drops in stock prices when there are smaller information asymmetries. Korajczyk, Lucas and McDonald
(1991) and Dierkens (1991) have found that smaller information asymmetries relieve negative
announcement effects.4 Choe, Masulis and Nanda (1993) have also found that the tide of new issues has
to do with business cycles. They show that announcement effects are significantly related to market
conditions, since adverse selection effects and investment opportunities naturally vary with market
conditions.
Apart from the Myers and Majluf (1984) underinvestment model, there is an alternative
explanation for negative SEO announcement effects. Stulz (1990) develops an agency model largely on
the market's concern about overinvestment. Jung, Kim and Stulz (1996) subsequently apply this model to
SEOs. In contrast to Myers and Majluf’s underinvestment argument, the agency model suggests that the
negative announcement effect of new issues signals that managers are likely to take on bad projects. It
3 It has been observed that there are significantly negative stock price responses to the announcement of SEOs,
particularly in the U.S. market (e.g., Asquith and Mullins, 1986; Masulis and Korwar, 1986, among others). In
survey papers, both Smith (1986) and Eckbo and Masulis (1995) document an average abnormal return of about –3.0
percent for U.S. industrial firms. This stylized evidence is consistent with the prediction by Myers and Majluf
(1984).
4 Since debt issues involve less adverse-selection than equity issues do, the findings that debt issues have virtually
no impact on stock prices are interpreted as being consistent with the Myers-Majluf model (e.g., Dann and
Mikkelson, 1984; Eckbo, 1986; Mikkelson and Parch, 1986). This also gives rise to Myers’ (1984) pecking order
model of financing, due to the difference in information costs of various forms of capital in the capital markets.
Page 12
11
has been recognized in the previous literature that the agency problem is an important concern for
investors. Managers have a potential desire to invest in self-interested projects (for example, corporate
empire building) rather than to maximize shareholder wealth. Thus, managerial discretion may give rise
to an agency problem that leads to overinvestment (Jensen, 1986). Firms with free cash flows potentially
allow managers to waste shareholders’ money—a situation more likely to occur in mature firms. Under
asymmetric information, when firms are forced to raise external funds for their new projects, it is
difficult for managers to convince the market that their projects are worthy of investment and are not a
waste of money (Stulz, 1990). Stulz argues that debt issues are more appropriate than equity issues for
firms with free cash flows because debt plays a disciplinary role on managerial discretion (see also
Jensen and Meckling, 1976; Jensen, 1986). Thus, the agency model predicts that the announcement
effects of new equity issues are negative when the issuing firms do not show much growth.
One might argue that firms with poor investment opportunities could also be financially
distressed and are simply not mature. Financially distressed firms are less likely to have nimble
managers. And the market is more likely to believe that less nimble managers will take on more negative
NPV projects. Jung, Kim and Stulz (1996) find evidence in support of the overinvestment driven agency
model. They show that firms with poor investment opportunities that otherwise should issue debt
experience an extremely significant drop in stock prices in response to their new equity issues. In
contrast, they find no adverse shocks in stock prices for issuing firms with more valuable investments.
2.2.2 Positive Announcement Effect and The Multiple-Signal Model
Is it possible for new equity issues to signal overwhelmingly good news? As noted above, the standard
Myers-Majluf model rules out this possibility. The overinvestment driven agency model concentrates
mainly on the adverse impact of the agency problem in the announcement effects of new equity issues.
Nevertheless, such a possibility has received formal academic attentions since the development of the
Page 13
12
multiple-signal model.
Building on the work of Miller and Rock (1985) and John and Williams (1985), the multiple-
signal model of Ambarish, John and Williams (1987) considers an efficient signaling equilibrium with
both dividends and new issues (investment). Their model predicts that paying dividends increases stock
prices. In addition, the announcement returns of new equity issues, given the dividend policy, are
negative if asymmetric information arises more from assets-in-place than from investment opportunities,
and are positive otherwise. Since there is an underlying coordination between the dividend and financing
policies, this model implies that there is a positive relationship between the announcement effects of new
issues and the dividend policy. However, empirical studies using U.S. firms have found little support for
such a coordinated relationship (Loderer and Mauer, 1992).
The most provocative prediction of the Ambarish-John-Williams model is the positive
relationship between announcement effects of new equity issues (which are likely to be positive) and
investment opportunities. Previous studies have found a significantly positive cross-sectional relationship
between announcement effects and firms’ investment opportunities. But the search for significantly
positive announcement effects is, on the whole, disappointing, even for high growth firms (see Pilotte,
1992; Denis, 1994).
2.2.3 Positive Announcement Effect and The Generalized Myers-Majluf Framework
The Myers-Majluf prediction that issuers’ stock prices always drop when new equity issues are
announced hinges crucially on one key assumption that managers only take on positive NPV projects (as
articulated by Cooney and Kalay, 1993). Cooney and Kalay argue that if managers can take on negative
NPV projects as well as positive ones, issuers’ stock prices may in some cases rise when new equity
issues are announced. The intuition is that, in the Myers-Majluf model, the anticipation of always-
Page 14
13
positive NPV projects has been rationally reflected in the firm’s pre-announcement stock prices, limiting
the information content in the positive news about new projects. In contrast, if managers are expected to
accept negative NPV projects as well, the pre-announcement stock prices, compared to the Myers and
Majluf case, are adjusted downward accordingly. Thus, the announcement of new issues may signal
overwhelmingly positive news about new investments. This is likely to happen when the asymmetric
information stems largely from investment opportunities (this is similar to the prediction of the
Ambarish-John-Williams model).
Cooney and Kalay, however, offer no strong rationale to explain why managers may be willing to
take on negative NPV projects. Myers and Majluf (1984) forcefully reject the idea that managers are
willing to take on bad projects, by arguing that managers would, ex post, put the raised capital into zero-
NPV investments (such as tradable securities) instead. Thus, investors could rationally expect that all
projects that managers undertake have non-negative NPVs. In short, the analysis in Cooney and Kalay
(1993) does not seem to be subgame perfect.5
To solve this incentive compatibility problem, Wu and Wang (2001) introduce private benefits of
control into the Myers-Majluf framework. When managers/controlling shareholders can derive private
benefits from new projects, they are willing to take on negative NPV projects if the private benefits
overwhelm the detrimental effects of the negative NPV investments on the manager/controlling
5 In addition, Cooney and Kalay still assume that managers maximize existing shareholders’ value as Myers and
Majluf (1984) do. Thus, the trade-off between the existing shareholders’ benefits and costs regarding managers’
undertaking bad projects is not defined. Consequently, because they consider all bad projects available, the market's
concern about overinvestment, which is incorporated in the pre-announcement prices, tends to be overstated in their
analysis.
Page 15
14
shareholders’ equity holdings. The Wu and Wang (2001) model reconciles the Myers-Myers
underivestment model and the overinvestment-driven agency model, and it also allows new equity issues
to have positive announcement effects.
Like the Ambarish-John-Williams model, the model of Wu and Wang (2001) shows that the
positive announcement returns are more likely to be related to relative uncertainties about investment
opportunities rather than to the expected growth per se. But the key difference between the two models is
that the model of Wu and Wang (2001) does not directly attribute the negative announcement effects of
new issues to underinvestment and the positive effects to overinvestment. The novel prediction of the
model is that the positive relationship between the announcement effects and investment opportunities
(or the expected NPV of a new project) is not monotonic. In particular, when the expected growth, given
asymmetric information, increases to a high level, the announcement effect decreases. The intuition for
this is that, if a new investment is so good that the new issue is almost inevitable, there will be little
information content in the new issue. Thus, it may be difficult to find positive announcement effects for
issuers with very high growth opportunities, something that the empirical literature has shown.
The measurement of the relative uncertainties about investment opportunities is critical to
empirical studies. Wu and Wang (2001) propose that firm size is a reasonable proxy for uncertainties
about growth, relative to those about assets-in-place, because the smaller an issuer’s firm size, the more
asymmetric information may come from growth rather than from assets-in-place. Using this assumption,
they come up with a testable prediction: the announcement effects are negatively related to firm size,
with smaller issuers being more likely to enjoy positive announcement effects of new equity issues.
Kang and Stulz (1996) come across this very relationship when they report a small (0.5 percent)
but significant average announcement return with a sample of 185 Japanese non-private equity issues.
However, they find it puzzling. Traditionally, it has been perceived in the literature that small firms are
Page 16
15
particularly fraught with asymmetric information. Therefore, the announcement of new issues should
cause a larger drop in small firms’ stock prices. Likewise, Fama and French (2002) view it perplexing
when they find that less-levered small-growth firms favor new equity issues. According to Myers’ (1984)
pecking order model, this should be the last resort in financing.
This puzzle can be resolved according to the Wu and Wang (2001) model. First, (outside) debt is
unlikely for small firms that usually have little collateral value and limited reputations. Second, if
asymmetric information stems more from positive investment opportunities than from assets-in-place—as
is likely for some small firms, asymmetric information may not necessarily be disadvantageous in new
equity issues.6 In this case, the adverse-selection effect may be overwhelmed by the good news about
new investment. The possibility for such a situation, however, is absent from the original framework of
Myers and Majluf (1984).
If the positive announcement effect of private placement does not come from the active,
organizational or informational role of new blockholders, it may well arise from the relative asymmetric
information about investment opportunities. This is an endogenously determined information effect,
since private equity issuers are usually small. By "endogenously determined" we mean that the new
6 But this does not mean that the new equity issues by small firms would become rampant. First, if issuers are
expected to have bad projects, announcement effects are likely to be negative (see the simulation results in Wu and
Wang, 2001). Second, if a very bad future investment is the inside information, a new equity issue can eventually
cause an adverse effect on managers/controlling shareholders’ equity ownership, thus making their private benefits
from the new investment not to pay. Third, the advantage of a small growth firm in subsequent new equity issues will
endogenously diminish as the small firm gets bigger after the current new issue. It is worth mentioning that the above
arguments are independent to the repeated-game argument by Ambarish, John and Williams (1987) to prevent
cheating.
Page 17
16
information conveyed by the announcement of a new issue is only that a new issue occurs. Model
parameters are kept constant from before to after the event. The equilibrium stock prices are adjusted
according to this new information in a way predetermined by the model. In contrast, hypotheses such as
the certification effect reflect an "exogenously determined" information effect. Such a hypothesis
requires, for example, an additional assumption that new investors play an active, informational role that
is value enhancing. This active role favorably revises the market assessment of the issuers' firm value.
The generalized Myers-Majluf framework hence has an important application. Private placements
can be treated the same way as ordinary equity issues in this framework. Since private and non-private
issues are pooled together, we will need to unify the measure of announcement returns in finding out the
determinants of the announcement effects. As mentioned above, the literature on private placement has
been using a non-standard measure, first introduced by Wruck (1989). In the next section, we argue that
the Wruck measure is not interpretable, and that no exception should be made for private placements,
regarding the measure of announcement returns. Put differently, the standard measure of announcement
returns should be used.
3. The Validity of Wruck’s (1989) Measure of Announcement Returns
In this section, we question the validity of Wruck’s (1989) measure of announcement returns when used
in a cross-sectional regression analysis of new equity placements (Section 3.1). We then show that this
measure causes a bias in favor of hypotheses in both Wruck (1989) and Hertzel and Smith (1993)
(Section 3.2).
Page 18
17
3.1 Announcement Returns to Whom?
Wruck (1989) introduces a new measure of announcement returns into the literature about private
placements.7 This measure departs from the standard measure of announcement returns commonly used
for ordinary seasoned equity offerings and other event studies.
Let P0 and P1 be the pre- and post-announcement stock price, Px the placement price, N the
shares outstanding before the placement (old shares), and ∆N the new shares placed. The equilibrium
price after the announcement is:
)NN/()NPVNPNP(P x01 ∆∆ +++= , (1)
where NPV is the market assessment on the change in firm value due to the valuation effect of the
placement. Apparently, NPV is shared by both the old and new shareholders. From (1), we simply have:
,N)PP(N)PP()NPNP()NN(PNPV
x101
x01
∆∆∆
−+−=+−+= (2)
where the first term in the second equation of (2) is the gain to old shareholders and the second term is
the benefit to new shareholders.
Wruck (1989) defines ARNPV, or NPV divided by P0N, as the measure of the return to old
shareholders due to the new information. Let AR =(P1-P0)/P0, the standard measure of the return to old
shareholders, and d=(P0-Px)/P0, the (positive) discount that new shareholders exclusively enjoy in the
placement. According to (2), Wruck’s definition is actually:
7 Wruck does use the standard measure to document announcement effects of private placements but switches to her
new measure when analyzing the cross-sections of the announcement returns.
Page 19
18
.NN)dAR(AR
NPN)PPPP(N)PP(AR
0
x00101NPV
∆
∆
++=
−+−+−=
(3)
It might be debatable whether the definition of (3) makes sense but it is questionable enough
when we call it, as Wruck does, the return to old shareholders while the return apparently includes the
exclusive compensations to new shareholders in the placement. At least, one would be confused under
the definition of (3) when asking the question: Which objective, old shareholders wealth alone or old and
new shareholders combined wealth, is on the mind of the managers?
Wruck (1989) claims that ARNPV originates from the one used in the analysis of targeted shares
repurchases in Bradley and Wakeman (1983) (see also footnote 1). Indeed, the definition of (3) is exactly
the same as the one (also labeled (3)) in Bradley and Wakeman (1983)—if one uses unified definitions
(signs) of equity changes and discount/premium in both new issues and shares repurchases. But Wruck
seems to ignore the fact that, unlike in the new equity placement, the shares outstanding before the
announcement of repurchases involve both non-participating and participating shareholders. Both
Bradley and Wakeman (1993) and Wruck (1989) divide the total informational effect (NPV) by the pre-
announcement firm value. Yet, Bradley and Wakeman correctly call it “the information-induced
percentage change in the value of the assets of the repurchasing firm.” This illustrates that the measure is
neither the return to old shareholders nor the return to both old and new shareholders in new equity
offerings.
In addition, Bradley and Wakeman never use the definition of (3) in any cross-sectional
regression; their use of definition (3) is purely for the analysis of the wealth transfer between, and the
information effect shared by, participating and non-participating shareholders in shares repurchases.
Instead, Bradley and Wakeman use the (dollar) return to non-participating shareholders, ∆W, as the pre-
announcement equity value of non-participating shareholders multiplied by the standard measure of the
Page 20
19
announcement return, AR, in their cross-sectional regression (5). In short, the use of ARNPV introduced by
Wruck (1989) in the literature about private placements appears strange.
3.2 The Built-in Relationship between ARNPV and Ownership Structure Variables
At this point, it should be obvious that ARNPV contains an additional term compared to the standard
measure, AR, as shown in (3). This additional term embeds shares dilution, ∆N/N, a near-perfectly
correlated variant of fraction placed, ∆N/(N+ ∆N), and placement discount, d. Let Insider Shares be
corporate controlling insiders’ number of shares outstanding and Conown the controlling ownership in
percentage, Insider shares/N, before the placement. Assuming that the insiders and existing shareholders
do not participate in private placements and the new shareholders (actively) join the insiders after the
placement, the ownership structure changes, ∆Ownership, in Wruck (1989) is simply
Conown).-(1 Placed Fraction
N SharesInsider
NNN
NNN
N SharesInsider
NNN SharesInsiderOwnership
×=
×+
−+
=
−+
+=
∆∆
∆∆
∆∆∆
(4)
Wruck (1989) finds a significant relationship between ARNPV and ∆Ownership, support for the
ownership concentration hypothesis. Hertzel and Smith (1993) document a significant relationship
between ARNPV and Fraction Placed, support for the asymmetric information mitigation hypothesis. We
show below that their analysis is biased in favor of their hypotheses. There is a built-in relationship of
ARNPV with ∆Ownership or even more directly with Fraction Placed.
Assuming that Fraction Placed is not correlated with the standard measure, AR, nor correlated
with the placement discount, d, in any way, and substituting the near-perfect correlated share dilution,
∆N/N, with Fraction Placed, the covariance between ARNPV and Fraction Placed, according to (3) is:
Page 21
20
Placed}, onVar{Fractim
Placed} Fraction e),(mPlaced onCov{Fracti
Placed} Fraction d),(ARPlaced onCov{Fracti
Placed} Fraction d),(ARPlaced FractionAR{Cov}Placed Fraction,AR{Cov NPV
×=
+×=
+×=
+×+=
(5)
where m is the mean of AR+d and e is the residual that is not correlated with any moments of Fraction
Placed, as we assumed in the beginning.
In private placements, both AR and d are usually positive on average. Thus, the slope estimate in
a regression of ARNPV on Fraction Placed equals a positive number, m, even when there is no relationship
between the standard measure of announcement returns, AR, and Fraction Placed. A similar bias can be
shown when one runs a regression of ARNPV on ∆Ownership because ∆Ownership in (4) is also closely
related to Fraction Placed by definition. Because of this property, the R-squares in both the regression
results of Wruck (1989) and Hertzel and Smith (1993) are unusually high, around 50 percent.
To illustrate numerically that the relation of ARNPV to Fraction Placed or to ∆Ownership arises
mainly from the components of ARNPV that are, by definition, related to Fraction Placed and
∆Ownership, we do a similar analysis using a sample of Hong Kong private placements. It should be
mentioned that, if the private investors are not active, the new shares should not be included into the
ownership concentration. In this case, the change in the existing controlling ownership is negative due to
the new issue: ∆Conown=∆Ownership-Fraction(Placed). Thus, ∆Conown is an alternative measure of
ownership concentration change when new investors do not play any active role in the issuing firms.
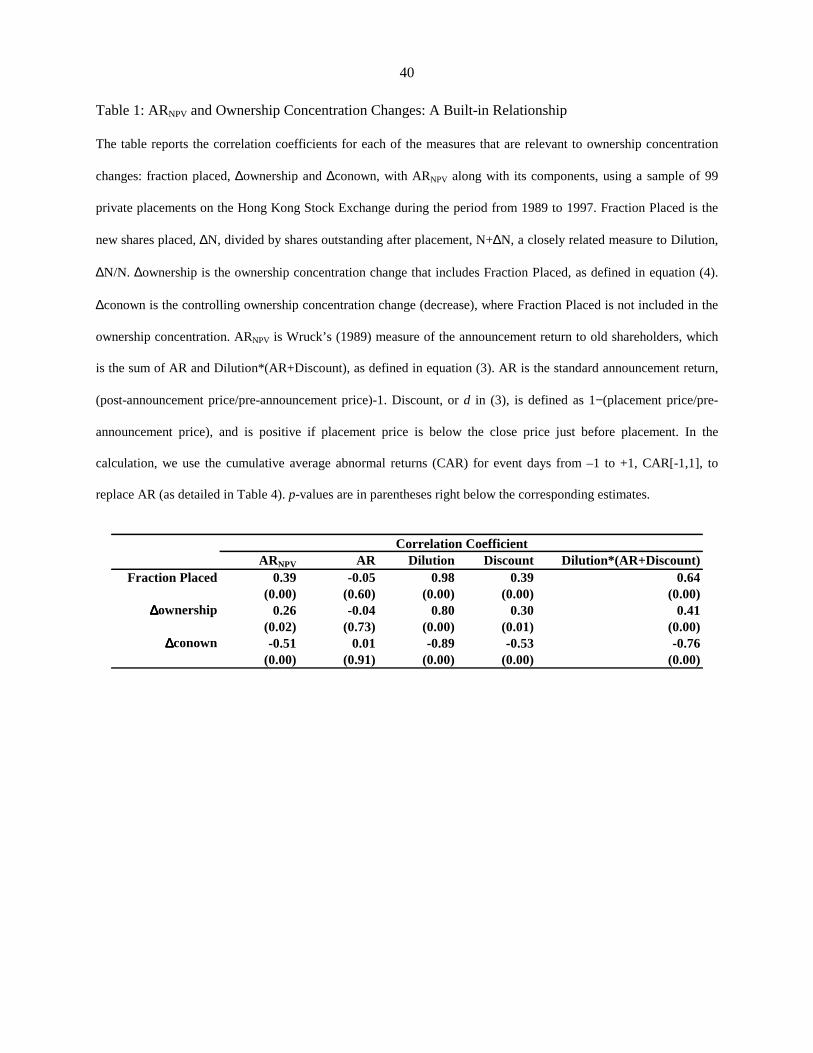
As shown in Table 1, each of the measures that is relevant to the ownership concentration
changes (Fraction Placed, ∆Ownership and ∆Conown), even though evidently not correlated with AR
(the standard measure of announcement returns), is significantly correlated with ARNPV. As we have
already pointed out, this significant correlation actually comes from the significant correlation with the
additional term in ARNPV: Dilution*(AR+d). This occurs through a significant relation to Dilution (∆N/N)
Page 22
21
or Discount.
Note that the correlation coefficient between ∆Conown and Dilution is negative, -0.89, because
∆Conown is always negative in new issues to outside new investors. In short, there is a permanent bias in
the relationship between ARNPV and variables relevant to ownership concentration changes. Thus, the use
of ARNPV by the literature to study the announcement effect or the firm valuation effect of private
placements should be reconsidered.
In summary, it is appropriate to use the standard return measure of AR to study private as well as
non-private placements. Applying the standard return measure to the U.S. data to replicate the tests of
Wruck (1989) and Hertzel and Smith (1993) does not seem promising, though. Barclay, Holderness and
Sheean (2001) have already used the U.S. evidence to challenge the very notion that new shareholders in
private placements play an active, organizational and informational role. We turn instead to more
international data for possible explanations of the positive announcement effect of new equity
placements.
4. Data
The SEO data on announcement date, issue price, and issue amount are collected from The Securities
Journal published monthly by the Hong Kong Stock Exchange from 1989 to 1997. Only local non-
financial and non-utility firms listed on the Stock Exchange of Hong Kong (SEHK) are considered. The
SEOs included in our sample are either private or non-private (ordinary) equity placements and are
purely new equity sales to outside or independent investors that have no connections to corporate insiders
(required by the local listing rules), the main form of seasoned equity issues in Hong Kong. The new
issues are “firm commitment” underwritten usually through investment banks and brokerage firms. In the
private placements, the new equity is sold to a limited number of identifiable outside investors (also
labeled in the data source as “private placing”) while, in the non-private placements, both the
Page 23
22
number and identity of investors are unknown to the public. New issues to corporate insiders or parent
firms, rights-issues, and issues of warrants and convertibles are excluded from the sample. The
controlling ownership data are collected from various volumes of Hong Kong companies handbooks and
guides.8 Controlling ownership includes the holdings of the largest shareholder and, where applicable,
also the holdings of the family members of the largest shareholder. Finally, stock returns and financial
statement data where available are retrieved from the Pacific-Basin Capital Markets (PACAP) databases.
Table 2 reports that there were a total of 409 SEOs of listed Hong Kong firms during the period
from 1989 to 1997. As shown in Panel A, there are 99 private placements and 310 ordinary placements in
the sample and the latter dominate the former in every year. During this nine-year period, the number of
SEOs in Hong Kong fell to 13 issues, the lowest, in 1995, but peaked twice, with 73 issues in 1993 and
75 issues in 1997. This phenomenon of waves of SEOs is consistent with evidence from the U.S.
observed by Choe, Masulis and Nanda (1993). Panel B of Table 2 shows the dollar amount placed. For
the SEOs in our sample, HK$ 36,517 million (equivalent to US$ 4,681 million) were placed, for which
private placements accounted for HK$ 10,677 million while ordinary placements for HK$ 25,840
million.
Table 3 reports the issue and firm characteristics of the SEOs. As shown in Panel A, the average
issuing amount, Offersize, is HK$ 107.85 million for private placements while it is HK$ 83.35 million
for ordinary placements. It seems that the private placements, on average, raised more money than did the
8 The list of the sources is Companies Handbook, 1988, published by The Stock Exchange of Hong Kong Ltd;
Corporate International’s Company Handbook: Hong Kong, 1992, 1993, 1994, Published by Corporate
International; Thornton guide to Hong Kong Companies, 1995, 1996, published by Edinburgh Financial Pub.
(Asia).
Page 24
23
ordinary placements. In terms of shares placed as a percentage of shares outstanding at the end of the
previous month of the issuance announcement, Dilution, the private placements, on average, also create
more new shares than do the ordinary placements (18.69 versus 15.20 percent). SEOs are often placed at
a discount in percentage, Discount, measured by one minus the offer price over the closing price two
event days before the announcement of an issue. The private placements have, on average, a slightly
deeper discount than do the ordinary placements (5.75 versus 4.20 percent). The median discount rates
are actually similar (5.56 versus 5.78 percent). Thus, we do not observe, on average, a deeper discount in
offer prices of private placements in Hong Kong. A bigger discount in private placements is an important
way to compensate private investors for information signaling (certification) as hypothesized by Herzel
and Smith (1993).
Panel B of Table 3 reports firm characteristics of the SEOs. The average firm size by market
value (market equity plus book debt at the end of the previous fiscal year), MV, is much smaller for firms
with private placements (equal to HK$ 1,571.2 million) than for firms with ordinary placements (equal to
HK$ 4,032.6 million). However, their median firm sizes are similar (HK$ 638.3 million versus HK$
662.8 million), as also confirmed by Wilcoxon ranks sum test. The fact that the median firm sizes are
smaller than the average ones indicates that smaller issuers dominate the Hong Kong market. Another
observation is that the firm size variation is much smaller among private placements than among ordinary
placements (HK$ 6,634 million versus HK$ 16,334 million by standard deviation). This means that firms
with private placements cluster more as small firms.
As also shown in Panel B of Table 3, like the average controlling ownership, Conown, (39.0
versus 45.0 percent), the median controlling ownership of the firms with private placements is
Page 25
24
significantly lower than that of the firms with ordinary placements (40.0 versus 45.5 percent).9 Given the
substantial dilution in new equity placement documented above, the high ownership concentration in
Hong Kong would render both private and non-private new equity placements to cause substantial
changes in ownership concentration.
Panel B of Table 3 further shows, firms with private placements tend to have less growth
prospects in terms of market value over book value, MV/BV, and lower returns on equity, ROE, than do
firms with ordinary placements. But other variables such as leverage and dividend yield, DivYd, do not
show much a difference between the two types of issuers.
In sum, compared with firms with ordinary placements, firms with private placements have
significantly lower concentrations of controlling ownership and less growth prospects. Also important,
private issuers clusters more as small firms. In Section 6, we will test whether these firm characteristics
are important to explain the cross-sections of announcement returns. For the moment, in the next section,
we first document the average announcement effects, which are one of the important concerns discussed
in the literature.
5. Announcement Effects of New Equity Placements in Hong Kong
We essentially follow the event study method as in Asquith and Mullins (1986) and Kang and Stulz
(1996). Daily stock returns with reinvested dividend are used. Each year, we form ten equally weighted
portfolios among all listed Hong Kong stocks in the PACAP database, ranked according to the Scholes-
9 For a number of 466 non-utility and non-financial Hong Kong listed firms as the whole population in 1996, a
typical controlling ownership is higher (the mean and median values are 49.3 and 50.6 percent, respectively).
Page 26
25
Williams (1977) beta estimates of individual stocks computed against the PACAP equally weighted
market portfolio for Hong Kong. The decile portfolio to which an issuing firm’s stock belongs is thus its
control portfolio. On a particular day, the abnormal return of the issuing firm is defined as the return of
the firm in excess of its expected return estimate or the return of the control portfolio. At any event-time
cross-section, t, an average abnormal return, AARt, is taken across the issuing firms. To gauge the
significance of the average abnormal return on each event day, we calculate, from the estimation event
time period, –89 to –11, the standard deviation of the event-time-series of the average abnormal returns
accounting for the Newey-West (1987) auto-correlation adjustment up to the fourth lag. For a multi-day
announcement window, [event day t1 to t2], a cumulative average abnormal return, CAR[t1,t2], is defined
as the sum of the time-series of AARt within the event window. And its standard deviation is the standard
deviation for the one-day AARt multiplied by the square root of the number of event days in the event
window.
Table 4 shows, for individual event days from –15 up to +15, the daily average abnormal returns,
AAR, cumulative average abnormal returns, CAR, and their t-values for the private and ordinary equity
placing firms in the period from 1989 to 1997. We highlight the CARs of two-day [-1, 0] and three-day [-
1, 0, +1] event windows, accordingly, at the bottom of Table 4. The announcement effects of the
seasoned equity offerings (SEOs) in Hong Kong, regardless of private or non-private placements, turn
out to be, on average, significantly positive. The two-day and three-day average CARs are 1.97 (t-
value=5.01) and 3.51 (t-value=7.28) for private placements and 1.90 (t-value=7.76) and 3.08 percent (t-
value=10.29) for ordinary placements. Interestingly, the positive announcement effects are statistically
indifferent between the private and ordinary placements in Hong Kong (p-values >0.21). Moreover,
while the findings of positive announcement effects for private placements are consistent with the
empirical literature (e.g., Wruck, 1989), the findings for ordinary placements are in sharp contrast to
findings from the U.S. market (see the empirical literature survey by Eckbo and Masulis, 1995).
Page 27
26
Does our evidence on the ordinary placements simply represent a special case for Hong Kong?
Or does it truly bear some generality? As we have already introduced in the literature review section,
there is a sound theoretical basis to allow positive announcement effects in non-private placements
(Ambarish, John and Williams, 1987; Cooney and Kalay, 1993; Wu and Wang, 2001). The explicit
prediction of this line of literature is that positive announcement effects are more likely to happen if the
asymmetric information arises more from investment opportunities than from assets-in-place. The Hong
Kong stock market, ranking six by capitalization, was most volatile while producing the highest
(monthly) average market return for 1970-97 among the top ten developed equity markets in the world
(Wu and Bae, 1999). This high growth fraught with a lot of uncertainties in the Hong Kong market may
have underpinned the positive announcement effects found here. However, Hong Kong is not a case in
isolation. Kang and Stulz (1996) also find that announcement returns of non-private SEOs are
significantly positive in Japan.
It is interesting that ordinary placements are not significantly different from private placements in
creating positive announcement returns. For one thing, it is unlikely that the positive announcement
returns in ordinary placements come from the monitoring effect of Wruck (1989) because the new equity
sales are underwritten by new outside investors who are deemed to be passive. The endogenously
determined information effect as we described earlier is likely to explain the positive announcement
effect in the ordinary placement. But if so, can it also explain the announcement effect in private
placement?
In the next section, we address the above issues and provide evidence on the determinants of the
positive announcement effects in both private and ordinary placements.
6. The Cross-sectional Analysis of the Announcement Returns of New Equity Placements
Page 28
27
In this section, we first examine whether the monitoring or the certification effect through the
organizational or informational involvement by new blockholders explains the positive announcement
return of private placement (Section 6.1). When neither the monitoring effect nor the certification effect
explains the positive announcement effect, it is legitimate to treat a private placement in the same way as
a non-private placement. Thus, we pool the two samples and provide evidence on the same determining
factors of the positive announcement returns in both private and ordinary placements (Section 6.2.)
6.1. Any Ownership Concentration Change Effect in Private Placement?
In the literature, private placement is treated differently from ordinary placement, mainly because private
equity sales are deemed to involve active new investors. If the monitoring hypothesis of Wruck (1989) or
the argument by Hertzel and Smith (1993) is true, we will find a significant relationship between
announcement returns and ownership concentration changes (as in Wruck, 1989) or fraction placed (as in
Hertzel and Smith, 1993). In this section, we basically follow the tests of Wruck (1989) and Hertzel and
Smith (1993) but we use instead a standard announcement return measure.
Table 5 shows the regression results. The dependent variable is the three-day cumulative average
abnormal returns, CAR [-1,1]. The explanatory variables are ownership variables employed by Wruck
(1989) or Hertzel and Smith (1993). It turns out that, in various specifications, the slope estimates for the
ownership concentration change that includes privately placed shares, ∆ownership, and its three
piecewise components split at 20 and 50 percent of the controlling ownership before the placement,
Conown, are not significant at all. Using the controlling ownership concentration change that does not
include new shares placed, ∆conown, the results remain insignificant. It seems that there is no reliable
relationship between the announcement returns in private placements and the controlling ownership
concentration changes. Thus, our results do not seem to support the monitoring hypothesis.
Page 29
28
In Table 5, in various specifications, the slope estimates for Fraction (Placed) are not significant
either. Hertzel and Smith (1993) largely rely on this explanatory variable to differentiate theirs from the
tests directly using ownership concentration changes by Wruck (1989) and to support their asymmetric
information mitigation or certification hypothesis. But Fraction Placed is part of the ownership
concentration changes in Wruck (1989). In this sense, the main tests of Hertzel and Smith (1993) are not
fundamentally different from the tests of Wruck (1989).
Taken together, our tests on the relationship between the announcement returns and the ownership
concentration changes are resoundingly negative. The adjusted R-squares in Table 5, all below zero, is a
good manifestation. But this does not rule out other factors that may explain the positive announcement
effect of private placement. To this end, we turn to the next section.
6.2. Determinants of Announcement Effects of Private and Ordinary Equity Placements
To find out the determinants of the announcement effects of equity placement in general, we use cross-
sectional regressions of the announcement-window cumulative abnormal returns, not only on ownership
variables but also on a list of firm characteristics and market conditions as employed in previous studies.
The dependent variable is the three-day cumulative average abnormal returns, CAR [-1,1], as we used in
the previous section.
On the list of explanatory variables, first, we use ownership variables employed by Wruck
(1989). In addition, we replace Fraction Placed with Discount. The main point of Hertzel and Smith
(1993) is that placement discounts compensate for information costs private investors incur for certifying
firm valuation. Thus, a deeper discount should be related to a higher announcement return. Since
underwriting services provided by investment banks or brokerage firms can work in the same way, the
certification effect, if true, can also occur in non-private placement (see, Slovin, Shuska and Lai, 2000).
Page 30
29
Second, we use the natural logarithm of the firm’s market value, Ln(MV). Wu and Wang (2001)
argue that firm size is a reasonable proxy for relative uncertainties about a firm’s growth to about assets-
in-place. This relative uncertainty about investment opportunities is a sound, theoretically based variable
to explain positive announcement returns of new equity issues. The smaller a firm, the more asymmetric
information arises from growth than from assets-in-place, suggesting that the slope of firm size should be
negative.
Third, we choose a firm’s market-to-book value, MV/BV, a proxy for Tobin’s q.10 This growth
proxy, although popularly used in the empirical literature, is very noisy. For one thing, high growth can
be overshadowed by high cost of capital. Thus, high growth may not be sufficiently evident in the firm
value (due to a high discounting rate). Fourth, we employ another growth proxy, return on equity, ROE.
Denis (1994) argues that if profitability of future investment is related to the profitability of the issuing
firm’s assets-in-place, ROE will be related to growth opportunities. Fifth, we use the dividend yield,
DivYd. Sixth, we use ratio of interest-bearing debt to the sum of the debt and book equity, Leverage, as a
control variable for growth, because Smith and Watts (1992) find that leverage is related to growth
opportunities. Finally, we consider pre-announcement (-60, -2) CAR, Pre60s, and pre-announcement
cumulative market return, Pre60m, as proxies for the firm-specific and general market condition (see
Choe, Masulis and Nanda, 1993). We estimate the regression model with various specifications. For
pooled data, Private is the dummy variable that takes on one for private placement and zero for ordinary
placement.
10 A firm’s market-to-book value ratio as a proxy for Tobin’s q has been widely used as a growth proxy in corporate
finance research. Barclay and Litzenberger (1988), in examining microstructure data, were the first to use the proxy
in a study of announcement effects of equity issues.
Page 31
30
Table 6 reports the regression results. The first 10 regressions make use of a larger (pooled)
sample of private and ordinary placements. For comparison, the 11th and 12th regressions repeat the 9th
and 10th regressions, respectively, but with the sample of only ordinary placements. First, none of the
slope estimates for Discount is significant. Thus, once again, our results do not support the certification
effect of Hertzel and Smith (1993). Second, the slope estimates for the controlling shareholdings,
Conown, tend to be significantly positive. For example, in regression 9, the slope estimate is 0.13 (t-
value=2.83). And a similar result is also found in the pure sample of ordinary placements (regression 11).
Thus, the higher the ownership concentration of the issuers, the stronger the positive announcement
effect of equity placement.
Recall that we do not find this in the sample of private placements as shown in Table 5. We also
know that ownership concentration is significantly lower in private placement than that in ordinary
placement as shown in Table 3 and that there is no significant difference in announcement returns
between private and ordinary placements as shown in Table 4. One may argue that there might actually
be a strong monitoring effect in private placement, if we view an announcement return to result from two
sources: information implied by the level of ownership concentration and other factors that may include
the monitoring effect from the involvement of new investors. The reason seems that the lower part of the
announcement return due to lower ownership concentration observed in private placement may just be
made up for by a positive monitoring effect, which is deemed to occur only in private placement. If this
were true, the dummy variable, Private, would be able to pick it up. It turns out that none of the slope
estimates for Private is significant in the pooled sample. Thus, this make-up-for effect in private
placement must come from other factors than the monitoring effect of Wruck (1989).
As also shown in Table 6, ownership concentration changes do not seem to be significant in the
pooled sample with the presence of the dummy variable, Private. The results are very similar to those
Page 32
31
shown in Table 5 for the sample of private placements. But when we limit the sample to ordinary
placements (regression 12), the slope estimate for ownership concentration changes, ∆conown3, that
occur when ownership concentration is high (above 50 percent), is significantly negative, −0.57 with a t-
value of −2.26. The negative sign reflects the fact that equity placement to outside investors always
causes a dilution in insider shareholdings. Since this result is mainly observed in ordinary placement, the
monitoring effect cannot be a possible explanation. Rather, this result reflects a positive information
effect from new investments. It is a good assumption that, when controlling concentration is high, the
cash flow rights is closely aligned with the control rights of the controlling shareholders. As a result,
private benefits of control in new investment in this situation are less of a concern to the market. The
evidence here that larger investment (reflected as more dilution in controlling shareholding) goes with a
higher announcement return is consistent with this view. We also repeat regression 10 without the
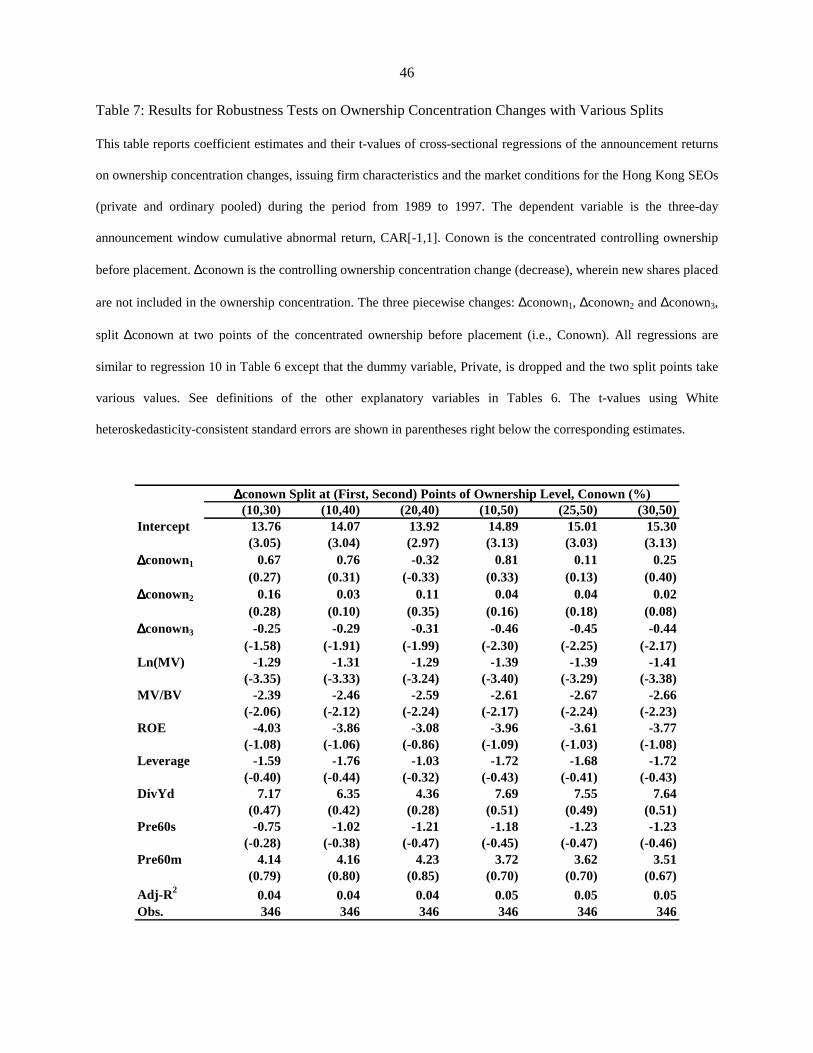
dummy variable, Private, in Table 7 with various splits on ∆conown. In general, above 40 percent of the
ownership concentration, we still find significant slope estimates for ∆conown3.
Some firm characteristics other than ownership structure are also significant in Table 6. Most
important, the slope estimates for Ln(MV), in all regression specifications, are significantly negative, as
hypothesized by Wu and Wang (2001). Largely circumstantial, this important relationship is
independently plotted in Figure 1 for the pooled sample.11 The slope estimates for other growth proxies,
except market-over-book, MV/BV, and for market conditions are not significant.
11 The plot is similar with the sample of only ordinary placement. But we cannot find a significant slope estimate for
firm size in the sample of private placements. The likely reason is that the private issuers cluster as small firms. This
causes insufficient variations in firm size (as shown in Table 3).
Page 33
32
At the first glance, the result from the pooled sample that the slope estimates for MV/BV tend to
be significantly negative looks a bit odd. Many studies in the existing literature have been trying to link a
higher MV/BV to a higher announcement effect in equity offerings, albeit without much success in the
positive region of announcement returns (see Pilotte, 1992; Denis, 1994; Jung, Kim and Stulz, 1996). We
offer two explanations to our results. First, firm size, or Ln(MV), is significantly positively correlated
with market-over-book in the pooled sample (the Pearson correlation coefficient is 0.10 with p-value of
0.05). This does not necessarily mean that small firms have less growth prospects compared with large
firms. Assuming the same growth rates and profitability of assets-in-place as in large firms, a relatively
lower MV/BV of small firms may just reflect a higher cost of capital faced by small firms. In this sense,
like a smaller firm size, a lower MV/BV is likely to indicate more uncertainties surrounding (asymmetric
information about) growth prospects than the expected growth prospects per se.12 Second, the analysis in
Wu and Wang (2001) shows that there is a non-monotone relationship between the announcement effect
and the expected NPV of new projects. If the market is very sure about the growth prospect, information
about the issue-to-investment decision will have been largely anticipated, leaving little information
content of equity offerings. All this says that the key variable that underpins the positive announcement
effect in equity placements is the relative uncertainties about investment opportunities, not the expected
growth prospects per se.
In a nutshell, we find that a higher ownership concentration tends to go with a higher
announcement return of equity placement in the Hong Kong stock market. But this is more an
information effect about new investment than a monitoring effect. Another important information effect
12 A lower MV/BV can also mean a lack of investment opportunities. But such cases are less likely to occur in new
equity issues with positive announcement effects. Wu and Wang (2001) show that the announcement effect is bound
to be very negative when firms with expected negative NPV projects issue new equity.
Page 34
33
comes from firm size. We find that a significantly negative cross sectional relationship between the
announcement effect and firm size. Unlike previous studies (Pilotte, 1992 and Denis, 1994), we associate
positive announcement returns directly with relative uncertainties about growth prospects rather than the
expected growth, as described in the generalized Myers-Majluf framework.
7. Summary and Conclusions
In the literature, the positive announcement effect of new equity financing is especially in association
with private placements. The two widely cited explanations are Wruck's (1989) ownership concentration
changes or monitoring hypothesis, and Hertzel and Smith's (1993) asymmetric information mitigation or
certification hypothesis. However, these two hypotheses are premised on a debatable idea that new
investors through private equity purchases play an active, value-enhancing role (as challenged by
Barclay, Holderness and Sheehan, 2001). This paper argues that the above two hypotheses are supported
by results obtained from using an unusual measure of announcement returns. The measure used by
Wruck (1989) and Hertzel and Smith (1993) has a built-in relationship to new block sizes and ownership
concentration changes, two major explanatory variables, in their hypotheses respectively. As a result,
their tests using this unusual measure are obviously biased in favor of their hypotheses. Using an
announcement return measure common in the event studies literature, we find no evidence for these
hypotheses. Instead, we find an endogenously determined information effect, which is fundamentally
different from the above two hypotheses.
Our tests make use of a unique data set from Hong Kong that includes both private and ordinary
placements. The sample allows us to isolate the effect of the active involvement of new blockholders in
private placement. Both private and ordinary placements in Hong Kong result in ownership concentration
changes because controlling ownership is on average highly concentrated and new equity sales are
typically targeted at only new outside investors. We document a significantly positive two-day (three-
Page 35
34
day) announcement-window average CAR of 1.9 (3.1) percent for a sample of 310 ordinary placements
and of 2.0 (3.5) percent for a sample of 99 private placements for the period from 1989 to 1997 in the
Hong Kong Stock Exchange. Interestingly, ordinary placements are not significantly different from
private placements in creating announcement effects.
The positive announcement returns in ordinary placements are unlikely to come from the
organizational or informational involvement of new investors since, unlike in private placements, these
investors are deemed to be passive. Furthermore, we find no evidence for a significant effect of
ownership concentration changes or fraction placed in private placement (using a standard announcement
return measure). What is new to the literature is that our results are in support of an endogenously
determined asymmetric information effect, consistent with the generalized Myers-Majluf model.
We identify two sources for this information effect. First, our results show a significantly positive
relationship between announcement returns of equity placements and ownership concentration (level).
However, this effect is more a positive information effect about new investments than a monitoring effect
from the active involvement of new blockholders in private placement. Only when ownership
concentration is high (above 40 percent) and, in particular, observed in ordinary placements, do the
changes in ownership concentration that mirror the new investment scales (among other factors) have a
significantly positive effect on announcement returns. Assume that a higher ownership concentration
indicates closer alignment between the cash flow rights and the control rights. Then, private benefits of
control common in the issue-to-investment decision will become less of a concern to the market.
Second, we find a significantly negative cross-sectional relationship between announcement
returns and the issuers’ firm size, consistent with the generalized Myers-Majluf model. Firm size is a
reasonable proxy for the relative uncertainties about investment opportunities to those about assets-in-
place. The smaller a firm, the more asymmetric information will arise from growth than from assets-in-
Page 36
35
place. Since issuers of private equity cluster as small firms, the factor of more asymmetric information
about growth prospects than about assets-in-place can also adequately explain the well-documented
positive announcement effect of private placement.
The two sources above are related to the inherent information asymmetries about new
investments. They create an effect conditional on the news to the market that is nothing other than new
equity placement itself. In contrast, the certification effect, for example, requires an additional
assumption that the informational involvement of new investors or underwriting services provided by
investment banks is value enhancing. Unlike such an exogenously determined information effect, the
information effect described in this paper is purely endogenously determined in a generalized Myers-
Majluf framework.
Page 37
36
References:
Akerlof, G.A., 1970, The market for ‘lemons’: Quality and the market mechanism, Quarterly Journal of
Economics 84, 488-500.
Ambarish, R., K. John, and J. Williams, 1987, Efficient Signaling with Dividends and Investments,
Journal of Finance 42, 321-44.
Asquith, P., and D. Mullins, 1986, Equity issues and stock price dilution, Journal of Financial
Economics 15, 61-90.
Barclay, M., C. Holderness, and D. Sheehan, 2001, The block pricing puzzle, Working Paper, No. FR-01-
05, Simon Graduate School of Business Administration, University of Rochester.
Barclay, M.J, and R.H. Litzenberger, 1988, Announcement effects of new equity issues and the use of
intraday price data, Journal of Financial Economics 21, 71-99.
Bradley, M. and L.M. Wakeman, 1983, The wealth effects of targeted share repurchases, Journal of
Financial Economics 11, 301-328.
Choe, H., R. Masulis, and V. Nanda, 1993, On the timing of seasoned common stock issues: theory and
evidence, Journal of Empirical Finance 1, 3-32.
Cooney, J., and A. Kalay, 1993, Positive information from equity issue announcements, Journal of
Financial Economics 33, 149-72.
Cronqvist, H., and M. Nilsson, 2000, Why do public firms place equity privately? An empirical analysis,
Working paper, University of Chicago and Stockholm School of Economics.
Dann, L., and W. Mikkelson, 1984, Convertible debt issuance, capital structure change and financing-
related information: Some new evidence, Journal of Financial Economics 13, 157-186
Denis, D., 1994, Investment opportunities and the market reaction to equity offerings, Journal of
Financial and Quantitative Analysis 29, 159-77.
Dierkens, N. 1991, Information asymmetry and equity issues, Journal of Financial and Quantitative
Analysis 26, 181-99.
Page 38
37
Eckbo, B., 1986, Valuation effects of corporate debt offering, Journal of Financial Economics 15, 119-
51.
Eckbo, B., and R. Masulis, 1995, Seasoned equity offerings: a survey, in: Jarrow, R. A., W. T. Ziemba,
and V. Maksimovic (Eds.), The Finance Handbook (Vol. 9), North-Holland, Amsterdam, pp.
1017-72.
Fama, E., and K. French, 2002, Testing trade-off and pecking order predictions about dividends and debt,
Review of Financial Studies 15 (1), 1-33.
Hertzel, M., and R.H. Smith, 1993, Market discounts and shareholders gains for placing equity privately,
Journal of Finance 48, 459-85.
Jensen, M., 1986, Agency costs of free-cash-flow, corporate finance, and takeovers, American Economic
Review 76, 323-329.
Jensen, M., and W. Meckling 1976, Theory of the firm: Managerial behavior, agency costs and
ownership structure, Journal of Financial Economics 3, 305-60.
John, K., and J. Williams, 1985, Dividends, dilution and taxes: a signaling equilibrium, Journal of
Finance 40, 1053-70.
Jung, K., Y. Kim, and R. Stulz, 1996, Timing, investment opportunities, managerial discretion, and the
security issue decision, Journal of Financial Economics 42, 159-85.
Kang, J., and R. Stulz, 1996, How different is Japanese corporate finance? An investigation of the
information content of new security issues, Review of Financial Studies 9 (1), 109-39.
Kato, K., and J.S. Schallheim, 1993, Private equity financings in Japan and corporate grouping
(Keiretsu), Pacific-Basin Finance Journal 1, 287-307.
Korajczyk, R., D. Lucas, and R. McDonald 1991, The effect of information releases on the pricing and
timing of equity issues, Review of Financial Studies 4, 685-08.
Loderer, C., and D. Mauer, 1992, Corporate dividends and seasoned equity issues: An empirical
investigation, Journal of Finance 47, 201-25.
Page 39
38
Masulis, R., and A. Korwar, 1986, Seasoned equity offerings: an empirical investigation, Journal of
Financial Economics 15, 91-118.
Mikkelson, W., and M. Parch, 1986, Valuation effects of security offerings and the issuance process,
Journal of Financial Economics 15, 30-60.
Miller, M., and K. Rock, 1985, Dividend policy under asymmetric information, Journal of Finance 40,
1031-52.
Morck, R., A. Shleifer, and R. Vishny, 1988, Management ownership and market valuation: An empirical
analysis, Journal of Financial Economics 20, 293-315.
Myers, S., 1984, The capital structure puzzle, Journal of Finance 39, 575-592.
Myers, S., and N. Majluf, 1984, Corporate financing and investment decisions when firms have
information that investors do not have. Journal of Financial Economics 13, 187-221.
Newey, W., and K. West, 1987, A simple, positive semi-definite, heteroskedasticity and autocorrelation
consistent covariance matrix, Econometrica 55, 703-8.
Pilotte, E. 1992, Growth opportunities and the stock price response to new financing, Journal of Business
65, 371-94.
Scholes, M., and J. Williams, 1977, Estimating betas from nonsychronous data, Journal of Financial
Economics 5, 309-27.
Slovin, M.B., M.E. Sushka, K.W.L. Lai, 2000, Alternative flotation methods, adverse selection, and
ownership structure: evidence from seasoned equity issuance in the U.K., Journal of Financial
Economics 57, 157-190.
Smith, C., 1986, Investment banking and the capital acquisition process, Journal of Financial Economics
15, 3-29.
Smith, W. Jr. Clifford, and Ross L, Watts, 1992, The investment opportunity set and corporate financing
dividend, and compensation policies, Journal of Financial Economics 32, 263-292.
Stulz, R., 1990, Managerial discretion and optimal financing policies, Journal of Financial Economics
Page 40
39
26, 3-27.
Wruck, K., 1989, Equity ownership concentration and firm value: evidence from private equity
financings, Journal of Financial Economics 23, 3-28.
Wu, X.P., and K-H Bae, 1999, Foreign exchange rate news and international equity returns: A variance
decomposition analysis, Working paper, Department of Economics and Finance, City University
of Hong Kong.
Wu, X.P., and Z. Wang, 2001, Equity financing in a Myers-Majluf framework with private benefits of
control, Working paper, Department of Economics and Finance, City University of Hong Kong,
downloadable at http://personal.cityu.edu.hk/~efxpwu/seomdl04.pdf.
Page 41
40
Table 1: ARNPV and Ownership Concentration Changes: A Built-in Relationship
The table reports the correlation coefficients for each of the measures that are relevant to ownership concentration
changes: fraction placed, ∆ownership and ∆conown, with ARNPV along with its components, using a sample of 99
private placements on the Hong Kong Stock Exchange during the period from 1989 to 1997. Fraction Placed is the
new shares placed, ∆N, divided by shares outstanding after placement, N+∆N, a closely related measure to Dilution,
∆N/N. ∆ownership is the ownership concentration change that includes Fraction Placed, as defined in equation (4).
∆conown is the controlling ownership concentration change (decrease), where Fraction Placed is not included in the
ownership concentration. ARNPV is Wruck’s (1989) measure of the announcement return to old shareholders, which
is the sum of AR and Dilution*(AR+Discount), as defined in equation (3). AR is the standard announcement return,
(post-announcement price/pre-announcement price)-1. Discount, or d in (3), is defined as 1−(placement price/pre-
announcement price), and is positive if placement price is below the close price just before placement. In the
calculation, we use the cumulative average abnormal returns (CAR) for event days from –1 to +1, CAR[-1,1], to
replace AR (as detailed in Table 4). p-values are in parentheses right below the corresponding estimates.
ARNPV AR Dilution Discount Dilution*(AR+Discount)Fraction Placed 0.39 -0.05 0.98 0.39 0.64
(0.00) (0.60) (0.00) (0.00) (0.00)∆∆∆∆ownership 0.26 -0.04 0.80 0.30 0.41
(0.02) (0.73) (0.00) (0.01) (0.00)∆∆∆∆conown -0.51 0.01 -0.89 -0.53 -0.76
(0.00) (0.91) (0.00) (0.00) (0.00)
Correlation Coefficient
Page 42
41
Table 2: Number of SEOs and Dollar Amount Placed in Hong Kong From 1989 to 1997
The table reports the annual number of SEOs (Panel A) and the annual SEO dollar amount (Panel B) for the non-
financial and non-utility firms listed on the Hong Kong Stock Exchange in the period from 1989 to 1997. Data on
SEOs with announcement dates, offer price and number of shares placed are from the Securities Journal published
monthly by the Hong Kong Stock Exchange. In the case of multiple placements by a particular firm, each year only
the first SEO is included in the sample. The SEO dollar amount, in millions of Hong Kong dollars, is the offer price
times number of shares placed. The SEOs are divided into non-private (ordinary) equity placements to outside
investors and private equity placements.
1989 1990 1991 1992 1993 1994 1995 1996 1997 Total
SEOs 22 47 31 56 73 31 13 61 75 409Private Placement 6 20 12 20 17 10 3 6 5 99Ordinary 16 27 19 36 56 21 10 55 70 310
SEOs 1646 3658 3610 5142 5581 2980 849 5379 7672 36517Private Placement 720 2017 1528 2466 1571 1051 192 702 430 10677Ordinary 927 1641 2082 2676 4009 1930 657 4677 7242 25840
Panel A: Number of SEOs
Panel B: Dollar Amount Placed (mil. HKD)
Page 43
42
Table 3: Issue and Firm Characteristics of the Hong Kong SEOs
The table presents the mean, median and standard deviation of issue (Panel A) and firm characteristics (Panel B) for
the sample of SEOs for the period of 1989 to 1997. Data are from the Securities Journal and PACAP. And the
controlling ownership data are from various Hong Kong company handbooks or guides. Mean and median are
calculated across SEOs. Offersize is the offer amount in millions of HK$. Dilution is the number of shares placed,
∆N, over the number of shares outstanding (SHROUT) at the end of previous month of the issuing announcement, N.
Discount is defined as 1−(placement price/close price), where the close price is the price (CLSDAY) on event day –
2. Conown is the controlling ownership, also in percentage, reported for the year prior to the year when the
placement takes place. All the financial statement data refer to the previous year, if not specifically mentioned. MV
is the sum of end-of-year market value of equity (data item MKTVAL) and end-of-year book value of liability
(BAL17), in millions of HK$. BV is the sum of end-of-year book value of equity (BAL21) and end-of-year book
value of liability (BAL17). ROE is the net income (INC9) over the book equity (BAL21). Leverage is the interest
bearing debt: the sum of short-term loan (BAL11), long-term loan (BAL14) and debentures (BAL15) over the sum
of the debt and book equity (BAL21). DivYd is cash dividend (MKT1) over stock price (MKT3). Wilcoxon Signed
Ranks test is used under the null of equality in medians.
in Mean in MedianMean Median Std Mean Median Std in Mean p -Value p -Value
Offersize 107.85 60.00 131.82 83.35 50.00 97.80 24.50 0.09 0.35Dilution(%) 18.69 15.00 16.61 15.20 10.22 19.87 3.49 0.09 0.01Discount(%) 5.75 5.56 18.78 4.20 5.78 16.19 1.55 0.46 0.63
MV 1571.18 638.26 6634.17 4032.62 662.75 16333.95 -2461.44 0.03 0.17Conown (%) 38.95 39.98 16.45 45.02 45.52 17.03 -6.07 0.00 0.00MV/BV 1.16 1.06 0.57 1.32 1.16 0.69 -0.16 0.02 0.01ROE(%) 4.80 6.94 27.11 9.10 11.68 22.64 -4.30 0.16 0.07Leverage(%) 27.00 25.20 18.00 25.00 22.60 18.00 0.02 0.26 0.22DivYd (%) 3.65 2.25 4.30 3.29 1.88 4.05 0.36 0.48 0.65
Panel B: Firm Characteristics (mil. HKD for Value Variable)
DifferencePrivate Placement Ordinary Placement
Panel A: Issue Characterisitcs (mil. HKD for Value Variable)
Page 44
43
Table 4: Announcement Returns of SEOs in Hong Kong from 1989 to 1997
The table presents daily average abnormal stock returns (AAR), t-values, and cumulative average abnormal returns,
CAR, for event days from –15 up to 15 for a sample period from 1989 to 1997, where the SEO announcements take
place at event day 0. We also highlight CARs for the two-day and three-day announcement windows and their t-
values at the bottom of the table. Wilcoxon Signed Ranks test is used under the null of equality in medians. Return
data are from PACAP. The number of cross-sectional observations (SEOs) at the two- and three-day announcement
windows is 310 for ordinary equity placements and 99 for private placements.
Event Day (t) AARt t-value CAR[-15,t] AARt t-value CAR[-15,t]-15 -0.09 -0.33 -0.09 0.03 0.19 0.03-14 0.56 2.03 0.47 0.66 3.83 0.69-13 0.41 1.46 0.88 0.16 0.94 0.86-12 -0.12 -0.41 0.76 0.35 2.00 1.20-11 -0.21 -0.77 0.55 0.33 1.91 1.53-10 -0.02 -0.07 0.53 0.01 0.08 1.55
-9 0.30 1.07 0.83 0.38 2.17 1.92-8 0.34 1.21 1.17 0.67 3.88 2.59-7 0.90 3.22 2.06 0.07 0.42 2.67-6 -0.47 -1.69 1.59 0.07 0.39 2.73-5 0.68 2.45 2.27 0.51 2.92 3.24-4 0.62 2.24 2.89 0.30 1.72 3.54-3 1.41 5.06 4.30 0.52 3.01 4.06-2 0.83 2.98 5.13 0.55 3.15 4.60-1 0.84 3.03 5.97 0.91 5.27 5.520 1.13 4.05 7.10 0.99 5.71 6.501 1.54 5.54 8.64 1.18 6.85 7.692 0.16 0.57 8.80 0.31 1.77 7.993 -0.34 -1.22 8.46 0.03 0.17 8.024 0.15 0.55 8.61 -0.20 -1.16 7.825 -0.82 -2.94 7.79 0.01 0.06 7.836 -0.54 -1.93 7.25 -0.03 -0.18 7.807 0.06 0.21 7.31 0.05 0.30 7.858 0.43 1.56 7.75 -0.07 -0.42 7.789 0.10 0.37 7.85 -0.09 -0.51 7.69
10 0.20 0.73 8.05 -0.15 -0.86 7.5411 0.12 0.43 8.17 0.01 0.07 7.5612 0.29 1.05 8.46 0.02 0.09 7.5713 0.10 0.35 8.56 0.04 0.25 7.6214 0.16 0.58 8.72 -0.43 -2.51 7.1815 -0.36 -1.31 8.35 -0.16 -0.91 7.02
in in Mean in MedianCAR t-value CAR t-value Mean p -value p -value
2-day [-1.0] 1.97 5.01 1.90 7.76 0.07 0.92 0.533-day [-1,1] 3.51 7.28 3.08 10.29 0.43 0.72 0.21
Private Placement Ordinary Placement
Private Ordinary Difference
Page 45
44
Table 5: Test Results for the Monitoring and Certification Hypotheses in Private Placement
This table reports coefficient estimates and their t-values of cross-sectional regressions of the announcement returns
on ownership variables for the Hong Kong private placements during the period from 1989 to 1997. The dependent
variable is the three-day announcement window cumulative abnormal return, CAR[-1,1]. Fraction Placed is the new
shares placed, ∆N, divided by shares outstanding after placement, N+∆N. Conown is the concentrated controlling
ownership before placement. ∆ownership is the ownership concentration change that includes Fraction Placed, as
defined in equation (4). ∆conown is the controlling ownership concentration change (decrease), where Fraction
Placed is not included in the ownership concentration. As ∆conown1, ∆conown2, and ∆conown3 to ∆conown, the
three piecewise changes: ∆ownership1, ∆ownership2 and ∆ownership3 to ∆ownership are three components split
∆ownership at the two points of 20 and 50 percent of the concentrated ownership before placement (i.e., Conown),
as in principle described in Wruck (1989). The t-values using White heteroskedasticity-consistent standard errors are
shown in parentheses right below the corresponding regression coefficient estimates.
Regression 1 2 3 4 5 6 7 8 9 10Intercept 4.46 2.40 3.90 3.93 3.46 3.78 1.63 1.63 3.58 2.91
(2.77) (0.71) (2.17) (2.14) (2.34) (2.39) (0.32) (0.32) (1.94) (1.30)Fraction -0.06 -0.12 0.04 0.21 0.26
(-0.63) (-0.39) (0.14) (0.48) (0.38)Conown 0.02 0.05 0.05
(0.28) (0.45) (0.45)∆∆∆∆ownership -0.07 0.16
(-0.33) (0.27)∆∆∆∆ownership1 -0.09 -0.31
(-0.24) (-0.51)∆∆∆∆ownership2 -0.01 -0.27
(-0.04) (-0.44)∆∆∆∆ownership3 -0.13 -0.59
(-0.63) (-0.61)∆∆∆∆conown 0.02 0.16
(0.15) (0.27)∆∆∆∆conown1 0.52 1.41
(1.04) (0.58)∆∆∆∆conown2 -0.14 0.32
(-0.51) (0.26)∆∆∆∆conown3 0.21 0.48
(0.71) (0.57)Adj-R2 -0.01 -0.01 -0.01 -0.04 -0.01 -0.02 -0.03 -0.03 -0.05 -0.03Obs. 98 83 82 82 82 82 82 82 82 82
Page 46
45
Table 6: Cross-sectional Tests when Private Placement Merged into Ordinary Placement
This table reports coefficient estimates and their t-values of cross-sectional regressions of the announcement returnson ownership variables, issuing firm characteristics and the market conditions for the Hong Kong private andordinary placements during the period from 1989 to 1997. The dependent variable is the three-day announcementwindow cumulative abnormal return, CAR[-1,1]. Private takes the value of unity for private placement and zero forordinary placement. Conown is the concentrated controlling ownership before placement. ∆conown is the controllingownership concentration change (decrease), wherein new shares are not included. The three piecewise changes:∆conown1, ∆conown2 and ∆conown3, split ∆conown at the two points of 20 and 50 percent of the concentratedownership before placement (i.e., Conown). Pre60s is the cumulative average abnormal return for the issuing firmfrom event day from –60 to –2, that is, the pre-announcement price run-up for the firm’s stock. Pre60m is thecumulative equal-weighted market return for the same event period before the SEO announcement, that is, the pre-announcement market run-up. See definitions of the other explanatory variables in Tables 3. There are variousregression specifications. The first 10 are for the pooled sample and the 11th and 12th are, respectively, the same asthe 9th and 10th but for the ordinary placement sample. The t-values using White heteroskedasticity-consistentstandard errors are shown in parentheses right below the corresponding coefficient estimates.
Ordinary OnlyModel 1 2 3 4 5 6 7 8 9 10 11 12Intercept 3.38 -0.05 2.07 2.32 -0.06 15.57 10.59 13.03 11.26 14.00 13.15 15.87
(3.68) (0.26) (1.56) (1.66) (0.29) (3.76) (2.73) (2.96) (2.89) (3.02) (2.68) (2.56)Private 0.41 0.57 0.15 0.28 0.63 -0.51 0.03 -0.75 0.16 -0.60
(0.33) (0.46) (0.11) (0.21) (0.51) (-0.37) (0.02) (-0.52) (0.12) (-0.42)Discount -4.84 -4.65 -5.35 -4.70 -4.59
(-1.25) (-1.12) (-1.24) (-1.07) (-0.88)Conown 0.07 0.08 0.13 0.13 0.15
(1.76) (1.88) (2.65) (2.83) (2.77)∆∆∆∆conown -0.20 -0.25
(-1.20) (-1.63)∆∆∆∆conown1 -0.21 0.69 0.06
(-0.09) (0.28) (0.08)∆∆∆∆conown2 0.14 0.15 -0.07
(0.28) (0.25) (-0.20)∆∆∆∆conown3 -0.20 -0.25 -0.57
(-1.25) (-1.58) (-2.26)Ln(MV) -1.38 -1.50 -1.22 -1.61 -1.31 -1.83 -1.52
(-3.64) (-3.67) (-3.29) (-3.82) (-3.32) (-3.92) (-3.17)MV/BV -2.16 -2.22 -2.48 -2.01 -2.43 -1.81 -2.45
(-2.09) (-1.94) (-2.13) (-1.77) (-2.06) (-1.37) (-1.74)ROE -3.66 -5.22 -3.35 -5.50 -4.05 -7.73 -6.44
(-1.08) (-1.44) (-0.96) (-1.51) (-1.09) (-1.71) (-1.44)Leverage -1.84 -1.99 -1.07 -2.83 -1.46 -4.15 -2.07
(-0.50) (-0.49) (-0.27) (-0.70) (0.37) (-0.82) (-0.43)DivYd 1.76 10.41 6.17 7.28 7.20 -3.60 2.45
(0.13) (0.68) (0.41) (0.49) (0.47) (-0.20) (0.14)Pre60s 0.89 -1.70 -0.81 -2.21 -0.82 -0.24 1.54
(0.34) (-0.63) (-0.31) (-0.82) (-0.31) (-0.08) (0.55)Pre60m 4.18 3.69 4.16 3.17 3.87 -2.60 0.11
(0.85) (0.69) (0.79) (0.59) (0.72) (-0.40) (0.02)Adj-R2 0.00 0.00 0.00 0.00 0.01 0.04 0.06 0.04 0.07 0.04 0.09 0.06Obs. 400 374 372 372 367 371 347 346 343 346 267 271
Pooled Sample of Private and Ordinary Placements
Page 47
46
Table 7: Results for Robustness Tests on Ownership Concentration Changes with Various Splits
This table reports coefficient estimates and their t-values of cross-sectional regressions of the announcement returns
on ownership concentration changes, issuing firm characteristics and the market conditions for the Hong Kong SEOs
(private and ordinary pooled) during the period from 1989 to 1997. The dependent variable is the three-day
announcement window cumulative abnormal return, CAR[-1,1]. Conown is the concentrated controlling ownership
before placement. ∆conown is the controlling ownership concentration change (decrease), wherein new shares placed
are not included in the ownership concentration. The three piecewise changes: ∆conown1, ∆conown2 and ∆conown3,
split ∆conown at two points of the concentrated ownership before placement (i.e., Conown). All regressions are
similar to regression 10 in Table 6 except that the dummy variable, Private, is dropped and the two split points take
various values. See definitions of the other explanatory variables in Tables 6. The t-values using White
heteroskedasticity-consistent standard errors are shown in parentheses right below the corresponding estimates.
(10,30) (10,40) (20,40) (10,50) (25,50) (30,50)Intercept 13.76 14.07 13.92 14.89 15.01 15.30
(3.05) (3.04) (2.97) (3.13) (3.03) (3.13)∆∆∆∆conown1 0.67 0.76 -0.32 0.81 0.11 0.25
(0.27) (0.31) (-0.33) (0.33) (0.13) (0.40)∆∆∆∆conown2 0.16 0.03 0.11 0.04 0.04 0.02
(0.28) (0.10) (0.35) (0.16) (0.18) (0.08)∆∆∆∆conown3 -0.25 -0.29 -0.31 -0.46 -0.45 -0.44
(-1.58) (-1.91) (-1.99) (-2.30) (-2.25) (-2.17)Ln(MV) -1.29 -1.31 -1.29 -1.39 -1.39 -1.41
(-3.35) (-3.33) (-3.24) (-3.40) (-3.29) (-3.38)MV/BV -2.39 -2.46 -2.59 -2.61 -2.67 -2.66
(-2.06) (-2.12) (-2.24) (-2.17) (-2.24) (-2.23)ROE -4.03 -3.86 -3.08 -3.96 -3.61 -3.77
(-1.08) (-1.06) (-0.86) (-1.09) (-1.03) (-1.08)Leverage -1.59 -1.76 -1.03 -1.72 -1.68 -1.72
(-0.40) (-0.44) (-0.32) (-0.43) (-0.41) (-0.43)DivYd 7.17 6.35 4.36 7.69 7.55 7.64
(0.47) (0.42) (0.28) (0.51) (0.49) (0.51)Pre60s -0.75 -1.02 -1.21 -1.18 -1.23 -1.23
(-0.28) (-0.38) (-0.47) (-0.45) (-0.47) (-0.46)Pre60m 4.14 4.16 4.23 3.72 3.62 3.51
(0.79) (0.80) (0.85) (0.70) (0.70) (0.67)Adj-R2 0.04 0.04 0.04 0.05 0.05 0.05Obs. 346 346 346 346 346 346
∆∆∆∆conown Split at (First, Second) Points of Ownership Level, Conown (%)
Page 48
47
Figure 1: Announcement Effect of New Equity Placements and Firm Size in Hong Kong for 1989-97
-50
-25
0
25
50
75
100
2 4 6 8 10 12
Firm Size (Ln(MV))
CA
R[-1
,1],
%