Page 1
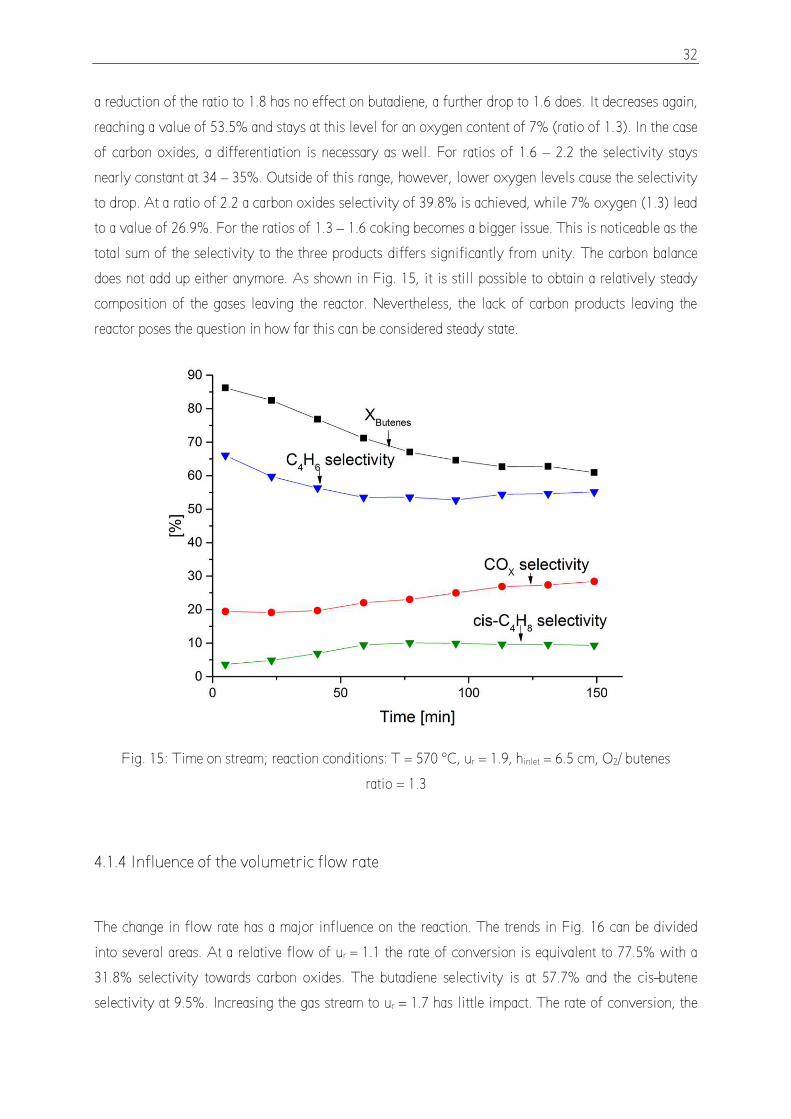
Oxidative dehydrogenation of n-butane and
butenes over Mo based catalysts in a
two-zone fluidized bed reactor
Master’s thesis
Robert Franz
March 2016
Institute for Chemical Technology and Polymer Chemistry
Karlsruhe Institute of Technology
Reviewer: Prof. Dr. Olaf Deutschmann
Supervisor: Dipl.-Chem. Julius Rischard
Duration: September 14th, 2015 – March 29th, 2016
Page 3
Institut für Technische Chemie und
Polymerchemie
Master Thesis
Mr. cand. M.Sc. Robert Franz student number: 1591540
Oxidative dehydrogenation of n-butane, butenes and propane over Mo
based catalysts in a two-zone fluidized bed reactor
1,3-butadiene is a very important building block chemical. It is besides styrene one of the necessary
monomers to manufacture synthetic rubber. Up to now, 1,3-butadiene is mainly produced as byproduct
in steam crackers. The rising natural gas supply makes it economical to produce light alkenes directly
out of alkanes. The two-zone fluidized bed reactor is a promising reactor concept for the oxidative
dehydrogenation of alkanes and alkenes.
In order to optimize the performance of the two-zone fluidized bed reactor, detailed studies of the
operating conditions as well as the synthesis of new catalysts is necessary. Lattice oxygen containing
materials with high oxygen mobility are known as highly active catalysts for the oxidative
dehydrogenation. Mixed oxides of Bi-Mo are examples of such materials. Therefore, investigations of
these materials in a two-zone fluidized bed reactor may provide interesting results.
Flow chart:
Literature research (oxidative dehydrogenation/ selective oxidation, basics of fluidized beds,
two-zone fluidized bed reactor, Bi-Mo catalyst)
Synthesis and characterization (XRD, Raman, BET, etc. of different Bi-Mo mixed oxides pure
and supported on MgO
Detailed investigations of the operating conditions using Bi-Mo mixed oxides in a two-zone
fluidized bed reactor (temperature, oxygen/n-butane molar ratio, low velocity, height of the
different zones); Feedstock: n-butane, n-butenes, propane, C4R2
Measuring vertical concentration profiles inside the fluidized bed with a sample probe
The written thesis has to comply with scientific standards containing introduction, theoretical
principles, results and discussion. The results have to be presented in presentation as part of the
“Mitarbeiterseminar Reaktive Strömung”.
Start: 14.09.2015
Submission: 14.03.2016
Supervisors: Prof. Dr. Olaf Deutschmann
Dipl. Chem. Julius Rischard
Prof. Dr. Olaf Deutschmann
Page 5
Erklärung
Hiermit erkläre ich, dass ich die vorliegende Arbeit selbstständig verfasst und nur die angegebenen
Quellen und Hilfsmittel benutzt habe. Wörtliche und sinngemäße Zitate wurden als solche
gekennzeichnet. Die Arbeit wurde keiner anderen Prüfungsbehörde in gleicher oder abgewandelten
Form zur Erlangung eines akademischen Grades vorgelegt.
Karlsruhe, den 29.03.2016
Robert Franz
Page 7
Acknowledgements
I would like to use this opportunity to thank several people. Firstly, I would like to thank Prof.
Deutschmann for the interesting topic and giving me the opportunity to write my thesis at the Institute
for Chemical Technology and Polymer Chemistry. Secondly, I would like to thank Dipl.-Chem. Julius
Rischard for his excellent supervision, support and availability for questions. Furthermore, I am
grateful to the entire research group for the willingness to help, especially Ms. Angela Beilmann for
the BET measurements and Ms. Ingrid Zeller for the XRD measurements. Lastly, I would like to thank
my family for their support and their proofreading of this thesis.
Page 8
I
Zusammenfassung
Insbesondere in den USA wurden viele Steamcracker aufgrund der hohen Verfügbarkeit von
Schiefergas auf niedere Kohlenwasserstoffe als Edukt umgestellt. Dadurch sinkt jedoch die Ausbeute
des Nebenprodukts 1,3-Butadien deutlich. Die hohe Bedeutung Butadiens für die Kunststoffindustrie
erfordert eine alternative Produktionsmethode. Eine Möglichkeit ist die Herstellung aus n-Butan und
Butenen über die oxidative Dehydrierung. Für n-Butan hat sich der Zwei-Zonen Wirbelschichtreaktor
als vielversprechendes Konzept erwiesen. Bei diesem Reaktor handelt es sich um einen modifizierten
Wirbelschichtreaktor. Sauerstoff und Kohlenwasserstoff werden an unterschiedlichen Orten der
Wirbelschicht zugeführt, wodurch Reaktion und Regeneration des Katalysators im gleichen System in
getrennten Zonen stattfinden können.
Im Rahmen dieser Arbeit wurden fünf Katalysatoren synthetisiert und in einem Wirbelschichtreaktor
getestet, um die optimalen Reaktionsbedingungen und Ausbeuten zu ermitteln. Bei vier dieser
Katalysatoren bestand die aktive Phase aus Bismut- und Molybdänverbindungen. Hier muss wieder
zwischen drei geträgerten Katalysatoren und einem ungeträgertem Katalysator unterschieden werden.
Als Träger kam zwei Mal MgO und einmal Al2O3 zum Einsatz. Beim fünften Katalysator handelte es
sich um eine Mo-V Verbindung auf Al2O3. Die Edukte waren n-Butan, eine Mischung aus 1-Buten
und trans-Buten oder ein C4R2-Raffinatschnitt. Die Katalysatoren auf Al2O3-Basis lieferten aufgrund
starker Verkokung sehr schlechte Ergebnisse. Der ungeträgerte Katalysator hingegen wies
hervorragende Selektivität und Umsatz auf. Für den Raffinatschnitt als Edukt betrug der Butenumsatz
bei 450 °C unter optimalen Bedingungen 89.1%. Die Selektivität zu Butadien erreichte dabei 88.5%.
Butan ist bei diesen Bedingungen jedoch nahezu inert. Die Butenmischung wurde bei gleicher
Gesamtkonzentration an Kohlenwasserstoffen getestet wie der Raffinatschnitt. Diese Erhöhung der
Eduktkonzentration führte zu einem verringerten Maximalumsatz von 83.8% bei einer Selektivität von
87.9%. Hier wurde beobachtet, dass sämtliche Gase ohne drastische Verringerung der Ausbeute von
unten in die Wirbelschicht geleitet werden können. Dies wirft die Frage auf, inwiefern beide Zonen für
diesen Katalysator erforderlich sind.
Die Katalysatoren auf MgO-Basis zeigten schlechteres Verhalten. Die maximale Selektivität von 60%
zu Butadien konnte erst bei 570 °C erreicht werden. Der Umsatz bei dieser Temperatur betrug 80.8%.
Alle Versuche wurden mit der Butenmischung durchgeführt. Der Einfluss der beiden Zonen ist klar
erkennbar, unterscheidet sich jedoch von bisherigen Fällen. Wird die Regenerationszone zu klein,
gleicht stärkere Verkokung die längere Verweilzeit aus. Die Zusammensetzung des Produktgases ist in
diesem Fall unabhängig von der Einlasshöhe. Dieser stationäre Zustand ist jedoch abhängig von der
Sauerstoff-und Butenkonzentration. Magerere Bedingungen führen zu einem stationären Zustand bei
geringerem Umsatz und höherer Selektivität zu Kohlenoxiden.
Page 9
II
Abstract
Due to the high availability of shale gas, many steam crackers have been redesigned to accommodate
lighter feeds. Especially in the US this has been a widespread phenomenon. However, the amount of
1,3-butadiene generated as a by-product drops considerably. Since butadiene is an important raw
material in the chemical industry, alternative methods of production are necessary. One possibility is
to generate butadiene from n-butane and butenes via the oxidative dehydrogenation. The so-called
two-zone fluidized bed reactor (TZFBR) has proven to be a promising reactor concept for n-butane
feeds. In this reactor the raw materials are fed at different points of the fluidized bed, creating two
distinct zones.
Five different catalysts were synthesized for this thesis. They were characterized and tested in the
TZFBR in order to determine optimal operating conditions and yields. The active phase consisted of
bismuth and molybdenum compounds for four of these catalysts. Three of these were supported (two
on MgO and one on Al2O3) and one a non-supported catalyst. The fifth catalyst also used Al2O3 as a
support but the active phase consisted of a Mo-V compound. The hydrocarbons used were either n-
butane, a mixture of 1-butene and trans-butene or a C4R2 raffinate. The Al2O3-based catalysts showed
poor results due to excessive coking. The unsupported catalyst on the other hand showed excellent
characteristics. At 450 °C a butene conversion of 89.1% at 88.5% selectivity towards butadiene could
be measured for the C4R2 feed. n-Butane on the other hand is inert under these conditions. Using the
butenes mixture at equivalent hydrocarbon concentration led to a reduction of the conversion to 83.8%
with a selectivity of 87.8%. The experiments with this feed showed, that feeding all gases from the
bottom of the bed does not lead to a drastic reduction in yield. This poses the question if the two zones
are necessary for the non-supported catalyst.
The catalysts supported on MgO showed inferior behavior. All tests were conducted with the butenes
mixture. The maximum selectivity of 60% could only be achieved at 570 °C. At this temperature the
rate of conversion amounted to 80.8%. The influence of the two zones is noticeable but differs from
previously reported experiments. If the regeneration zone is too small, the increase in coking
counterbalances the increased residence time of the hydrocarbons. Once this happens, a further size
reduction of the regeneration zone has no influence on the product gas composition. This state is
dependent on the ratio of oxygen to butenes however. Leaner reaction conditions lead to a lower rate
of conversion and higher selectivity to butadiene.
Page 10
III
List of abbreviations
BD Butadiene
BET Brunauer, Emmett and Teller
DH Dehydrogenation
FID Flame ionization detector
Fig. Figure
GC Gas chromatograph
GHSV Gas hourly space velocity
MII Divalent metal
MIII Trivalent metal
MFC Mass flow controller
MvK Mars van Krevelen
ODH Oxidative dehydrogenation
SLPM Standard liters per minute
TPRO Temperature programmed re-oxidation
TS-TZFBR Two-section two-zone fluidized bed reactor
TZFBR Two-zone fluidized bed reactor
XRD X-ray diffraction
Page 11
IV
Contents1 Introduction .......................................................................................................................................... 1
1.1 Aim of the thesis............................................................................................................................ 5
2 Theoretical aspects ............................................................................................................................... 6
2.1 Reaction mechanism...................................................................................................................... 6
2.1.1 Bismuth molybdate catalysts.................................................................................................. 7
2.2 Fluidized beds................................................................................................................................ 8
2.2.1 Principle.................................................................................................................................. 8
2.2.2 Forms of fluidized beds ........................................................................................................ 11
2.2.3 Influence of particle characteristics...................................................................................... 12
2.2.4 Reh diagram ......................................................................................................................... 13
2.2.5 Advantages and disadvantages ............................................................................................. 15
2.3 Characterization methods ............................................................................................................ 16
2.3.1 Determination of the surface area......................................................................................... 16
2.3.2 X-ray crystallography........................................................................................................... 17
2.4 Rate of conversion, selectivity and yield..................................................................................... 17
3 Experiments........................................................................................................................................ 19
3.1 Catalyst preparation..................................................................................................................... 19
3.2 Catalyst characterization ............................................................................................................. 20
3.3 Experimental setup ...................................................................................................................... 23
3.4 Experimental procedure .............................................................................................................. 25
4 Experimental results ........................................................................................................................... 28
4.1 Supported catalysts...................................................................................................................... 28
4.1.1 Temperature influence.......................................................................................................... 28
4.1.2 Height influence ................................................................................................................... 29
4.1.3 Influence of the oxygen content ........................................................................................... 31
4.1.4 Influence of the volumetric flow rate ................................................................................... 32
4.1.5 Comparison of MgO-1 and MgO-2 ...................................................................................... 33
4.1.6 Catalysts supported on Al2O3 ............................................................................................... 34
4.2 Unsupported BiMo catalyst......................................................................................................... 35
4.2.1 Temperature dependence...................................................................................................... 35
4.2.2. Influence of the inlet height................................................................................................. 36
4.2.3 Influence of the oxygen content ........................................................................................... 38
4.2.4 Variation of the volumetric flow rate ................................................................................... 39
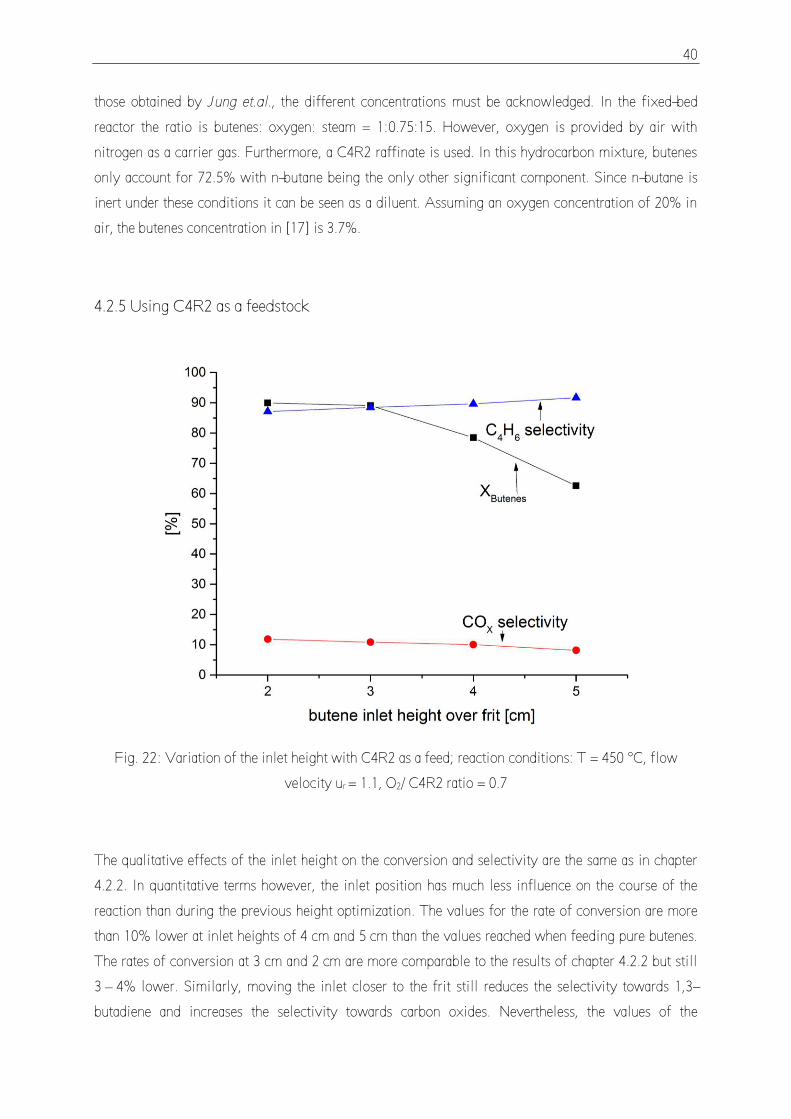
4.2.5 Using C4R2 as a feedstock................................................................................................... 40
5 Discussion .......................................................................................................................................... 42
5.1 Supported catalysts...................................................................................................................... 42
5.1.1 Influence of the reactor temperature..................................................................................... 42
5.1.2 Influence of the inlet height.................................................................................................. 43
5.1.3 Influence of the oxygen content ........................................................................................... 44
5.1.4 Influence of the volumetric flow rate ................................................................................... 45
5.1.5 Comparison of MgO-1 and MgO-2 ...................................................................................... 46
5.1.6 Influence of the Al2O3 support.............................................................................................. 47
Page 12
V
5.2 Unsupported catalyst ................................................................................................................... 48
5.2.1 Influence of the reactor temperature..................................................................................... 48
5.2.2 Influence of the inlet height.................................................................................................. 48
5.2.3 Influence of the oxygen content ........................................................................................... 50
5.2.4 Influence of the volumetric flow rate ................................................................................... 50
5.2.5 Use of C4R2 as a feedstock.................................................................................................. 51
5.3 Comparison of the different catalysts.......................................................................................... 52
6 Summary ............................................................................................................................................ 54
7 References .......................................................................................................................................... 56
Page 13
1
1 Introduction
1,3-Butadiene (BD) is an important product of the petrochemical industry. It finds widespread use as a
reactant for a host of products. Accounting for 54% of the global butadiene demand styrene-butadiene
rubber (SBR) and polybutadiene rubber (PBR) enable a first estimate of market trends [46]. The main
downstream use of these two materials is the manufacturing of tires. While the future of the
automotive industry is difficult to foresee, most research into future trends does indicate a
considerable increase in sales volume (e.g. [24]). As tires are products with a limited lifespan and will
be necessary regardless of other modifications (engine, etc.), a corresponding increase in demand is to
be expected as well. Further uses of BD are the production of acrylonitrile-butadiene styrene (ABS)
resins and styrene-butadiene latex, both of which can be found in adhesives, office machines,
telephones, etc. Looking at the full range of BD applications it is safe to say that the market for BD
will grow in the next few years. Indeed the global demand for BD was around 10 million metric tons
in 2012 with a growth rate of 1 – 2% per year [29].
In the past approximately 98% of the global BD supply was generated in the steam cracking of
paraffinic hydrocarbons where it is a by-product of ethylene production [34]. However, due to recent
developments this supply cannot be taken for granted anymore. Especially in the U.S., considerable
effort has been invested into the development of shale gas formations. As a result, many steam
crackers have been redesigned towards lighter feeds as this increases the ethylene yield. On the
downside, the amount of BD produced sinks dramatically. The further development of the magnitude
of shale gas extraction is difficult to predict, given the recent development in fossil fuel prices.
However, it will probably continue to play an important role as a fossil fuel. With the number of
steamcrackers already redesigned this makes it sensible to research alternative methods of producing
BD. Several possibilities exist to achieve this. One of these is to produce 1,3-butadiene out of n-butane
or butenes. Here one has to differentiate between different routes, namely the catalytic
dehydrogenation (DH – Eq. 1.1) and the oxidative dehydrogenation (ODH – Eq.1.2).
(1.1)
(1.2)
Dehydrogenation is used on an industrial scale for example in the BASF-Linde process of propane
dehydrogenation. However, there are important drawbacks. The reaction is endothermic. This imposes
thermodynamic limitations on the possible yield. Additionally, a significant amount of heat needs to
be supplied, to keep the reaction running. Lastly, dehydrogenation is accompanied by a rapid
Page 14
2
formation of coke on the catalyst. The regeneration necessary for steady operation has led to more
complex designs such as the Houdry-Catadiene process for example, which requires several reactors to
operate [1]. In case of the oxidative dehydrogenation, oxygen is added to the feed. Consequently,
water is the by-product and the reaction is exothermic. This provides several advantages such as the
lack of thermodynamic limitations or the lower temperature necessary. However, new challenges are
encountered in the industrial application of the ODH. The simultaneous presence of oxygen and
hydrocarbons can cause explosive atmospheres. In the case of non-explosive conditions, the contact
time must still be optimized to avoid excessive amounts of carbon oxides.
The oxidative dehydrogenation of butenes has been carried out on an industrial scale, for example via
the Oxo-D process developed by Petro-Tex. This is a modified Houdry-Catadiene process meaning
several reactors are used cyclically [1]. Once the catalyst is deactivated in one reactor due to coking,
the feed switches to another reactor. The coke is burnt off in unused reactors and the heat stored for
the next cycle. Butene and air or oxygen react in a fixed-bed reactor under the presence of steam. The
steam acts both as a heat sink and suppresses coke formation. Using a molar steam to butene ratio of
12:1 Petro-Tex was able to achieve a selectivity of 93% to butadiene at a conversion of 65% [10]. n-
Butane has been avoided as a feedstock in this process since its lower reactivity would require more
severe operating conditions to achieve similar results [29]. The problem with such a process is that it is
quite expensive to build and operate. Combining reaction and catalyst regeneration would decrease the
initial investment significantly.
One possibility is the so-called two-zone fluidized bed reactor (TZFBR). The theory behind the
TZFBR is to feed two gas streams into a fluidized bed reactor at different points. Oxygen is introduced
into the system at the bottom and the hydrocarbon somewhere in the middle. Ideally, this leads to the
development of two zones. In the lower zone, the oxygen burns any coke deposited on the catalyst. At
the same time oxygen is integrated into the lattice, regenerating the catalyst. The inherent mixing
process of a fluidized bed transports these particles into the upper zone where they are exposed to the
hydrocarbon feed. This feed can then react with the lattice oxygen of the catalyst. The deactivated
catalyst eventually reenters the regeneration zone where the lattice oxygen is restored. Soler et.al.
proved that the existence of the two zones depends on the overall parameters (ratio of feed streams,
temperature, gas speed, etc.) [42]. Besides the reduction of equipment, the TZFBR possesses several
additional advantages. When being operated properly, oxygen and hydrocarbon are never present
simultaneously, thus reducing the risk of an explosion. Furthermore, it allows a better control over the
degree of catalyst oxidation. This tends to have significant influence on the reaction selectivity.
Page 15
3
Fig. 1: Image of a TZFBR
The TZFBR has been widely studied in literature. The reactor is suitable for two types of reactions:
Firstly, reactions in which the catalyst is rapidly deactivated by coke deposits. Secondly, reactions in
which the catalyst can be employed as an oxygen carrier [13]. The oxidative dehydrogenation of n-
butane belongs in the latter group and has been studied extensively, e.g. [35; 42]. Another example is
the catalytic oxidation of butane to maleic anhydride [7]. An example for the prior group is the
dehydrogenation of either butane or propane [31; 28]. In this case the burning of coke also provides
some of the heat required for the reaction. The TZFBR enables a continuous operation over long time
periods if the correct process parameters are chosen. Deactivation reported in literature was due to
other reasons, such as catalyst instability [33]. Besides the operation at steady state the results in a
TZFBR are often also superior to those achievable in a normal fluidized bed reactor (e.g. [7]). First
attempts to scale a TZFBR are also documented in literature. Rubio et.al. carried out the oxidative
dehydrogenation of n-butane over a V-MgO catalyst in TZFBR reactors with inner diameters of 3 cm,
6 cm and 10 cm [37]. Their experiments show the challenges of scaling up such a system. Doubling
the bed height in a 6 cm reactor has less impact on the reaction the increasing the bed diameter from
6 cm to 10 cm while keeping the height similar. Gascon et.al. encountered another problem during
scale-up. They investigated the partial oxidation of butane to maleic anhydride on a laboratory and
bench scale. In the prior case the reactor had an inner diameter of 3 cm with 6 cm and 9 cm reactors
being used in the latter case. The selectivity to maleic anhydride decreases with the butane conversion
Page 16
4
in both cases. While the results achieved at bench scale are superior for low rates conversion, the
opposite is the case for high rates of conversion.
The development of modified TZFBRs has also been reported. In order to optimize the fluidization
behavior in both zones, the so-called two-section TZFBR (TS-TZFBR) has been developed. In such a
reactor the section below the hydrocarbon inlet has a smaller inner diameter than the section above it.
A well-designed transition between the two sections is essential to avoid defluidization and a slugging
regime [15]. Besides the studies on the hydrodynamics in such a reactor the dehydrogenation of
propane has also been investigated in this system [31; 32]. At present there are no published results
available that discuss the same reaction conditions and catalyst in a standard TZFBR and a
TS-TZFBR. Consequently, effects of this reactor modification on the reaction cannot be quantified.
Research on the oxidative dehydrogenation of butenes has yielded two promising groups of catalysts:
ferrites and bismuth molybdates. Many examined ferrite catalysts adhere to the MIIFe2O4 structure.
Lee et.al. examined the effect of various divalent metals and found that Zn gives the best results [25].
At 420 °C a rate of conversion of X = 70% and a selectivity of SBD = 95% were detected for zinc.
These values have been improved by adding phosphorous or mixing it with a heteropolyacid [26]. In
the latter case a selectivity of 97.7% and a conversion of 81% were achieved at 420 °C.
Bismuth molybdates have been widely studied for several different reactions. Besides the oxidative
dehydrogenation of butenes, the reaction of propylene to either acrolein or acrylonitrile has also been
investigated. In these studies, bismuth molybdate was usually synthesized in its pure form or
containing different metals. Very few publications mention the use of supported bismuth molybdate.
In these cases, SiO2 is the carrier examined, e.g. [5; 12]. Three different phases of catalytically active
bismuth molybdate are known: α-Bi2Mo3O12, β-Bi2Mo2O9 and γ-Bi2MoO6. Different relative activities
have been reported when using propene (see [14]). For butene feeds, γ-Bi2MoO6 is usually labeled the
superior modification. At a temperature of 440 °C Jung et.al. achieved a selectivity of SBD = 90% and
a rate of conversion of X = 66% [17]. At the same time, synergetic effects between the different
phases exist. Tests with α,γ-and β,γ-mixtures showed an increased rate of conversion at slightly lower
selectivity than pure γ-Bi2MoO6 at the same temperature [44; 18]. The problem with β-Bi2Mo2O9 is
however, that it decomposes at 420 °C [16].
Multicomponent bismuth molybdates have also been examined and tend to adhere to the following
formula for the composition: MaIIMb
IIIBicModOe [19]. MII and MIII refer to di- and trivalent metals.
Many catalysts examined focus on using iron as the trivalent metal. For example, Jung et.al.
determined the influence of several different divalent metals in M9IIFe3BiMo12O51 compounds. While
the selectivity stays nearly constant at 90% at 420 °C, the rate of conversion depends on the divalent
metal. Cobalt was found to give the best results [23]. The authors reasoned that this is due to an
increased oxygen mobility as a result of the different metals. This optimized catalyst also outperforms
Page 17
5
γ-Bi2MoO6. Under identical reaction conditions at 420 °C, pure bismuth molybdate displayed a
selectivity of 90% at a rate of conversion of 40% [21] compared to 90% and 65% for the
multicomponent catalyst.
1.1 Aim of the thesis
The aim of this thesis is to test the suitability of molybdenum-based catalysts for the oxidative
dehydrogenation of butenes. These tests are to be carried out in a two-zone fluidized bed reactor
available at the Institute for Chemical Technology and Polymer Chemistry. In order to determine the
suitability of molybdate-based catalysts, different types of catalysts are to be used. One examined
variable is the second transition metal of the catalyst. Both vanadium and bismuth are employed. As
this thesis focuses on bismuth molybdate catalysts, the different variables are examined in more detail
for this group. These variables are the ratio of bismuth to molybdenum, the amount of active material
on the catalyst and the influence of the support material. The influence of the support material is
examined by comparing bismuth molybdate catalysts supported on MgO and Al2O3 to pure bismuth
molybdate.
Each examined catalyst must first be synthesized and characterized using the facilities available at the
institute (i.e. BET and XRD). Afterwards, the influence of the reaction conditions must be examined
and optimized for each catalyst. In the case of a two-zone fluidized bed reactor, these are temperature,
height of the hydrocarbons inlet, inlet concentration of oxygen and the volumetric flow rate. Lastly,
the effects of the hydrocarbon feedstock need to be examined by comparing a mixture of butene
isomers to an artificial, pre-mixed C4R2 raffinate.
Page 18
6
2 Theoretical aspects
2.1 Reaction mechanism
The oxidative dehydrogenation of butenes is a selective partial oxidation with the following reaction
equation:
(2.1)
It is widely assumed that the reaction proceeds via a Mars – van Krevelen (MvK) mechanism [11]. In
the first step, the alkene chemisorbs on the catalyst surface and the α-hydrogen is abstracted. This
yields a reactive allylic intermediate. Afterwards, this intermediate reacts with lattice oxygen on the
catalyst to form butadiene and water. The butadiene desorbs from the surface, leaving the catalyst
reduced. To complete the cycle, the deactivated catalyst is oxidized with gas-phase oxygen. Oxygen is
integrated into the lattice regenerating the catalyst.
Fig. 2: Frequently proposed reaction mechanism
While the reaction mechanism has never been proven, there are many indications that make it the
likely reaction mechanism. Firstly, the reaction proceeds for a limited time in the absence of gas-phase
oxygen, requiring catalyst oxidation afterwards [20]. The timeframe is dependent on the oxygen
capacity of the catalyst. This indicates that oxygen stored in the catalyst is at least partially responsible
for the oxidation. Furthermore, tracer and kinetic studies on the ODH of propane also indicate a MvK
mechanism (e.g. [3]) and many authors draw parallels between the two reactions.
Page 19
7
2.1.1 Bismuth molybdate catalysts
Since lattice oxygen plays such an important role it is essential that the catalyst can flexibly integrate
oxygen atoms into its structure and release them when required. Transition metals possess partially
filled d orbitals. This enables them to assume several different stable oxidation states, keeping their
catalytic properties constant throughout the oxidation-reduction cycle. Consequently, catalysts
containing the transition metal oxides V or Mo have been studied extensively [11]. An example of the
latter case are bismuth molybdates. They have been used for a long time in industry for the SOHIO
process.
Of the three catalytically active bismuth molybdates, the γ-modification possesses the highest
diffusion coefficient of the lattice oxygen. Studies have shown however, that the oxygen mobility is
dependent on the treatment of the catalyst. Samples of γ-Bi2MoO6 were calcined at different
temperatures. While the selectivity is unaffected by the calcination temperature, the rate of conversion
decreases for higher calcination temperatures. Optimum values were recorded for a calcination
temperature of 475 °C. TPRO experiments showed that this was the sample with the highest oxygen
mobility [22]. Compared to γ-Bi2MoO6, the α-phase contains more adsorption sites for butenes [18].
This is the cause for the previously mentioned synergy effects in certain mixtures of different bismuth
molybdates.
Fig. 3: Different lattice oxygen species in Bi2MoO6, from [9]; proposed functions: O’: α-H
abstraction; O’’: insertion of oxygen into the intermediate; : dissociative chemisorption of O2
The mechanism of the oxidative dehydrogenation has been investigated with 18O tracer studies on
Bi2MoO6. Ueda et.al. examined both the oxidative dehydrogenation of propene and 1-butene on the
same catalyst [43]. Their research indicates that several different lattice oxygen species exist within
Page 20
8
the catalyst. One of these is responsible for the abstraction of hydrogen which is required for the a
butene feed. When propene reacts to acrolein, hydrogen is abstracted and oxygen inserted as well. This
insertion of oxygen proceeds over a different oxygen species. Glaeser et.al. carried out in situ Raman
spectroscopy for the reduction of Bi2MoO6 with different substances which supports this theory [9].
They propose three different types of oxygen in the lattice with three different functions. These are
shown in Fig. 3. The oxygen located between bismuth and molybdenum atoms is responsible for the
abstraction of α-H atoms. Oxygen atoms inserted into allylic intermediates originally bind the
molybdenum atoms. Lastly, O2 is reduced, dissociated and integrated into the lattice through the lone
electron pairs in the Bi-O-Bi bond. The experiments also showed that catalyst regeneration proceeds
significantly faster when using butenes instead of propene as only one species needs to be regenerated.
2.2 Fluidized beds
A fluidized bed consists of a bed of solid particles brought into contact with an upward stream of
either gas or liquid. In this study only gas was used as a fluid. Therefore, only the use of gas will be
discussed on the following pages. Once the gas reaches a certain minimum velocity, the particles are
suspended in the stream. The result is a gas-solid mixture, which exhibits many fluid-like
characteristics such as the ability to be stirred. Depending on the gas velocity, the fluidized bed will
behave in different manners.
2.2.1 Principle
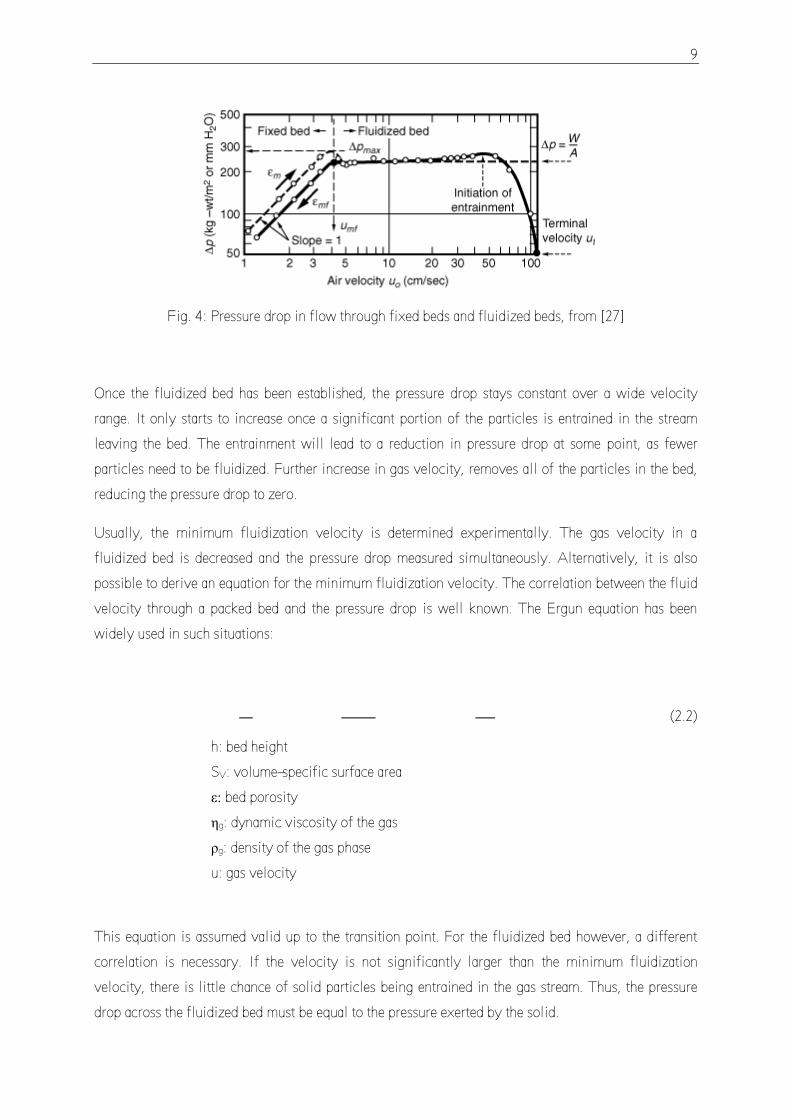
Initially, the particles form a packed bed. Increasing the gas velocity leads to a heightened pressure
drop over the bed. As can be seen in Fig. 4, this is accompanied by an increase in the porosity of the
bed and thus the bed height. Eventually, the gas velocity will be equivalent to the minimum
fluidization velocity. At this point, the bed will transform into a fluidized bed. If the particle size
distribution is broad, the transition will be rather blurred instead of a sharp change. Due to the
coherence of the particles, the pressure drop during the transition is slightly higher than that of a
fluidized bed. However, decreasing the gas velocity below the transition point will instantly lead to a
reduction in pressure drop.
Page 21
9
Fig. 4: Pressure drop in flow through fixed beds and fluidized beds, from [27]
Once the fluidized bed has been established, the pressure drop stays constant over a wide velocity
range. It only starts to increase once a significant portion of the particles is entrained in the stream
leaving the bed. The entrainment will lead to a reduction in pressure drop at some point, as fewer
particles need to be fluidized. Further increase in gas velocity, removes all of the particles in the bed,
reducing the pressure drop to zero.
Usually, the minimum fluidization velocity is determined experimentally. The gas velocity in a
fluidized bed is decreased and the pressure drop measured simultaneously. Alternatively, it is also
possible to derive an equation for the minimum fluidization velocity. The correlation between the fluid
velocity through a packed bed and the pressure drop is well known. The Ergun equation has been
widely used in such situations:
(2.2)
h: bed height
SV: volume-specific surface area
ε: bed porosity
ηg: dynamic viscosity of the gas
ρg: density of the gas phase
u: gas velocity
This equation is assumed valid up to the transition point. For the fluidized bed however, a different
correlation is necessary. If the velocity is not significantly larger than the minimum fluidization
velocity, there is little chance of solid particles being entrained in the gas stream. Thus, the pressure
drop across the fluidized bed must be equal to the pressure exerted by the solid.
Page 22
10
(2.3)
h: bed height
ε: bed porosity
g: gravitational constant
A: cross section of the fluidized bed
ρg: density of the gas phase
ρs: density of the solid phase
At the transition point both equations (2.2) and (2.3) are valid. Therefore, they can be combined,
yielding equation (2.4):
(2.4)
εmf: bed porosity at minimum fluidization
υg: kinematic viscosity of the gas phase
SV: volume-specific surface area
ρg: density of the gas phase
ρs: density of the solid phase
g: gravitational constant
The problem with this approach is the volume-specific surface area SV. This area is defined as the ratio
of the external particle surface area to the total particle volume:
(2.5)
The pore surface area on the other hand is not taken into account, as it does not influence the hydraulic
resistance. This makes it impossible to determine SV with established surface measurement techniques.
Equation (2.4) does have its applications however. The point of minimum fluidization can be
determined experimentally on the lab scale with the above-mentioned method. Equation (2.4) is then
rearranged to calculate SV. Once the system is designed on an industrial scale, the parameter is then
available for calculations. Alternatively, changes in pressure, temperature or carrier gas can also be
carried out with reduced risk.
Page 23
11
2.2.2 Forms of fluidized beds
Depending on the volumetric flow rate, a bed of solid particles can exhibit various forms of behavior.
Once the fluid velocity increased beyond the point of minimum fluidization (Fig. 5A) the bed starts to
expand. When using a gas, this usually does not happen homogeneously. Instead, practically solids-
free bubbles begin to form (Fig. 5B). Owing to coalescence, these bubbles increase in size over the
length of the reactor. If the bed is sufficiently narrow and high, the entire cross section will be
occupied by gas slugs at one point (Fig. 5C). Naturally, this behavior is a lot more common in lab-
scale reactors than on an industrial scale. However, on every scale the amount of solids entrained in
the fluid becomes greater, if the velocity is increased further. In such a “turbulent” fluidized bed, the
amount of solids decreases continuously with increasing height but does not reach zero. Therefore, the
outlet stream must be separated into particles and gas (e.g. in a cyclone) if steady state is to be
achieved (Fig. 5D).
Fig. 5: Forms of a fluidized bed, from [45]
A further increase in fluid velocity leads to the formation of a circulating fluidized (Fig. 5E). Here the
average solids concentration reaches a minimum. Due to the extremely high solids entrainment an
efficient solids recycle system is required.
Page 24
12
2.2.3 Influence of particle characteristics
Besides the gas velocity, the particle characteristics also have a huge impact on the behavior of a
fluidized bed. According to Geldart [8] solids should be categorized into four empirically determined
groups with fundamental differences in their fluidization characteristics. These groups can be seen in
Fig. 6 where the density difference between gas and solid is shown over the median particle size.
Depending on the source, different boundaries between the individual groups have been proposed.
Fig. 6 Geldart diagram for powder classification, from [45]
Group C: All strongly cohesive powders belong in this group. These are usually smaller than 100 µm.
Besides the small size soft solids or irregular shape also contribute to the cohesiveness. The high
interparticle attraction results in poor mixing. In narrow tubes the powder will lift as a plug.
Otherwise, pronounced channeling will take place. Normal fluidization of these powders is extremely
difficult, reducing their appeal. Two possibilities to improve this exist. The bed can either be
mechanically mixed or type B solids added to the system.
Group A: Type A particles have found the most widespread application in fluidized beds (e.g.
fluidized bed crackers). Therefore, they have been studied extensively. Particles in this group either
have a small diameter (approx. 0.1 mm) and/ or low bulk density. Since the powders are slightly
cohesive, the bed expands considerably between minimum fluidization and the onset of bubble
formation. Even in the absence of bubbles the individual particles circulate rapidly through the
fluidized bed. Bubbles tend to grow by coalescence but split frequently, limiting their size. Due to the
gas storage capacity of the suspension the bed collapses rather slowly once the gas feed is turned off.
Page 25
13
Group B: Most materials of medium particle size and density fall into this category. Typical ranges are
sizes of 40 μm – 500 μm and densities of 1.4 * 103 – 4 * 103 kg/ m3. In contrast to Group A, the
interparticle forces can be neglected. Bed expansion is negligible with bubble formation starting more
or less immediately beyond umf. The bubbles are the main source of mixing in the bed and their growth
depends on the bed height and excess gas velocity. An upper size limit has not been reported. Due to
the high density, the bed collapses quickly in the absence of a gas stream.
Group D: Particles in Group D are relatively large and/ or heavy. This leads to a different mode of gas
exchange. In contrast to the previous groups, interstitial gas rises quicker than bubbles. Consequently,
gas flows in through the base of the bubble and out through the top. The mixing of solids is poor and
the flow around particles often turbulent. This can lead to rapid attrition with entrainment of the fines.
2.2.4 Reh diagram
The onset of fluidization can be described relatively easily. Beyond that a mathematical expression is
difficult. As shown in chapter 2.2.2 there are several different operating stages of a fluidized bed.
Additionally, chapter 2.2.1 gives a first impression of the number of parameters, which have an impact
on the behavior of the fluidized bed. To enable simple identification of the operating point, the so-
called Reh diagram was developed.
Fig. 7: Reh’s fluidized bed diagram with different operating regions: a) Circulating fluidized bed: b)
Fluidized bed roaster; c) Bubbling fluidized bed; d) Shaft furnace; e) Moving bed; from [45]
Page 26
14
In the diagram various parameters are combined into dimensionless numbers. This enables a relatively
quick determination of the operating point. It shows the fluid mechanical resistance of fixed bed,
fluidized bed or pneumatic transport as a function if the Reynolds number Rep. The parameters used in
this diagram are defined in the following fashion:
The resistance is a modified Froude number Fr’. The Froude number is defined as the ration of flow
inertia to external field, which in this case means gravity:
(2.5)
u: velocity of the gas phase
g: gravitational constant
dp: particle diameter
ρg: density of the gas phase
ρs: density of the solid phase
The Reynolds Rep number is defined as the ratio of momentum forces to viscous forces:
(2.6)
u: velocity of the gas phase
υ: kinematic viscosity of the gas phase
dp: particle diameter
Additionally, auxiliary grid lines are employed that display the Archimedes number Ar as well as the
Omega number M. The Archimedes number (ratio of gravity to viscous forces) is independent of the
fluid velocity. It can be seen as a characterization of the inherent properties of the gas-solid system.
(2.6)
dp: particle diameter
υ: kinematic viscosity of the gas phase
g: gravitational constant
ρg: density of the gas phase
ρs: density of the solid phase
Page 27
15
The Omega number on the other hand is independent of particle size. While the Archimedes number
can be seen as the cube of the dimensionless particle size, the Omega number represents the cube of
the dimensionless gas velocity:
(2.7)
u: gas velocity
υ: kinematic viscosity of the gas phase
g: gravitational constant
ρg: density of the gas phase
ρs: density of the solid phase
Lastly, the mean bed porosity ε is the state parameter in the fluidized bed region. Using this diagram
many practical questions can be answered. For example, knowledge of gas (ρf, ν) and solid properties
(ρs, g) along with the fluidization velocity u enables calculation of Ar and Rep. Thus the operating
point can be determined in the diagram and with it the average porosity of the fluidized bed. The fact
that all parameters are dimensionless has an additional advantage: When designing a new fluidized
bed system, the position of the operating point allows a comparison to previous experiments,
indicating potential operating problems.
2.2.5 Advantages and disadvantages
Fluidized bed reactors possess several advantages over other systems. Compared to other reactor types
(e.g. fixed-bed reactor) the large number of small particles provides a high surface area. Furthermore,
the mixing properties of the bed and the interaction of gas and solid are excellent. Consequently, not
only the heat and mass transfer between gas phase and particles is enhanced but also between gas
phase and the reactor internals. This leads to a near-uniform temperature profile throughout the bed,
even when dealing with strongly exothermic reactions. In the case of coking, the fluidized bed also
offers several possibilities for a continuous operation. Besides the TZFBR concept discussed in this
work a circulating fluidized bed can be used. The coke can then be burnt off outside of the reactor.
This mechanism can also be used to replace otherwise deactivated particles.
Naturally, disadvantages exist as well. The intensive mixing for example leads to a wide residence
time distribution. This can have a noticeable impact on both the rate of conversion and selectivity.
Furthermore, the constant agitation leads to attrition reducing the lifespan of both catalyst and reactor
Page 28
16
internals. This can be somewhat compensated by using an egg-white catalyst. However, the generated
fines must still be removed from the product stream. Changing the particle size can also change the
fluidization regime, irrespective of the integrity of the active phase. Consequently, the reactor must be
designed with sufficient attention to detail.
This design process is relatively intricate due to the scale-up methodologies available. The various
parameters do not only tend to be interrelated but also scale-dependent. The mixing of solids is a
prime example. The axial dispersion coefficient is directly proportional to the bed diameter. The ratio
of height to diameter, fines content and velocity influence this coefficient as well [30]. The mixing
also depends strongly on the bubble size and rise velocity, which depend strongly on the scale. If the
reactor is narrow enough for slug formation, their rise velocity will be half as big as for bubbles of the
same velocity [27]. Additionally, in small reactors solids are mainly transported upwards in the wake
of bubbles. On an industrial scale a toroidal “gulf stream circulation” dominates the mixing process
[30]. Imagining similar issues for the remaining operational parameters gives an impression of the
difficulty.
Design of fluidized bed reactors is usually a multi-step procedure with the process being performed in
a lab-scale, bench-scale and full-scale reactor. Within the different scales the actual dimensions must
be chosen with care as the transferability is strongly dependent on the limiting factor [38]. The actual
calculations can be carried out via two methods. Firstly, sets of dimensionless numbers can be used to
indicate hydrodynamic similarity. This approach has been used extensively in the past. Nevertheless, it
must be treated with caution as many important phenomena like wall effects and particle-particle
interactions are neglected [38]. Secondly, the behavior of the fluidized bed can be calculated via CFD.
The problem with this approach is the high computational power required to model the system.
2.3 Characterization methods
2.3.1 Determination of the surface area
The surface area of the catalyst is determined using the so-called BET theory developed by Brunauer,
Emmett and Teller for the adsorption of gases on solid surfaces [2]. The sample is cooled to 77K and
exposed to vacuum. Afterwards N2 is incrementally added to the system. At this temperature N2 is
partially adsorbed on the solid surface. The amount adsorbed can be determined as a function of the
pressure in measurement cell. The BET theory assumes that the gas is adsorbed in distinct layers. In
order to calculate the amount adsorbed as a function of the pressure several simplifying assumptions
are made. For example, any lateral interaction between the N2 molecules on the surface disregarded.
As the adsorbed amount of gas is proportional to the surface area the resulting equation enables the
Page 29
17
calculation of the surface area. Naturally, the simplifications mean that the resulting values should not
be seen as absolutes but rather as a means of comparing different surfaces.
2.3.2 X-ray crystallography
X-ray diffraction is used to obtain information about the crystal structure of the catalyst. The sample in
question is irradiated with x-rays. The distance between the individual planes in a crystal lattice is on
the same order of magnitude as the wavelength of the X-rays, i.e. 0.1 – 10 pm. Therefore, the beams
are diffracted. If X-rays hit the surface at an angle θ some of them will interact with the electron
clouds of the individual atoms and be diffracted at the same angle away from the solid. The remainder
will continue to the next lattice plane where the process repeats itself. The result is an optical path
difference in the diffracted rays. The optical interference will only be constructive, if the path
difference is equal to an integer number of wavelengths. Trigonometric correlations allow the
derivation of the Bragg equation. This allows the calculation of the interplanar distance.
(2.8)
d: interplanar distance
θ: angle between x-ray and surface
λ: x-ray wavelength
n: positive integer
2.4 Rate of conversion, selectivity and yield
The rate of conversion, selectivity and yield are calculated according to the following equations:
Rate of conversion X:
(2.9)
nButenes, in: amount of butenes entering the reactor
nButenes, out: amount of fed butenes species leaving the reactor
Page 30
18
Yield:
(2.10)
Yk: Yield of component k
nk, out: amount of component k leaving the reactor
nk,in: amount of component k entering the reactor
νk: stoichiometric coefficient for component k
νButenes: stoichiometric coefficient for butenes
Selectivity:
(2.11)
Sk: Selectivity towards component k
Yk: Yield of component k
X: Rate of conversion
The details of equation (2.9) must be stressed. It is possible that butenes isomerize instead of reacting
to non-butene species. In order to account for this, butene isomers that are not fed are treated as
products. Additionally, butenes are the only reactive hydrocarbon feed examined. A mixture of
butenes and n-butane is examined in this thesis. As butane does not react in a significant amount, the
equations can be used nevertheless.
Page 31
19
3 Experiments
3.1 Catalyst preparation
In total five different catalysts were synthesized. Four of these were bismuth molybdate catalysts. The
first three were supported catalysts with unsupported bismuth molybdate being examined as well. In
two cases the support was MgO. The last bismuth molybdate was impregnated on Al2O3. This support
was also employed for the fifth catalyst. Here the active phase consisted of a Mo-V compound,
however.
Incipient wetness impregnation was used as a method for all supported catalysts. In this method, the
pore volume of the solid is determined first. The precursor of the active phase is then dissolved in an
amount of water corresponding to the total pore volume of the available carrier. Due to capillary
forces, this solution fills all the available pores, ensuring an even distribution of the active phase.
For MgO the pore volume was determined by incrementally adding water to 0.5 g of dry MgO until it
was saturated with water. A weight comparison gave the amount of water required with the point of
saturation being determined visually. This method yielded a value of 0.6 mL/ g. The first catalyst has a
weight-based Mo load of 6% and a molar ratio of Mo:Bi of 1:1. Accordingly, 50 g of support require
5.52 g (NH4)6Mo7O24 · 4 H2O and 15.17 g of Bi(NO3)3 · 5 H2O. This catalyst will be referred to as
MgO-1 in the following. Due to difficulty in dissolving both compounds in the same pH range, the
impregnation had to be carried out in two steps. Consequently, the Mo salt was dissolved in 30 mL of
water and the support impregnated with it. After drying 27.3 g of water at a low pH value were
necessary for the second impregnation step. The catalyst was then dried overnight and calcined at 400
°C for 6 hours. Lastly, sieving was necessary to obtain the particles in the 160 – 250 μm range.
For the second MgO-based catalyst the objective was a molar Bi:Mo ratio of 2:1 with a higher
molybdenum load than the previous catalyst. Consequently, a weight-based load of 8.5% was chosen.
This requires 7.84 g of (NH4)6Mo7O24 and 43.07 g of Bi(NO3)3. To avoid the previous issues a
different impregnation approach was chosen: MgO was first calcined at 720 °C to avoid any negative
effects due to the carbon. For the solution the Bi(NO3)3 was dissolved in 161 mL of water and HNO3.
The (NH4)6Mo7O24 was dissolved in 46 mL of water. This was then slowly added to the first solution.
The very low pH value ensured that no molybdenum precipitates were formed. The carrier was then
repeatedly impregnated with the solution until saturation. After each step it was dried for 1 – 2 hours
at 110 °C. Lastly, it was calcined at 475 °C for 5 hours. This catalyst will be referred to as MgO-2.
The bismuth molybdate on Al2O3 was synthesized as a comparison to MgO-1. This required a weight-
based molybdenum load of 6% and a Bi:Mo ratio of 1:1. In total 45.18 g of support were used. As the
Page 32
20
pore volume was 0.8 mL/ g, this required 36.14 mL of water. Just as for MgO-1 a two-step
impregnation procedure was employed. The required 5 g of (NH4)6Mo7O24 were dissolved in a neutral
solution and applied first. After several hours of drying at 120 °C, 13.7 g of Bi(NO3)3 in acidic
solution were impregnated. Finally, it was calcined at 600 °C for 5 hours.
A pure bismuth molybdate was synthesized according to the procedure for γ-Bi2MoO6 in [17]. 30 g of
(NH4)6Mo7O24 and 164.85 g Bi(NO3)3 of were used, giving a maximum yield of 103.64 g. The used
quantities of water were 100 mL and 200 mL respectively. A solution of concentrated ammonia was
used to ensure a stable pH value when adding Bi(NO3)3. The precipitate was filtered and dried
overnight at 110 °C yielding 98.1 g of solid. This corresponds to a yield of 94.65%. Afterwards the
pure bismuth molybdate was pressed, ground and sieved to obtain particles for a fluidized bed. As in
the previous cases, the particles were in the range of 160 – 250 μm.
The molybdenum-vanadium catalyst was intended as a comparison to the catalysts examined in [35].
Consequently, the same amounts of precursors were used for 50 g of Al2O3: 6.53 g of (NH4)6Mo7O24
and 2 g of NH4VO3 · 6 H2O in 40 mL of water. The calcination temperature varied slightly however.
The catalyst was exposed to 700 °C for 8 hours.
3.2 Catalyst characterization
The catalysts were characterized via BET adsorption and X-ray diffraction (XRD). Using an
PANalytical X’Pert Pro powder diffractometer, the diffraction was measured between 20° and 80°
(2θ) using Cu Kα radiation (λ = 1.54 Å). The XRD patterns of the Al2O3-based catalysts did not
provide any useable information. The fluctuation of the signal was too strong to identify individual
peaks. Therefore, no statement on the composition of these catalysts can be made. The question of the
active phase of the catalysts using MgO as a support must be discussed in more detail. The spectra of
both used and unused MgO-based catalysts are shown in Fig. 8. Many non-MgO peaks are present for
both catalysts but more pronounced for MgO-2. This is in accordance with the larger quantity of
bismuth and molybdenum compounds applied to the second catalyst. The problem is that the XRD
patterns of all three bismuth molybdate forms possess peaks in similar ranges such as at 2θ = 28 °, 33 °
or 46 ° [6; 39]. Additionally, several peaks in Fig. 8 are quite broad in contrast to clearer peaks of the
pure bismuth molybdate in Fig. 9. Significant overlapping of peaks belonging to different bismuth
molybdates has been reported in literature [6; 39]. These peaks belonging to several phases have
shapes comparable to those at 28 ° in Fig. 8 (for both catalysts). The XRD spectra available in
literature focus on the range of 2θ ≤ 50°. Therefore, some of the peaks could not be attributed. The
presence of all three catalytically active bismuth molybdate phases cannot be ruled out on the basis of
the XRD patterns. However, the presence of β-Bi2Mo2O9 must be questioned. Thermal decomposition
Page 33
21
of β-Bi2Mo2O9 has been reported for temperatures as low as 420 °C [16]. Tests with these catalysts
were mainly carried out at 570 °C. Effects of the support on the thermal stability cannot be ruled out.
Nevertheless, this makes the existence unlikely. The reaction temperatures were significantly higher
than the calcination temperatures. Apparently, this had an effect on the structure of both catalysts.
Several peaks in the spectra of the used catalysts change their shape or split into several peaks.
Fig. 8: XRD patterns of both supported catalysts before and after usage
The XRD patterns of the pure bismuth molybdate before and after use are shown in Fig. 9. They
indicate the existence of γ-Bi2MoO6. It is in agreement with other documented XRD patterns of γ-
Bi2MoO6, for example [40; 17]. Additionally, the two XRD patterns shown in Fig. 9 are very similar.
The number and position of the peaks are the same before and after use. Their shape also only
undergoes a slight change at most. Consequently, it is unlikely, that the catalyst experienced
significant phase change during usage. In contrast to the MgO-based catalysts it was never exposed to
temperatures above the calcination temperature.
Fig. 9: XRD pattern of pure bismuth molybdate before and after use
Page 34
22
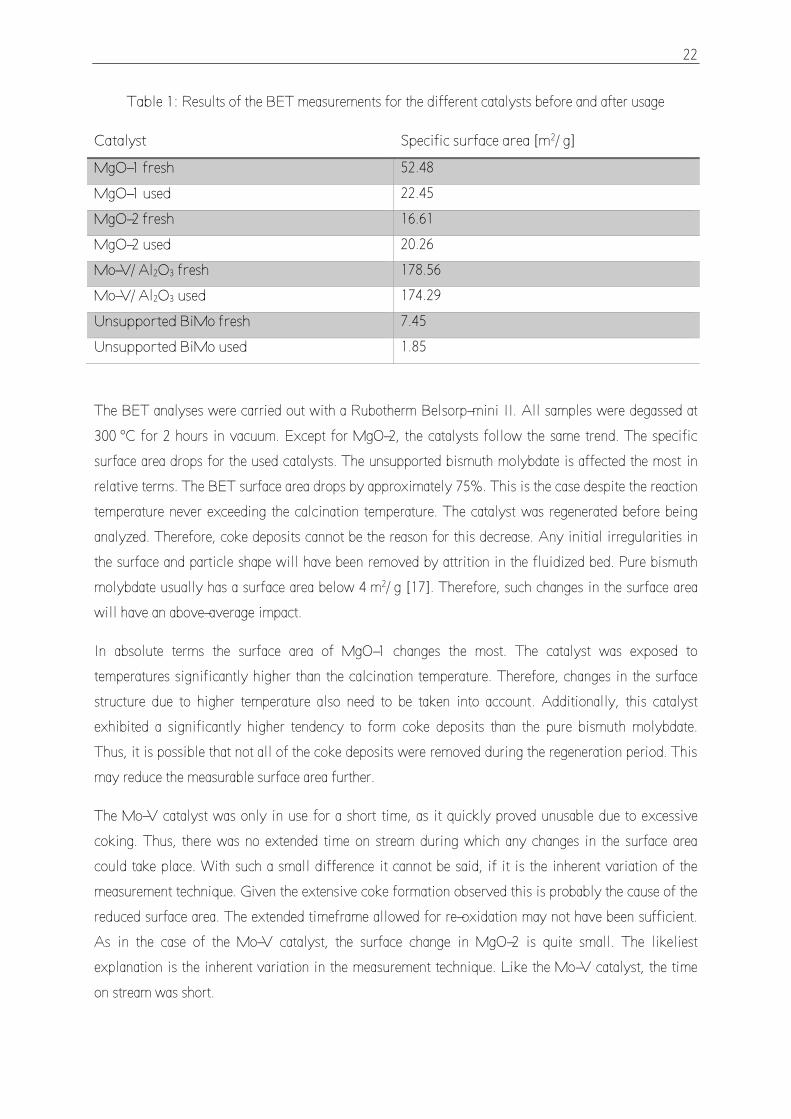
Table 1: Results of the BET measurements for the different catalysts before and after usage
Catalyst Specific surface area [m2/ g]
MgO-1 fresh 52.48
MgO-1 used 22.45
MgO-2 fresh 16.61
MgO-2 used 20.26
Mo-V/ Al2O3 fresh 178.56
Mo-V/ Al2O3 used 174.29
Unsupported BiMo fresh 7.45
Unsupported BiMo used 1.85
The BET analyses were carried out with a Rubotherm Belsorp-mini II. All samples were degassed at
300 °C for 2 hours in vacuum. Except for MgO-2, the catalysts follow the same trend. The specific
surface area drops for the used catalysts. The unsupported bismuth molybdate is affected the most in
relative terms. The BET surface area drops by approximately 75%. This is the case despite the reaction
temperature never exceeding the calcination temperature. The catalyst was regenerated before being
analyzed. Therefore, coke deposits cannot be the reason for this decrease. Any initial irregularities in
the surface and particle shape will have been removed by attrition in the fluidized bed. Pure bismuth
molybdate usually has a surface area below 4 m2/ g [17]. Therefore, such changes in the surface area
will have an above-average impact.
In absolute terms the surface area of MgO-1 changes the most. The catalyst was exposed to
temperatures significantly higher than the calcination temperature. Therefore, changes in the surface
structure due to higher temperature also need to be taken into account. Additionally, this catalyst
exhibited a significantly higher tendency to form coke deposits than the pure bismuth molybdate.
Thus, it is possible that not all of the coke deposits were removed during the regeneration period. This
may reduce the measurable surface area further.
The Mo-V catalyst was only in use for a short time, as it quickly proved unusable due to excessive
coking. Thus, there was no extended time on stream during which any changes in the surface area
could take place. With such a small difference it cannot be said, if it is the inherent variation of the
measurement technique. Given the extensive coke formation observed this is probably the cause of the
reduced surface area. The extended timeframe allowed for re-oxidation may not have been sufficient.
As in the case of the Mo-V catalyst, the surface change in MgO-2 is quite small. The likeliest
explanation is the inherent variation in the measurement technique. Like the Mo-V catalyst, the time
on stream was short.
Page 35
23
3.3 Experimental setup
A schematic of the apparatus used for this thesis is shown in Fig. 10. Since butadiene is a carcinogenic
and a mixture of butane and oxygen can explode the entire system has been set up under several
extractor hoods.
Fig. 10: Flow sheet of the lab set-up, from [35]
The centerpiece is the two-zone fluidized bed reactor, which consists of a quartz tube of 400 mm
length. This tube is subdivided into several sections. The section containing all the particles when in
use is 250 mm long and has an inner diameter of 28 mm. The particles rest on a type 0 frit (pore size
of 160 – 250 µm) when not fluidized. It should be noted, that a slightly modified reactor was also
employed. In this case, the frit was positioned 6 cm higher. This is useful when testing shorter
fluidized beds. In such cases the particles are positioned more in the center of the heating zone.
Page 36
24
Using mass flow controllers by Brooks and Bronkhorst, gas is fed into the reactor from several entry
points. H2, Ar/ He and O2 always enter the reactor from the bottom thus fluidizing the particles. These
gases are not preheated. Otherwise the seal in the flange connecting reactor and pipe would be
damaged. However, the gas stream spends a short time period in the heating zone before coming into
contact with the catalyst particles. The hydrocarbon is fed through a different inlet. This inlet is made
out of quartz as well. It extends into the reactor from the top and the hydrocarbons are then injected
horizontally into the fluidized bed. The height of the inlet itself is adjustable. This makes it possible to
optimize the ratio of reaction zone to regeneration zone. In case a normal fluidized bed is desired, it
would also be possible to feed hydrocarbons together with the other gases.
Two different feed gases were used for the experiments. The first hydrocarbon feed was a mixture of
butene isomers, namely 50% but-1-ene and 50% trans-but-2-ene. Secondly, an artificial C4 raffinate-2
(C4R2) was employed. This mimics the conditions encountered in the chemical industry. The raffinate
consisted of 26.5% n-butane, 28.6% trans-butene, 23.8% cis-butene and 21.1% 1-butene. Heat for the
reaction zone is provided by a hinged furnace extending slightly beyond the reaction zone. The
furnace was custom-made for this reactor by HTM-Reetz GmbH. A type K thermocouple provides the
connection to the reactor. An identical thermocouple is integrated into the furnace and the temperature
regulated with an OMRON E5CN-H control element. Once the product stream leaves the reactor at the
top, it must be cooled to prevent further reactions. Additionally, the newly formed water will
condensate and can be removed in a water trap. To avoid excess pressure within the apparatus a
manometer is installed behind the cooling unit. Before continuing to the analytics unit, the gas stream
passes through a glass wool filter to remove any entrained catalyst particles.
The analytics unit is a gas chromatograph (Trace GC 1310 by Thermo Fischer). The components in
the mixture are identified by two different columns in the chromatograph. Column 1 is 2 m in length
and uses a type 5A molecular sieve to separate H2, CO and O2 from each other. They are then
identified using a thermal conductivity detector. Here one needs to distinguish between the possible
carrier gases. Argon and oxygen have a similar thermal conductivity. If the oxygen concentration is of
interest, it is essential to use helium as a carrier gas. The second column separates all aliphatic, non-
cyclic hydrocarbons in the C1-C6 range. It consists of Al2O3 and is 50 m in length to ensure complete
separation. The different components are lastly identified with a flame ionization detector (FID).
Samples are taken from the gas stream leaving the reactor. After passing the manometer the product
stream is split into two streams. One passes through the GC to analyze the composition. The main
stream is directly conveyed to a burner to avoid the discharge of toxic gases. It is also possible to
modify this setup to take samples from within the bed with a probe. This modified setup is described
in [36].
Page 37
25
3.4 Experimental procedure
When testing the supported catalyst MgO-1 the reactor was filled with 35.5 g of catalyst. This
corresponds to a fluidized bed of approximately 8.5 cm height at operating conditions. At a
temperature of 570 °C a minimum flow rate of 0.18 SLPM is necessary to achieve fluidization. All
flow rates for MgO-based catalysts will be given in relation to this value. The first parameter
examined was the temperature. The constant operating conditions were the total volume stream
(relative velocity of ur = 1.9), butene and oxygen content (5.5 and 12 vol.-% respectively) as well as
the inlet height (6.5 cm above the frit). Starting at 420 °C the temperature was increased in steps of 30
°C with the maximum temperature being 600 °C. For each temperature samples were taken with the
GC until a steady signal was achieved. The minimum waiting time between adjusting the conditions
and taking a fresh sample were five minutes.
The influence of the inlet height was determined twice under different operating conditions. The first
time, the other parameters were set at the same values mentioned above. These experiments were
conducted at 570 °C. The inlet position was varied between directly over the frit and 7.5 cm above it.
The second time, the flow rate was set at ur = 2.8 and the gas concentrations at 6% butenes and 11%
oxygen. The catalyst was prone to form coke deposits during the experiments. If coking was detected,
the catalyst was regenerated after each set of measurements with an argon/ oxygen stream with the
ratio of 4:1. This was continued until the concentration of CO2 in the outlet stream dropped below
0.5%.
The experiments on oxygen dependence were conducted at 570 °C, 5.5 vol.-% butene with a total
volume stream of ur = 1.9 and a butene inlet height of 6.5 cm. The oxygen content was varied in steps
of 1 vol.-% in the range of 9 – 12 vol.-%. Additionally, samples were taken for an oxygen content of 7
vol.-%. Steady state could not be reached for lower oxygen contents. In this case, the values were
taken after 150 minutes on stream and the carbon balance being within ±5% of closing. When varying
the volumetric flow, the inlet height was adjusted to ensure a similar contact time of the hydrocarbons
in the fluidized bed. This was calculated based on the superficial velocity. The inlet heights and the
height of the fluidized bed are shown in Table 2. The remaining parameters were set at 570 °C, 6%
butenes and 11% oxygen.
Page 38
26
Table 2: Inlet heights used for the different relative velocities
Relative flow rate ur Bed height [cm] Inlet height [cm]
1.1 7.5 6.3
1.7 8.1 6.3
2.2 8.1 5.8
2.8 8.1 5.5
In principle, a similar procedure was used for the pure bismuth molybdate. The total catalyst mass of
78.4 g in the reactor ensured a fluidized bed of 6 cm height at operating conditions. At 450 °C
0.51 SLPM were necessary to guarantee fluidization. The temperature was varied while operating with
a relative volume stream of ur = 1.1, 5.5 vol.-% butene and 12 vol.-% O2. The inlet height was fixed at
3.5 cm. The temperatures examined are in the range of 350 – 470 °C. As with the previous catalyst,
samples were taken until steady state was achieved with a minimum waiting time of 5 minutes before
the first sample was taken. A temperature of 450 °C was used for optimizing the butene inlet height.
The total volume stream and its composition were left unchanged. The height was varied in steps of
1 cm between 0 and 6 cm. In contrast to the supported catalyst, no re-oxidation steps were necessary
when carrying out these experiments.
Oxygen dependence was determined with the remaining parameters being set at 450 °C, ur = 1.1,
5.5 vol.-% butene and an inlet height of 4 cm. The oxygen content was varied in the range of
3 -12 vol.-% in steps of 1%. The only exception was the oxygen content of 7 vol.-%, which was not
investigated. Only at oxygen ratios below 5 vol.-% did the catalyst show any signs of coking.
Therefore, after these experiments the catalyst was regenerated with an argon/ oxygen stream (ratio of
4:1). Nevertheless, steady state could be reached for all examined values. The influence of the flow
velocity was investigated at a temperature of 450 °C, an inlet height of 4 cm and a gas composition of
5.5 vol.-% butenes and 5 vol.-% oxygen. The relative velocities examined are ur = 1, 1.1, 1.3 and 1.5.
When using C4R2 as a feedstock the inlet height was the variable process parameter. The remaining
operating conditions were set at the optimized conditions determined during the experiments with
butene. This means a temperature of 450 °C and flow rate of 0.553 SLPM. The inlet stream of
hydrocarbons amounted to 5.7 vol.-%. The oxygen/ butenes ratio was kept at the optimized value of
0.9. Consequently, 3.7 vol.-% oxygen were fed. The height was varied in 1 cm steps in the range of
2 -5 cm above the frit.
MgO-2 was tested at the optimized conditions for MgO-1, i.e. 570 °C, ur = 1.9, 5.5% butenes and 11%
oxygen. A total bed height of 9 cm was achieved with 37 g of catalyst. Consequently, the inlet was
positioned 7 cm above the frit. When testing the bismuth molybdate supported on Al2O3, the reactor
contained 27.6 g of catalyst, which led to a fluidized bed of 9 cm height at operating conditions. The
Page 39
27
performance of the catalyst was tested at 500 °C and 520 °C. The inlet was positioned 8.5 cm above
the frit and the volumetric flow rate set at 0.34 SLPM. This is the same velocity as used for MgO-1
and MgO-2. Inlet concentrations of 5.5% butenes and 11% oxygen were used. The Mo-V catalyst was
tested at 550 °C using n-butane as a hydrocarbon. The inlet concentration was set at 6% with 10%
oxygen with a volumetric flow rate of 0.2 SLPM. In total 25 g of catalyst were used and the inlet
height fixed at 7 cm in an 8 cm bed.
Excerpts from chromatograms are shown in Fig. 11. Both excerpts are from channel 2 of the GC and
focus on the isomers trans-butene and 1-butene. The problem is that at higher concentrations the 1-
butene peak overlaps with the trans-butene peak. This makes quantitative statements on the relative
reactivity unfeasible for low rates of conversion. As can be seen in Fig. 11, the peaks are separated if
the conversion is sufficiently high. Thus, when neglecting isomerization a first estimate of the relative
reactivity is possible at high conversion.
Fig 11: Two exemplary excerpts from chromatograms at low (left) and high conversion (right),
showing the overlap of the trans-butene and 1-butene peaks
Page 40
28
4 Experimental results
4.1 Supported catalysts
While the results for all supported catalysts are described in this chapter, the first four subchapters deal
exclusively with catalyst MgO-1. It must be mentioned that using MgO-1 as a catalyst caused
difficulties during operation. The valve regulating the split ratio between the gas streams to the GC
and the burner had to be adjusted continuously to avoid pressure build-up. The glass wool filter was
replaced frequently, eliminating the possibility of this being due to catalyst particles being transported
through the pipes. The densities of the supported catalysts were not determined.
Before the tests described below were carried out, MgO-1 was used in the oxidative dehydrogenation
of n-butane. The results were such that they do not need to be described in this thesis. The important
aspect is, however, that the catalyst was exposed to temperatures up to 640 °C during these tests.
These temperatures were not necessary when using butene feeds. Therefore, this must be kept in mind
as the pre-conditioning temperature instead of the 400 °C calcination temperature.
4.1.1 Temperature influence
Figure 12 shows the temperature influence on conversion and the selectivity to butadiene, carbon
oxides as well as cis-butene. The selectivity towards crack products is almost negligible with a
maximum of 1.4%. Thus, they are not shown in the graphs. The temperature has a significant
influence on all parameters shown in the graphs. The total conversion increases from 31.5% to 81.2%
at 570 °C. cis-Butene plays an important role for low temperatures. At 420 °C the selectivity is
equivalent to 18.2% but drops considerably with increasing temperature. Starting at 540 °C it accounts
for less than 5%. The selectivity towards carbon oxides is also reduced with increasing temperature
but not to such an extent. From an initial value of 69.8% it drops to a continuously to 43.6% at 570°C.
Afterwards however it starts to increase again.
Page 41
29
Fig. 12: Conversion and selectivity as a function of the temperature; reaction conditions: ur = 1.9,
hinlet = 6.5 cm, O2/ butenes ratio: 2.2
The selectivity to 1,3-butadiene behaves inversely. Starting at 11.5% it grows with increasing
temperature. For a temperature of 570°C the maximum value of 52.1% is reached. This results in the
maximum yield of 42.3%. In contrast, the butadiene yield at 420 °C is only 3.6% Consequently,
570 °C can be deemed the optimum reaction temperature. All further experiments with this catalyst
were carried out at this temperature.
4.1.2 Height influence
During the measurements with a flow rate of ur = 1.9, the fluidized bed was approximately 8.5 cm
high. The experiments with a flow rate of ur = 2.8 were carried out at a later date. In the meantime,
attrition during operation led to a bed of 8.1 cm height. Starting at the top the butene inlet was moved
through the entire bed. The results differ significantly between the two experiments.
Setting the volumetric flow rate at ur = 1.9 leads to a small influence of the inlet height. The rate of
conversion increases by 19.3% if the inlet position is changed from 7.5 cm above the fluidized to
6.5 cm. A further reduction of the distance between frit and inlet has a negligible effect. The rate of
conversion does not differ by more than 3% from the 79.8% achieved at 6.5 cm height. A similar
Page 42
30
behavior is observed for the selectivity. For an inlet height of 7.5 cm the selectivity towards carbon
oxides is 33.7%. At all lower inlet positions, it assumes values of 40±1%. The cis-butene selectivity
shows an almost corresponding drop from 7.1% to 3% in the first cm. Afterwards it increases again
and oscillates in the range of 4 – 6%. Butadiene is an exception, as the selectivity at 6.5 cm practically
does not vary from 56.6% achieved at 7.5 cm. The following changes in selectivity are in the same
range as with cis-butene. After dropping to 50.7% it fluctuates at 52.4±1%. The highest butadiene
yield of 44.9% was measured at 6.5 cm. Consequently, this was used in further experiments.
Fig. 13: Conversion and selectivity as a function of the inlet height; reaction conditions: T = 570 °C,
left: ur = 1.9, O2/ butenes ratio: 2.2; right: ur = 2.8, O2/ butenes ratio: 1.8
The change in parameters causes the rate of conversion to drop considerably. Positioning the inlet
7.5 cm above the frit leads to a rate of conversion of 47.0% for ur = 2.8. It rises to 70% at 6.5 cm and
then drops to 60.2% at 5.5 cm. A further reduction of distance between the inlet and the frit does not
have an influence on the rate of conversion. For inlet heights of 5.5 cm and lower significant coking of
the catalyst can be observed.
Like the rate of conversion, the selectivity stays constant in the 2.5 – 5.5 cm height range, but varies
for greater distances to the frit. The selectivity towards butadiene starts with a value of 50.0% at
7.5 cm. As before, a similar value is determined at 6.5 cm. The following changes in height have an
influence with a drop of 4% at 6 cm. Lowering the inlet by another 0.5 cm reduces the value to 33.8%.
The selectivity towards carbon oxides on the other hand increases continuously between 7.5 cm and 6
cm from 34.8% to 42.6%. As with butadiene the next 0.5 cm height difference have a big impact. The
selectivity now reaches 55.5%. The near-constant value of 10.2% at 6 cm height for cis-butene is a
deviation from this trend. The overall behavior is qualitatively similar to ur = 1.8. The absolute values
Page 43
31
are greater by slightly above factor two. The minimum selectivity to cis-butene at 6.5 cm has a value
of 8.3% with 14.4% at 7.5 cm.
4.1.3 Influence of the oxygen content
The influence of the oxygen content was examined for the first set of parameters used during the
height optimization. Figure 14 shows the influence of the oxygen content on the reaction.
Fig. 14: Conversion and selectivity as a function of the oxygen content; reaction conditions:
T = 570 °C, ur = 1.9, 5.5% butenes, inlet height: 6.5 cm
The relationship between oxygen content and rate of butene conversion can be separated into two
trends. For an oxygen to butenes ratio of 1.8 – 2.2 the rate of butene conversion stays almost constant
with a slight peak at 2. Less oxygen causes a drop in the conversion from 80.8% at its peak down to
62.7% at a ratio of 1.3. The effect of the oxygen content on the selectivity is different for all three
products. The selectivity towards cis-butene increases almost continuously for lower oxygen levels.
For a ratio of 2.2 it is negligible with a value of 3% rising to 9.6% once the ratio is 1.3.
The selectivity towards butadiene does not show such a clear tendency. As with cis-butene there is a
slight increase from 56.3% to 60.0%, when the oxygen to butenes ratio is reduced from 2.2 to 2. While
Page 44
32
a reduction of the ratio to 1.8 has no effect on butadiene, a further drop to 1.6 does. It decreases again,
reaching a value of 53.5% and stays at this level for an oxygen content of 7% (ratio of 1.3). In the case
of carbon oxides, a differentiation is necessary as well. For ratios of 1.6 – 2.2 the selectivity stays
nearly constant at 34 – 35%. Outside of this range, however, lower oxygen levels cause the selectivity
to drop. At a ratio of 2.2 a carbon oxides selectivity of 39.8% is achieved, while 7% oxygen (1.3) lead
to a value of 26.9%. For the ratios of 1.3 – 1.6 coking becomes a bigger issue. This is noticeable as the
total sum of the selectivity to the three products differs significantly from unity. The carbon balance
does not add up either anymore. As shown in Fig. 15, it is still possible to obtain a relatively steady
composition of the gases leaving the reactor. Nevertheless, the lack of carbon products leaving the
reactor poses the question in how far this can be considered steady state.
Fig. 15: Time on stream; reaction conditions: T = 570 °C, ur = 1.9, hinlet = 6.5 cm, O2/ butenes
ratio = 1.3
4.1.4 Influence of the volumetric flow rate
The change in flow rate has a major influence on the reaction. The trends in Fig. 16 can be divided
into several areas. At a relative flow of ur = 1.1 the rate of conversion is equivalent to 77.5% with a
31.8% selectivity towards carbon oxides. The butadiene selectivity is at 57.7% and the cis-butene
selectivity at 9.5%. Increasing the gas stream to ur = 1.7 has little impact. The rate of conversion, the
Page 45
33
carbon oxides selectivity and the selectivity to butadiene increase by approximately 2% with a
corresponding drop for cis-butene.
A further increase in the flow to ur = 2.2 changes the trend considerably. The rate of conversion and
the butadiene selectivity drop to 63.8% and 38.5%. On the other hand, the selectivity towards carbon
oxides increases to 51.9%. The change in operating parameters has little effect on cis-butene. At
ur = 2.2 the selectivity only increases to 8.9%. A further increase in the volumetric flow rate to ur = 2.8
has the same qualitative influence. The butadiene selectivity and the rate of conversion shrink whereas
the selectivity towards carbon oxides and cis-butene grows. The changes are considerably smaller
however. At this velocity, the rate of conversion assumes a value of 60.2% with a butadiene selectivity
of 33.9%. The selectivity to carbon oxides and cis-butene reaches 55.5% and 10% respectively.
Fig. 16: Variation of the volumetric flow rate with an adjusted inlet height; operating conditions:
T = 570°C, O2/ butenes ratio = 1.8
4.1.5 Comparison of MgO-1 and MgO-2
In order to enable a comparison between MgO-1 and MgO-2, experiments were carried out at similar
conditions. The 37 g of MgO-2 used led to a fluidized bed of 9 cm height at operating conditions.
Consequently, the butenes inlet was positioned 7 cm above the frit. Initially, the temperature was set at
450 °C and increased in steps of 25 °C. However, these tests proved unsatisfactory and the optimum
Page 46
34
conditions established for MgO-1 were used to enable a comparison. The behavior of both catalysts at
optimized conditions can be seen in Fig. 17.
Fig. 17: Comparison of MgO-1 and MgO-2; reaction conditions: T = 570 °C, ur = 1.9, O2/ butenes
ratio: 2, inlet height: 6.5 cm (left) and 7 cm (right)
The results obtained with MgO-1 are significantly better than those of MgO-2. A rate of conversion of
80.8% can be achieved, compared to 67.7% for MgO-2. Additionally, the selectivity obtained with
MgO-1 is better as well. The selectivity towards 1,3-butadiene amounts to 60% for MgO-1, compared
to 46.3% for MgO-2. Similarly, the selectivity towards carbon oxides assumes a value of 33.9% for
MgO-1, whereas it is 45.8% for MgO-2. Most of the amount missing to reach unity is accounted for
by cis-butene. To enable a better overview, these values were left out of the graph.
4.1.6 Catalysts supported on Al2O3
In the case of the molybdenum vanadium catalyst, no useable gas composition can be obtained. The
catalyst was subjected to significant coking. At no time were noteworthy amounts of non-butane
hydrocarbons detectable in the outlet stream. Due to the excessive coking the contact time was
reduced when testing the bismuth molybdate supported on Al2O3. The first experiments at different
temperatures showed results comparable to MgO-1 with moderate amounts of coke formation. After
several hours on stream the behavior became less suitable. Even at very short contact times noticeable
Page 47
35
amounts of coke were formed. Stable operation was possible in the range of 500 – 520 °C. While the
conversion is comparable to MgO-1 at the same temperature, the selectivity to butadiene is
approximately 40% lower. Tests at higher temperatures lead to rapid deactivation as with the Mo-V
catalyst.
4.2 Unsupported BiMo catalyst
The behavior of the unsupported catalyst is described in this chapter. First, the optimization process is
carried out, using butene isomers as a feedstock. Afterwards, the results obtained with a C4R2 feed are
analyzed and compared to the previous results. The minimum gas stream necessary for fluidization
was 0.51 SLPM. This speed was necessary due to the high density of pure bismuth molybdate of
ρ = 7.4 g/ cm3.
4.2.1 Temperature dependence
Due to the early onset of visible coking when using MgO-1, a high oxygen to butenes ratio was used at
first. Therefore, the results seen in Fig. 18 were generated for a ratio of 2.2. As in the case of supported
bismuth molybdates, three products exist: 1,3-butadiene, carbon oxides and cis-butene. The influence
of the temperature on the selectivity to the three products is more pronounced at lower temperatures.
At 350 °C the selectivity towards cis-butene assumes a value of 18.7%. However, it drops
continuously with temperature. Above 425 °C cis-butene can be neglected as a product since the
selectivity accounts for less than 5%. In the range of 350 – 425 °C the reduction of cis-butene
selectivity is accompanied by an increase in the selectivity towards butadiene. Starting at 69.0% it
increases to 80.1% at 425 °C. The butadiene selectivity does not increase further for higher
temperatures, however. The selectivity towards carbon oxides increases continuously over the entire
range examined. Compared to the other product groups the changes are relatively small. Over 120 °C
the selectivity only increases by 4.5% to 16.6%.
The temperature has a big impact on the rate of conversion as well. The initial value of 49.6%
increases to 83.4%. A further temperature increase by 20 °C only leads to an improvement of slightly
above 1%. Consequently, the yield of butadiene grows by a comparably small amount. As Jung et.al.
determined that higher temperatures have negative impact on the catalyst, these were not examined
[22]. For the same reason further experiments were carried out at 450°C. The reaction is quite
exothermic. This led to an oven temperature that was noticeably below that of the reactor.
Page 48
36
Additionally, the catalyst is a poor heat conductor. If the thermocouple is not correctly positioned in
the reaction zone and the temperature set at 470 °C this can lead to a maximum local temperature
above the 475 °C optimal for the catalyst. Without additional optimization steps the selectivity
towards butadiene is still worse than the results achieved by Jung et.al. [17]. However, the yield of
67.1% already surpasses that achieved in a fixed-bed reactor.
Fig. 18: Temperature effects using unsupported BiMo as a catalyst; reaction conditions: flow velocity
ur = 1.1, hinlet = 3.5 cm, O2/ butenes = 2.2
4.2.2. Influence of the inlet height
In a second step the height of the butenes inlet was optimized. Fig. 19 shows that the inlet height has
the biggest influence on the rate of conversion. It increases continuously the closer the butenes inlet is
to the frit. The biggest effect takes place at the upper end of the fluidized bed between 5 and 6 cm.
14.2% of the fed butenes are converted in the latter case. This figure jumps to 77.1% once the inlet is
moved downwards by 1 cm. The upper end of the fluidized bed is in perpetual movement.
Additionally, the inner diameter of the butenes inlet is quite small. These two facts make it impossible
to specify to what degree the reactant is in contact with the catalyst at a height of 6 cm.
Page 49
37
Moving the inlet closer to the frit than 5 cm leads to a considerable decline in the growth rate of the
conversion. In the range of 3 – 4 cm the rate of conversion only increases by 2%. Between 1 cm and
2 cm this tendency is even more pronounced with values of 94.8% in both cases. However, positioning
the butenes inlet directly above the frit causes a stronger increase in the rate of conversion. It assumes
its maximum value of 97.7% for this inlet position.
Fig. 19: Influence of the inlet height for unsupported bismuth molybdate; reaction conditions:
T = 450 °C, flow velocity ur = 1.1, O2/ butenes = 2.2
Positioning the inlet directly at the top of the fluidized bed differs slightly from the remaining inlet
positions. While cis-butene can be neglected as a product at lower heights (selectivity lower than 3%),
it must be taken into account at 6 cm due to a selectivity of 8.1%. Between 6 cm and 5 cm the
butadiene selectivity increases marginally from 80.8% to 82.3%. The selectivity towards carbon
oxides increases from 10.8% to 14.1% but still on a similar scale. For lower heights the selectivity
develops in opposite directions for the two products, however. Between 4 cm and 5 cm the selectivity
towards carbon oxides jumps by 7% with an equivalent decrease in 1,3-butadiene selectivity. From a
height of 5 cm downwards, the changes in carbon oxides selectivity qualitatively resemble the changes
in rate of conversion. The changes cannot be compared in quantitative terms. Nevertheless, the
sections of 1 – 2 cm and 3 – 4 cm height are quite distinctive. Here both selectivity and rate of
conversion remain almost constant. Positioning the butenes inlet below 1 cm has a bigger impact on
the selectivity than it does on the rate of conversion. In this range the selectivity towards carbon oxides
Page 50
38
increases by 7.5%. The 1,3-butadiene selectivity on the other hand drops by 6.3%. %. During the
experiments coking could not be observed for any inlet height. This refers both to visible coking as
well as a carbon balance that deviates from unity. The yield at 4 cm is superior to that at 5 cm.
Therefore, 4 cm were chosen as the height for further experiments, despite the higher selectivity at
5 cm.
4.2.3 Influence of the oxygen content
Fig. 20: Variation of the oxygen content; reaction conditions: T = 450 °C, flow velocity ur = 1.1,
hinlet = 4 cm
With the height of the butenes inlet fixed at 4 cm, the oxygen content was continuously reduced,
starting at 12%. The results are shown in Fig. 20. The inlet concentration has little influence on the
rate of conversion. For oxygen to butenes ratios of 2.2 – 0.9 the values vary between 86.2% and
83.8%. However, once the oxygen content is reduced further, the rate of conversion drops quickly. A
ratio of 0.7 already reduces the rate of conversion to 74.1%, while it reaches 54.1% at a ratio of 0.5. A
steady signal could be obtained and the carbon balance did not deviate from unity for all oxygen
concentrations examined. Nevertheless, first signs of coking appeared for oxygen to butene ratios
below 0.9. These low oxygen levels led to a noticeable darkening of the catalyst without affecting the
Page 51
39
performance of the catalyst. The effect of the oxygen content can be seen when examining the
selectivity. In the range of 2.2 -0.9 the selectivity towards 1,3-butadiene increases monotonically with
a dropping oxygen content. After reaching the maximum value of 86.7%, it drops slightly to 80.3% for
a ratio of 0.5. The carbon oxides selectivity behaves in the inverse manner, with a minimum value of
9.9% at a ratio of 0.9 and 12.4% at near stoichiometric conditions.
4.2.4 Variation of the volumetric flow rate
Fig. 21: Variation of the volumetric flow rate; reaction conditions: T = 450 °C, hinlet = 4 cm,
O2/ butenes ratio = 0.9
Figure 21 shows that the volumetric flow rate only influences the rate of conversion. The selectivity
towards butadiene and carbon oxides stays constant for ur = 1 – 1.5. The rate of conversion on the
other hand initially increases by 1.5% to 83.8%. Once the volumetric flow rate is increased beyond
ur = 1.1 it starts to drop. Consequently, the relative volumetric flow of ur = 1.1 used in the previous
experiments is the optimum value. The optimized operating conditions for the unsupported catalyst are
a temperature of 450 °C, an inlet height of 4 cm in a 6 cm bed, an oxygen to butenes ratio of 0.9 (5%
oxygen, 5.5% butenes) and a relative velocity of ur = 1.1. At these values a rate of conversion of
83.8% and a selectivity towards butadiene of 87.9% are achieved. When comparing these values to
Page 52
40
those obtained by Jung et.al., the different concentrations must be acknowledged. In the fixed-bed
reactor the ratio is butenes: oxygen: steam = 1:0.75:15. However, oxygen is provided by air with
nitrogen as a carrier gas. Furthermore, a C4R2 raffinate is used. In this hydrocarbon mixture, butenes
only account for 72.5% with n-butane being the only other significant component. Since n-butane is
inert under these conditions it can be seen as a diluent. Assuming an oxygen concentration of 20% in
air, the butenes concentration in [17] is 3.7%.
4.2.5 Using C4R2 as a feedstock
Fig. 22: Variation of the inlet height with C4R2 as a feed; reaction conditions: T = 450 °C, flow
velocity ur = 1.1, O2/ C4R2 ratio = 0.7
The qualitative effects of the inlet height on the conversion and selectivity are the same as in chapter
4.2.2. In quantitative terms however, the inlet position has much less influence on the course of the
reaction than during the previous height optimization. The values for the rate of conversion are more
than 10% lower at inlet heights of 4 cm and 5 cm than the values reached when feeding pure butenes.
The rates of conversion at 3 cm and 2 cm are more comparable to the results of chapter 4.2.2 but still
3 – 4% lower. Similarly, moving the inlet closer to the frit still reduces the selectivity towards 1,3-
butadiene and increases the selectivity towards carbon oxides. Nevertheless, the values of the
Page 53
41
selectivity are noticeably different. The selectivity towards butadiene does not only start at a value of
91.7% at 5 cm compared to 85.2% earlier. Additionally, it also decreases by only 4.6% between
2 cm – 5 cm. When using pure butenes, the difference over the same range amounted to 13.4%.
Similarly, the selectivity to carbon oxides is much lower. The maximum selectivity measured for the
C4R2 feed was 11.9% with the starting point being 8.2%. Over the same range values of 14.1 – 26.9%
were documented in chapter 4.2.2. In contrast to chapter 4.2.2 first signs of coking were detected for
hinlet = 2 cm. The catalyst started to become slightly darker as described in chapter 4.2.3. In this case
the onset of coking did not have any effect on the behavior of the catalyst either.
When describing these differences, it is important to note the differences in reaction conditions. In
contrast to the pure butenes, the C4R2 contains 26.5% n-butane. The n-butane did not exhibit any
tendency to react when exposed to the conditions within the reactor. At the same time, the inlet
hydrocarbon concentration is slightly higher than for pure butenes (5.7% instead of 5.5%). These two
factors reduce the amount of reactant by 23.8%. Additionally, the reaction was carried out at quite lean
conditions. Since the n-butane is practically inert under these conditions, an O2 concentration of 3.7%
was chosen. This value corresponds to an oxygen to butenes ratio of 0.9. Thus, the optimal parameter
determined in previous experiments is implemented again.
In contrast to chapter 4.2.2, an inlet height of 3 cm can be determined as the optimum value. When
comparing the optimum values of yield and selectivity for the different feeds the inlet concentrations
of reactant must be remembered. While the selectivity towards 1,3-butadiene is comparable with
88.5% (C4R2) and 89.7% (butenes), the yields vary. The optimum result in chapter 4.2.3 was a value
of YBD = 73.6% in contrast to the 78.8% determined here. Since the inlet concentration of butenes is
larger when feeding pure butenes, the outlet concentration of 1,3-butadiene is greater in this case as
well.
Although the different butene isomers are not fed in equal amounts a first estimate of the relative
reactivity is possible. As already indicated in Fig. 11 in chapter 3.4, 1-butene displayed a higher
reactivity than trans-butene, irrespective of the catalyst. This observation is in agreement with
previously published results. The conversion of C4R2 is sufficient to distinguish between 1-butene and
trans-butene. Since the inlet concentrations are known, the degree of conversion can be determined.
Since the rates of isomerization are unknown, this can only be considered a first estimate. Irrespective
of the inlet height, 1-butene is significantly more reactive than 2-butene. Additionally, cis-butene is
slightly more reactive than trans-butene. This is a contradiction of the order reported by Jung et.al. of
1-butene > trans-butene > cis-butene [17]. In both cases a mixture of butene isomers was used and the
compositions of outlet and inlet stream compared.
Page 54
42
5 Discussion
5.1 Supported catalysts
5.1.1 Influence of the reactor temperature
The temperature dependence of selectivity of the supported bismuth molybdate is unexpected. Many
previous examinations of temperature influence on the behavior of bismuth molybdates showed a
constant selectivity, e.g. Jung et.al. [17]. The only reason the selectivity shown in chapter 4.2.1 is
temperature-dependent, is the manner of calculation. If cis-butene were not considered a product, the
selectivity towards all products would be constant for the pure bismuth molybdate. Since Jung et.al.
fed all three butene isomers, they could not account for isomerization and used this manner of
calculation. Consequently, any influence of the TZFBR concept on this behavior can be ruled out
immediately and the cause must be the catalyst. Here several different possibilities must be examined.
Firstly, the active phase consists of several different bismuth and molybdenum compounds. Vieira
Soares et.al. examined the behavior of a mixture of β-Bi2Mo2O9 and γ-Bi2MoO6 in the ODH of 1-
butene. Their results show an influence of the temperature on the selectivity towards butadiene and
cis-butene. This temperature dependence is itself dependent on the catalyst composition [44].
However, in all cases the effect is significantly smaller than described in chapter 4.1.1. Additionally,
the selectivity towards carbon oxides stays constant over the examined temperature range. Mixtures
also do not require temperatures in a different range than for pure bismuth molybdates. In contrast the
MgO-based catalysts achieve their optimal results at a temperature of 570 °C.
Secondly, the MgO support may play a role as well. The lack of literature discussing supported
bismuth molybdate prevents a definitive statement on this matter. The closest comparison available are
the experiments by Rischard et.al. with a Mo-V catalyst on MgO [36]. The oxidative dehydrogenation
of butenes in a TZFBR requires temperatures of 550 °C. A pure Mo-V compound has not been used as
a catalyst for the ODH so a direct comparison is not possible. Nevertheless, both catalysts require
similar temperatures higher than the 400 – 500 °C usually required for the ODH [14]. This indicates an
influence of the MgO on the catalyst performance. Therefore, the support may also influence the
temperature dependence of the selectivity. It is unlikely that the main reason for the temperature-
dependent selectivity is a mixed active phase. Thus, the support is the likeliest explanation.
Two possible explanations exist for the decrease in selectivity to cis-butene at higher temperatures.
Firstly, the overall rate of butene conversion is higher so cis-butene will react to a greater degree even
if generated to an equal percentage. Secondly, it may be that the probability of adsorbed butene
isomerizing decreases with rising temperature as the oxidative dehydrogenation becomes more
Page 55
43
dominant. The increase in temperature necessary for this catalyst also nullifies some of the inherent
benefits of a butene feed. In contrast to the 400 – 450 °C temperature range discussed in several
publications (e.g. [14]), the temperature used here would be sufficient for a n-butane feed. Rischard
et.al. investigated Mo-V catalysts supported on MgO in a TZFBR [35]. In their experiments at 580 °C
a comparable butadiene selectivity of 50.7% could be achieved for n-butane (52.1% in chapter 4.1.1).
Due to their double bond, butenes are more reactive. This leads to a higher rate of conversion (81.2%
compared to 64.5%).
5.1.2 Influence of the inlet height
Since the two sets of experiments in chapter 4.1.2 were carried out at different time periods, catalyst
deactivation in the meantime must be considered. The experiments in chapter 4.1.4 were carried out
the same time as the experiments with a flow rate of ur = 2.8. Similarly, the experiments in chapter
4.1.3 were carried out at the same time as the experiments with a flow rate of ur = 1.9. The reaction
conditions for an oxygen to butene ratio of 1.8 in chapter 4.1.3 are comparable to the conditions for
ur = 1.7 in chapter 4.1.4. The experimental results are also comparable. Thus, only minor catalyst
deactivation can have taken place. Consequently, another explanation for the different results is
necessary. The combination of both graphs in Fig. 13 and the observations during the experiments
enable an interpretation of the results. Lowering the inlet height from 7.5 cm to 6.5 cm or 6 cm
increases the residence time. Consequently, generated cis-butene is more likely to readsorb on the
surface. This explains both the decrease in selectivity to cis-butene and the higher amount of carbon
oxides.
Moving the inlet further towards the frit leads to a noticeable increase in coking especially for the
second case (oxygen to butenes ratio of 1.8). This is the point at which a stable gas composition
develops. Thus, it can be theorized that a coke deposit-induced equilibrium is achieved in the system.
Moving the butene inlet closer to the frit increases the size of the reaction zone while reducing the size
of the regeneration zone. Although they are interconnected to a certain degree, two effects must be
separately mentioned in this context: Firstly, the increased reaction time leads to an increased
generation of coke deposits. Secondly, the smaller regeneration zone reduces the amount of coke that
can be removed before hydrocarbons are introduced into the system. While coke deposits can be burnt
in the presence of hydrocarbons, the overall effectiveness ought to be greater in a pure regeneration
zone. Consequently, the amount of coke deposits on the catalyst should increase for lower inlet
heights. This increase of coke deposits deactivates the catalyst. Apparently, in the case of MgO-1 the
deactivation due to coking compensates the increased residence time of the hydrocarbon in the
fluidized bed. Concentration profiles along the bed for several different inlet heights would allow a
Page 56
44
more definitive statement on this matter. Should such an equilibrium indeed exist, this poses the
question which parameters define the onset and the gas composition.
The two graphs shown in Fig. 13 differ in two parameters: the volumetric flow rate and the ratio of
oxygen to butenes. Thus, both can be considered potential factors that define this equilibrium. The
available data enables a first estimate of the influence of the oxygen to butenes ratio. The use of argon
as a carrier gas leaves the oxygen concentration in the outlet stream undetermined. First measurements
with the in-situ probe mentioned in chapter 3.3 have been carried out. Using He as a carrier gas they
show that the oxygen concentration in the outlet stream is zero for the higher oxygen to butenes ratio
(i.e., 12% oxygen, 5.5% butenes, inlet 5.5 cm above the frit). The oxygen consumption per mole of fed
butene is comparable at equilibrium in both cases shown in Fig. 13. The increase in carbon oxides
selectivity at a lower ratio compensates the decrease in conversion. Therefore, total consumption of
fed oxygen can be expected in both cases. For total oxygen consumption the ratio of carbon oxides to
butadiene must be influenced by the oxygen content. Lowering the oxygen to butene ratio ought to
increase the amount of coke deposits on the catalyst at steady state. This would explain why the
conversion drops below hinlet = 6 cm for ur = 2.8 but stays constant below hinlet = 6.5 cm for ur = 1.9.
The volumetric flow rate was not varied for inlet heights at which the gas composition has reached
equilibrium. Therefore, no reference point exists for a statement on the possible influence of this
parameter.
The two graphs in Fig. 13 show that for MgO-1 the concept of a TZFBR approaches the limits of its
usefulness. The effect of the two zones can clearly be seen for lower oxygen to butene ratios as this
leads to increased coking. For a ratio of oxygen to butenes of 1.8 a maximum yield of 35.5% is
determined. Increasing the oxygen to butenes ratio to 2.2 causes the maximum yield to increase to
44.9%. At such a ratio the higher amount of oxygen and possibly the lower flow rate lead to less
coking. Consequently, the maximum yield is only 3% better than that achievable in a normal fluidized
bed reactor. In other examples available in literature (e.g. [35]) the coking is reported to be higher for
lower inlet heights. In such cases the advantages of the TZFBR concept can be used to great benefit.
5.1.3 Influence of the oxygen content
The qualitative effects of the oxygen content on the reaction are in accordance with the expected
results. Reducing the oxygen content below certain thresholds was bound to decrease the rate of
conversion and increase coking. The noteworthy fact is that it happens at such high ratios of oxygen to
butenes. While the stoichiometric ratio is 0.5, the rate of conversion already decreases for ratios lower
than 1.8. However, this is in agreement with the pronounced tendency of the catalyst to form coke
deposits. As explained in the previous chapter, reducing the oxygen/ butenes ratio from 2.2 to 1.8 has
Page 57
45
an even bigger effect for lower positions of the butene inlet. Both the selectivity to butadiene and the
rate of conversion are reduced significantly. It cannot be said that these changes are only due to the
different oxygen/ butenes ratio and the flow rate does not have an impact. Nevertheless, it must have a
noticeable influence on the reaction. The affinity of the catalyst to form coke deposits also makes itself
felt for lower oxygen ratios. Oxygen ratios below 1.8 are apparently not sufficient to remove all of the
coke deposits formed during the reaction. Thus, the catalyst is steadily deactivated. Reducing the size
of the reaction zone should enable stable operation at lower oxygen concentrations. Given the
pronounced tendency of the catalyst to form coke deposits, it is unlikely however, that the TZFBR
enables oxygen concentrations comparable to the unsupported catalyst at sufficiently high rates of
conversion.
The pronounced increase in selectivity towards carbon oxides for an oxygen to butenes ratio of 2.2 is
in contrast to the unsupported catalyst. There an increase in oxygen content leads to a gradual increase
in carbon oxides selectivity. Such an increase is common and can be found in [35] for example. In
such catalysts the ideal operating window is quite small. If MgO-1 were deactivated more at lower
inlet heights, the small operating window would make a TZFBR quite advantageous. In a standard
fluidized bed, a higher oxygen concentration would be the only manner to reduce coke deposits. With
such a small range of ideal oxygen concentrations an increase in carbon oxide yield would be more
likely than an increase in butadiene yield.
5.1.4 Influence of the volumetric flow rate
The initial increase in the rate of conversion is based on several factors. The required inlet heights
were calculated based on the superficial velocity. While the height stays constant for ur = 1.7 – 2.8, it
increases from 7.5 cm to 8.1 cm for ur = 1.1 – 1.7. This increases the void fraction, however.
Consequently, the residence time increases with the first increase in flow rate. Similarly, a longer
residence time also explains the lower selectivity to cis-butene. Additionally, increasing the flow rate
significantly beyond minimum fluidization will improve the mixing of particles. The decrease in
conversion for higher flow rates is a different matter. Increasing the flow rate causes the catalyst to
experience noticeable coking. This shows the influence of the two zones on the coking equilibrium
described in chapter 5.1.2.
The inlet height required for a velocity of ur = 2.8 is hinlet = 5.5 cm. This is the operating point in
Fig. 13 in after which the gas composition stays constant. Since the bed height does not change once
the velocity reaches ur = 1.7, the residence time in the reaction zone can be approximately described as
constant. The amount of catalyst in the system is not varied. This causes regeneration zone to shrink
with increasing velocities. Coupled with the increase in fluid velocity, the residence time in the
Page 58
46
regeneration zone is reduced significantly. At one point the size ratio of regeneration zone to reaction
zone becomes too small. Consequently, the effects of different hydrodynamics were not isolated with
these experiments. However, this is impossible without varying the mass of the catalyst. Otherwise
changes in the residence time automatically are automatically superimposed over other effects of the
flow rate.
With such a size reduction of the regeneration zone the effects in Fig. 16 can be compared to moving
the butene inlet closer to the frit. With shrinking regeneration zone, the butene conversion and
selectivity towards butadiene decrease. The same effect can be seen in the range of hinlet = 5.5 – 6.5 cm
in Fig. 13 for a flow rate of ur = 2.8. At the same time, the difference in hydrodynamics cannot be
neglected. Higher velocities lead to increase in bubble formation. This in turn leads to reduced contact
time between the reactants and the catalyst particles, also reducing the rate of conversion.
5.1.5 Comparison of MgO-1 and MgO-2
The results for MgO-1 are noticeably better than those for MgO-2. Two possible reasons are the either
the crystal structure or the amount of active material used. As shown in chapter 3.2 the phase
composition cannot be clearly identified based on the XRD patterns. However, the different ratios of
bismuth to molybdenum used during the synthesis necessitate different compositions of the active
phase. Reports on the synergetic effects of mixtures of both γ-and β-bismuth molybdate as well as α-
and γ-bismuth molybdate support this to a certain degree. The rate of conversion changes noticeably, if
the ratio of the bismuth molybdate phases is varied [18; 44]. The problem with this explanation is that
the selectivity is only influenced to a significant degree, if the amount of γ-Bi2MoO6 is quite low.
MgO-1 however, is superior in terms of both selectivity and rate of conversion. Therefore, another
factor will probably play a role as well. This must be the amount of active material.
Duc et.al. conducted studies on the oxidation of propylene to acrolein using bismuth molybdate on
SiO2 [5]. In their experiments, the rate of acrolein formation initially increases with a higher amount of
active material on the support. Once the amount of β-Bi2Mo2O9 increases beyond 50 weight-% the rate
starts to decline again. This effect is also observed for the rate of propylene consumption with a peak
at 50 weight-% of active material. In their case, the rate of consumption drops quicker than the rate of
acrolein conversion, leading to an increase in acrolein selectivity. Since the given data is incomplete, it
is impossible to say if this trend is true for all amounts of active material above 50 weight-%. A
complete surface coverage is achieved for 30 weight-% β-Bi2Mo2O9. The BET area decreases
continuously with an increasing quantity of active material on the support. Instead, the authors
theorized that for a bismuth molybdate content beyond 50 weight-% particles agglomerate on the
surface and reduce the number of active sites. This explanation can also be employed in the case
Page 59
47
discussed here. Pure SiO2 has a BET area of 350 m2/ g. The initial surface area of MgO-1 was
determined to be 52.5 m2/ g. Consequently, any agglomeration will begin at lower quantities of active
material. The increase in selectivity inferred from [5] must be seen with caution. A different reaction is
discussed and the catalyst contains only one phase. The combination of different phases and different
weight contents may well be the reason for the different behavior.
The tests with MgO-2 lead to another important statement. The initial test carried out with MgO-2 at
450 °C and 475 °C were already inferior to those with MgO-1 at the same conditions. In contrast to
MgO-1, MgO-2 had not been exposed to temperatures above 475 °C before. This temperature has
been determined as a sensible upper limit for pure bismuth molybdates by Jung et.al. [22]. Therefore,
the previous exposure of MgO-1 to temperatures above 475 °C did not harm the performance of the
catalyst significantly. Changes in the structure of the active phase due to the temperature cannot be
ruled out. However, they cannot be drastic enough to consider an operating window below this
threshold of 475 °C.
5.1.6 Influence of the Al2O3 support
The Al2O3 support clearly leads to increased coking of the catalyst surface. Setnicka et.al. found MoO3
supported on Al2O3 to be a suitable catalyst for the ODH of n-butane. At 540 °C, they did not
encounter significant coking when using a fixed-bed reactor [41]. Many other authors note however,
that an Al2O3 support leads to a reduction in the 1,3-butadiene selectivity and increase in unwanted by-
products. This has been linked to the high acidity of the Al2O3 [4]. While such extreme coking as
observed for the Mo-V catalyst has not been reported in literature, the reaction conditions must be
taken into account. Concepción et.al. carried out their experiments with a ratio of n-butane to oxygen
of 1:4. This underlines the tendency of Al2O3-based catalyst to form coke deposits. Higher
concentrations of oxygen were not investigated in the TZFBR due to safety considerations. Especially
taking the higher reactivity of butenes into account this was not deemed feasible. Despite the coking of
the catalyst the results are helpful in combination with the reaction conditions necessary for Mo-V on
MgO in [36]. They indicate that the higher reaction temperatures necessary for MgO-1 and MgO-2 are
not support-specific problems but typical of the ODH of butenes on supported catalysts.
Page 60
48
5.2 Unsupported catalyst
5.2.1 Influence of the reactor temperature
The small influence of the temperature on the selectivity was expected. The same behavior was
observed by Jung et.al. [17]. In their case, all three butene isomers were fed, eliminating isomerization
as a quantifiable reaction. If the isomerization to cis-butene were disregarded, the selectivity would be
nearly constant over the temperature range. The overall increase in the rate of conversion is also in
accordance with previous results such as those by Jung et.al. However, there the rate of conversion
tends to be less continuous and more a series of irregular jumps. Additionally, Jung et.al. report a
decline in the rate of conversion above temperatures of 440 °C. This is in strong contrast to the results
reported in chapter 4.2.1 where the conversion increases until 470 °C. However, the question is where
the temperature was determined in the fixed-bed reactor. The thermocouple can be positioned directly
in the reaction zone of the fluidized bed. In the fixed bed the temperature was either determined at the
inlet or the outlet. Consequently, the fluidized bed offers better process control despite the relatively
poor heat conductivity of the catalyst.
5.2.2 Influence of the inlet height
The results in chapter 4.2.2 deviate from the remaining parameter optimizations. The rate of
conversion achieved at 3.5 cm height in chapter 4.2.1 is equal to X = 83.4%. In chapter 4.2.2 however,
the rate of conversion is equal to X = 89.9% at 4 cm and X = 91.8% at 3 cm. Similarly, the selectivity
towards butadiene is lower by 5 – 6% and the selectivity towards carbon oxides higher by
approximately 8% in chapter 4.2.2. The results of the other tests are all in accordance with one
another. Consequently, the reason must be associated with the investigation of the inlet height. Two
possibilities exist. One is the heat generated by the reaction. As the catalyst is a relatively poor heat
conductor, the position of the thermocouple is quite important. This led to the experiments being
conducted at 450 °C instead of 470 °C. That way it could be ensured that the catalyst was not exposed
to temperatures above 475 °C, which are detrimental to its performance. Here, temperature
fluctuations are possible as a variable inlet height means that the thermocouple is not always exposed
to the reaction zone in the same manner. The reactor temperature was always monitored, in order to
minimize any changes in reactor temperature. Nevertheless, a variation of several degrees centigrade
within the reaction zone must be expected. The problem with this theory are the results of chapter
4.2.1. They clearly show that at 450 °C the temperature only has a small influence on the selectivity
and the rate of conversion. Consequently, any temperature variations due to the thermocouple position
Page 61
49
cannot be the main cause for this effect. The other possibility is the position of the inlet itself. When
the height is changed, it can easily be moved horizontally or twisted as well. This changes the flow
profile within the bed considerably. The less the inlet is within the bed center, the more one of the two
butenes streams will be pass along the reactor wall. This in turn reduces the contact time with the
catalyst. Chapter 4.2.2 shows, how much the reaction can be influenced by changes in the inlet height.
Thus, different horizontal positions of the inlet appear to be a credible explanation for the deviances.
A straightforward explanation of the general correlation between the inlet height and the reaction
results exists. Moving the hydrocarbon inlet height will have an influence on several parameters, such
as the profile of the current within the fluidized bed. However, the residence time is one of the most
important parameters affected. Increasing the residence time leads to an increase in conversion. The
fact that the growth rate decreases for a smaller distance between inlet and frit is also logical. A higher
rate of conversion means that the concentration of butenes has dropped considerably. This reduces the
chance of a butene molecule coming into contact with a catalyst particle. The increase in carbon
oxides selectivity follows a similar line of argument. In such an oxygen-rich environment, a longer
residence time will automatically lead to a growth in carbon oxides formation. Theoretically, there are
several possibilities to generate carbon oxides. Firstly, the butene might be oxidized totally, without
1,3-butadiene existing as an intermediate. Secondly, after 1,3-butadiene is formed, it is adsorbed on
the catalyst again and then oxidized further. Thirdly, the butenes might react to coke deposits on the
catalyst, which are then burnt off. None of these routes can be completely disregarded. However, none
of the tests with this catalyst showed significant amounts of coke deposits being generated. Therefore,
it is unlikely that the burning of coke contributes noticeably to the amount of carbon oxides generated.
Further statements on the manner in which carbon oxides are generated cannot be made. The number
of parameters influencing the behavior of the fluidized bed is too large to extract further information
out of the data available.
The relatively small influence of the inlet height is striking. All of the results can be explained as if the
amount of catalyst in a fluidized bed were increased. The regeneration zone appears to be of little
importance. It must be kept in mind that the oxygen concentration for this run of experiments was
quite high. Indeed, first signs of coking were detected when optimizing the height for the C4R2 feed at
lower oxygen levels. Nevertheless, the coking observed with this catalyst was never significant
enough to effect the catalyst behavior. This indicates that the degree of coking is low enough that it
can be removed while the oxidative dehydrogenation takes place. Indeed, if the price for butenes is
sufficiently low, these results indicate that a normal fluidized bed reactor can be run autothermically.
At the conditions used, the oven was already noticeably cooler than the reactor.
Page 62
50
5.2.3 Influence of the oxygen content
When considering Fig. 20, it is noticeable, how small the influence of the oxygen content on the
reaction is. The rate of conversion stays practically constant for an oxygen/ butenes ratio above 0.9.
For all examined oxygen contents, the selectivity towards 1,3-butadiene only varies between 80% and
89%. A greater influence of the oxygen content would not have been unexpected as it is a partial
oxidation of an alkene. On the other hand, the reaction temperature is relatively low with 450 °C. The
reaction rate for the total oxidation will probably be small at such a temperature. Consequently, even
doubling the oxygen concentration has a small impact on the reaction results. The increase in carbon
oxides selectivity for lower oxygen to butene ratios can also be explained. A certain amount of coke
deposits is formed during the reaction. The darker color observed at low oxygen contents is proof of
that. In order for a reaction to take place, the surface cannot be covered with coke deposits,
necessitating a minimum amount of total oxidation. This can be compared to the results of chapter
4.1.2. In the case of MgO-1 a lower oxygen to butenes ratio also leads to an increase coke deposits on
the catalyst. At the same time the selectivity to carbon oxides increases while the rate of butene
conversion drops noticeably.
5.2.4 Influence of the volumetric flow rate
The initial increase in the rate of conversion for ur = 1 – 1.1 can be explained. Increasing the flow rate
beyond the minimum fluidization rate will lead to an improved solids mixing and gas solid contact.
While the increase in conversion is only 2%, the increase in flow rate is also quite small. The decrease
in conversion for higher velocities is due to the reduced contact time since the height of the butenes
inlet is kept constant and the bed height does not change. Secondly, it is possible that the velocity
increase changes the hydrodynamics within the gas bubbles. As explained in [45] depending on the
ratio of bubble velocity to gas velocity outside the bubbles the gas may circulate solely within the
bubbles or not. Such a fundamental change will not take place due to such a small variation in gas
velocity. Nevertheless, the gas-solid contact might be reduced by the underlying mechanism to a
certain extent.
Page 63
51
5.2.5 Use of C4R2 as a feedstock
The use of C4R2 as a feedstock shows several influences on the reaction. The influence of the inlet
height contrasts strongly with the effects shown in chapter 4.2.2. There are several factors here, which
must be investigated separately. Firstly, the feed is different. Instead of 5.5% butenes being fed, 5.7%
C4R2 is used. With n-butane being inert under these conditions, this is equivalent to a reduction in
hydrocarbon reactant. Secondly, the oxygen ratio is reduced considerably. Instead of a ratio of 2.2, the
optimum ratio of oxygen to butenes of 0.9 is employed.
While absolute statements on the influence of each parameter are impossible, certain assumptions can
be made. As seen in chapter 4.2.3, the higher selectivity towards 1,3-butadiene should be a result of
the improved oxygen ratio. When using C4R2 the selectivity is in the same range. The underlying
effects of different heights are not influenced by the oxygen content. However, the considerably
smaller increase in carbon oxides selectivity is due to the lower oxygen concentration. While the
qualitative trend in the rate of conversion is the same as in chapter 4.2.2, the values do vary
significantly. If the inlet height is greater than 3 cm, the rate of conversion is lower than when using
pure butenes as a feed. For 3 cm the rates of conversion are comparable. At 2 cm pure butenes once
again exhibit a higher rate of conversion. It must be kept in mind that the rate of conversion observed
in chapter 4.2.2 is noticeably higher than in the remaining subchapters. However, the C4R2 feed is
also converted to a smaller degree compared to the other results for butenes. For example, the value
observed for an inlet height of 4 cm for butenes in chapter 4.2.4 is larger than for C4R2 (83.8% vs
78.5%). This is consistent with the observations in [17] where a reduction of the hydrocarbon feed
leads to a continuous decrease in conversion.
However, trends observed in one reactor type cannot be automatically transferred to the other reactor
type. While the temperature influence on the selectivity is the same in both systems, many differences
can also be observed. As already mentioned, the temperature influence on the conversion determined
in a fixed-bed reactor differs noticeably from that in chapter 4.2.1. Additionally, the conversion in a
fixed-bed reactor is also significantly lower. This the best parameter to enable a direct comparison
between the two systems. While the GHSV is known, the amount of catalyst in the reactor, particle
size, etc. is never stated. Thus, not even an approximate comparison of the different contact times is
possible. Nevertheless, assumptions on this topic can be made. It is unlikely, that the ratio of catalyst
to butenes is the main reason for the inferior results in the fixed-bed reactor. The rate of conversion is
documented as a function of the steam concentration at 420 °C. In the absence of steam, i.e. for an
initial butenes concentration of 15.3%, the rate of conversion reaches 80%. Instead, this indicates a
poor contact between catalyst and reactants at lower concentrations. The inherent mixing of a fluidized
bed on the other hand, enables excellent contact between gas and solids. This enables similarly high
rates of conversion for lower concentrations. Consequently, the butene concentration influence
Page 64
52
observed by Jung et.al. must be treated with caution. Without additional data it should not be used to
make predictions for the TZFBR.
It is difficult to define the reason for the different order of reactivity for the butene isomers. Besides
the study by Jung et.al. no report could be found examining the relative reactivity of the two 2-butene
isomers. Different temperatures represent one possible explanation for the perceived difference in
selectivity. As explained in chapter 5.2.1, the location of the thermocouple varies between the different
reactor types. This may also lead to differences in the isomerization rates for the two experiments. It
must also be kept in mind that this is only a first estimation. For a definite order of isomer reactivity,
the three isomers need to be examined separately.
5.3 Comparison of the different catalysts
Comparing the behavior of the catalysts in the TZFBR shows noteworthy differences between the
different catalysts. The pure γ-Bi2MoO6 does not appear to be greatly influenced by the ratio of the
two zones. Coking is encountered only for relatively harsh conditions. Even then it is not sufficient to
influence the behavior of the catalyst. Experimental results indicate that the noticeable decrease in
butadiene selectivity during the height optimization for the butene feed is mainly due to the high
amount of excess oxygen. During the height optimization for the C4R2 feed the oxygen level was
already at its optimized value. Consequently, the selectivity only decreased slightly for shorter
distances to the frit. The main parameter influenced was the conversion. This is in strong contrast to
the results reported by Rischard et.al. for a Mo-V catalyst on MgO. When using an n-butane feed, the
selectivity to butadiene drops to approximately 16% if the inlet is positioned directly above the
frit [35]. A further sign of the small impact on the regeneration zone is the fact that decent results can
be achieved in a fixed-bed reactor with γ-Bi2MoO6. The main difference to the fluidized bed is the
lower conversion due to an inferior gas solids contact.
While MgO-1 is more likely to be covered in coke deposits the behavior is also not typical of a
TZFBR and quite unusual. Since the unsupported catalyst is quite resistant to coking, extensive
regeneration is not necessary. Thus, the effects of the TZFBR concept are very limited in such a case.
MgO-1 on the other hand is covered in significant amounts of coke deposits. Nevertheless, the effect
of the TZFBR concept is also smaller than reported in literature. Under optimized conditions the
TZFBR improves the achievable reaction result to a small degree compared to a normal fluidized bed.
An oxygen to butenes ratio of 1.8 is the minimum required for steady-state operation. There the
influence of the two zones is visible. However, even there the difference is a lot smaller than in other
cases.
Page 65
53
The lack of data for MgO-2 makes it impossible to analyze the effect of the two zones. First
experiments on the temperature dependence of MgO-2 showed similar trends as for MgO-1 but with
lower conversion and an inferior ratio of carbon oxides to butadiene. Predictions cannot be made since
so little information is available on the causes of the unusual effect of the height inlet. It is possible
that this behavior is caused by the specific composition of MgO-1 for example. In such a case the
effect of the inlet height on the results for MgO-2 would be more pronounced. The catalysts supported
on Al2O3 experience significant amounts of coke formation. In theory, the TZFBR is able to improve
the reaction results. For the supported Bi-Mo catalyst this is possible to a limited degree. In the case of
the Mo-V catalyst the degree of coke formation is too high for the TZFBR to be effective. The poor
suitability of a catalysts cannot be compensated completely by this reactor concept.
Page 66
54
6 Summary
Several different molybdenum-based catalysts were synthesized for use in a two-zone fluidized bed
reactor. Pure bismuth molybdate was synthesized via co-precipitation in the form of γ-Bi2MoO6.
Further catalysts used were supported on either MgO or Al2O3 using incipient wetness impregnation.
The MgO-based catalysts contained bismuth molybdate as an active phase and varied in both
composition and amount of active material used (6 weight-% molybdenum and a ratio of Bi:Mo = 1:1
vs. 8.5 weight-% molybdenum and a ratio of Bi:Mo = 2:1). In both cases, the existence of several
different phases cannot be ruled out on the basis of the XRD spectra. One of the catalysts supported on
Al2O3 was designed as a comparison to the MgO catalyst with a 1:1 ratio, thus containing the same
amounts of active material per support. The active phase on the other catalyst consisted of
molybdenum and vanadium (7.1 weight-% molybdenum, Mo:V = 2.2:1). All of the catalyst particles
were in the size range of 160 – 250 µm. The support was available in the desired size before synthesis.
Pure bismuth molybdate had to be pressed and ground to generate these particles. Besides XRD,
analyses of the finished catalysts were also carried out according to the BET theory.
The use of these catalysts in a TZFBR yielded quite different results. The pure bismuth molybdate
showed excellent behavior in this system. The used temperature of 450 °C is in the temperature range
determined as optimal in previous research. Under optimized conditions a selectivity of 89.7% and a
rate of conversion of 83.8% were achieved. In this case, an equimolar mixture of 1-butene and trans-
butene was employed. The selectivity is the same as in documented experiments in a fixed-bed reactor.
The rate of conversion on the other hand surpasses the results of a fixed bed reactor by more than
15%. Switching the feed to an artificial C4R2 raffinate (approx. 26% n-butane, 29% trans-butene, 21%
1-butene, 24% cis-butene) does not have a negative effect on the selectivity. Instead, the rate of butene
conversion can be increased to 89.1% at the same hydrocarbon concentration, while the selectivity to
1,3-butadiene stays similar. Butane does not react under these conditions. The catalyst is also very
resistant to coking. First signs of coking were only detected for oxygen levels at near-stoichiometric
conditions or low oxygen concentrations and long residence times. However, the coking was never
sufficient to have a negative impact on the reaction and steady state is achievable for all conditions
examined. The results indicate that the two zones have little impact on the reaction results since the
degree of deactivation during the reaction is very low.
The behavior of the catalysts supported on MgO is noticeably different. Firstly, the highest selectivity
towards butadiene of 60% is achieved at a temperature of 570 °C. The rate of conversion of 80%
achieved at this temperature is comparable to that of the pure bismuth molybdate. However, the
oxidative dehydrogenation of n-butane can already be carried out at similar temperatures. Therefore,
some benefits of butene feeds instead of butane are nullified with this catalyst. If the butene inlet is
Page 67
55
moved below a certain height, the composition of the product gas does not change anymore. It is
proposed that a lower inlet position leads to increased coking on the catalyst. The longer residence
time is counterbalanced by catalyst deactivation due to coking. If the oxygen to butenes ratio is
reduced, the gas composition stabilizes at lower rate of conversion and higher selectivity towards
carbon oxides. The volumetric flow rate was varied while keeping the residence time in the reaction
zone constant. Since the amount of catalyst was constant, higher velocities lead to a shorter residence
time in the regeneration zone. An increase of the flow rate above a certain value causes the onset of
considerable coking and a deterioration of the reaction results. Due to the unusual height influence the
best results in a TZFBR only differ marginally from those obtainable in a normal fluidized bed using
the same parameters.
The MgO-based catalyst with a ratio of Bi:Mo = 1:1 contained less active phase than the catalyst with
a ratio of Bi:Mo = 2:1. Nevertheless, it is the superior catalyst. At optimized conditions both the rate
of conversion and the selectivity towards 1,3-butadiene were significantly higher. Synergetic effects of
different bismuth molybdates have been reported and are one likely reason for this result. The other is
that too much bismuth molybdate on a support surface may cause agglomeration of the active phase. It
has been reported that this can reduce the number of active sites available. The catalysts supported on
Al2O3 are not suitable for this reaction. The Mo-V catalyst was tested at 550 °C with an n-butane feed.
Despite the use of a TZFBR excessive coking made it impossible to obtain useable results. The Bi-Mo
catalyst on Al2O3 also experienced heavy coking. For temperatures up to 520 °C and very short contact
times, it was possible to achieve steady state. Nevertheless, the results were noticeably inferior to
those obtained with MgO-based catalysts at similar conditions.
Outlook
Pure bismuth molybdate shows excellent reaction behavior. However, it is quite dense which might
cause problems in large-scale reactors. Consequently, an optimum support would make this catalyst
more applicable. Past research on supported bismuth molybdate focused on SiO2 as a support. For
example, the SOHIO process employs a modified bismuth molybdate catalyst on SiO2 in fluidized
beds. This might be a promising option. The concentration profiles mentioned in the project scope
have already been carried out to a large degree and published in literature. If desired, further profiles
could be measured to gain more insight into the zones of constant gas composition encountered in
MgO-based catalysts. However, the performance of the catalyst does not necessarily require further
investigation. Especially in the context of the concentration profiles already determined, computational
fluid dynamics presents itself as a promising topic of research. This would allow greater insight into
the hydrodynamics of the reactor, enabling further process optimization.
Page 68
56
7 References
[1] Bhasin, M.M.; McCain, J.H.; Vora, B.V.; Imai, T.; Pujadó, P.R. Dehydrogenation and
oxydehydrogenation of paraffins to olefins,Appl. Catal., A 221(1–2): 397–419, 2001,
[2] Brunauer, S.; Emmett, P. H.; Teller, E. Adsorption of Gases in Multimolecular Layers,J. Am.
Chem. Soc. 60(2): 309–319, 1938,
[3] Chen, K.; Khodakov, A.; Yang, J.; Bell, A.T.; Iglesia, E. Isotopic Tracer and Kinetic Studies of
Oxidative Dehydrogenation Pathways on Vanadium Oxide Catalysts,J. Catal. 186(2): 325–333, 1999,
[4] Concepción, P.; Galli, A.; López Nieto, J. M; Dejoz, A.; Vazquez, M.I. On the influence of the
acid-base character of catalysts on the oxidative dehydrogenation of alkanes,Top. Catal. 3(3): 451–
460, 1996,
[5] Duc, D.T.; Ha, H.N.; Fehrmann, R.; Riisager, A.; Le, M.T. Selective oxidation of propylene to
acrolein by silica-supported bismuth molybdate catalysts,Res. Chem. Intermediat. 37(605-615, 2011,
[6] Farin, B.; Monteverde Videla, A.; Specchia, S.; Gaigneaux, E. Bismuth molybdates prepared by
solution combustion synthesis for the partial oxidation of propene,Catal. Today 25711–17, 2015,
[7] Gascón, J.; Téllez, C.; Herguido, J.; Menéndez, M. Fluidized Bed Reactors with Two-Zones for
Maleic Anhydride Production: Different Configurations and Effect of Scale,Ind. Eng. Chem. Res.
44(24): 8945–8951, 2005,
[8] Geldart, D. Types of gas fluidization,Powder Technol. 7(5): 285–292, 1973,
[9] Glaeser, L.C.; Brazdil, J.F.; Hazle, M.A.; Mehicic, M.; Grasselli, R.K. Identification of active
oxide ions in a bismuth molybdate selective oxidation catalyst,J. Chem. Soc., Faraday Trans. 1
81(11): 2903–2912, 1985,
[10] Grub, J.; Löser, E., 2000, Butadiene In: Ullmann's Encyclopedia of Industrial Chemistry,, Wiley-
VCH Verlag GmbH & Co. KGaA,
[11] Håkonsen, S.F.; Holmen, A., 2008, Oxidative Dehydrogenation of Alkanes In: Handbook of
Heterogeneous Catalysis,, Wiley-VCH Verlag GmbH & Co. KGaA,
[12] Han, Y.-H.; Ueda, W.; Moro-Oka, Y. Lattice oxide ion-transfer effect demonstrated in the
selective oxidation of propene over silica-supported bismuth molybdate catalysts,Appl. Catal., A
176(1): 11–16, 1999,
[13] Herguido, J.; Menéndez, M.; Santamaría, J. On the use of fluidized bed catalytic reactors where
reduction and oxidation zones are present simultaneously,Catal. Today 100(1–2): 181–189, 2005,
Page 69
57
[14] Hong, E.; Park, J.-H.; Shin, C.-H. Oxidative Dehydrogenation of n-Butenes to 1,3-Butadiene
over Bismuth Molybdate and Ferrite Catalysts: A Review,Catal. Surv. Asia, 1–11, 2015,
[15] Julián, I.; Gallucci, F.; van Sint Annaland, M.; Herguido, J.; Menéndez, M. Coupled PIV/DIA for
fluid dynamics studies on a Two-Section Two-Zone Fluidized Bed Reactor,Chem. Eng. J. 207–
208122–132, 2012,
[16] Jung, J.C.; Kim, H.; Choi, A.S.; Chung, Y.-M.; Kim, T.J.; Lee, S.J. et al. Preparation,
characterization, and catalytic activity of bismuth molybdate catalysts for the oxidative
dehydrogenation of n-butene into 1,3-butadiene,J. Mol. Catal. 259(1–2): 166–170, 2006,
[17] Jung, J.C.; Kim, H.; Kim, Y.S.; Chung, Y.-M.; Kim, T.J.; Lee, S.J. et al. Catalytic performance
of bismuth molybdate catalysts in the oxidative dehydrogenation of C4 raffinate-3 to 1,3-
butadiene,Appl. Catal., A 317(2): 244–249, 2007,
[18] Jung, J.C.; Lee, H.; Kim, H.; Chung, Y.-M.; Kim, T.J.; Lee, S.J. et al. A synergistic effect of α-
Bi2Mo3O12 and γ-Bi2MoO6 catalysts in the oxidative dehydrogenation of C4 raffinate-3 to 1,3-
butadiene,J. Mol. Catal. 271(1–2): 261–265, 2007,
[19] Jung, J.C.; Lee, H.; Kim, H.; Chung, Y.-M.; Kim, T.J.; Lee, S.J. et al. Catalytic performance of
multicomponent bismuth molybdates (NiXFe3Bi1Mo12O42+X) in the oxidative dehydrogenation of C4
raffinate-3 to 1,3-butadiene: Effect of nickel content and acid property,Catal. Commun. 9(3): 447–452,
2008,
[20] Jung, J.C.; Lee, H.; Kim, H.; Chung, Y.-M.; Kim, T.J.; Lee, S.J. et al. Effect of Oxygen Capacity
and Oxygen Mobility of Pure Bismuth Molybdate and Multicomponent Bismuth Molybdate on their
Catalytic Performance in the Oxidative Dehydrogenation of n-Butene to 1,3-Butadiene,Catal. Lett.
124(3): 262–267, 2008,
[21] Jung, J.C.; Lee, H.; Kim, H.; Chung, Y.-M.; Kim, T.J.; Lee, S.J. et al. Preparation,
characterization and catalytic activity of Bi-Mo-based catalysts for the oxidative dehydrogenation of
n-butene to 1,3-butadiene,Res. Chem. Intermediat. 34(8-9): 827–833, 2008,
[22] Jung, J.C.; Lee, H.; Park, D.R.; Seo, J.G.; Song, I.K. Effect of Calcination Temperature on the
Catalytic Performance of γ-Bi2MoO6 in the Oxidative Dehydrogenation of n-Butene to 1,3-
Butadiene,Catal. Lett. 131(3): 401–405, 2009,
[23] Jung, J.C.; Lee, H.; Seo, J.G.; Park, S.; Chung, Y.-M.; Kim, T.J. et al. Oxidative dehydrogenation
of n-butene to 1,3-butadiene over multicomponent bismuth molybdate (MII9Fe3Bi1Mo12O51) catalysts:
Effect of divalent metal (MII),Catal. Today 141(3–4): 325–329, 2009,
[24] KPMG Global Automotive Retail Market Part I, 2013.
https://www.kpmg.com/Global/en/IssuesAndInsights/ArticlesPublications/Documents/global-
automotive-retail-market-study-part1.pdf (Stand: 07.09.2015).
Page 70
58
[25] Lee, H.; Jung, J.C.; Kim, H.; Chung, Y.-M.; Kim, T.J.; Lee, S.J. et al. Effect of Divalent Metal
Component (MeII) on the Catalytic Performance of MeIIFe2O4 Catalysts in the Oxidative
Dehydrogenation of n-Butene to 1,3-Butadiene,Catal. Lett. 124(3): 364–368, 2008,
[26] Lee, H.; Jung, J.C.; Kim, H.; Chung, Y.-M.; Kim, T.J.; Lee, S.J. et al. Effect of CsxH3−xPW12O40
addition on the catalytic performance of ZnFe2O4 in the oxidative dehydrogenation of n-butene to 1,3-
butadiene,Korean Journal of Chemical Engineering 26(4): 994–998, 2010,
[27] Levenspiel, Octave; Kunii, Daizo Fluidization Engineering. Butterworth-Heinemann, 2nd ed.,
1991, Boston.
[28] Lobera, M.P.; Téllez, C.; Herguido, J.; Menéndez, M. Pt−Sn/MgAl2O4 as n-Butane
Dehydrogenation Catalyst in a Two-Zone Fluidized-Bed Reactor,Ind. Eng. Chem. Res. 48(14): 6573–
6578, 2009 Industrial & Engineering Chemistry Research.
[29] Makshina, E.V.; Dusselier, M.; Janssens, W.; Degreve, J.; Jacobs, P.A.; Sels, B.F. Review of old
chemistry and new catalytic advances in the on-purpose synthesis of butadiene,Chem. Soc. Rev.
43(22): 7917–7953, 2014,
[30] Matsen, J.M. Scale-up of fluidized bed processes: Principle and practice,Powder Technol. 88(3):
237–244, 1996,
[31] Medrano J. A.; Julián, I.; García-García, F.R.; Li, K.; Herguido, J.; Menéndez, M. Two-Zone
Fluidized Bed Reactor (TZFBR) with Palladium Membrane for Catalytic Propane Dehydrogenation:
Experimental Performance Assessment,Ind. Eng. Chem. Res. 52(10): 3723–3731, 2013,
[32] Medrano J. A.; Julián, I.; Herguido, J.; Menéndez, M. Pd-Ag Membrane Coupled to a Two-Zone
Fluidized Bed Reactor (TZFBR) for Propane Dehydrogenation on a Pt-Sn/MgAl2O4
Catalyst,Membranes 3(2): 69–86, 2013,
[33] Pacheco, M.L.; Soler, J.; Dejoz, A.; López Nieto, J. M; Herguido, J.; Menéndez, M.; Santamarı́a,
J. MoO3/MgO as a catalyst in the oxidative dehydrogenation of n-butane in a two-zone fluidized bed
reactor,Catal. Today 61(1–4): 101–107, 2000,
[34] Park, J.-H.; Shin, C.-H. Influence of the catalyst composition in the oxidative dehydrogenation of
1-butene over BiVxMo1−x oxide catalysts,Appl. Catal., A 4951–7, 2015,
[35] Rischard, J.; Antinori, C.; Maier, L.; Deutschmann, O. Oxidative dehydrogenation of n-butane to
butadiene with Mo-V-MgO catalysts in a two-zone fluidized bed reactor,Appl. Catal., A 51123–30,
2016,
[36] Rischard, J.; Franz, R.; Antinori, C.; Deutschmann, O. Oxidative Dehydrogenation of n-butenes
to 1,3-butadiene over Bi-Mo and Mo-V based catalysts in a Two-Zone Fluidized Bed Reactor,AIChE
J., 2016,
Page 71
59
[37] Rubio, O.; Herguido, J.; Menéndez, M. Two-zone fluidized bed reactor for simultaneous reaction
and catalyst reoxidation: influence of reactor size,Applied Catalysis A: General 272(1–2): 321–327,
2004,
[38] Rüdisüli, M.; Schildhauer, T.J.; Biollaz, Serge M. A.; van Ommen, J. Ruud Scale-up of bubbling
fluidized bed reactors — A review,Powder Technol. 21721–38, 2012,
[39] Schuh, K.; Kleist, W.; Høj, M.; Trouillet, V.; Beato, P.; Jensen, A.D. et al. Selective oxidation of
propylene to acrolein by hydrothermally synthesized bismuth molybdates,Applied Catalysis A:
General 482145–156, 2014,
[40] Schuh, K.; Kleist, W.; Høj, M.; Trouillet, V.; Beato, P.; Jensen, A.D.; Grunwaldt, J.-D. Bismuth
Molybdate Catalysts Prepared by Mild Hydrothermal Synthesis: Influence of pH on the Selective
Oxidation of Propylene,Catalysts 5(3): 1554, 2015,
[41] Setnička, M.; Tišler, Z.; Kubička, D.; Bulánek, R. Activity of Molybdenum Oxide Catalyst
Supported on Al2O3, TiO2, and SiO2 Matrix in the Oxidative Dehydrogenation of n-Butane,Top. Catal.
58(14): 866–876, 2015,
[42] Soler, J.; López Nieto, J. M; Herguido, J.; Menéndez, M.; Santamaría, J. Oxidative
Dehydrogenation of n-Butane in a Two-Zone Fluidized-Bed Reactor,Ind. Eng. Chem. Res. 38(1): 90–
97, 1999,
[43] Ueda, W.; Moro-Oka, Y.; Ikawa, T. 18O tracer study of the active species of oxygen on Bi2MoO6
catalyst,J. Chem. Soc., Faraday Trans. 1 78(2): 495–500, 1982,
[44] Vieira Soares, A.P.; Dimitrov, L.D.; de Oliveira, Margarida Corte-Real André; Hilaire, L.;
Portela, M.F.; Grasselli, R.K. Synergy effects between β and γ phases of bismuth molybdates in the
selective catalytic oxidation of 1-butene,Appl. Catal., A 253(1): 191–200, 2003,
[45] Werther, J., 2000, Fluidized-Bed Reactors In: Ullmann's Encyclopedia of Industrial Chemistry,,
Wiley-VCH Verlag GmbH & Co. KGaA,
[46] White, W.C. Butadiene production process overview,Chem. Biol. Interact. 166(1–3): 10–14,
2007,