Rep. Prog. Phys. 59 (1996) 283–347. Printed in the UK Oxide surfaces Hans-Joachim Freund†, Helmut Kuhlenbeck† and Volker Staemmler‡ † Lehrstuhl f¨ ur Physikalische Chemie I, Ruhr-Universit¨ at Bochum, 44780 Bochum, Germany ‡ Lehrstuhl f¨ ur Theoretische Chemie, Ruhr-Universit¨ at Bochum, 44780 Bochum, Germany Abstract We review the current knowledge of the geometric and electronic structure of oxide surfaces. In particular, material published during the last five years and going beyond the latest book by Henrich and Cox, Surface Science of Oxide Surfaces , is documented. In addition to the discussion of effects on and in bulk oxide single crystal samples, and in fact mainly, we also refer to work on thin oxide films epitaxially grown on metallic substrates. Surface states on oxide surfaces as well as band structure effects are discussed. Reconstruction and the local electronic structure are other aspects covered. We review experimental as well as theoretical approaches. Adsorption on oxide surfaces is an important subject covered in this review, and oxide modification by metal adsorption is also mentioned. This review was received in October 1995 0034-4885/96/030283+65$59.50 c 1996 IOP Publishing Ltd 283
Transcript
Rep. Prog. Phys.59 (1996) 283–347. Printed in the UK
Oxide surfaces
Hans-Joachim Freund†, Helmut Kuhlenbeck† and Volker Staemmler‡† Lehrstuhl fur Physikalische Chemie I, Ruhr-Universitat Bochum, 44780 Bochum, Germany‡ Lehrstuhl fur Theoretische Chemie, Ruhr-Universitat Bochum, 44780 Bochum, Germany
Abstract
We review the current knowledge of the geometric and electronic structure of oxide surfaces.In particular, material published during the last five years and going beyond the latest bookby Henrich and Cox,Surface Science of Oxide Surfaces, is documented. In addition to thediscussion of effects on and in bulk oxide single crystal samples, and in fact mainly, wealso refer to work on thin oxide films epitaxially grown on metallic substrates. Surfacestates on oxide surfaces as well as band structure effects are discussed. Reconstruction andthe local electronic structure are other aspects covered. We review experimental as wellas theoretical approaches. Adsorption on oxide surfaces is an important subject covered inthis review, and oxide modification by metal adsorption is also mentioned.
5.1. Rock salt type structures 3145.2. Corundum type structures 325
6. Adsorbates on oxides 3297. Synopsis and perspectives 340
Acknowledgments 341References 341
Oxide surfaces 285
1. Introduction
Oxides comprise a very diverse class of compounds with properties covering almost allaspects of material science and physics [1]. Oxides can be superconductors on one handand insulators on the other. The bonding characteristics may be classified as covalent for onesystem and highly ionic for the other. Oxides find applications in many fields of technicalinterest, from paint pigments via nonlinear optics to sensors and catalysis. In some casesthe bulk properties are important, as for example very often in nonlinear optics, in othercases the surface properties play a major role, as in catalysis.
The bulk properties of simple binary oxides are pretty well understood and there areexcellent reviews and books available treating the thermodynamics [2], the structure—and its non-stoichiometric aspects [3], which are particularly important for oxides—thespectroscopy [4] as well as transport [5] and mechanical properties [3]. Bulk properties ofeven more complicated oxides such as ternary and quaternary oxides [5] are being intensivelyinvestigated, probably partly due to their importance in high-Tc-superconductivity.
In contrast, rather little is known about the surfaces of oxides, even the most simpleones. The present knowledge has been comprehensively reviewed recently by Henrichand Cox in their bookThe Surface Science of Metal Oxides[6]. However, due to therapid development of the field during the last few years there are experimental as well astheoretical aspects that we feel are worth reviewing and which have not been covered inthe book. In particular, we feel the observation of surface states on oxide surfaces and thewhole field of thin film studies is of interest for future studies on clean and modified oxidesurfaces, because it opens up areas of study on the so-called polar surfaces [7]. We wantto explicitly clarify at this point, however, that the present article is self-contained and thenecessary concepts are introduced independently.
For us the major objective is to contribute to the understanding not only of oxidesurfaces as such but rather to provide insight into how molecules interact with clean andalso with modified surfaces. In other words, we view the investigation of oxide surfacesas part of a strategy which is—somewhat naively—summarized in figure 1. Figure 1contains two ‘coordinates’. The abscissa represents schematically ‘the pressure gap’ betweenthe ultrahigh vacuum conditions often applied in surface science studies and the ambientconditions including high temperatures and pressure in catalysis [8]. The ordinate is anoversimplified representation of the ‘materials gap’, which opens up between the well-studied metal surfaces and the metal-modified compound surface, which may eventuallyeven be polycrystalline.
The present review concentrates on investigations under ultrahigh vacuum conditionsunder which the oxide surfaces are well ordered and rather well characterized. However,we point out that certain results may have consequences with respect to catalytic processeson ‘real’ samples [9, 10]. One step towards more complex systems along the coordinatenamed ‘complexity’ in figure 1 is taken in this review, namely the brief discussion of theinfluence of modifiers, such as metals, on some properties of oxide surfaces.
2. Oxide surface preparation
‘The question of oxide preparation is central to all surface-science investigations, andherein lies what is possibly the greatest difficulty of all.’ This is a quotation fromthe book by Henrich and Cox [6] and it is the starting point of the present discussion.Compared with elemental solids, the preparation of any stoichiometric compound surface, inparticular oxides, is extremely difficult, especially if we consider the preparation of different
286 H-J Freund et al
Figure 1. Schematics of adsorbate systems of different complexity illustrating the so calledpressure gap.
crystallographic orientations of oxide surfaces. Figure 2 summarizes the appropriatemethods of oxide surface preparation using the example of an ionic binary oxide of rocksalt structure, i.e. NiO, which we shall use as the standard example throughout this review.At the top, a schematic representation of a single NiO crystal is shown. At the side of thecrystal the so-called non-polar (100) surfaces are exposed, and it is cut such that it exposesthe metal-ion terminated (111) surface at the front. Non-polar and polar surfaces of ionicbinary oxides exhibit fundamentally different behaviour as far as cleavage, which is one ofthe desirable preparation methods, is concerned. The reason for this was pointed out a longtime ago and is intimately connected with the surface potential [11]. Briefly, for a non-polarsurface, such as the NiO(100) surface, the surface potential is finite (e.g. 1.74 J m−2) [12].Therefore, NiO may be easily cleaved along the (100) direction (see the pattern images fromlow-energy electron diffraction (LEED) in figure 2). In such an experiment electrons withkinetic energies of say 10–300 eV are elastically back-reflected from the sample and thediffraction pattern is recorded on a screen. However, the surface potential per unit chargediverges for a polar surface, e.g. the NiO(111) surface, according to [13]
V = 2π
S
[Nb(2σ − 1) + (1 − σ)b
](1)
where the symbols are explained in figure 3.S corresponds to the area of the surface unitcell. N is the number of layers, separated by the distanceb. The surface chargeσ ismeasured in units of the charge on a typical bulk layer. ForN → ∞ the surface potentialdiverges so that cleavage of a rocksalt structure in this direction is not possible. Thus, if
Oxide surfaces 287
Figure 2. Methods for the preparation of NiO(100) and NiO(111) surfaces. The correspondingLEED patterns are shown.
we are interested in preparing surfaces of different surface orientation, cleavage is not themost favourable method of preparation for an ionic polar oxide surface. Table 1 [14–36]contains surfaces which have been prepared by cleavage and are well characterized.
Equation (1) shows that the surface potential for a polar surface can have a finitevalue for a thin film (N small) or for a single crystal provided that the surface charge isreduced; forσ = 1
2 the first term in (1) vanishes. Such a reduction of the surface chargecan be achieved in different ways: reduction of the number of ions in the topmost layer,reduction of the charge of each ion in the topmost layer (e.g. from Ni2+ to Ni+), geometricreconstruction or adsorption of charged species, for instance OH−. Consequently, there arealternative methods of preparation of stable polar surfaces. One is to cut a crystallographicplane mechanically or by spark erosion and then polish the surface [6]. This techniqueis similar to procedures known for the preparation of metal surfaces. Once the sampleresides in the vacuum chamber, these surfaces are sputtered and consecutively annealedin oxygen in order to replace oxygen vacancies induced via sputtering. This method hasbeen successfully applied to bulk samples. TiO2 is an example where this method has beenfrequently used with apparently satisfactory results. Again, of course, preparation of polarsurfaces is difficult, because these surfaces have the tendency to facet in the preparationprocess.
288 H-J Freund et al
Figure 3. Charge distribution in polar oxide surfaces (cut perpendicular to the surface).
Table 1. Binary oxide surfaces prepared via cleavage.
Another, rather different method of preparation is also represented in figure 2. Oxidefilms of varying thickness may be grown on metallic substrates [37]. The geometry of themetallic substrate then determines to a large extent the structure of the oxide film. It isthis technique that allows preparation of non-polar as well as polar surfaces, and we shallcome back to the stabilization mechanisms for the polar surfaces later in this review [8].We note, of course, that the structural quality of the film depends very strongly on theepitaxial relation between the lattice constants of the metallic substrate and the oxide film.In other words, we can to a certain extent control the defect structure and defect density ofthe layers grown by controlling the lattice mismatch. Three techniques have been mainly
Oxide surfaces 289
Figure 4. Different methods for the preparation of thin epitaxial oxide films.
used for this purpose [7] and are schematically summarized in figure 4. The one indicatedat the top is the most simple one and makes use of the fact that a metal single crystal maybe oxidized and a more or less well ordered oxide film is formed. Of course, if there isa large lattice mismatch between metal and oxide lattice constants, the film may be defectrich. An example is again shown in figure 2 for the system NiO(100)/Ni(100) in form ofa LEED pattern showing rather wide spots. Less strained layers may be grown by choosinginert metal substrates, onto which the metal to be oxidized is evaporated. The oxidationmay be done after or during deposition. If the lattice constants of the inert substrates arechosen properly, the grown structure may exhibit long-range order of high quality. In thepreparation of the metal substrate, molecular beam epitaxy methods may be used includingbuffer layer techniques, etc. The third technique indicated in figure 4 is the oxidation ofalloy surfaces. This technique, of course, bears the same inherent difficulties as the topone in figure 4. The advantage here is that the physical properties of the alloy may beadvantageous for the preparation process. We have used this technique to grow a wellordered Al2O3 film on NiAl(110) [39]. The Al2O3 film can be heated to above 1000◦Cwithout melting the substrate. This is of crucial importance to order the layer. On Al metalsuch a heat treatment would lead to a melting of the substrate before the oxide layer couldorder; one of the reasons why Al2O3 overlayers on Al are often amorphous.
3. Structural characterization
A very comprehensive collection of structural information fromLEED, reflection high-energyelectron diffraction (RHEED), He scattering and ion scattering spectroscopy (ISS) on bulkoxide materials can be found in [6]. Scanning tunnelling microscopy (STM) and atomicforce microscopy (AFM) studies on oxide surfaces under ultrahigh vacuum (UHV) conditions,
290 H-J Freund et al
Figure 5. (a) STM topograph of anα-Fe2O3 (0001) surface [59]. (b) Surface structures ofdifferent iron oxides. Iron ions are depicted as small circles and oxygen ions are shown as largecircles. Reproduced from [58].
yielding atomically resolved information, are only starting to be published in the literature.For TiO2 surfaces [40–44] in various orientations ((110), (100), (001))STM studies underUHV conditions have been reported, and interesting novel information on reconstructionsand surface steps were deduced. Most of this information is collected in [6], see also [45].Under ambient conditions a series of oxide surfaces have been studied bySTM and AFM
techniques [45–58]. A particularly interesting example that demonstrates the possibilities ofUHV–STM in revealing the real-space topology of an oxide surface is shown in figure 5(a).Thornton and his group have recently presented this atomically resolvedSTM study ofan annealedα-Fe2O3(0001) surface [59]. It has been known for quite some time that asputteredα-Fe2O3(0001) surface annealed at about 1100 K reveals a complexLEED pattern
Oxide surfaces 291
that has been interpreted as multiple scattering across a Fe3O4/FeO/Fe2O3 interface [60–62].Upon annealing at temperatures slightly below this value the surface appears to stabilizeto another structure, namely Fe3O4(111). Figure 5(a) clearly reveals the coexistence ofordered domains ofα-Fe2O3 andβ-FeO structures as seen by the spacings of the protrusionsin comparison with the schematic drawings in figure 5(b). The areas in between exhibit anatomic arrangement compatible with aγ -Fe3O4 structure. In total this structure gives riseto a rather complicatedLEED pattern. If the observed surface compositions are comparedwith the bulk phases predicted on the basis of the Fe–O phase diagram, it turns out thatthe surface structures are different from the predicted bulk phases [61, 62]. This has to beexpected for many oxide surfaces.
In the following we shall not further discuss structures observed on bulk single crystals,but rather consider structures on thin oxide films, because this preparation technique allowsus to deliberately stabilize structures not easily observable on bulk single crystals. Againwe shall discuss the case of NiO as an example of a simple rocksalt structure in somewhatmore detail [38, 63–75].
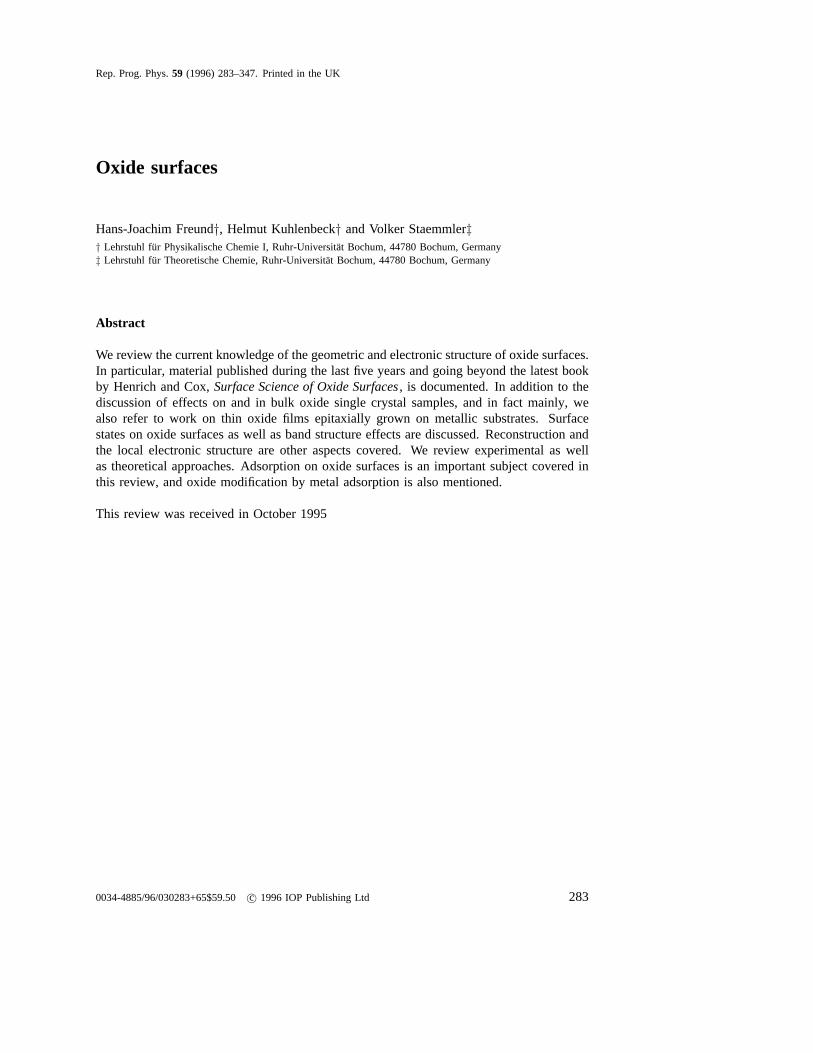
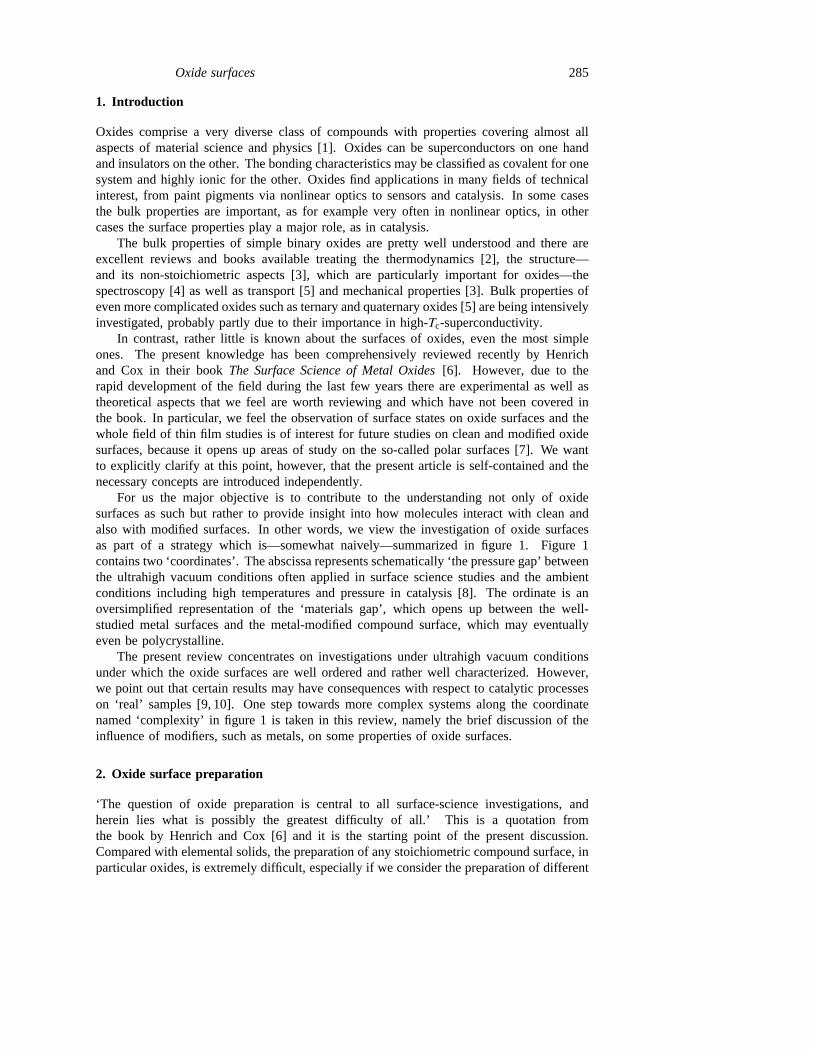
NiO(100) may be formed on a Ni(100) substrate via oxidation [76, 77]. Figure 6(a)shows aSPA–LEED pattern of the film [64]. Here aLEED system with special electronoptics to allow spot profile analysis (SPA) has been used. The(0, 0) spot of the oxidedoes not coincide with the(0, 0) spot of the Ni-substrate indicating the growth of tiltedterraces, which eventually cover the metal substrate completely. In figure 6(b) the situationis schematically plotted (cf figure 3), and in figure 6(c) an STM picture revealing this filmmorphology is shown for comparison. The tilt is compatible with the large misfit of latticeconstants of 18%(a(NiO) = 4.16A, a(Ni) = 3.52A) [78]. If a NiO(100) film is grown ona Ag(100) substrate, the film quality improves as seen in theSTM topographs of figure 7[79]. A growing film shows very nice square epitaxial NiO(100) islands. Here the misfitis much smaller, namely 3%(a(NiO) = 4.16A againsta(Ag) = 4.09A) [78] and thus thefilm growth leads to smoother morphologies.
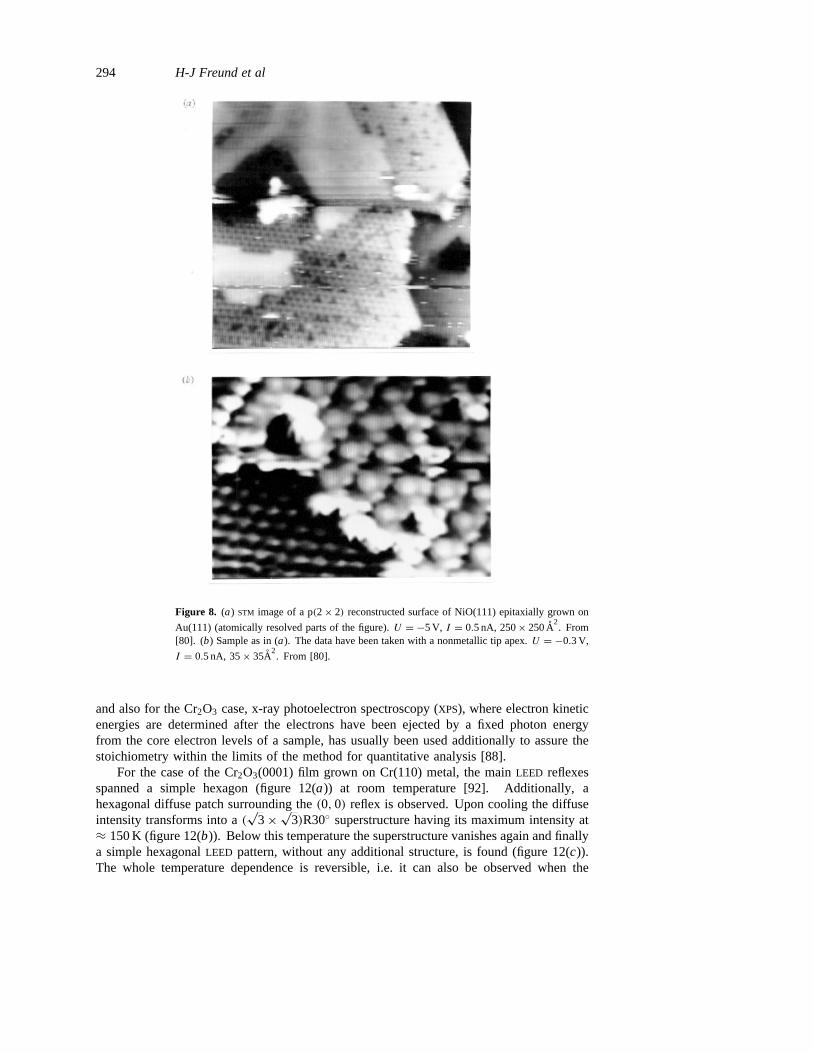
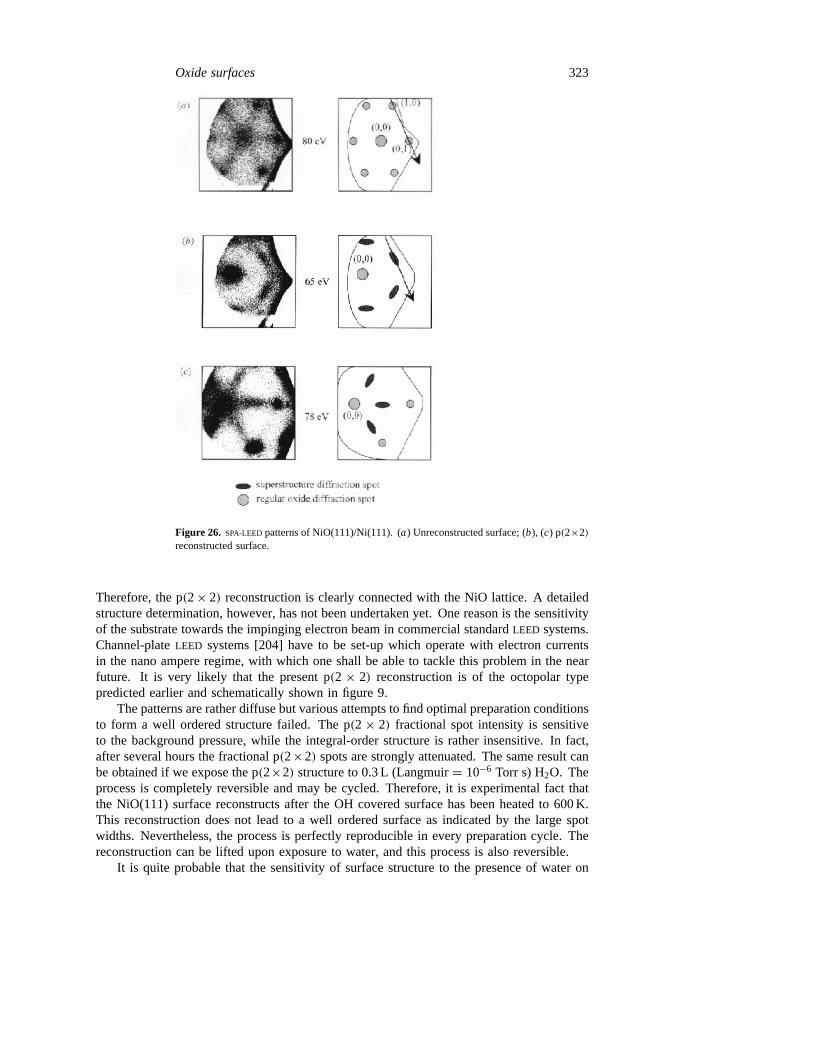
The growth of a polar NiO(111) surface on a Au(111) substrate is shown in figure 8[80, 81]. Thin films with high-qualityLEED patterns may be grown, which even show atomicresolution inSTM. Two situations may be distinguished. In one situation three domains ofa NiO(100) surface grow. For slightly different preparation conditions, on the other hand,a hexagonal structure corresponding to a p(1 × 1) NiO(111) surface can be clearly seen(figure 8). Upon heat treatment, this surface undergoes a reconstruction from the p(1 × 1)
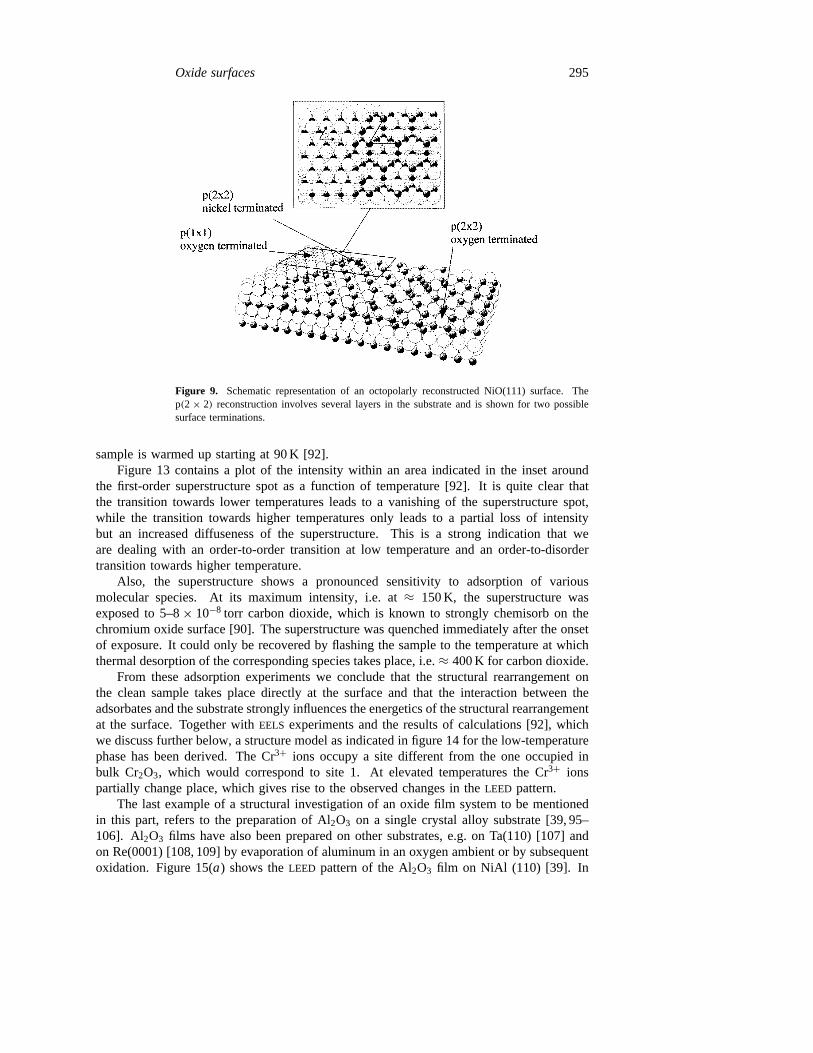
structure to a p(2× 2) structure, as is revealed byLEED. Concomitantly, theSTM shows theformation of small NiO pyramids, the tips of which form the p(2×2) superstructure. Figure 9shows schematically what happens: A very thin (e.g. 4 layers) NiO(111) film has a finitebut rather high surface energy(4.5 J m−2) [12, 82], as deduced from (1). The surface mayreconstruct according to the proposal by Lacmann [11] via the formation of an octopolarstructure as plotted in figure 9. This reduces the surface energy to 4.28 J m−2 [12, 82].Very similar structural changes are found for a much thicker NiO(111) film grown on topof a Ni(111) metallic substrate, but here chemical reactivity and stabilization by chemicalprocesses play a more important role, as further discussed below in this paper [8, 70].
As a second example we would like to refer to an x-ray photoelectron diffraction (XPD)study of a thin FeO(111) film grown on Pt(111) [83]. In such an experiment the intensityvariations of a core-electron ionization is recorded as a function of photon energy, thusprobing internuclear scattering. In the case of FeO/Pt(111) the internuclear distances inthe film have been determined by Fadley’s group [83]. Table 2 summarizes the observedorientation of some thin films. Weiß and others [61, 62] also investigated the structureof a somewhat thicker iron oxide film. TheLEED patterns are shown in figure 10(a).
292 H-J Freund et al
Figure 6. (a) SPA-LEEDpattern of an NiO(100) film epitaxially grown on Ni(100). (b) Schematicdiagram showing the experimentally found possible arrangements of the tilted NiO(100)crystallites relative to the steps on the Ni(100) substrate. (c) STM topograph of a thin NiO(100)film epitaxially grown on Ni(100). The formation of crystallites with sizes of 50–100A isclearly visible.
They found strong indications on the basis of aLEED analysis [61] and ofXPS data [84]that oxidation of iron deposited on top of a Pt(111) single crystal surface does lead toa Fe3O4 surface layer rather than a reconstructed FeO surface. The Fe3O4(111) surfaceand the reconstructed FeO(111) surface would lead to the sameLEED pattern, since thereconstruction results in a unit mesh of twice the size of the bulk truncated FeO(111)surface [60]. One argument put forward by Weiß and others [61, 62, 84] favouring the spinellsurface, i.e. Fe3O4(111), is the instability expected for FeO under the chosen circumstances(UHV, room temperature) based on the bulk phase diagram [85]. Support for the argumentis found in experiments where a Fe2O3 crystal surface reconstructs and leads to the same
Oxide surfaces 293
Figure 7. STM topograph of23 ML of Ni on Ag(100) evaporated in an O2 atmosphere without
annealing. This procedure leads to the formation of NiO(100) on the Ag(100) substrate.U = 1 V, I = 0.5 nA, 10× 17 nm2.
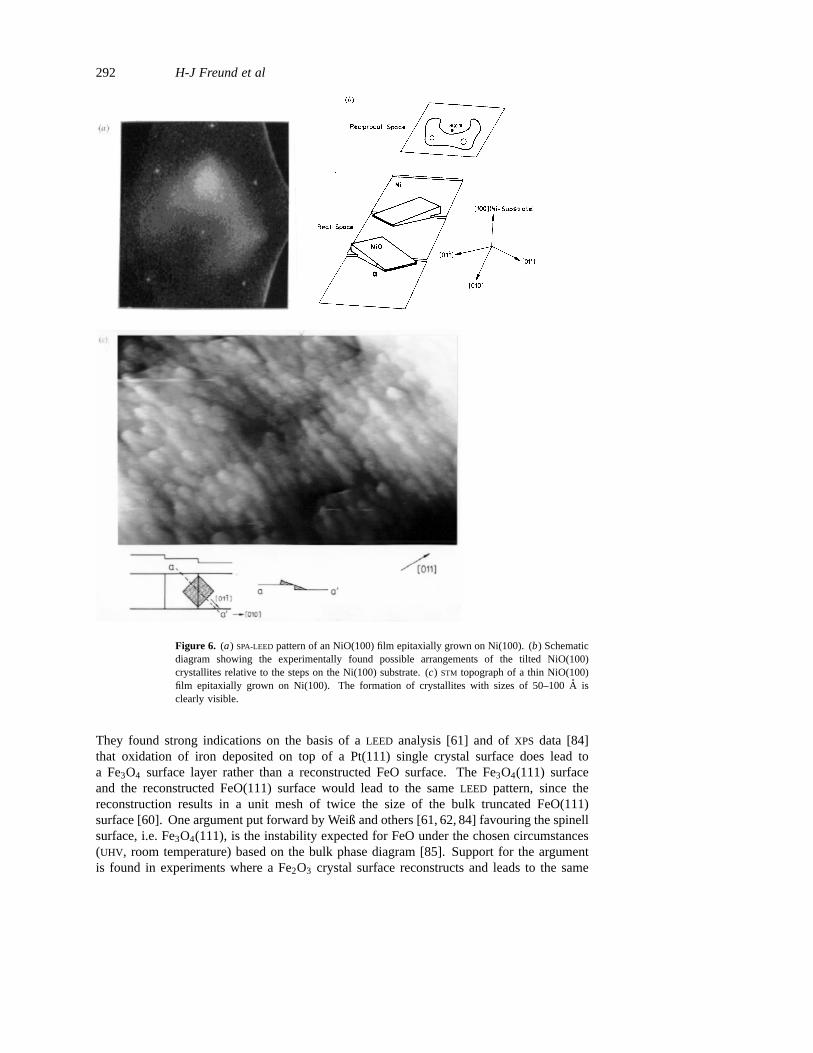
Table 2. Parameters of some oxide films on different metallic substrates [84].
p(2× 2) pattern which has very recently also been identified to be a Fe3O4 surface [60, 62](see also figure 5(a)). Furthermore Weißet al performedLEED intensity calculations forseveral FeO(111) reconstructed surfaces and for an unreconstructed Fe3O4(111) surface [61].Best agreement with experimental data was achieved for the Fe3O4 surface [61, 62].
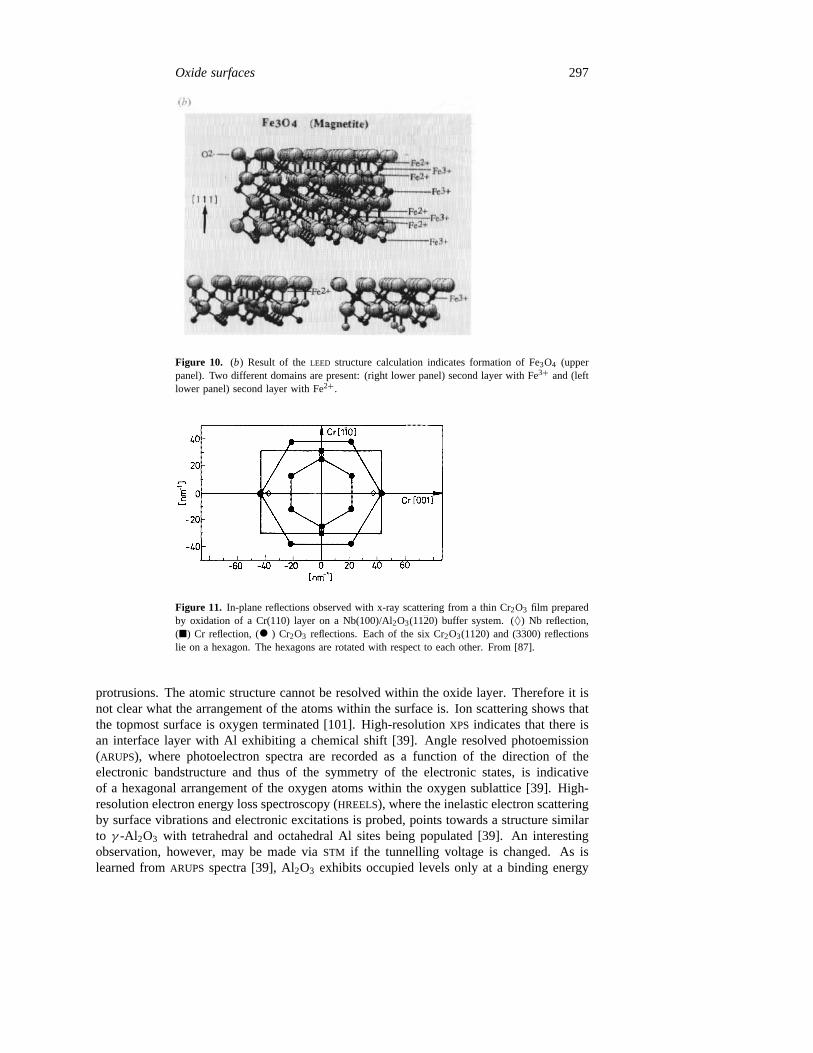
A technique which will prove very important for oxide structure determination in thenear future, is x-ray scattering [86]. We would like to mention a series of such studiesthat have recently been published by Zabel and his group on Cr2O3(0001) films grown ona system of buffer layers prepared via molecular beam epitaxy (MBE) methods [87]. Thesame film grown on a bulk Cr(110) metal substrate exhibits similar properties [88–94].The latter system has been studied in some detail with electron scattering methods [88–90]. DetailedSTM studies on these systems have not been reported yet. The x-ray andelectron scattering results agree that the orientation of the hexagonal Cr2O3(0001) array onthe Cr(110) substrate is as indicated in figure 11 [87]. X-ray scattering can be used to showthat the interface between the Cr2O3(0001) film and the Cr(110) substrate is sharp, it caneven be used to count the number of Cr layers that are necessary to form a certain numberof Cr2O3 layers [87]. Thus the stoichiometry of the film can be secured. In other cases,
294 H-J Freund et al
Figure 8. (a) STM image of a p(2 × 2) reconstructed surface of NiO(111) epitaxially grown on
Au(111) (atomically resolved parts of the figure).U = −5 V, I = 0.5 nA, 250× 250A2. From
[80]. (b) Sample as in (a). The data have been taken with a nonmetallic tip apex.U = −0.3 V,
I = 0.5 nA, 35× 35A2. From [80].
and also for the Cr2O3 case, x-ray photoelectron spectroscopy (XPS), where electron kineticenergies are determined after the electrons have been ejected by a fixed photon energyfrom the core electron levels of a sample, has usually been used additionally to assure thestoichiometry within the limits of the method for quantitative analysis [88].
For the case of the Cr2O3(0001) film grown on Cr(110) metal, the mainLEED reflexesspanned a simple hexagon (figure 12(a)) at room temperature [92]. Additionally, ahexagonal diffuse patch surrounding the(0, 0) reflex is observed. Upon cooling the diffuseintensity transforms into a(
√3 × √
3)R30◦ superstructure having its maximum intensity at≈ 150 K (figure 12(b)). Below this temperature the superstructure vanishes again and finallya simple hexagonalLEED pattern, without any additional structure, is found (figure 12(c)).The whole temperature dependence is reversible, i.e. it can also be observed when the
Oxide surfaces 295
Figure 9. Schematic representation of an octopolarly reconstructed NiO(111) surface. Thep(2 × 2) reconstruction involves several layers in the substrate and is shown for two possiblesurface terminations.
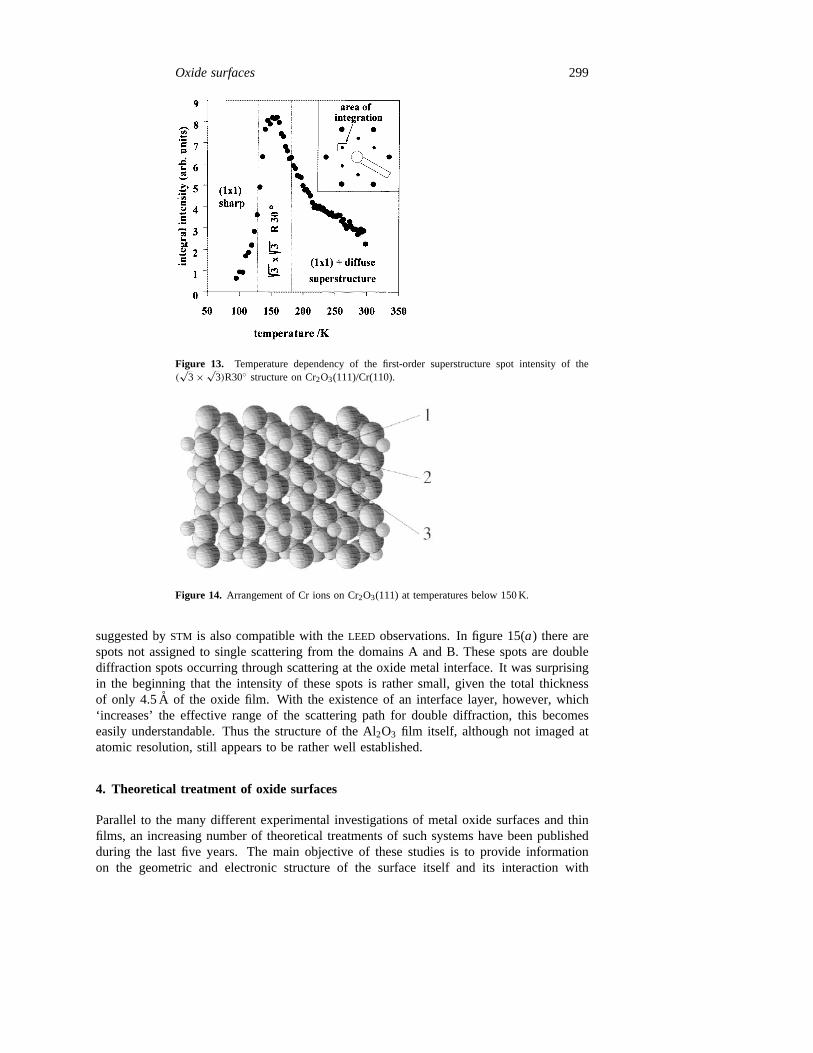
sample is warmed up starting at 90 K [92].Figure 13 contains a plot of the intensity within an area indicated in the inset around
the first-order superstructure spot as a function of temperature [92]. It is quite clear thatthe transition towards lower temperatures leads to a vanishing of the superstructure spot,while the transition towards higher temperatures only leads to a partial loss of intensitybut an increased diffuseness of the superstructure. This is a strong indication that weare dealing with an order-to-order transition at low temperature and an order-to-disordertransition towards higher temperature.
Also, the superstructure shows a pronounced sensitivity to adsorption of variousmolecular species. At its maximum intensity, i.e. at≈ 150 K, the superstructure wasexposed to 5–8× 10⁻⁸ torr carbon dioxide, which is known to strongly chemisorb on thechromium oxide surface [90]. The superstructure was quenched immediately after the onsetof exposure. It could only be recovered by flashing the sample to the temperature at whichthermal desorption of the corresponding species takes place, i.e.≈ 400 K for carbon dioxide.
From these adsorption experiments we conclude that the structural rearrangement onthe clean sample takes place directly at the surface and that the interaction between theadsorbates and the substrate strongly influences the energetics of the structural rearrangementat the surface. Together withEELS experiments and the results of calculations [92], whichwe discuss further below, a structure model as indicated in figure 14 for the low-temperaturephase has been derived. The Cr3+ ions occupy a site different from the one occupied inbulk Cr2O3, which would correspond to site 1. At elevated temperatures the Cr3+ ionspartially change place, which gives rise to the observed changes in theLEED pattern.
The last example of a structural investigation of an oxide film system to be mentionedin this part, refers to the preparation of Al2O3 on a single crystal alloy substrate [39, 95–106]. Al2O3 films have also been prepared on other substrates, e.g. on Ta(110) [107] andon Re(0001) [108, 109] by evaporation of aluminum in an oxygen ambient or by subsequentoxidation. Figure 15(a) shows theLEED pattern of the Al2O3 film on NiAl (110) [39]. In
296 H-J Freund et al
Figure 10. (a) LEED patterns for FeOx layer on Pt(111). For comparison the pattern of cleanPt(111) is shown.
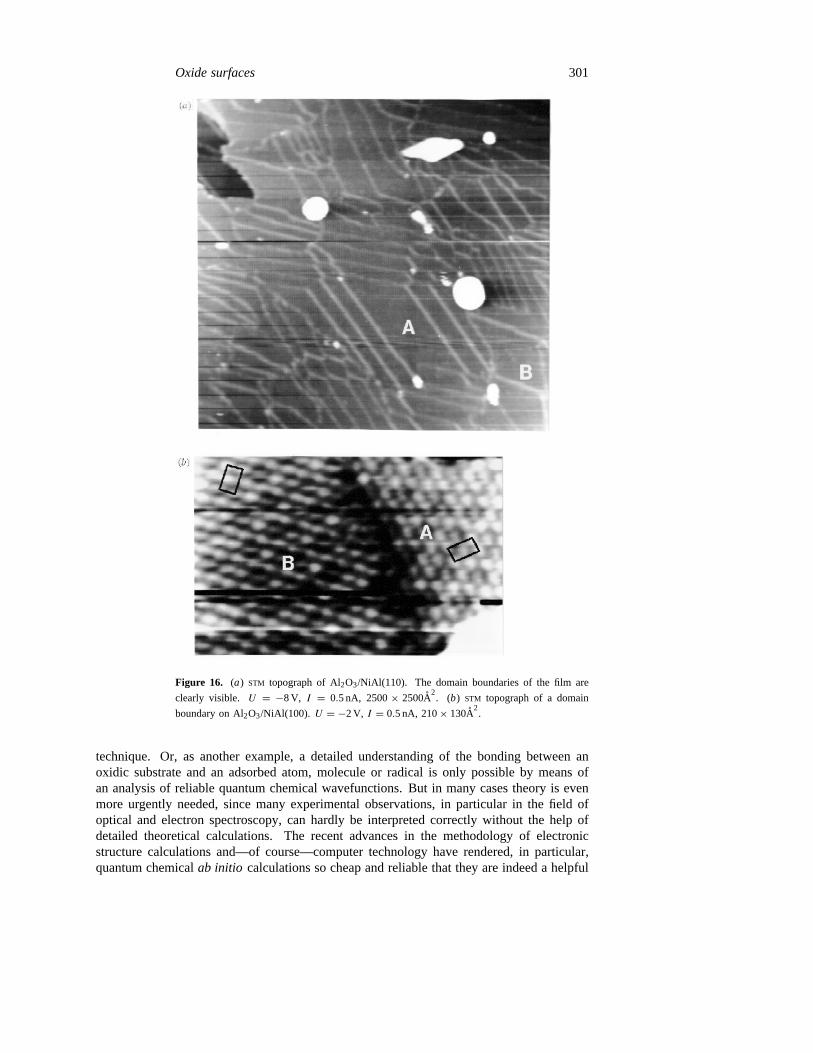
figure 15(b) an STM topograph of the growing film is plotted [99]. The thickness of the filmturns out to be only 4.5A, as revealed through Auger spectroscopy [110] andXPS, but thefilm covers the whole surface. This can be checked quantitatively via CO titration within atemperature programmed desorption (TPD) measurement [100]. As has been discussed forthin alkali halide films on Ge substrates [111], we must assume that the Al2O3 film coversthe NiAl(110) substrate, including substrate steps, like a ‘carpet’. Only very few steps arefound on the Al2O3 surface [99]. Figure 16(a) shows a large areaSTM picture of the film.There is a characteristic regular line pattern observed and a net of less regular white linesis overlaid. We may understand these patterns by investigating theLEED structure in moredetail. Figure 15(a) assigns the spots observed to two almost rectangular unit meshes withbasis vectors(a1 = 17.9A, a2 = 10.6A) which are rotated with respect to each otherby 24◦ [39]. The two domains, called A and B in the following, are commensurate alongthe (110) direction of the NiAl(110) surface and incommensurate along the (001) direction.Figure 16(b) shows anSTM close-up of a domain boundary between A and B. The unitcell of the oxide is marked by a centred rectangular, almost hexagonal, arrangement of
Oxide surfaces 297
Figure 10. (b) Result of theLEED structure calculation indicates formation of Fe3O4 (upperpanel). Two different domains are present: (right lower panel) second layer with Fe3+ and (leftlower panel) second layer with Fe2+.
Figure 11. In-plane reflections observed with x-ray scattering from a thin Cr2O3 film preparedby oxidation of a Cr(110) layer on a Nb(100)/Al2O3(1120) buffer system. (♦) Nb reflection,(�) Cr reflection, (• ) Cr2O3 reflections. Each of the six Cr2O3(1120) and (3300) reflectionslie on a hexagon. The hexagons are rotated with respect to each other. From [87].
protrusions. The atomic structure cannot be resolved within the oxide layer. Therefore it isnot clear what the arrangement of the atoms within the surface is. Ion scattering shows thatthe topmost surface is oxygen terminated [101]. High-resolutionXPS indicates that there isan interface layer with Al exhibiting a chemical shift [39]. Angle resolved photoemission(ARUPS), where photoelectron spectra are recorded as a function of the direction of theelectronic bandstructure and thus of the symmetry of the electronic states, is indicativeof a hexagonal arrangement of the oxygen atoms within the oxygen sublattice [39]. High-resolution electron energy loss spectroscopy (HREELS), where the inelastic electron scatteringby surface vibrations and electronic excitations is probed, points towards a structure similarto γ -Al 2O3 with tetrahedral and octahedral Al sites being populated [39]. An interestingobservation, however, may be made viaSTM if the tunnelling voltage is changed. As islearned fromARUPS spectra [39], Al2O3 exhibits occupied levels only at a binding energy
298 H-J Freund et al
Figure 12. LEED photographs (primary energy 23.7 eV) of Cr2O3(111)/Cr(110) after a flash to1000 K taken at different temperatures: (a) about 300 K; (b) about 150 K; (c) about 90–100 K.
starting at 4 eV below the Fermi level. The substrate emission, which is still found atEf dueto the limited thickness of the layer [39], may be used for tunnelling as well. If the tunnellingvoltage is decreased, anSTM topograph as shown in figure 17(a) is found [99]. It exhibitsatomic resolution and may be correlated with the structure of the bcc NiAl(110) substrate.A schematic representation of this correlation as shown in figure 17(b) suggests how thesubstrate has to be reconstructed within the interfacial region in order to accommodate theoxide layer. The lateral motion of a small fraction of atoms in the interface is sufficient toassure the proper local site for the repeat units. The existence of such an interfacial layer, as
Oxide surfaces 299
Figure 13. Temperature dependency of the first-order superstructure spot intensity of the(√
3 × √3)R30◦ structure on Cr2O3(111)/Cr(110).
Figure 14. Arrangement of Cr ions on Cr2O3(111) at temperatures below 150 K.
suggested bySTM is also compatible with theLEED observations. In figure 15(a) there arespots not assigned to single scattering from the domains A and B. These spots are doublediffraction spots occurring through scattering at the oxide metal interface. It was surprisingin the beginning that the intensity of these spots is rather small, given the total thicknessof only 4.5A of the oxide film. With the existence of an interface layer, however, which‘increases’ the effective range of the scattering path for double diffraction, this becomeseasily understandable. Thus the structure of the Al2O3 film itself, although not imaged atatomic resolution, still appears to be rather well established.
4. Theoretical treatment of oxide surfaces
Parallel to the many different experimental investigations of metal oxide surfaces and thinfilms, an increasing number of theoretical treatments of such systems have been publishedduring the last five years. The main objective of these studies is to provide informationon the geometric and electronic structure of the surface itself and its interaction with
300 H-J Freund et al
Figure 15. (a) SPA-LEED patterns of Al2O3/NiAl(110) (top) and the unit cells in real space oftwo domains ofγ -Al 2O3(111) on NiAl(110) (bottom). The structure of theγ -Al 2O3(111) filmis distorted by the interaction with the substrate, giving rise to an experimentally observed largerectangular unit cell. (b) STM topograph of the growing Al2O3 film (patch with diagonal lines)near NiAl step edges (U = +4 V, I = 2 nA) [68].
adsorbates, which is complementary to the information that can be obtained experimentally.For instance, the relative thermodynamic stabilities of different surface reconstructions ofa polar surface can be determined much more directly by theory than by any experimental
Oxide surfaces 301
Figure 16. (a) STM topograph of Al2O3/NiAl(110). The domain boundaries of the film are
clearly visible. U = −8 V, I = 0.5 nA, 2500× 2500A2. (b) STM topograph of a domain
boundary on Al2O3/NiAl(100). U = −2 V, I = 0.5 nA, 210× 130A2.
technique. Or, as another example, a detailed understanding of the bonding between anoxidic substrate and an adsorbed atom, molecule or radical is only possible by means ofan analysis of reliable quantum chemical wavefunctions. But in many cases theory is evenmore urgently needed, since many experimental observations, in particular in the field ofoptical and electron spectroscopy, can hardly be interpreted correctly without the help ofdetailed theoretical calculations. The recent advances in the methodology of electronicstructure calculations and—of course—computer technology have rendered, in particular,quantum chemicalab initio calculations so cheap and reliable that they are indeed a helpful
302 H-J Freund et al
Figure 17. (a) STM topograph of Al2O3/NiAl(110) interface.U = −1 V, I = 1.5 nA, 90×90A2.
(b) Schematic representation of the atomic structure of the NiAl(110) surface below the Al2O3
film as derived from (a).
interpretative tool, even for systems as complex as oxide surfaces. This fact is reflected byan increasing number of papers that contain both experimental and theoretical results.
In the present section we briefly review the main computational methods that arecurrently used for studying non-local and local properties of oxide surfaces. Our mainemphasis will be on those methods that have been applied to interpreting the experimentalresults discussed later in this review. For more thorough presentations we refer to recenttextbooks on the theoretical aspects of heterogeneous catalysis [112–115] review articles
Oxide surfaces 303
[116, 117] and conference reports [7, 118–120]. Detailed theoretical results for specificsystems will be presented, together with the corresponding experimental data, in latersections of this review.
Table 3. Applicability and characteristics of different theoretical methods for oxide surfaces.
Property Interatomic potentials Band structure calculations Cluster calculations
Translational symmetry(periodicity) + + −Entries in parentheses denote properties that can be treated with the respective method, but only with largerdifficulties.
Characteristics of electronic Semi-empirical Density functional Ab initiostructure calculations methods theory calculations
Electrons treated valence el. all electrons all electronsvalence el. (PP) valence el. (PP)
Basis sets minimal flexible flexibleApproximations ZDO, NDO density noinvolved etc. functionalAdjustable parameters yes in the density no
functionalGround states
SCF yes yes yesdynamic correlation no included in the yes
density functionalExcited states some some yesNumerical effort ≈ N2 ≈ N3 ≈ N4 (SCF)–N5 (CI)Accuracy limited good good to excellent
Abbreviations: PP pseudopotentials;ZDO zero differential overlap;NDO neglect of differential overlap;SCF self-consistent field;CI configuration interaction;N number of electrons.
In accord with the vast diversity of the properties of bulk metal oxides and oxidesurfaces, the theoretical methods that are applied in this field cover the whole range frompurely empirical interatomic (or interionic) pair potentials via band structure methods tohighly sophisticated large-scale quantum chemicalab initio configuration interaction (CI)calculations. Table 3 gives a schematic account of the main characteristics and fields ofapplication of those methods that we will discuss in the following.
The simplest way to treat the energetics of ionic crystals and surfaces, includingproperties like equilibrium crystal structures, cohesive energies, phonon frequencies,compressibilities and so on, is the use of empirical or non-empiricalinterionic pair
304 H-J Freund et al
potentials. Such potentials may have the simple form [121]
V++(r) = q2
r
V−−(r) = q2
r+ A−− exp(−r/ρ−−) − C−−r−6 (2)
V+−(r) = −q2
r+ A+− exp(−r/ρ+−)
where it is assumed for simplicity that cations and anions have the same charge±q, thatthe Pauli-repulsion between the closed-shell ionic cores decays exponentially (Buckingham-type potential) and that the Pauli-repulsion between the small cations as well as thevan der Waals interaction between the cations and between cations and anions can beneglected. Of course, potentials with other functional forms (e.g. of Lennard–Jones type),with many more parameters and with the inclusion of three-body terms can be usedas well and have been proposed in the literature [122–127], but even the above form,which satisfies only the minimum requirements for describing the underlying physics(Coulomb interaction, Pauli-repulsion, and van der Waals attraction), contains six adjustableparameters: q, A−−, A+−, ρ−−, ρ+− and C−−. These parameters can be determinedcompletely empirically, e.g. by fitting to experimental data, or non-empirically byab initiocalculations. In both cases, the reliability of specific results obtained by means of pairpotentials depends to a large extent on the quality of the interaction potentials.
Interatomic pair potentials are currently used in the whole field of metal oxides formany purposes—from the investigation of structural properties of pure metal oxides (e.g. forMgO [123],α-Al 2O3 [124], α-Fe2O3 [125]) or clean and modified surfaces [126, 127] to thedynamics of adsorbed molecules [128] and the simulation of catalytic processes. Computerprograms employing interatomic potentials are now included in several of the commercialprogram packages which are widely used for the simulation of adsorption processes andcatalytic reactions. Here we will briefly present two examples, which are related to the laterdiscussion of polar surfaces and adsorption.
The first example concerns the stability of polar surfaces. Wolf [12] and Freitag [82]estimated the surface energies of the unreconstructed NiO(111) surface—which because ofequation (1) is unstable—and various possible reconstructions by using interionic potentialsof the form given in (2) and parameters as proposed by Catlowet al [129]. They foundthat the octopolar p(2 × 2) reconstruction (cf figure 9) is the most stable form of the pureNiO(111) surface with a surface energy of 5.16 J m−2 as long as the geometrical parametersof unrelaxed bulk NiO are used. Other possible reconstructions follow at condsiderablyhigher surface energies: hexagonal, missing row and rhombic reconstructions at 7.73, 8.18and 11.11 J m−2, respectively [82]. If relaxations of the geometries are allowed, all surfaceenergies are lowered, but the octopolar reconstruction remains the most stable form with asurface energy of 4.28 J m−2 [12]. (In this example, the relative stabilities of the differentreconstructions are not dependent on the set of interionic potentials used to estimate thesurface energies.) This result confirms the proposal of Lacmann [11] and is in agreementwith the LEED and STM experiments on the geometrical structure of the NiO(111) surfaceas discussed above.
The interaction between metal oxides or other ionic crystals and adsorbed moleculesis also frequently modelled through pair potentials, in particular if one is interested inthe structures of adsorbed monolayers, phase transitions between them, and the dynamicsof adsorbed particles, which can be investigated by the application of Monte Carlo or
Oxide surfaces 305
molecular dynamics techniques as soon as interaction potentials are available. Again, themain problem is the determination of reliable potentials, which in such cases have to describethree types of interaction: among the ions in the oxide, among the gas phase molecules, andbetween the surface and the adsorbates. The latter part causes particular difficulties becauseit is rather complicated, containing electrostatic, inductive, repulsive and van der Waals(dispersion) terms, and because generally not enough experimental data are available forthe determination of all necessary parameters. Furthermore, the interaction energies betweenoxide surfaces and neutral molecules are rather small and are based on a delicate balancebetween attractive and repulsive parts in the potential. Therefore, calculated properties of asubstrate/adsorbate system may depend very sensitively on the potential employed.
A very illustrative example for this problem is the system CO/NaCl(100) which is—together with CO/MgO(100)—the best studied example for the adsorption of CO on an ioniccrystal. Lakhlifi [130] and Picaudet al [131] used semi-empirical pair potentials containingan electrostatic contributionVE (with distributed multipoles instead of simple point charges),an inductive partVI (which turned out to be very small and could be discarded as well)and a dispersion–repulsion contributionVDR, which was represented either by a Lennard–Jones 12/6 or a Buckingham exp−6 potential. Picaudet al [131] were able to reproducethe isosteric heat of adsorption quite accurately (154 and 187 meV for the(1×1) monolayerof adsorbed CO, calculated with theLJ and exp−6 potentials, respectively, as comparedto the experimental value of 176± 20 meV at 55 K [132]) and to confirm the existence oftwo energetically equivalent commensurate(1× 1) and(2× 1) phases of the adsorbed COmonolayer. However, the adsorption geometry for a single CO molecule turned out to bedifferent for the two potentials. If the Buckingham exp−6 potential is used CO adsorbeson top of Na+ in an upright orientation, with theLJ potential it is shifted along the Na+ rowby about 1.2A and is tilted by 30◦. The authors close the paper by stressing the necessityof reliable ab initio calculations. Similarly, Lakhlifi [130] finds CO shifted and tilted onNaCl(100) (a Lennard–Jones ansatz for the dispersion–repulsion term was also used), andLakhlifi and Girardet [133] find CO shifted and tilted on MgO(100) also in contrast to allelectronic structure calculations on this system, which have been reviewed recently by Saueret al [117].
The situation is even worse for the adsorption on more complicated surfaces such asTiO2(110) (rutile). It is not only the complex geometrical structure of the surface (missingrow), but the difficulty of representing the charge distribution in bulk TiO2 or at the (110)surface by a suitable model of point charges or distributed multipoles (the formal oxidationnumbers+4 and−2 represent much too high ionicities) that render the determination ofempirical potentials as well as of realistic embedding models extremely difficult [134–136].
The main advantage of interatomic potentials is that they provide a very fast method forsimulating the static geometrical structures and the dynamical properties of systems with arather large number of particles, as for instance a substrate/adsorbate system consisting ofbulk and surface ions and adsorbed molecules. However, they do not describe the electronicstructure of the constituent particles. As (2) indicates, it is only the global properties ofthe atoms or ions that enter into the parametrization (charge, ionic radius, polarizability,etc). This has two consequences. First, pair potentials can only be used if these propertiesare not changed by interaction among the particles in the system, i.e. if the ions keep theiridentity in the ensemble (like, e.g. individual molecules in a fluid system). This holds toa large extent for the ions in a metal oxide, provided that the bonding is predominantlyionic as in the late transition metal oxides, but certainly not for metal atoms in a bulk metalcrystal or at a metal surface. Secondly, changes in the electronic structure, for instance d–dexcitations within the 3d shell of a Ni2+ ion in NiO, cannot be accounted for by interatomic
306 H-J Freund et al
potentials. This is generally no limitation for alkali or alkaline earth metal oxides becausethese cations do not possess low-lying excited electronic states and their interactions can bevery well described using the charges, ionic radii, etc. of the respective electronic groundstates. For transition metal oxides, on the other hand, many interesting properties, e.g.EEL
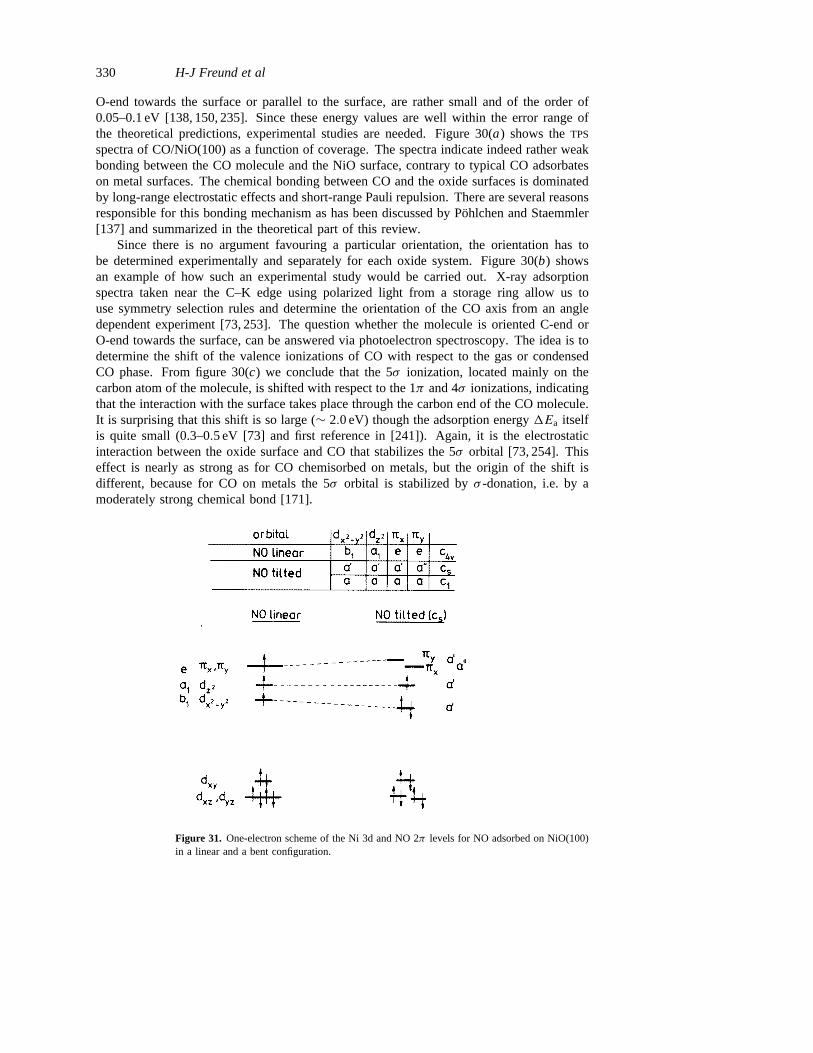
spectra (see below) or magnetic couplings, cannot be described at all by means of pairpotentials; for other properties, for instance adsorption energies or geometries, one has tocheck carefully whether or not details of the electronic structure of the partly filled shellplay a role or can be neglected. The main difference between the bonding of CO and NOto the NiO(100) surface, for instance, is caused by the singly occupied 3d orbitals in Ni2+.The CO molecule, which does not contain unpaired electrons, is only bound by electrostaticforces to the (100) surface (physisorption) [137] while the unpaired electron of NO canform a weak chemical bond with the singly occupied 3dz2 orbital in Ni2+. This is the originof the weak chemisorption and of the tilt angle of NO with respect to the surface normalin NO/NiO(100) [63, 138–140].
The methods that describe the electronic structure explicitly and are used in theinvestigation of oxide surfaces can be divided into two groups. One group contains bandstructure calculations, i.e. methods which take care of the infinite periodic structure of asingle crystal or a single crystal surface from the very beginning and calculate one-electronwave functions (= orbitals)φi(k) and one-electron energiesεi(k) as functions of the wavevector k in the reciprocal space. Due to the explicit incorporation of the periodicity ofthe crystal lattice, the actual dimension of such a calculation depends only on the size ofthe unit cell [141]. The alternative possibility is cluster calculations [118, 120], in which afinite cluster of atoms or ions is treated explicitly, like a small molecule, and can be furtherembedded in an external field in order to simulate the rest of the crystal or film. Such adescription is particularly suitable if one is interested in local effects like adsorption, localexcitations, defects and so on. Of course, the quality of the results of a cluster descriptiondepends on the size and form of the cluster, on the localizability of the effect to be studiedand to a large extent on the nature of the chemical bond in the crystal. The numerical effortinvolved in cluster calculations increases rather quickly with the size of the cluster. Anadvantage of cluster calculations is that one can use the whole spectrum of quantum chemicalmethods, as developed for small molecules, almost without modifications. For transitionmetal oxides, where configuration interaction among the many-electron configurations ofthe incompletely filled 3d shell and the O(2p) shells is necessary, this is really a decisiveadvantage.
Both band structure and cluster calculations can be performed at different levels ofsophistication. Semi-empirical methods, density functional theory, andab initio calculationsare all used for the treatment of oxide surfaces. Some of the characteristics of theseapproaches are summarized in the second part of table 3. For practical applications, the maindifferences lie in the necessary computer time which due to the inherent approximations,scales only withN2 for semi-empirical methods, withN4 (SCF) to N5 (CI) or even higher forab initio methods, while density functional approaches are in between. Roughly speaking,the accuracy that can be achieved behaves in the opposite manner, but recent advancesin density functional theory (general gradient corrections) [142–144] make this method afast and very reliable tool, in particular for determining equilibrium geometries. In thefollowing we will concentrate onab initio methods since most of the experiments to bediscussed in this review are concerned with spectroscopic properties and weak interactionsbetween the oxidic substrates and adsorbates, and for these propertiesab initio methodsyield more reliable results than the other approaches.
The most natural method for studying the electronic structure of a pure, clean, well-
Oxide surfaces 307
ordered single-crystal surface or film isband structure theoryin either its semi-empirical,density functional orab initio SCF form. However, its results are only of rather limitedvalue for oxide surfaces. Of course, the geometrical structures of crystals, surfaces, filmsand adsorbed monolayers can be generally determined to a rather high degree of accuracy,but these properties are in most cases known experimentally. Reliable information aboutelectronic charge distributions and ionicities can be obtained as well. On the other hand, thecalculated band structures themselves are often not very reliable unless final state effects areincluded [145], since screening effects are large in oxides and may differ considerably fromone band to the other, e.g. from localized Ni(3d) to delocalized O(2p) orbitals. Furthermore,the systematic band structure description of the electronic structure of 3d transition metaloxides, in particular for the antiferromagnetic insulators such as CoO and NiO is stillcontroversely discussed [146]. A local description can offer several advantages. The sameholds true for adsorption processes, which—at least for oxide surfaces—are predominantlylocal in nature. They can be treated by band structure methods using the ‘supercell’technique [147, 148], which consists in repeating the local adsorption site periodically andapplying periodic boundary conditions. This technique has been applied, e.g. to H2O/TiO2
[149] or CO/MgO [150], but the more direct access to local processes is the cluster approach.The majority of the theoretical treatments of oxide surfaces, in particular if local
properties like core ionization, d–d excitations, adsorption processes, or defects areconsidered, are currently performed by means ofcluster calculations, some of them withsemi-empirical methods, but many more with density functional orab initio techniques. Inthe following we will not give a systematic and complete survey of the existing literature(for this purpose we refer to the recent review by Saueret al [117] and the workshop reportsedited by Pacchioniet al [118, 120], but we will discuss the possibilities and limitations ofthe cluster approach for the example of the neutral NiO(100) surface [63, 69, 137–140, 151].Other cubic oxides (MgO, CaO, CoO) and neutral surfaces of oxides with more complicatedcrystal structures (TiO2(110)) can be treated similarly. This is also possible for unstablepolar surfaces (NiO(111), Cr2O3(111), these two examples are discussed below, ZnO(0001)[152] and Cu2O(100) [153]) provided that a reasonable cluster model and embedding schemecan be designed.
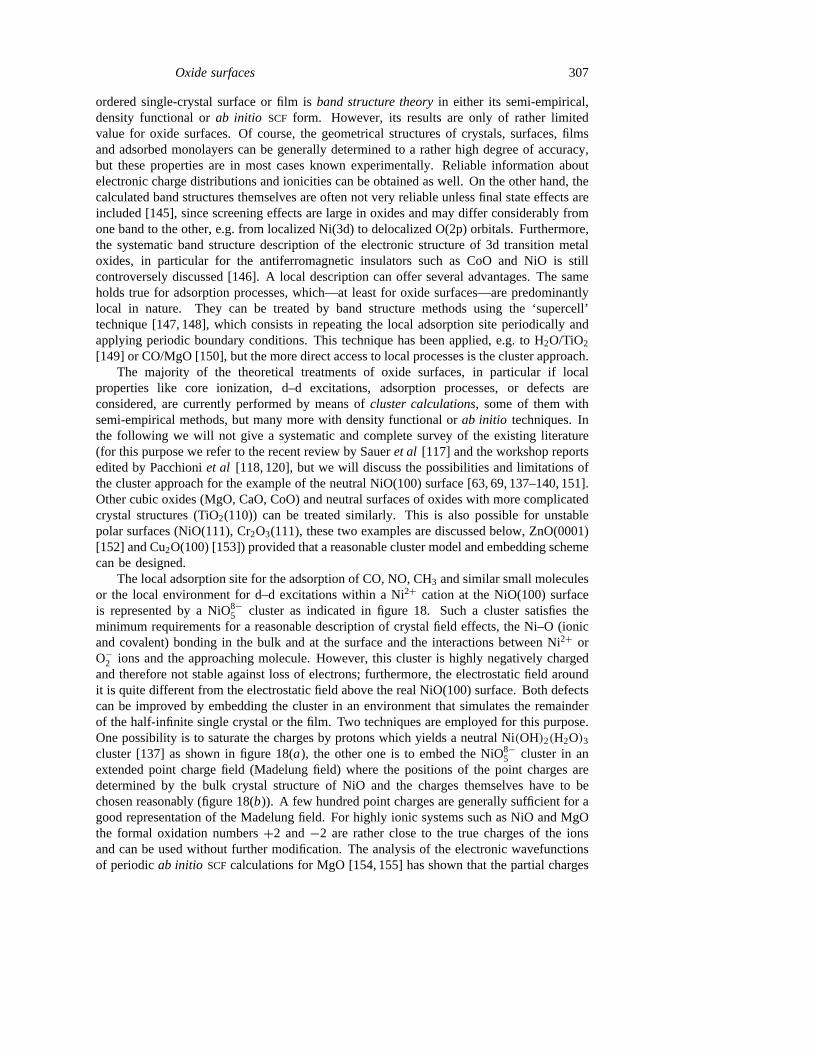
The local adsorption site for the adsorption of CO, NO, CH3 and similar small moleculesor the local environment for d–d excitations within a Ni2+ cation at the NiO(100) surfaceis represented by a NiO8−
5 cluster as indicated in figure 18. Such a cluster satisfies theminimum requirements for a reasonable description of crystal field effects, the Ni–O (ionicand covalent) bonding in the bulk and at the surface and the interactions between Ni2+ orO−
2 ions and the approaching molecule. However, this cluster is highly negatively chargedand therefore not stable against loss of electrons; furthermore, the electrostatic field aroundit is quite different from the electrostatic field above the real NiO(100) surface. Both defectscan be improved by embedding the cluster in an environment that simulates the remainderof the half-infinite single crystal or the film. Two techniques are employed for this purpose.One possibility is to saturate the charges by protons which yields a neutral Ni(OH)2(H2O)3
cluster [137] as shown in figure 18(a), the other one is to embed the NiO8−5 cluster in an
extended point charge field (Madelung field) where the positions of the point charges aredetermined by the bulk crystal structure of NiO and the charges themselves have to bechosen reasonably (figure 18(b)). A few hundred point charges are generally sufficient for agood representation of the Madelung field. For highly ionic systems such as NiO and MgOthe formal oxidation numbers+2 and−2 are rather close to the true charges of the ionsand can be used without further modification. The analysis of the electronic wavefunctionsof periodicab initio SCF calculations for MgO [154, 155] has shown that the partial charges
308 H-J Freund et al
Figure 18. Cluster model for the adsorption of NO at the NiO(100) surface. The NiO8−5 cluster
is saturated by protons (a) or embedded in a semi-infinite Madelung field (b) (only a few pointcharges are indicated).
at the ions are very close to+2.0 (1.98± 0.03, slightly different values were obtained withdifferent basis sets), density functional calculations [150, 156] gave slightly lower ionicitiesof about 1.8. It should be noted that partial charges are not physical observables, anddifferent schemes for analysing the electronic wavefunctions (population analysis, Bader’stopological analysis, or effective Madelung field [156]) will in general yield different results,so do different computation schemes (SCF, CI or density functional approaches, periodic orcluster calculations). It is generally assumed thatSCF calculations overestimate ionicities.For MgO and NiO, all estimated ionicities lie in the rather narrow range between 1.8 and2.0 both for ions in the bulk and at the (100) surface. Semiempirical calculations, however,yield consistently much lower ionicities, for MgO only of the order of 1.0 [157].
For more covalently bound systems such as TiO2 and for ions at polar surfaces thetrue ionicities might deviate appreciably from the formal oxidation numbers. In TiO2, pointcharges of about+2.6 and −1.3 represent the charge distribution much better than+4and −2 [134, 158], but so far all attempts to embed a small TiO6−
5 cluster, representingthe local adsorption site of the TiO2(110) surface of rutile, in a reasonable field of pointcharges or distributed multipole moments have been only partly successful [134–136]. For
Oxide surfaces 309
this system probably larger clusters are necessary [159]. In the case of ZnO, ‘experimental’estimates of the ionic charges range between 0.4 and 1.1, cluster calculations between 1.3and 1.8 depending on the method of calculation and the size of the cluster [82, 152], whileMINDO/3 calculations yield about 0.7 [82, 152]. Since a polar surface (e.g. ZnO(0001)) canbe stabilized by charge transfer from bulk ions towards the surface large differences are tobe expected between the ionicities of ions in the bulk and at polar surfaces.
The NiO8−5 cluster embedded in a point charge field is small enough as to allow the
application of sophisticatedab initio methods together with flexible basis sets. This isin particular necessary for transition metal oxides in which many experimentally observedspectroscopic properties (d–d and charge transfer excitations, s–d exchange splitting,UPSandcore level spectra, etc.) depend explicitly on the angular momentum and spin coupling ofthe partly occupied 3d-orbitals. Configuration interaction (CI) calculations that take care ofdifferences in the 3d occupation as well as of O(2p) → Ni(3d) charge transfer and possiblyalso substrate↔ adsorbate charge exchange are necessary for describing these effects andcan indeed be used. On the other hand, the NiO8−
5 cluster (for the NiO(100) surface) andsimilarly the NiO10−
6 cluster (for bulk NiO), both embedded in the appropriate point chargefields, are large enough to contain nearly all physical effects which are important for localprocesses: Ni2+–O−
2 bonding, crystal field effects, electrostatic potential above the NiO(100)surface and so on.
CI calculations on such embedded clusters yield results which are both qualitativelycorrect and quantitatively accurate enough (e.g. errors of about 0.1–0.2 eV in the lowestexcitation energies) to enable a convincing interpretation of theEEL spectra of NiO(100),CoO(100), NiO(111) and Cr2O3(111), which are discussed later in this review. The energeticorder of the low-lying electronic states, crystal field splittings, the removal of degeneracies ifthe symmetry is reduced from Oh in bulk NiO to C4v at the NiO(100) surface, the differencesin the excitation energies of Cr3+ ions at different surface positions, and the shift of theexcitation energies upon adsorption of NO or CO at the surface agree fairly well with thecorresponding experimental findings.
However, it should be noted that there are limitations as to the applicability andreliability of cluster calculations as long as comparatively small embedded clusters are used.As mentioned above, one necessary prerequisite seems to be that the oxide is highly ionicand that one can describe the embedding electrostatic field by a reasonably chosen pointcharge model. But even if this is possible, there are properties that are non-local in natureand cannot be accurately described by using small clusters. One example is a defect thatcarries a charge different from that of the normal ions, e.g. a Cr3+ ion in MgO [160]. Localcharge and geometry relaxation can be accounted for by a small cluster, but the additionalcharge polarizes the whole crystal and since this is a long-range effect it cannot be accountedfor by a small cluster. Similar effects are encountered in the calculation of optical band gaps[161, 162] because of the creation of a large dipole moment upon charge transfer excitations.In their pioneering paper on the optical band gap in NiO [161] Janssen and Nieuwpoorthave decomposed the bulk polarization of the whole crystal due to an additional charge ata regular lattice position in NiO into an intracluster and an extracluster contribution. Thefirst contribution is calculated bySCF and CI for the embedded NiO10−
6 cluster at about2.1 eV, the latter one is estimated by means of a classical continuum model at about 3.5 eV.These polarization energies lower the calculated band gap from 10.0 to about 4.4 eV, theirinclusion is absolutely necessary for obtaining reasonable agreement with experiment. Thesame problem exists for the calculation of core ionization spectra because of the localcharge created upon ionization out of a localized orbital [161, 163] or the adsorption ofcharged species and charge transfer excitations from the surface to the adsorbate, which are
310 H-J Freund et al
important, for instance, in the laser desorption of NO from NiO(100) [164]. The calculationof photoemission spectra is even more complicated, since such polarization or relaxationeffects (which are sometimes called screening effects) are generally different for ionizationfrom different orbitals [165–167].
It is rather surprising that small clusters suffice to treat the adsorption of small moleculeson oxide surfaces. This has been systematically investigated by Pacchioniet al [150] for theadsorption of CO on MgO(100) by varying the cluster size from MgO5 to Mg9O9, Mg13O13
to a three-layer periodic model of the MgO(100) surface with one CO adsorbed on everyfourth Mg2+ ion (supercell treatment). Most of the calculated properties (distance betweenMg2+ and CO, C–O distance, adsorption energy, CO stretching frequency) varied onlyinsignificantly with the size of the cluster and the results for even the smallest (embedded)MgO8−
5 cluster were very close to those of the periodic calculation. This is a justification forall those calculations which are designed for calculating adsorption geometries and energiesfor similar systems and employ clusters of the type of NiO8−
5 or not much larger. In otherstudies it has also been found that the increase of the cluster size or different embeddingschemes have only small effects on the calculated equilibrium geometries or adsorptionenergies. The reason for this surprising observation is that the bonding between CO orsimilar closed-shell molecules and neutral oxide surfaces is predominantly electrostatic anda fairly reasonable description of the electric field above the surface is already obtainedwith a small cluster embedded in the correct Madelung field. The details of the bondingmechanism have been elucidated by Pacchioni and Bagus [168–170] for CO/MgO(100)using theCSOV(constrained space orbital variation) analysis and by Pohlchen and Staemmler[137] for CO/NiO(100). Contrary to the Blyholder model [171], which is the appropriatemodel for explaining the much stronger bond between CO and transition metals, there isno σ -bonding andπ -backbonding for CO adsorbed on metal oxides. The attractive part ofthis bond is the electrostatic interaction between the multipole moments of the approachingmolecule (mainly the quadrupole moment in the case of CO) and the electric field abovethe ionic crystal. This attraction is balanced by the Pauli-repulsion between CO and—predominantly—the O−2 anions. If the approaching molecule possesses unpaired electrons,as for instance in NO [63, 140] or CH3 [151], there can also be a small chemical contributionto the bond. The large difference in the bonding between CO on metals and on oxides iscaused by the fact that the 4s and 4p atomic orbitals (AOs) on the metal, which are neededto construct empty spd-hybrids, which point toward CO and can accept electrons from thedoubly occupied 5σ orbital of CO, are not available in metal oxides because there is nospace for them among the bulky electronic charge distributions of the O−
2 anions with fullyoccupied 2p shells.
Though the bonding mechanism between oxide surfaces and adsorbed molecules iswell understood in principle, it has not been possible so far to obtain quantitativelycorrect values for adsorption energies, neither from cluster nor from supercellab initiocalculations. The calculated binding energies are in all cases substantially lower than thoseobtained experimentally fromTPD (temperature programmed desorption) experiments orIRAS (infrared reflection absorption spectroscopy) measurements. Again, CO/MgO(100) isthe best studied example: Pacchioniet al [150] obtain a binding energy of 0.08 eV in theirbest cluster calculation (largest cluster, best basis) while the most reliable experimental valueis 0.43 eV [172]. Similar problems arise in all systems studied so far, e.g. CO/NiO(100)[137], NO/NiO(100) [140], CO/ZnO(0001) [152]. Density functional and semi-empiricalcalculations do not suffer from this defect due to the ‘overbinding’ problem of the localdensity approximation and the empirical parametrizations in the various semi-empiricalschemes. The origin of this discrepancy is not yet completely understood. The main reason
Oxide surfaces 311
is that the rather small adsorption energies between CO and the oxide surface depend onthe precise balance between attractive and repulsive contributions. To achieve this it isnecessary to describe the multipole moments of the molecule and the spatial extent of theO−
2 anions rather accurately. This is possible on theSCF level, provided that flexible basissets are used. For the inclusion of van der Waals interactions, which contribute of the orderof 0.05–0.10 eV to the adsorption energy, the inclusion of dynamic correlation effect on theMP2 or CI level is necessary. The second source of uncertainty might be the use of too smallclusters, but as outlined above neither larger clusters nor supercell calculations can yet givebetter agreement.
Of course, it is in principle easily possible to enlarge the size of the cluster. For alkali oralkaline earth oxides, for which the ionic cores can be safely represented by pseudopotentialsand one is left with only a small number of valence electronsN , this is possible. For semi-empirical or density functional methods, which scale only withN2 or N3, the use of largerclusters is no problem at all, e.g. in the treatments of MgO [157], CaO [173], or TiO2
[174], where the cluster size can be easily extended to several hundred ions. However,abinitio calculations on transition metal oxides for which all d-electrons have to be treatedexplicitly do run quickly into problems with computer times if the cluster size is increased:The next coordination shell of positive ions around the NiO8−
5 cluster at the NiO(100)surface contains 13 Ni2+ ions; with theN4 scaling of the necessary computer time andspace requirements their inclusion blows up theab initio calculation quite dramatically.An alternative way is to improve the embedding by representing the next coordinationshell or shells by ‘pseudopotentials’ orab initio model potentials [175–179], which arenot fixed from the very beginning like the point charge model, but adjust themselves in aself-consistent manner to the changes in the electronic structure of the small cluster whichis considered explicitly.
Concluding this rather general and short section we can state that there exists a varietyof theoretical methods that are currently applied to the properties of oxide surfaces and thatare capable of yielding useful information for understanding the properties of oxide surfacesand interpreting experimental observations.
5. Electronic structure of oxide surfaces
In order to gain deeper insight into the behaviour of oxide surfaces as far as reconstructionand adsorption are concerned it is important to have a handle on the electronic structure ofoxides. The obvious method of studying electronic structure is photoelectron spectroscopy.During the last few years, for example, the band structure of several oxides has beeninvestigated with a major emphasis on comparison with calculations of the bulk bandstructure [63, 180–182]. Very early contributions in this field came from Allenet al [180],from Thornton and his collaborators [181] as well as from Neumann and his group [182].
In figure 19 we show the result of the work of Kuhlenbecket al on NiO(100) [63]because this allows a direct comparison with results on NiO(100) films. The data on aNiO(100) cleaved single crystal were taken in normal emission along the so-called0 − X
direction. Photon energies were chosen such as to access the first and the second Brillouinzones. Choosing a proper inner potential of 3.5 eV allows us to fold back the data from thesecond into the first Brillouin zone. In the figure we have included the latest band structurecalculation of NiO [145]. A straightforward interpretation of the NiO band structure interms of initial state effects is not possible, because it has been known for a long time thatthe creation of holes in the photoemission process induces final state effects especially inNiO that lead to strong distortions of the simple band structure picture [183]. The effect
312 H-J Freund et al
Figure 19. (a) Experimentally determined band structure of NiO(100) epitaxially grownon Ni(100) [63] in comparison with a calculated band structure [145]. (b) Experimentallydetermined band structure of NiO(100) cleaved in vacuo [63] in comparison with a calculatedband structure [145].
is a strong mixing of oxygen and metal character in the bands. Along the0 − X directionwe observe five bands. At0 they degenerate to three bands. The dispersion of the topmostfour bands is small and of the order of 0.2 eV at most. Only the band at the highestbinding energy exhibits considerable band dispersion. The naive interpretation would beto correlate the topmost bands with Ni ionization because the Ni–Ni interaction in NiO issmall compared with the O–O interaction. The three bands would be correlated with thefive d levels which are split in t2g and eg sublevels at0 due to the cubic symmetry. Along0−X the degeneracy of the t2g is partly lifted so that three bands result. The oxygen levelsare degenerate at0 according to t1u symmetry. Again the threefold degeneracy is liftedand one band is split off. This band shows the largest dispersion of all, compatible withthe strong oxygen–oxygen interactions. The dispersion moves the band to higher bindingenergy towards the Brillouin zone boundary because the phase relation for p-orbitals formingσ -bonds puts the anti-bonding combinations at0 and the bonding combinations atX.
Oxide surfaces 313
Even though there are no obvious contradictions as far as the above interpretation isconcerned, this naive interpretation needs considerable improvement. The main point is: assoon as an electron is emitted from a Ni level, screening of the hole on the Ni may occurthrough charge transfer from neighbouring oxygen ions. The resulting state is then a strongmixture of Ni and oxygen levels, and a detailed assignment may only be made on the basis ofdetailed calculations including the effects of ionization. These calculations have to properlytreat many particle effects because in photoemission rather intense satellite structure maycause dramatic changes in the spectral functionA(ω, k) including redistribution of intensitiesover several states with comparable weight such that the ‘band structure’ may no longer berecognized. The band structureε(k) which is connected with the orbital energiesε may berecovered via [184]:
ε(k) =∫ ∞
0A(ω, k)ω dω. (3)
Such an analysis has not been performed frequently so far, because a detailed assignmenthas to be the basis for this. In the case of an adsorbate system, where satellites areknown to be important, an analysis of the spectral function using the recipe in equation(3) has been performed [185]. For NiO several calculations of the spectral function of thevalence and core electrons have been reported. For the valence electrons, Fujimoriet al[166] performed a semi-empirical calculation which indicated that, as alluded to above, thetopmost bands contain both oxygen and Ni character. Experimentally, the Ni or oxygencharacter of a spectral feature may be checked via its photon energy dependence. Figure 20shows valence band spectra of NiO in the range of 19 eV to 120 eV [63]. While in thisenergy range the oxygen 2p cross section decreases with increasing photon energy, theNi 3d cross section goes through a maximum. It is quite obvious that the levels near theFermi energy show the expected resonant behaviour typical for Ni 3d derived levels. Aquantitative determination of the oxygen against Ni content of the wavefunctions has notyet been performed experimentally.Ab initio calculations are needed to solve this question.Coming back to the measured band structure, one should realize that the involvement ofmany particle effects always leads to hole induced localization effects which then in turnmay let an interpretation in terms of dispersions at least appear questionable.
As the above discussion has indicated, the bulk electronic structure cannot be fullyunderstood if only photoemission is studied. In addition, we have so far not consideredspecifically the electronic structure of the surface. It is well known, however, from theinvestigation of metals, that within gaps of the bulk band structure surface states mayexist which can be detected via photoemission [186]. They show no dispersion ink-space perpendicular to the surface and they may be quenched or shifted by interaction withadsorbates. The reason for the appearance of surface states of course is the change of theelectronic structure at the surface with respect to the bulk. The atoms in the surface feel adifferent potential because their coordination number is reduced and consequently the energylevels change. For oxide surfaces, photoemission has, so far, not been successfully used todetect intrinsic surface states. Neither in valence electron photoelectron spectroscopy nor incore-electron spectroscopy has a clear detection of surface state effects been possible so far.This is somewhat surprising and it may be due to the presence of strong satellites, whichmake a clear differentiation difficult.
We will show in the following that electron energy loss spectroscopy (EELS) can be usedto clearly identify surface states on several transition metal oxide surfaces that show theexpected behaviour against adsorption from the gas phase. The examples are groupedin two parts. In the first part we shall discuss transition metal oxides with rock salt
314 H-J Freund et al
Figure 20. (a) Photoelectron spectra of NiO(100) cleaved in vacuo as a function ofphoton energy taken in normal emission with mainly s-polarized light (Eph = 13.2–29.9 eV).(b) Photoelectron spectra of NiO(100) cleaved in vacuo as a function of photon energy taken innormal emission with mainly s-polarized light (Eph = 89.3–119.5 eV). For comparison a valenceband spectrum taken with Mg Kα radiation is also shown, see the second reference in [111].
structure, namely NiO and related materials. In the second part we shift our attentiontowards corundum type structures, i.e. more complicated systems, such as Cr2O3 where thesurface provides enhanced structural flexibility. For rock salt type materials we divide thesection into non-polar, i.e. stable surfaces and polar, i.e. non-stable surfaces.
5.1. Rock salt type structures
5.1.1. Stable surfacesThe idea is to investigate electronic transitions of the transition metalions which are optically forbidden for the free ions. These transitions are characterized byrelatively small band widths and usually they are energetically located within the optical
Oxide surfaces 315
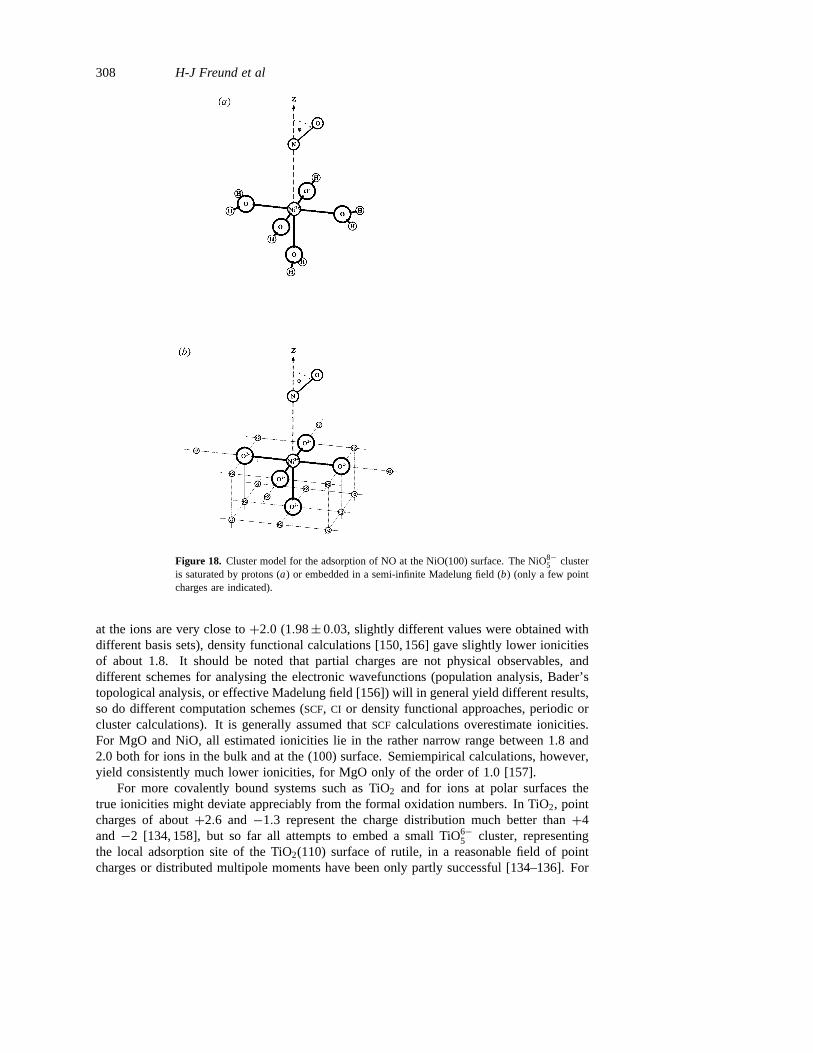
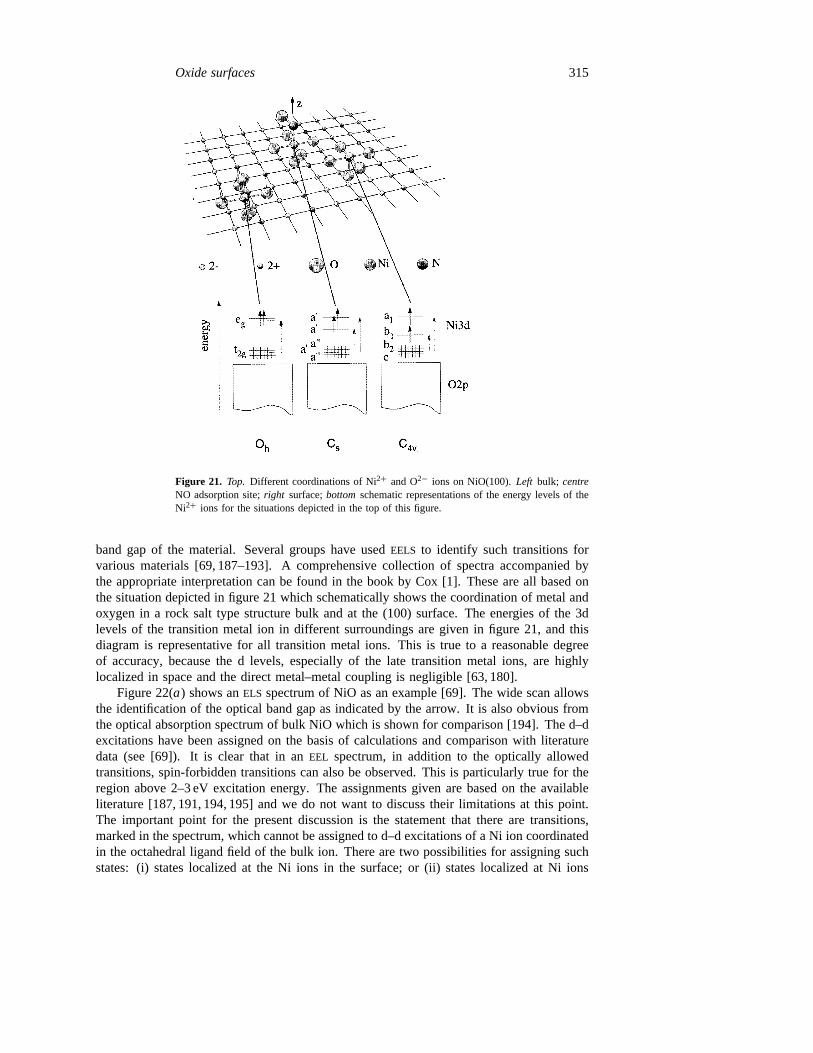
Figure 21. Top. Different coordinations of Ni2+ and O2− ions on NiO(100).Left bulk; centreNO adsorption site;right surface;bottom schematic representations of the energy levels of theNi2+ ions for the situations depicted in the top of this figure.
band gap of the material. Several groups have usedEELS to identify such transitions forvarious materials [69, 187–193]. A comprehensive collection of spectra accompanied bythe appropriate interpretation can be found in the book by Cox [1]. These are all based onthe situation depicted in figure 21 which schematically shows the coordination of metal andoxygen in a rock salt type structure bulk and at the (100) surface. The energies of the 3dlevels of the transition metal ion in different surroundings are given in figure 21, and thisdiagram is representative for all transition metal ions. This is true to a reasonable degreeof accuracy, because the d levels, especially of the late transition metal ions, are highlylocalized in space and the direct metal–metal coupling is negligible [63, 180].
Figure 22(a) shows anELS spectrum of NiO as an example [69]. The wide scan allowsthe identification of the optical band gap as indicated by the arrow. It is also obvious fromthe optical absorption spectrum of bulk NiO which is shown for comparison [194]. The d–dexcitations have been assigned on the basis of calculations and comparison with literaturedata (see [69]). It is clear that in anEEL spectrum, in addition to the optically allowedtransitions, spin-forbidden transitions can also be observed. This is particularly true for theregion above 2–3 eV excitation energy. The assignments given are based on the availableliterature [187, 191, 194, 195] and we do not want to discuss their limitations at this point.The important point for the present discussion is the statement that there are transitions,marked in the spectrum, which cannot be assigned to d–d excitations of a Ni ion coordinatedin the octahedral ligand field of the bulk ion. There are two possibilities for assigning suchstates: (i) states localized at the Ni ions in the surface; or (ii) states localized at Ni ions
316 H-J Freund et al
Figure 22. (a) Wide scanELS spectrum of a NiO(100) single crystal cleaved in vacuo incomparison with an optical absorption spectrum [194]. (b) ELS spectra of NiO(100)/Ni(100) andNiO(100) cleaved in vacuo. In both cases spectra of surfaces with and without adsorbates areshown.
next to an oxygen vacancy in the bulk.Ab initio calculations described in detail elsewhere
Oxide surfaces 317
[69, 137] indicate that both situations would lead to d–d excitation spectra compatible withthe above experimental findings. Simple reasoning can explain the basic physics. Considerthe five-fold coordination of a Ni ion in the NiO(100) surface as shown in figure 21. Incomparison with the bulk, the missing ligand in the (100) direction strongly reduces theligand field and stabilizes the d-levels with lobes pointing in this direction. This has twomain consequences. One is the general reduction in symmetry, which leads to a liftingof degeneracies. The other is the pronounced stabilization of one of the orbitals from theinitially degenerate eg subset. Schematically, in the level diagram of figure 21 these effectscan be identified. A very similar, i.e. almost identical situation, could arise if we considereda Ni ion in a direct neighbourhood of an oxygen vacancy in the bulk. Therefore, theEEL
spectrum that we expect in both cases will be rather similar. Note, of course, that theelectronic excitations within the degenerate 3d levels cannot be calculated and assignedwithin the framework of single particle excitations, but rather detailedCI calculations takinginto account electron correlation as well as spin coupling effects, have to be performed[69, 137, 167].
Let us now consider the lowest excited state of a fivefold coordinated Ni ion. Thecomparison between theory and experiment reveals that the peak at 0.6 eV excitation energyin figure 22(a) may be a good candidate for this excitation. Several appropriate ways todifferentiate between an excitation at a bulk vacancy or an excitation of a surface state maybe taken. Energy and angle dependencies of the intensities in theEEL spectra could berecorded to study the surface sensitivity of the excitations [191]. However, the easiest wayis to use the sensitivity of the surface potential with respect to the presence of adsorbates.We will discuss the interesting aspects of adsorbates in detail further below in this review.Here, we only need to be sure that the adsorbate resides at the Ni ions so that its presenceinfluences the surface potential at this site. That this is by no means trivial is shown by thecase of dissociative H2O adsorption taking place only at surface defects of NiO(100) [70].NO, however, does absorb in the desired way [63, 70]. Figure 22 shows theEEL spectra ofa NiO(100) single crystal surface cleaved in vacuo and compares it with the spectra of aNiO(100) film grown on Ni(100). This film has the pronounced advantage that it is easy tocool to liquid nitrogen temperature so that NO can be adsorbed andEEL spectra can be takenwithout charging problems at low temperature. The film contains defects which we haveblocked through dissociative H2O adsorption before NO was admitted. While H2O itselfdoes not affect the 0.6 eV excitation it is now clear that NO shifts the surface excitationtowards higher excitation energies as is indicated in figure 22. Note that dissociative H2Oadsorption gives rise to the vibrational progression on top of the surface excitation (seebelow).
The effect of NO documented in figure 22(b) can be understood by going back tofigure 21. Its middle part shows the situation for a Ni ion on the surface with an additionalNO molecule from the gas phase coordinated to it. The d level diagram indicates theconsequences for the excitation energies in this case. The presence of the NO, which isprobably coordinated via the nitrogen atom in a tilted orientation (see below), increasesthe ligand field at the Ni ion position almost to the same value as a sixth oxygen ion.Concomitantly, the lowest surface excitation is shifted close to the bulk excitation. Alsoother surface excitations are affected by the presence of NO, but a detailed analysis isdifficult in those cases due to the limited resolution of the experiment. Summarizing theadsorption experiments at this point, it may be concluded that those excitations of a NiO(100)sample, which are not assignable to bulk excitations originate from excitations of Ni ionson the surface of the samples, thus proving them to be surface states.
There are several important implications of these findings. One is the possibility
318 H-J Freund et al
of experimentally determining the metal ion site on the surface. In other words, if thecoordination site of the ion changes on the surface, theEEL spectrum will also change. Wewill show further applications below. Another implication is connected with the possibilityof determining the site of adsorption of molecules. Due to the localized nature of the d–dexcitations only in the case where the adsorbate is directly coordinated to the excited metalion, can a shift of the surface state be expected. In turn, if a shift is observed, the adsorbatemolecule must reside on the excited site. Therefore, spectroscopy of the ligand field effectsat oxide surfaces may be used as a structural tool for the determination of the adsorbatesite. At the same time this method does not suffer the drawbacks of infrared spectroscopyby having to rely on a site dependent frequency shift. This latter correlation has beenrecently proven wrong in many cases of adsorbates on metal surfaces through comparisonwith x-ray photoelectron diffraction data [196]. Before we apply ligand field spectroscopyto structurally more complex systems, we discuss what happens when we change the metalion, e.g. from Ni to Co, but keep the structural environment the same.
Figure 23. Correlation diagram for the excitation energies of Co2+ in different environmentsas calculated withab initio methods [197]. PC denotes the situation where all surrounding ionsof CoO are substituted by point charges.
Figure 23 shows the corresponding energy level diagram for Co2+ in different bulk sitesof CoO [197]. In many respects the situation for CoO is very similar to NiO. The spatialparts of the one-electron orbitals are identical for CoO(100) and NiO(100). Therefore, weshould find very similar differences betweenEEL spectra for the bulk and the surface states.However, the electronic occupation of the orbitals is somewhat different. Co2+ is a d7
system, Ni2+ is a d8 system. While the ground state of a d8 system in Oh symmetry is aspatially nondegenerate3A2g state, the ground state of a d7 system in Oh symmetry is aspatially degenerate4T1g state. The important point for the following discussion and theinterpretation of the experimental observations is to recognize that this spatial degeneracy
Oxide surfaces 319
Figure 24. ELS spectra of CoO(100)/Co(1120) and CoO(100) cleaved in vacuo for the clean andthe CO covered surfaces.
of the ground state is lifted upon lowering the Oh symmetry of the bulk coordination. Thisis the case for a Co2+ ion within the ligand field of C4v symmetry in the CoO(100) surface.The splitting resulting from this effect is very small [197]. The E state lies only 55 meVabove the now non-degenerate A ground state. The other excited states on a CoO(100)surface occur at excitation energies similar to those in NiO(100), for example, the secondexcited state at 0.45 eV as compared to 0.6 eV in NiO(100). The reason for this similarityis that the manifold of states in the d7 and d8 configuration are identical, but their energeticorder is inverted [191]. Figure 24 shows the experimentalEEL spectra in the energy range0–1.2 eV for a CoO(100) film. The broad bump at 0.45 eV in figure 24(a) which is due tothe surface excitation can be clearly identified. The bulk peak at≈ 0.9 eV is also shown andmay be assigned on the basis of literature data [188, 191, 198]. Again, the peak at 0.45 eV isshifted upon adsorption of molecules (e.g. CO in this case) which proves its surface nature,similar to the case of NiO.
However, the interesting energy range in the case of CoO(100) is the range below
320 H-J Freund et al
200 meV. At 55 meV we expect the surface state resulting from the split off from the groundstate. In figure 24(b) the typical set of Fuchs–Kliewer excitations due to substrate phononscan be identified for the CoO(100) cleaved single crystal. Their intensity follows a Poissondistribution as has been demonstrated for many systems. Goodman and his group showedfor the case of MgO(100) films grown on top of a Ru(0001) single crystal surface thatby choosing higher excitation energies than typically used for recording vibrational spectra(i.e. 5 eV) the higher-order Fuchs–Kliewer excitations may be attenuated considerably, suchas to allow easier identification of adsorbate induced vibrational excitations [199]. Due tothe very high intensity of the primary phonon excitation this reduction of intensity is notof great help in the present case. If we investigate the range of the phonon excitations, wenotice a very tiny asymmetry at the foot of the line. Comparison with corresponding datafrom NiO(100) shows clearly that this feature is not present for NiO(100). For the gainpeak we observe a similar feature. As will be discussed in the following, this feature isconnected with an electronic transition. The very small relative intensity of this transitionis of course due to the large probing depth of the Fuchs–Kliewer phonons giving rise tointense phonon losses. If we limit the thickness of the CoO(100) film, we do have thechance to attenuate the phonon intensity, and thus increase the relative intensity of thesurface excitation because its contribution stays constant. Indeed, if we look at theEEL
spectra of a CoO(100) film (figure 24(b)), we see a considerable increase in the relativeintensity of the feature at around 50 meV. This is true for the loss as well as for the gainregion. In the loss region we can now also see the additional feature for the second phononloss. The separation from the second phonon loss is the same as from the first phononloss, indicating that this is not a double loss of the primary features. However, the featuremay be easily explained as a combination mode between a double Fuchs–Kliewer excitationand the electronic surface excitation. Its surface nature can again be seen by studying thesensitivity towards adsorption. It is very obvious from figure 24(b) that the peak is basicallyquenched upon adsorption. We note that the intensity attenuation is completely reversible.
At this point a general comment on the question ‘How do we know that this feature isnot due to a vibrational phenomenon but rather to an electronic phenomenon?’ seems to beappropriate. The best way to prove this would be to grow an oxide film with a differentoxygen isotope. Then the vibrational features shift while the electronic feature remainsenergetically constant. This has not been done so far but there are several arguments thatsupport the interpretation as an electronic excitation. First of all, the comparison with NiOis clear evidence that it is a CoO specific phenomenon because the vibrational propertiesof the two systems are very similar. Secondly, it is not an adsorbate induced phenomenon.When films are grown, it is very hard to avoid hydroxyl formation on the surface. Sincethis is true for both NiO and CoO, we would expect the occurrence of such peaks also forNiO, if the peaks were associated with hydroxyl adsorption. However, this has not beenobserved. Thirdly, the intensity of the feature split off from the second-order Fuchs–Kliewerphonon does not follow a Poisson distribution, which it should if it were a pure phononeffect. However, its intensity can be very well described by assuming it to be a combinationmode. The observation, which is still not well understood, is the line width of the peak aswell as its relative intensity. Generally, the peak widths of electronic excitations are large(≈ 100 meV) with respect to vibrational excitations(∼ 5 meV, resolution determined). Inaddition, the maximum intensities of electronic excitations for forbidden d–d excitation aresmaller by a factor of 50 than Fuchs–Kliewer excitations. It seems that in the presentcase neither line width nor intensity follows the general trend. Note, however, that in thepresent case the excitation energy is very low so that the lifetime of the excited state may beunusually high. Also, we cannot exclude the fact that we have to deal with electron–phonon
Oxide surfaces 321
coupling phenomena, which enhance the intensity of the electronic state due to intensityborrowing [200]. Together with isotopic labelling experiments these questions have to beaddressed in the future.
With these comments we conclude the discussion of surface states on stable surfaces ofrock salt materials and move on to structurally more complex polar surfaces.
5.1.2. Polar surfaces Stabilization of a polar surface is possible, as discussed above, byreduction of the surface charge which may occur via various routes. For example, if thetop layer of an oxygen terminated NiO(111) surface consists of OH− instead of O−2 , thiswould reduce the surface charge per atom from−2 to −1, thus stabilizing the surface[70, 201]. Alternatively, geometric reconstruction of the surface layer can lead to surfacestabilization [11, 12, 70]. The most stable reconstruction of a polar surface of an ionic crystalis, according to Lacmann [11] and to Wolf [12], the so called octopolar reconstruction asmentioned above and shown in figure 9. The octopolar reconstruction leads as discussedabove to a p(2× 2) unit cell on the surface and is characterized by the removal of three outof four oxygen ions in the first layer (in the case of an oxygen terminated surface) and oneout of four nickel ions within the second layer. The third layer again contains a completehexagonally close packed oxygen layer. A p(2×2) reconstruction has been observed for ironoxide [61, 62, 84, 202] and nickel oxide [70], but only in the latter case are there indicationsthat an octopolar reconstruction has actually taken place. In the following we shall beconcerned with the electronic structure of various polar surfaces.
NiO(111)/Ni(111) and NiO(111)/Au(111)Figure 2 shows theLEED pattern of a NiO(111)film grown epitaxially on a Ni(111) single crystal surface. The oxide spots are stillconsiderably broader than the metal reflexes because of the imperfections induced by thelarge lattice mismatch between metal and metal oxide (18%) [64] but the substrate spotsare no longer observed.
The EEL spectra in figure 25(a) indicate the adsorption of considerable amounts ofhydroxyl groups on the NiO(111) surface by the observation of strong losses at 460 meV.The OH groups may be partially exchanged through exposure of the surface to D2O whichleads to an isotope shift as seen in figure 25(a). These losses are located on top of abackground of electronic excitations within the NiO band gap as has been discussed abovefor the NiO(100) surface. In figure 24(a) the EEL spectrum of the NiO(100) surface isalso shown. The comparison shows similar, but not identical, features of the electronicexcitations for both surfaces. The reasons for this are twofold. Firstly, if the hexagonal(111) surface is OH terminated the Ni ions are all in octahedral environments, thus onlycontributing to the bulk signals present at both (100) and (111) surfaces. Secondly, if the(111) surface is not OH terminated, but rather reconstructed, a small part of the Ni ions arein a threefold ligand field thus leading to a corresponding surface spectrum different from(100) (fourfold symmetry). All other Ni ions in the reconstructed layer are in environmentstypical for a NiO(100) surface. From a weighted superposition of the spectra we do notexpect enormous differences between the surface excitations on NiO(100) and NiO(111).In figure 25(b), fits to the ELS spectra are shown which basically corroborate the aboveassignments. The fits are based upon a mixture of experimental [69, 201] and theoretical[82, 201] information. Freitag and Staemmler [82] have calculated excitation energies forNi2+ ions in various crystal fields and we have used this as input for our fits.
It was shown earlier that the adsorbed hydroxyl groups lead to a pronounced shoulderin the O 1sXP spectra at approximately 1.5 eV higher binding energy [201] as compared
322 H-J Freund et al
Figure 25. (a) ELS spectra of NiO(100)/Ni(100) and NiO(111)/Ni(111) with and withoutadsorbed hydroxyl groups. (b) Fits of some of the spectra shown in figure 24(a). Resultof ab initio calculations by Freitag and Staemmler [82] for Ni2+ ions in NiO have been used asstarting inputs for the calculations.
with the lattice oxygen feature.As monitored viaEELS andXPS, the hydroxyl groups can be removed to a large extent
by a simple heat treatment. Figure 25(a) also shows theEEL spectra after removal of themajority of the hydroxyl groups. Due to the larger number of Ni ions in (100) coordinationin the reconstructed surface, the spectrum is more similar to the one of the (100) surface.In conjunction with this change in composition, changes in theLEED patterns are observed.Figure 26(a) shows a two-dimensionalSPA-LEED pattern of the oxide film taken at anelectron energy of 80 eV. This pattern corresponds to the p(1 × 1) NiO pattern in figure 2.The distortion of the symmetry of the pattern is due to the experimental arrangement inthe SPA-LEED setup. If the sample is heated to slightly above 600 K we see changes in theintensity distribution of theLEED pattern. Figures 26(b) and (c) show SPA-LEED patternstaken at two different electron energies because there is considerable variation of spotintensity with electron energy. At 65 eV electron energy the fractional-order p(2× 2) spotsin the second Brillouin zone are intense, while the fractional-order(2 × 2) spots in thefirst Brillouin zone and the integral-order spots have very low intensity. At 78 eV electronenergy, on the other hand, intense integral-order and first-order p(2 × 2) spots are found.Even though theSPA-LEED patterns are distorted, it is clear that the p(2 × 2) NiO spotsare not located near the positions of the sharper p(2 × 2) O/Ni(111) spots reported in [70].
Therefore, the p(2× 2) reconstruction is clearly connected with the NiO lattice. A detailedstructure determination, however, has not been undertaken yet. One reason is the sensitivityof the substrate towards the impinging electron beam in commercial standardLEED systems.Channel-plateLEED systems [204] have to be set-up which operate with electron currentsin the nano ampere regime, with which one shall be able to tackle this problem in the nearfuture. It is very likely that the present p(2 × 2) reconstruction is of the octopolar typepredicted earlier and schematically shown in figure 9.
The patterns are rather diffuse but various attempts to find optimal preparation conditionsto form a well ordered structure failed. The p(2 × 2) fractional spot intensity is sensitiveto the background pressure, while the integral-order structure is rather insensitive. In fact,after several hours the fractional p(2×2) spots are strongly attenuated. The same result canbe obtained if we expose the p(2×2) structure to 0.3 L (Langmuir= 10−6 Torr s) H2O. Theprocess is completely reversible and may be cycled. Therefore, it is experimental fact thatthe NiO(111) surface reconstructs after the OH covered surface has been heated to 600 K.This reconstruction does not lead to a well ordered surface as indicated by the large spotwidths. Nevertheless, the process is perfectly reproducible in every preparation cycle. Thereconstruction can be lifted upon exposure to water, and this process is also reversible.
It is quite probable that the sensitivity of surface structure to the presence of water on
324 H-J Freund et al
the surface has general consequences for the reactivity of the oxide surfaces. It has beendemonstrated [201] that the number of adsorbed NO molecules—as monitored via thermaldesorption—increases by about a factor of three after desorption of the hydroxyl groups.In addition, high-temperature desorption of NO (above 400 K) is observed indicating thereaction of adsorbed NO, tentatively to NO2 for example. In this sense, water steers thereactivity of the oxide surface and in particular the polar surface patches as a function ofsurface temperature where the temperature for OH desorption sets the threshold to activatethe sample. Whether this observation is relevant to catalytic processes, is not clear atpresent but there are indications that the catalytic activity of NiO catalysts prepared throughtopotactic dehydration of Ni(OH)2, i.e. by forming crystallites with (111) orientation [205],is strongly influenced by water in the gas phase and on the sample. If the NiO(111) surfaceis prepared on a substrate with smaller lattice mismatch, e.g. a Au(111) surface, theLEED
patterns observed are considerably sharper [80, 81]. The p(2 × 2) structure, as discussedabove, is found and the surface is stable with respect to water adsorption. This may be dueto the finite thickness of the film (approximately four layers) so that electrostatic argumentsare less important.
CoO(111)/Co(0001) The LEED patterns of the clean Co(0001) surface exhibit sharp spotsin contrast to the oxidized surface, which shows the more diffuseLEED spots typical for aCoO(111) surface formed via oxidation [71, 206–208]. The situation is thus very similar tothe one encountered for NiO(111).HREEL spectra in the vibrational regime again indicatethe presence of hydroxyl groups as the only observable adsorbed chemical species [71, 208].As in the case of the NiO(111) surface it is possible to exchange the hydroxyl groups partlyvia D2O exposure at higher temperature. The conclusion from theEELS investigation isvery similar to the one drawn for NiO(111): CoO(111) is covered with hydroxyl groupswhich stabilize the unstable clean (111) rock salt type surface. The next obvious step isto try and remove the hydroxyl groups by a heat treatment as in the case of the NiO(111)surface. However, so far it has not been possible to desorb the hydroxyl groups withoutpartly destroying the oxide film. This is the main reason for not having been able to observethe p(2 × 2) reconstruction of the CoO(111) surface.
FeO(111)/Fe(110) The iron oxide system has been studied in detail in the past[61, 62, 71, 84, 202, 209–217]. Out of the many results we would like to mention theobservation that a FeO(111) film, prepared epitaxially on a Pt(111) surface, exhibits areconstruction to form a p(2 × 2) LEED pattern [61, 62, 71, 84, 202]. This is connected, asmentioned above, with the formation of Fe3O4 on the surface [203, 71]. The driving forcefor this surface reconstruction may be found in the phase diagram of the Fe–O system [218].The thermodynamically stable phase under the given oxygen pressure and the limited Fesupply is the Fe3O4 phase. However, if the films, as discussed above, are not grown ontop of a Pt(111) surface but rather on a Fe surface, e.g. on a Fe(110) surface, the situationis different. In this case the high iron concentration in the system [212, 219] will shift theequilibrium towards the FeO system according to
Fe3O4 + Fe→ 4 FeO.
TheLEED pattern of an oxidized Fe(110) crystal clearly shows a p(2×2) structure suggestingthe formation of a Fe3O4 overlayer as in the case of the iron oxide film on the Pt(111)surface. TheEEL spectrum indicates very little OH on the surface, only of the magnitudeseen for the reconstructed NiO(111) surface [201]. However, while H2O would remove thereconstruction in the NiO case, in the case of iron oxide we may actually grow a thick H2O
Oxide surfaces 325
film on the surface and remove it again without the formation of additional hydroxyl onthe surface. This is revealed byXPS measurements [71, 209]. An answer to the questionwhether the surface is a Fe3O4 or a FeO overlayer may be found if we investigate theFe 2p photoemission spectra. There are clear differences to be expected on the basis of theliterature data. The Fe 2p spectra of Fe2+, which is the only oxidation state in FeO, exhibitstrong satellite features, while the mixed valence compound Fe3O4 does not exhibit intensesatellites. Also, a slight shift of the main ionization line is observed [71]. On the basis ofthis fingerprint FeO and Fe3O4 may be differentiated. It is clear that the film grown on theFe(110) surface contains Fe2+ as in FeO while the system grown on the Pt(111) surface is,indeed, a Fe3O4 layer.
5.2. Corundum type structures
As discussed above, the structural rearrangement in NiO(111) involves three layers of theoxide. The mass transport involved leads to a relatively disordered surface indicatedby diffuse LEED superstructure spots. There are other polar oxide surfaces, however,where the creation of the most stable surface does not involve more than the top layer[6, 88, 90, 220, 221].
The (0001) surface of Cr2O3, crystallizing within the corundum type has been recentlystudied in our laboratories in some detail [89–93]. If a Cr2O3(0001) film is prepared ontop of a Cr(110) substrate,LEED and x-ray diffraction have shown that high-quality oxidestructures can be prepared [90, 222–224].LEED diffraction data of a surface held at 100 Kexhibit the typical hexagonal pattern as discussed in the section on structures. As thetemperature is changed, the surface exhibits changes in theLEED pattern [92]. This isdifferent from the rock-salt type (100) surfaces as discussed before, and we shall comeback to this temperature dependence after we have investigated the surface states at lowesttemperature.
Figure 27 showsEEL spectra taken from the clean, flashed oxide surface at differenttemperatures [92]. At 90 K the spectrum exhibits two signals at loss energies of∼ 1.2 eVand∼ 1.4 eV, denoted by A and B, respectively. They are accompanied by a broad featureC at about 1.8 eV. As the temperature rises, signals A and B loose intensity whereas theintensity of feature C increases. All three signals A, B and C lie in the regime of d–dtransitions of chromium ions [88, 225] and we shall present a detailed assignment furtherbelow.
The EEL spectrum in the considered energy region changes dramatically when variousadsorbates are present, i.e. peaks A and B vanish and peak C is attenuated [68, 89, 90, 92].Thus we assign signals A through C to d–d transitions of surface chromium ions whichare sensitive to the presence of adsorbates. Feature C may also contain some contributionfrom d–d excitations of bulk chromium ions in a distorted octahedral crystal field. Thisassignment is supported by optical spectra of bulk chromium oxide samples [226] as wellas of ruby crystals [227] and is also in line with the observation that in the range of featureC some intensity remains after adsorbate formation. After the surface states have beenidentified the temperature dependence of theEELS data may be analysed by assuming that aBoltzmann ansatz is appropriate to describe the processes (which could be debated). Thenit is possible to plot the logarithm of the quotient of intensities of feature A and feature Cagainst 1/T . From the slope an energy difference of 8 meV between the state of the surfacecharacterized by feature A and the state of the surface characterized by feature C has beendeduced [228]. This energy is of the order of magnetically dominated interactions.
On the basis of such observations, a model has been proposed which explains the
326 H-J Freund et al
Figure 27. ELS spectra of Cr2O3(111) as a function of temperature.
structural changes on the clean chromium oxide surface. We consider the low temperature(90 K) phase to be the ideal Cr2O3(0001) surface with half a layer of Cr3+ ions present atthe surface as shown in figure 14. This leads to the(1×1) LEED pattern in figure 12. Uponraising the temperature above 100 K, a(
√3×√
3)R30◦ structure appears, indicating a largerunit cell (figure 12(b)). The low transition temperature of 150 K already provides evidencethat the process is connected with a relatively low activation energy. As a rule of thumb onewould estimate activation energies in the range of 0.3 eV, which would be consistent withsurface diffusion processes. The kind of structure resulting from such diffusion processes isindicated in figure 28. There are several reasons why such a structural rearrangement maytake place, which are connected with the question about the most stable surface site.
We start with the situation at lowest temperature where the Cr3+ ions are all at equivalentsites. These sites could be those also occupied in the bulk (site 1, figure 14). There aretwo more threefold sites (sites 2 and 3, figure 14) which are available for occupation. Oneof course, is the other site occupied in the bulk (site 2). It is characteristic for this sitethat there is never a Cr3+ ion in the second layer below the top oxygen layer. The secondalternative is the site characterized by an open oxygen triangle (site 3). There are Cr3+ ionsin the second layer below this site. The question is, which is the most stable site populatedat lowest temperature.EELS data in comparison with the theoretical calculations indicatethat the outer Cr3+ sites (site 1) are occupied at lowest temperature. Each surface Cr3+ ionhas a direct counterpart in the next layer down. If a magnetic coupling in the first layerssimilar to the bulk situation is assumed, then there is antiferromagnetic coupling to thesecond Cr layer of the order of 12 meV [229], but within the topmost layer the Cr ions areferromagnetically or very weakly antiferromagnetically coupled. The magnetic couplingthat is important in this case, is between the topmost Cr3+ layer and the one below thequasi-hexagonally packed O−
2 layer. Locally, this means that two Cr3+ ions are exchange
Oxide surfaces 327
Figure 28. Four different terminations of the chromium oxide surface. (a) By a close oxygenlayer. (b) By a full chromium layer. (c) By half a chromium layer with the(1 × 1) and(√
3 × √3)R30◦ unit cells shown. (d) As (c), but with half of the chromium ion hopped to a
different site (site 3 in figure 14), which gives rise to the indicated(√
3 × √3)R30◦ unit cell.
coupled via three oxygen ions forming a Cr3+–O–Cr3+ angle of approximately 85◦. Thissituation is similar to a binuclear Cr3+ complex where the transition metal ions are bridgedby three hydroxyl groups. In this latter case the exchange splitting has been measured to be8 meV [230]. This energy has to be surmounted to magnetically decouple the ions. If thetemperature is raised, half or less of the Cr3+ ions at the surface may be decoupled from thesecond layer and may change site. Consequently, a larger unit cell with a(
√3 × √
3)R30◦
unit mesh is observed. A schematic representation is shown in figure 28(d). As is revealedby the schematic drawing, the Cr3+ ions reside only at sites that have a second Cr3+ ionunderneath in the second layer, i.e. site 1 or 3. There are basically two reasons for this.Primarily, the thermal dependence of theEEL spectra is consistent with this occupation.The intensity of the surface peaks A and B goes down indicating that the occupation ofsite 1 is reduced. Since site 2 is not stable with respect to the motion of the Cr3+ throughthe oxygen plane into the second layer, the Cr3+ ions can only move to the stable site 3.Secondly, there is an antiferromagnetic coupling among the Cr3+ ions in each Cr layer,which is about half as large as through the Cr–O3-Cr bridge [230]. Therefore, each ionis antiferromagnetically coupled within the top layer and also with respect to the secondCr3+ ion layer down. Such effects may represent the driving force for the process to occur.The energy differences between differently magnetically coupled states are of the order of6 meV [163] compatible with our temperature dependentEEL spectra. At room temperaturethe two different stable Cr3+ sites at the surface are statistically occupied, giving rise to aunit mesh typical for a lattice gas. This again leads to a p(1×1) structure with very diffuse
328 H-J Freund et al
intensity in the range of the(√
3 × √3)R30◦ positions.
Figure 29. Experimental andCASSCF results for the lowest electronic states of the chromiumion of bulk Cr2O3 and at the Cr2O3(111) surface. The spectra have been taken from figure 26.(a) Free Cr3+ ion; (b) bulk, CASSCF; (c) bulk, experimental results [226]; (d) surface site 3(cf figure 14); (e) surface site 2; (f ) surface site 1, relaxed geometry; (g) EELS.
This sequence of phase transitions would explain the observed changes of the diffractionpatterns as well as the changes of theEEL spectra. The key aspect is the exchangebetween the two inequivalent Cr3+ sites on the Cr2O3(111) surface. We have shown thatthe inequivalent ligand fields for the two sites lead to different d–d excitation energies.Therefore the d–d transitions in theEEL spectra may be used to follow the site exchangeprocess. Figure 29 shows that the d–d spectrum at 90 K is compatible with the spectrumcalculated for the Cr3+ ion site 1. Upon heating the surface site 3 becomes populated. Thisis experimentally documented by a redistribution of intensity in the sense that the peak at1.4 eV is washed out at the expense of the feature at 1.75 eV, which appears to becomebroader. In agreement with this observation, the calculated excitation energies of the twolowest excited states,4E and 4A1, of a Cr3+ ion at site 3, are shifted out of the doublepeak A and B to lower energies while the next two4A2 and4E states at higher energies areshifted into the region of peak C. This leads to an increase of width of feature C. It is thusclear, that the changes observed in theEEL spectra are fully compatible with the proposedchanges in theLEED patterns. Also, the observed order–order transition behaviour towardslow temperature, and the order–disorder transition behaviour towards higher temperature isfully in line with observation.
Oxide surfaces 329
Figure 30. (a) Thermal desorption spectra of CO/NiO(100)/Ni(100) as a function of COcoverage. The inset shows the derivatives of the spectra. (b) CarbonK-edgeNEXAFS spectraof CO/NiO(100)/Ni(100) as a function of the light incidence angle as indicated in the inset.(c) Angle-resolved photoelectron spectra of CO/NiO(100) in comparison with spectra of theclean surfaces for different experimental geometries.
6. Adsorbates on oxides
In the previous paragraphs we have made use of the change of certain properties induced bythe interaction of molecules with oxide surfaces. However, we have not answered questionsas to how these molecules bind towards the surface. For metal surfaces the most studiedadsorbate is carbon monoxide. In order to make contact with the studies on metal surfaces,it is useful to consider the interaction of CO and NO with the non-polar (100) surfaces ofsimple rock-salt type materials. Notably, the discussion [7] on the electronic and geometricstructure of adsorbates on such surfaces has profited considerably from an intense exchangebetween theoreticians [137–140, 231–235] and experimentalists [63, 64, 236–251] not onlyincluding single crystal surfaces but also on well characterized powder samples [252–254].As discussed above, from the theoretical studies a clear picture for the bonding of, forexample, carbon monoxide towards NiO(100) or MgO(100) has emerged, even thoughthere still seem to be unresolved problems with respect to the theoretical reproduction ofthe experimentally observed enthalpy of adsorption [137–140, 231–237]. Contrary to metalsurfaces, where bonding is strong(1Ea ≈ 1–2 eV) due toσ/π -charge exchange betweenthe molecule and the surface [171, 252], bonding to a (100) oxide surface of rock-salttype is dominated by multipolar electrostatic forces, which leads to rather weak bonding(1Ea ≈ 0.1–0.5 eV). As a consequence of the rather weak bonding, energy differencesbetween various orientations of molecules, i.e. bonding of CO with its C-end against its
330 H-J Freund et al
O-end towards the surface or parallel to the surface, are rather small and of the order of0.05–0.1 eV [138, 150, 235]. Since these energy values are well within the error range ofthe theoretical predictions, experimental studies are needed. Figure 30(a) shows theTPS
spectra of CO/NiO(100) as a function of coverage. The spectra indicate indeed rather weakbonding between the CO molecule and the NiO surface, contrary to typical CO adsorbateson metal surfaces. The chemical bonding between CO and the oxide surfaces is dominatedby long-range electrostatic effects and short-range Pauli repulsion. There are several reasonsresponsible for this bonding mechanism as has been discussed by Pohlchen and Staemmler[137] and summarized in the theoretical part of this review.
Since there is no argument favouring a particular orientation, the orientation has tobe determined experimentally and separately for each oxide system. Figure 30(b) showsan example of how such an experimental study would be carried out. X-ray adsorptionspectra taken near the C–K edge using polarized light from a storage ring allow us touse symmetry selection rules and determine the orientation of the CO axis from an angledependent experiment [73, 253]. The question whether the molecule is oriented C-end orO-end towards the surface, can be answered via photoelectron spectroscopy. The idea is todetermine the shift of the valence ionizations of CO with respect to the gas or condensedCO phase. From figure 30(c) we conclude that the 5σ ionization, located mainly on thecarbon atom of the molecule, is shifted with respect to the 1π and 4σ ionizations, indicatingthat the interaction with the surface takes place through the carbon end of the CO molecule.It is surprising that this shift is so large (∼ 2.0 eV) though the adsorption energy1Ea itselfis quite small (0.3–0.5 eV [73] and first reference in [241]). Again, it is the electrostaticinteraction between the oxide surface and CO that stabilizes the 5σ orbital [73, 254]. Thiseffect is nearly as strong as for CO chemisorbed on metals, but the origin of the shift isdifferent, because for CO on metals the 5σ orbital is stabilized byσ -donation, i.e. by amoderately strong chemical bond [171].
Figure 31. One-electron scheme of the Ni 3d and NO 2π levels for NO adsorbed on NiO(100)in a linear and a bent configuration.
Oxide surfaces 331
Figure 32. Calculated energies of a NO–NiO5 cluster for some electronic states as a functionof the tilting angle of the NO molecule. Energies are referenced relative to the ground state ofNO adsorbed in a linear configuration.
The adsorption properties of CO/NiO(100) may be compared with those ofNO/NiO(100). The latter system is slightly more strongly bound, i.e. by 12.2 kcal mol−1
as determined from similarTD data [63]. The higher adsorption energy for NO reflects thedifferent bonding characteristics with respect to CO. This has been predicted by severaltheoretical calculations and for this comparison in detail by Staemmler and his group[137, 138]. While CO is held almost exclusively by multipolar electrostatic interactions,NO bonding to NiO(100) does exhibit some covalent chemical bonding contributions.Abinitio cluster calculations on a NiO8−
5 cluster embedded in a semi-infinite array of pointcharges and interacting with a single NO molecule being bound via the N atom to the Nisite, see figure 18(b), may be used to illustrate the reasons [63, 127, 164]. In figure 31 theresults are presented in a simplifying one-electron picture. For a perpendicularly orientedNO molecule the relevant part of theMO scheme is shown in the left part: the Ni 3dlevels are split into a set of three closely spaced fully occupied orbitals, the remnant ofthe t2g orbitals in octahedral NiO6, and an only slightly split subset of two singly occupiedNi 3d orbitals remnant of the eg orbitals in octahedral NiO6. Above the Ni levels thesingly occupied NO 2π orbital is situated. The three unpaired electrons may be coupledto form quartet and doublet states. The ground state turns out to be the quartet state.NO 2π and Ni orbitals transform according to different irreducible representations of theC4V point group as indicated in figure 31. Consequently, the bonding interaction is veryweak if there is any at all. However, if the NO molecular axis is tilted the symmetry isreduced, and the irreducible representations change. Now, one component of the NO 2π
332 H-J Freund et al
transforms according to the same irreducible representation as the Ni 3d levels and there willbe mixing, i.e. formation of bonding and antibonding orbitals. This leads to a stabilizationof the lowest Ni 3d level. If this level is doubly occupied the system gains energy andis stabilized. Thus, in this simple one-electron scheme a bent configuration is the stablearrangement. Detailed calculations show that the true wavefunction is a superposition ofelectronic configurations of which the one in figure 31 is only one component. Figure 32shows the results of a configuration interaction calculation on the above system where thebinding energies for some low lying electronic states are plotted as a function of the anglebetween the molecular axis and the surface normal. While for a vertical geometry the4Estate is the ground state of the system, the2A′ component of the excited2E state in avertical geometry is stabilized in a tilted geometry as predicted on the basis of the simpleone-electron picture. At about 45◦ tilting the energy has a minimum. Near-edge x-rayabsorption fine structure (NEXAFS) measurements using a tunable synchrotron light sourcemay be used for molecular structure determination. OurNEXAFS studies for NO/NiO(100)[63] indicate indeed a strong inclination of the molecular axis of about 40◦ with respectto the surface normal, thus corroborating the theoretical predictions very convincingly. Wethink that this predicted and observed bending of the NO–Ni bond axis represents strongevidence for a chemical bonding component in this system with a clear preference for theN end oriented towards the Ni ion.
The covalent component of the bonding is also reflected in the vibrational properties ofCO compared to NO. In figure 33 the NO and CO stretching vibration frequencies on thevarious surfaces investigated are compared. Firstly, it can be seen that all NO frequenciesare shifted towards smaller values compared to the gas phase, whereas all CO frequencieslie at or close to the gas phase value. As mentioned above, this reflects the bonding. CO isweakly, electrostatically bound and the frequency of the CO stretching vibration is close togas phase value. Interestingly, this is truely independent of surface orientation and whetherthe surface is hydroxyl covered or reconstructed. NO exhibits a covalent contribution leadingto a change in 2π population, which in turn changes the stretching vibration frequencies.On the clean oxide surfaces, whether regularly structured or reconstructed we do find similarstretching frequencies. However, for NO, the coadsorbed hydroxyl species lead to noticeabledifferences. For the case of CoO(111) we were able to find indications for the existence ofinteractions between adsorbed species (eg. NO and CO) which may be the reason for theobserved systematics [237].
In all cases discussed so far we have strong indications that the molecular axis isoriented perpendicularly to the surface plane or only moderately tilted. However, thereare also cases where we have experimental evidence for a strongly inclined bondinggeometry. CO/Cr2O3(0001) is such a case. Figure 34 shows photoelectron spectra ofthe (
√3 × √
3)R30◦ CO structure, recorded for various collection geometries as indicatedin the figure, in comparison with a normal emission spectrum of a physisorbed monolayerCO on Ag(111) [255]. There are two CO induced features visible in the spectra of the COadsorbate on Cr2O3(0001); one at 17.5 eV and a slightly asymmetric one at 20.2 eV. TheCO σ valence emission should be intense at the photon energy the spectra have been takenwith, i.e. 36 eV, whereas the 1π emission should be rather weak. Thus we identify the twoCO induced features as theσ -ion states of molecularly adsorbed CO.
The electronic binding energies of CO on Cr2O3(0001) are larger by several eVcompared to those of the CO physisorbate on Ag(111). This holds also for CO adsorbates onother metals (see for instance [185, 255, 256]), indicating that the substrate–CO interactionon Cr2O3(0001) is appreciably different from that on metals and on the (100) surfaces ofcubic oxides.
Oxide surfaces 333
Figure 33. Energies of the NO (a) and CO (b) stretching vibrations on different CoO and NiOsurfaces in comparison with gas phase data [75].
From the data in figure 34 information on the orientation of the molecular axis can bededuced. This figure displays a set of photoelectron spectra taken with a constant angle,i.e. 90◦, between the directions of light incidence and electron detection.
From figure 34 it is obvious that theσ -ion states exhibit the highest intensities fornear normal light incidence and near grazing electron emissionα = 0, ϑ = 90◦ whereasat grazing light incidence these features are strongly attenuated, in strong contrast to COadsorbed standing up on most metal surfaces. Since at a photon energy of 36 eV theσ
states emit with highest intensity if the polarization direction and the direction of electrondetection both coincide with the CO molecular axis, this behaviour is only compatible withan orientation of the molecular axis approximately parallel to the surface.
In the inset of figure 34 we compare the emission intensities of the COσ valence statesas a function of photon energy for two different experimental geometries. The data shownin the upper panel were taken at a light incidence angle of 20◦ with respect to the surfacenormal, collecting the electrons 70◦ off normal whereas the data in the lower panel weretaken at normal electron emission and near grazing light incidence(α = 80◦). Obviouslya strongσ shape resonance is observed only for grazing electron detection, again clearlyindicating that the CO molecules must be strongly tilted.
334 H-J Freund et al
Figure 34. Series of angle resolved ultraviolet photoemission spectrafor CO adsorbed on Cr2O3(111)/Cr(110). The angle between the lightincidence direction and the electron detection direction has been keptat a fixed value, i.e. 90◦ (α is the angle of light incidence with respectto the surface normal). For comparison a spectrum of CO on Ag(111)is shown at the bottom. Binding energies are given relative to thevacuum level.Inset.The emission intensities of the CO valence bandsas a function of the photon energy for grazing incidence and nearperpendicular electron detection (bottom) and near perpendicular lightincidence, detecting the electrons at a grazing angle (top).
The same conclusion about the molecular geometry must be drawn from the analysisof our NEXAFS data [90]. These data show that the intensity of theπ resonance varies onlyslightly as a function of the light incidence angle as expected for CO molecules lying flaton the surface since one 2π component is oriented parallel to the surface whereas the otherone sticks out of the surface. A quantitative estimation of the tilting angle was not possiblefrom our NEXAFS data since theσ resonance was so weak that its intensity could only beevaluated with very large error bars. Tentatively we estimate this angle to be larger thanabout 70◦.
An open question is: where are the 1π orbitals? For flat lying CO molecules the1π levels are expected to split into two components, 1πxy and 1πz, the first one orientedparallel to the surface and the other oriented perpendicular to the surface. Whereas the 1πxy
emission might be hidden below theσ emissions because this level should be intense atgrazing emission angles like theσ orbitals, the 1πz should be intense at normal emissionwhere theσ emission is weak. As can be seen from figure 34 the 5σ emission is nearlytotally suppressed at near normal electron emission so that the 1πz level is most likely notsituated near to the 5σ level as is the case for the 1π levels of CO adsorbed on most metals.One might suppose that the 1πz level is located somewhere in the region of the substratebands but since the 1πz orbital would interact strongly with the these bands it is most likelyto have been shifted to higher binding energy because the substrate levels are energeticallylocated above the 1π levels. Considering this it seems to be rather unlikely that the 1π
levels are located somewhere in the region of the oxide emission.Whereas the 5σ emission is nearly totally suppressed at near normal emission, a broad
feature remains in the region of the 4σ between 19 and 22 eV (figure 34). Since the 4σ andthe 5σ emission intensity should behave similarly, it is tempting to attribute the remainingemission between 19 eV and 22 eV to the 1πz level. Another possible assignment would
Oxide surfaces 335
be that this feature is due to aσ shake up state. However, we consider this to be unlikelybecause such shake up states should be intense at emission angles where theσ main lines arealso intense, which is not the case. All binding energies are larger than the correspondingvalues known from metal surfaces [90]. They are even larger than the gas phase values. Thisholds also for the C 1s ionization which is found 0.7 eV below its gas phase value [90]. Themost interesting finding, however, is the energetic position of the 1πz level, which is in thepresent case most probably situated near to the 4σ level, indicating a fundamentally differentinteraction of the molecule with the surface as compared with all cases observed so far. Wepropose that the CO lone pairs (4σ and 5σ ) are bound towards two different Cr ions in thesense of two electrostatic interactions which shift theσ binding energies to higher values.If this is true then it is very reasonable to assume that the 1π levels interact predominantlywith the oxygen layer underneath the terminating Cr layer. This latter interaction betweenthe closed shell O−2 ions and CO must be basically repulsive. Since the oxygen levelsare situated at lower binding energies than the CO 1π levels, the 1πz, which is the onethat strongly interacts with the O−2 ions, is shifted towards higher binding energy and theinteracting O−
2 levels are rearranged as well. The shift of the 1πz level is recognized in thedata, while it is more difficult to identify the effect on the oxygen levels. If we comparethe observed shifts of CO on Cr2O3(0001) with those of gaseous CO we find a shift of allCO levels to higher binding energies. The shift of the 5σ level is larger than the one ofthe 4π level. This is very reasonable because it follows the individual polarizabilities ofthe levels involved. The interaction may be separated into the two bonding Cr–CO(5σ ) andCr–OC(4σ ) interactions, and into a repulsive O−
2 –CO(1π ) interaction, leading to a weaklychemisorptive CO–Cr2O3 bond. The bonding of CO towards Cr2O3(0001) is completelydifferent from the bonding of CO to a metallic Cr surface. It is a pure accident that CObinds to metallic Cr in a flat bonding geometry as well.
While on the transition metal oxide surfaces, CO molecules exhibit desorptiontemperatures above 100 K indicating an interaction with the substrate more substantial thanphysisorption, which would be dominated by van der Waals interactions, the interactionof CO with an Al2O3 surface turns out to be considerably weaker, of the order of 0.14–0.17 eV [96, 97].
In figure 35 we show theEEL spectrum(Ep = 18 eV) of a CO multilayer on theAl 2O3(111)/NiAl(110) substrate [96, 97]. In the lowest trace we see on the left the elasticpeak, and, due to the relatively low resolution, only a slight indication of the Al2O3 phonons(see [39] for a well resolved phonon spectrum) followed by the CO vibrational stretch loss inits electronic ground state. At 6 eV (note the change in energy scale) losses due to excitedstates start. The assignment of the spectrum is rather straightforward for the adsorbatebecause it compares favourably with the gas phase spectrum, shown for comparison [257].A detailed assignment of the progressions is shown in the inset. In the following weshall consider in more detail the optically forbidden (but allowed in electron scattering)progression of the a35 state. The population of the a35 state involves primarily theexcitation of a 5σ electron into the 2π orbital.
Figure 36 shows a set ofEEL spectra of this excitation as a function of coverage.Clearly, as has been discussed in detail elsewhere [96], there is a pronounced intensity ofthis excitation visible in the monolayer regime. The line width at 0.2 L exposure is ratherlarge, but the remaining structure allows us to fit (least square) a single Franck–Condondistribution to the peaks. TheTPD spectra at this dose suggest the presence of a singlespecies. Increase to 0.3 L leads to the appearance of a peak at 58 K desorption temperaturein the TPD spectra. This new state should have its own characteristic Franck-Condondistribution. The fit therefore shows two distributions: one due to the one determined
336 H-J Freund et al
Figure 35. Electron energy loss spectra atT = 35 K of a CO multilayer on Al2O3/NiAl(110) incomparison with a gas phase spectrum [97]. An enlarged view of the vibrational progressionsis shown in the top inset. Note, that the vibrational loss part is plotted on an expanded energyscale.
Figure 36. Electron energy loss spectra atT = 35 K of CO/Al2O3/NiAl(110) in the range ofthe Co a3 5 excitation as a function of coverage. RelevantTD spectra are shown in the inset.
from the 0.2 L exposure, which was then fixed and a second one which was optimized tofit the total progression at 0.3 L exposure. This second progression is clearly shifted with
Oxide surfaces 337
respect to the first one by 170 meV as indicated by the line. At 1 L exposure the multilayerprogression starts to contribute. It is only shifted by 25 meV with respect to the secondprogression. In total, the multilayer signal is shifted with respect to the most strongly boundexcitation by 195 meV.
This leads to the following immediate conclusions. The electronic ground state of COmolecules most strongly bound to the surface is stabilized through interaction with thesubstrate by 0.19 eV, i.e. with respect to the multilayer by 0.11 eV. Since the excitationenergy for the monolayer species is larger by 0.195 eV compared with the multilayer, theexcited state must be destabilized by 0.085 eV. One reason for this destabilization may bethe expected stronger repulsion between molecule and substrate because population of the2π orbital increases the average size of CO and leads to a more pronounced Pauli repulsionbetween CO and the top oxygen layer of the substrate which behaves electronically likea layer of rare gas atoms(Ne ↔ O−
2 ). Since the CO molecule is physisorbed on Al2O3
we have assumed in this case that the potential curve of the adsorption CO in the a35
state is very similar to the gas phase. We can provide evidence for this by performing aBirge–Sponer analysis for the multilayer progression. From this analysis we can determinethe dissociation energy and the anharmonicity in comparison to the gas phase. The welldepths are the same within the experimental error while the anharmonicity seems to beslightly increased with respect to the gas phase [258].
Table 4. Experimentally determined molecular parameters of three different CO species onAl 2O3/NiAl(110).
Tdes = 67 K −170 260 6.19 210 2.5Tdes = 55 K −140 190 6.04 200 3.5multilayer −88 70 6.02 200 9.5gas phase [257] 6.02 202 some ms1 ml CO/Ag(110) ≈ −150 large ? ? small
Next, we consider the line widths of the observed spectra. Table 4 collects the importantinformation. We have discussed this in detail in [96] and will not repeat the rather involveddiscussion. We want to comment that the observed lifetimes are rather large compared tothe time electronic excitations need to occur. The reason may be that the energy of the a35
state is not sufficient to excite electron hole pairs in the substrate considering the large gapsize of 9.5 eV. The situation is very different on a metal surface. In figure 37 we comparethe set of spectra on the Al2O3 substrate with a set of spectra of CO on Ag(110) [259].While in the multilayer on the metal surface we observe spectra comparable with those onthe oxide surface, it is clear that in the monolayer regime below 1.2 L exposure there is noexcitation discernible from the background in the case of the metal substrate. The reasonappears to be rather obvious: there is no band gap in a metal, energy dissipation throughelectron hole pair creation is not hindered and the line widths are very large.
In addition to CO adsorbates, O2 adsorbates on Al2O3 at low temperatures have alsobeen studied [97]. The interaction with the surface in this case is again very weak and theEELS data reveal that the spin coupling within the O2 molecule prevails as it is adsorbed onthe surface.
In addition to the investigation of molecular adsorbates, it is also interesting to study
338 H-J Freund et al
Figure 37. Comparison ofEELS spectra(a35) of CO on Al2O3/NiAl(110) with spectra of COon Ag(110) atT = 35 K as a function of exposure.
the adsorption of metals onto oxide surfaces. Several systems have been studied.Detailed structural investigations on a variety of systems have been performed by Møller
and his group [260–266]. Cu/TiO2(110) [260], Ni/TiO2(110) [261], including CO adsorption[262] Cu/Al2O3(0001) [263], Cu/Zn(1010) [5], Cu/Zn(1010) [265], and Cu/α-Fe2O3(0001)[266], were studied just to name a few of the recent results published. Also other groups havemade important contributions to field: Campbell and his group for the system Cu/ZnO(0001)[267, 268], Gorte and collaborators for Rh [269], Pd [270], and Pt [271] on Al2O3(0001).Madey and workers have dealt with different metals (Cu, Fe, Cr, Hf, Pt [272–275] onTiO2/110). Henryet al [276–278] report studies for Pd on MgO. Various groups [279–284]have published data for Pd and Cu on Al2O3(0001).
We have investigated Na deposition on Cr2O3(0001) and on NiO(111) and itsconsequences on the electronic structure of adsorbate and substrate. On the basis of bulkthermodynamic data one would expect that Na reduces both surfaces to the metallic state[285, 286]. While this is true for Na on NiO(111) [285], it does not occur under any ofthe tested circumstances when we tried to reduce Cr2O3(111) with metallic Na towardsthe metallic state [68, 91]. For Mg on the other hand, the free reaction energy towardsreduction is large enough to induce the formation of metallic Cr on the Cr2O3 surface[286]. A detailed study of Na adsorption shows, however, that even though reduction ofthe metal is prohibited, the surface Cr ions are reduced in the oxidation state [286]. Thisis interesting because alkali as well as alkali earths are used as electronic promoters incatalytic reactions involving oxides.
Figure 37 shows the result of anEELS experiment [286], where a spectrum of cleanCr2O3(0001) is shown as the bottom trace. The assignment of the various peaks havebeen discussed previously [88–92]. If a thick (several) layer of Na is deposited onto theCr2O3(0001) surface at 90 K, the substrate excitations disappear and two new bands areobserved. As will be discussed in detail elsewhere [286], the band at 4.0 eV is due to
Oxide surfaces 339
Figure 38. EELS spectra of clean and Na covered Cr2O3(111)/Cr(110) as a function of thesodium coverage.
the Na surface plasmon [287] and the peak at 0.8 eV is assigned to an Na/oxide interfaceexcitation [286]. Upon raising the surface temperature, some Na evaporates and the layerthickness is reduced, but it is still considerably larger than a monolayer. As is expectedfor thin metal films in contact with a dielectric on one side and vacuum on the other,the two interface excitations are coupled and they change energy as the thickness varies[288]. The Na surface plasmon changes energy considerably from 4.0 eV to 2.9 eV whilethe interface (Cr2O3(0001)/Na) only varies slightly from 0.8 eV to 0.7 eV. If the temperatureis raised above 420 K the Na multilayer has completely been desorbed and we reach themonolayer regime. The spectrum taken at 470 K is characteristic for this situation. Substrateexcitations between 6 and 14 eV are visible. However, in the d–d-excitation regime below3.5 eV we find new sharp features.Ab initio calculations by Staemmler [92] have shownthat a Cr2+ ion at a threefold site on a Cr2O3(0001) surface has d–d excitations at exactlythese energies. This allows us to propose that in the range of Na monolayer coverage theCr2O3(0001) surface is covered with a Cr2+ layer. With decreasing Na coverage parallelto increasing surface temperature, the Cr2+ d–d excitations reappear, and finally close to1000 K the surface is Na free and the spectrum of the clean surface is revealed.
The results are summarized in figure 38, where the surface species are correlated withthe temperature range where they exist. Above 600 KEELS does not directly indicate thepresence of Na. Therefore results based onXPS measurements must be included in thediscussion [285]. Due to the larger probing depth of the latter methods, the presence of asecond non-metallic Na species is indicated. One of the two species appears to be localizedat the surface, while the second one resides in the near surface region or in the bulk.
340 H-J Freund et al
Figure 39. Existence range of different Na species on Cr2O3(111) as determined with differentspectroscopies.
Similarly, AES shows the presence of two species, but both seem to be present in the bulk.It is therefore possible that three different non-metallic Na species exist in the system.Whether these species are connected with the formation of sodium chromate is not clear atpresent.
So far structural information on such systems is rather rare but this will be an activefield in the future. It is important, however, to correlate the geometric information withinvestigations on the electronic structure. In this area a combination of electron spectroscopywith scanning tunnelling microscopy will lead to major new insights.
7. Synopsis and perspectives
We have reviewed the geometric and electronic properties of oxide surfaces and haveconcentrated mainly on the oxide films. Clean surface properties as well as adsorbatecovered surfaces have been studied. The adsorbates covered molecular adsorbates andmetal films. It will be important in the future to combine these studies and investigatemolecular adsorption onto ultrathin metallic films. Some early steps in this direction havebeen taken, but much more has to come. With such studies we may be able to close thematerials gap as indicated in figure 1 to a certain extent, and if we then could also workat higher pressures, we might be in a position to really contribute to an understanding ofcatalysis.
Oxide surfaces 341
Acknowledgments
We are grateful to a large number of coworkers who have contributed over the yearsand who are mentioned in the references. We have profited from grants of thefollowing agencies: Deutsche Forschungsgemeinschaft, Bundesministerium fur Bildungund Forschung, Ministerium fur Wissenschaft und Forschung des Landes NRW, EuropeanCommunities (BRITE-EURAM, COST), the German–Israeli Foundation, as well as theFonds der Chemischen Industrie.
References
[1] Cox P A 1992Transition Metal Oxides. An Introduction to their Electronic Structure and Properties(Oxford:Clarendon)
[2] Johnson D A 1982Some Thermodynamic Aspects of Inorganic Chemistry(Cambridge: Cambridge UniversityPress)
[3] Sorensen O T (ed) 1981Non-stoichiometric Oxides(New York: Academic)[4] Hamnett A and Goodenough J B 1984 Binary transition metal oxidesPhysics of Non-tetrahedrally Bonded
Compoundsed O Madelung, Landolt-Bornstein, New Series III, vol 17 (Berlin: Springer)[5] Owen J F, Teegarden K J and Shanks H R 1978Phys. Rev.B 18 3827[6] Henrich V E and Cox P A 1994The Surface Science of Metal Oxides(Cambridge: Cambridge University
Press)[7] Freund H-J and Umbach E (ed) 1993Adsorption on Ordered Surfaces of Ionic Solids and Thin Films
(Springer Series in Surface Sciences, vol 33)(Heidelberg: Springer)[8] Freund H-J 1995Ber. Bunsenges. Phys. Chem.submitted[9] Kung H H 1989Transition Metal Oxides: Surface Chemistry and Catalysis(Amsterdam: Elsevier)
[10] Davidov A A 1990 Infrared Spectroscopy of Adsorbed Species on the Surface of Transition Metal Oxides(New York: Wiley Interscience)
[11] Lacmann R 1965Colloq. Int. CNRS152 195[12] Wolf D 1992 Phys. Rev. Lett.68 3315[13] Tasker J W 1979J. Phys. C: Solid State Phys.12 4977
Tasker J W 1979Phil. Mag. A 39 119[14] Legg K O, Prutton M and Kinniburgh C 1974J. Phys. C: Solid State Phys.7 4236[15] Kinniburgh C G 1975J. Phys. C: Solid State Phys.8 2382[16] Prutton M, Walker J A, Welton-Cook M R, Felton R C and Ramsey J A 1979Surf. Sci.89 95[17] Welton-Cook M R and Berndt W 1982J. Phys. C: Solid State Phys.15 5691[18] Urano T, Kanaji T and Kaburagi M 1983Surf. Sci.134 109[19] Blanchard D L, Lessor D L, LaFemina J P, Baer D R, Ford W K and Guo T 1991J. Vac. Sci. Technol.A
9 1814[20] Prutton M, Ramsey J A, Walker J A and Welton-Cook M R 1979J. Phys. C: Solid State Phys.12 5271[21] Netzer F P and Prutton M 1975J. Phys. C: Solid State Phys.8 2401[22] Kinniburgh C G and Walker J A 1977Surf. Sci.63 274[23] Welton-Cook and Prutton M 1980J. Phys. C: Solid State Phys.13 3993[24] Felton R C, Prutton M, Tear S P and Welton-Cook M R 1979Surf. Sci.88 474[25] Lad R J and Henrich V E 1988Phys. Rev.B 38 10860[26] Bas E B, Baninger U and Mulethaler H 1974Japan. J. Appl. Phys., Suppl.2 (part 2) (Proc. 2nd Int. Conf.
on Solid Surfacespp 671–3)[27] Felton R C, Prutton M and Matthew J A D 1979Surf. Sci.79 117[28] Henrich V E and Kurtz R L 1981Phys. Rev.B 23 6280[29] Chung Y W, Lo W J and Somorjai G A 1977 Surf. Sci.64 588[30] Onishi H, Aruga T, Egawa C and Iwasawa Y 1988Surf. Sci.193 33[31] Cox D F, Fryberger T B and Semancik S 1988Phys. Rev.B 38 2072[32] Kurtz R L and Henrich V E 1982Phys. Rev.B 25 3563[33] McKay J M and Henrich V E 1984Surf. Sci.137 463[34] Kurtz R L and Henrich V E 1987Phys. Rev.B 36 3413[35] Poelman H, Vennik J and Dalmai G 1987J. Electron Spectros.44 251
Fiermans L, Clauws P, Lambrecht W, Vandenbroucke L and Vennik J 1980Phys. Stat. Sol.A 59 485
342 H-J Freund et al
[36] van Hove H and Leysen R 1972Phys. Stat. Sol.A 9 361[37] Wandelt K 1982Surf. Sci. Rep.2 1[38] Winkelmann F, Wohlrab S, Libuda J, Baumer M, Cappus D, Menges M, Al-Shamery K, Kuhlenbeck H and
Freund H-J 1994Surf. Sci.307–91148[39] Jaeger R M, Kuhlenbeck H, Freund H-J, Wuttig M, Hoffmann W, Franchy R and Ibach H 1991Surf. Sci.
259 235[40] Murray P W, Leibsle F M, Fischer H J, Flipse C F J,Muryn C A and Thornton G 1992Phys. Rev.B 46
12877[41] Fan F R F andBard A J 1990J. Phys. Chem.94 3761[42] Rohrer G S, Henrich V E and Bonnell D A 1990 Science250 1239[43] Rohrer G S and Bonnell D A 1990 Chemistry of Electronic Ceramic Materials (NIST Special Publication,
804) (Washington, DC: NIST) p 447[44] Rohrer G S, Henrich V E and Bonnell D A 1991 Mater. Res. Soc. Symp. Proc.209 611[45] Beitel G, Markert K, Wiechers J, Hrbek J and Behm R J 1993Adsorption on Ordered Surfaces of Ionic Solids
and Thin Films (Springer Series in Surface Sciences, vol 33)ed H-J Freund and E Umbach (Heidelberg:Springer)
[46] Hochella M F Jr, Eggleston C M, Elings V B, Parks G A, Brown G E Jr, Wu C M and Kjoller K 1989Am. Mineralogist74 1233
[47] Hochella M F Jr1990Rev. Minerol.23 87[48] Johnsson P A, Eggleston C M and Hochella M F Jr1991Am. Mineralogist76 1442[49] Eggleston C M and Hochella M F Jr1992Am. Mineralogist77 911[50] Antonik M D, Edwards L C and Lad R J 1992Proc. Mater. Res. Soc.237 459[51] Lad R J and Antonik M D 1991 Ceramic Trans.24 359[52] Bonnell D A and Clarke D R 1988J. Am. Ceramic Soc.71 629[53] Rohrer G S and Bonnell D A 1991 Surf. Sci.247 L195[54] Itaya K and Tomita E 1989Surf. Sci.219 L515[55] Wiesendanger R, Shets I V, Burgler D, Tarrach G, Guntherodt H-J, Coey J M D and Graser S 1992Science
255 583[56] Tarrach G, Burgler D, Schaub T, Wiesendanger R and Guntherodt H-J 1993Surf. Sci.285 1[57] Nelissen B 1993PhD ThesisCatholic University of Nijmwegen[58] Condon N G, Murray P W, Leibsle F M, Thornton G, Lemic A R and Vanghan D J 1994Surf. Sci.310
L609[59] Thornton G, private communication[60] Lad R J and Henrich V E 1988Surf. Sci.193 81[61] Weiss W, Barbieri A, van Hove M A and Somorjai G A 1993 Phys. Rev. Lett.71 1848[62] Barbieri A, Weiss W, van Hove M A and Somorjai G A 1994 Surf. Sci.302 259[63] Kuhlenbeck H, Odorfer G, Jaeger R, Illing G, Menges M, Mull Th, Freund H-J, Pohlchen M, Staemmler
V, Witzel S, Scharfschwerdt C, Wennemann K, Liedtke T and Neumann M 1991Phys. Rev.B 43 1969[64] Baumer M, Cappus D, Kuhlenbeck H, Freund H-J, Wilhelmi G, Brodde A and Neddermeyer H 1991Surf.
Sci. 253 116[65] Baumer M, Cappus D, Illing G, Kuhlenbeck H and Freund H-J 1992J. Vac. Sci. Technol.A 10 2407[66] Kuhlenbeck H and Freund H-J 1993 Adsorption and reaction of small molecules on oxide surfacesSpringer
Proceedings in Physics73 227[67] Uhlenbrock St, Scharfschwerdt Chr, Neumann M, Illing G and Freund H-J 1992J. Phys: Condens. Matter
4 7973[68] Freund H-J, Dillmann B, Ehrlich D, Haßel M, Jaeger R M, Kuhlenbeck H, Ventrice C A, Winkelmann F,
Wohlrab S, Xu C, Bertrams Th, Brodde A and Neddermeyer H 1993J. Mol. Catal.82 143[69] Freitag A, Staemmler V, Cappus D, Ventrice C A, Al-Shamery K, Kuhlenbeck H and Freund H-J 1993
Chem. Phys. Lett.210 10[70] Rohr F, Wirth K, Libuda J, Cappus D, Baumer M and Freund H-J 1994Surf. Sci. Lett.315 2977[71] Cappus D, Haßel M, Neuhaus E, Rohr F and Freund H-J 1995Surf. Sci.337 268[72] Klinkmann J, Cappus D and Freund H-J 1995J. Electr. Spectr. Rel. Phen.72 37[73] Cappus D, Klinkmann J, Kuhlenbeck H and Freund H-J 1995Surf. Sci. Lett.325 L421[74] Freund H-JPhys. Stat. Sol.in press[75] Schonnenbeck M, Cappus D, Klinkmann J, Freund H-J, Pettersson L G M andBagus P SSurf. Sci.submitted[76] Dalmai-Imelik G, Bertolini J C and Rousseau J 1977Surf. Sci.63 67[77] Conrad H, Ertl G, Kupper J and Latta E E 1975Sol. Stat. Commun.17 497[78] Wyckoff R W G 1965Crystal Structures2nd edn (New York: Wiley Interscience)
Oxide surfaces 343
[79] Bertrams Th, Marre K and Neddermeyer H 1995Proc. 3rd Surface Science Symp.ed P Varga (Austria:Kitzsteinhorn)
[80] Ventrice C A Jr, Hannemann H, Brodde A and Neddermeyer H 1994Phys. Rev.B 49 5773[81] Hannemann H, Ventrice C A, Bertrams Th, Brodde A and Neddermeyer H 1994Phys. Stat. Sol.A 146 289[82] Freitag A and Staemmler V, to be published
Freitag A 1995PhD ThesisUniversity of Bochum[83] Fadley C S, private communication[84] Weiß W, Boffa A B, Dunphy J C, Galloway H C, Salmeron M B and Somorjai G A 1993 Adsorption on
Ordered Surfaces of Ionic Solids and Thin Films(Springer Series in Surface Sciences33) ed H-J Freundand E Umbach (Heidelberg: Springer)
[85] Ulnau A 1958Am. J. Sci.256 171[86] Zabel H 1994Appl. Phys.A 58 109
Feidenhans‘l R 1989Surf. Sci. Rep.10 105[87] Stierle A, Bodeker P and Zabel H 1995Surf. Sci.327 9[88] Xu C, Haßel M, Kuhlenbeck H and Freund H-J 1991Surf. Sci.258 23[89] Xu C, Dillmann B, Kuhlenbeck H and Freund H-J 1991Phys. Rev. Lett.67 3551[90] Kuhlenbeck H, Xu C, Dillmann B, Haßel M, Adam B, Ehrlich D, Wohlrab S, Freund H-J, Ditzinger U A,
Neddermeyer H, Neuber M, Neumann M and Bunsenges Ber 1992Phys. Chem.96 15[91] Ventrice C A, Ehrlich D, Garfunkel E L, Dillmann B, Heskett D and Freund H-J 1992Phys. Rev.B 46
12892[92] Bender M, Ehrlich D, Yakovkin I N, Rohr F, Baumer M, Kuhlenbeck H, Freund H-J and Staemmler V
1995J. Phys: Condens. Matter7 5289[93] Haßel M, Hemmerich I, Kuhlenbeck H and Freund H-JSurface Sci. Spectrasubmitted[94] Rohr F, Baumer M and Freund H-J, to be published[95] Wuttig M, Hoffmann W, Jaeger R, Kuhlenbeck H and Freund H-J 1991Mat. Res. Soc. Symp. Proc.221
143[96] Jaeger R M, Kuhlenbeck H and Freund H-J 1993Chem. Phys. Lett.203 41[97] Jaeger R M, Libuda J, Baumer M, Homann K, Kuhlenbeck H and Freund H-J 1993J. Electron Spectrosc.
Relat. Phenom.64–5217[98] Libuda J, Baumer M and Freund H-J 1994J. Vac. Sci. Technol.A 12 2259[99] Libuda J, Winkelmann F, Baumer M, Freund H-J, Bertrams Th, Neddermeyer H and Muller K 1994Surf.
Sci. 318 61[100] Wohlrab S, Winkelmann F, Kuhlenbeck H and Freund H-J Adsorption on epitaxial oxide films as model
systems for heterogeneous catalysisSpringer Proceedings in Physicsaccepted[101] Bertrams Th, Winkelmann F, Uttich Th, Freund H-J and Neddermeyer H 1995Surf. Sci.331–31515[102] Libuda J, Sandell A, Baumer M and Freund H-J 1995Chem. Phys. Lett.240 429[103] Baumer M, Libuda J, Sandell A, Winkelmann F, Freund H-J, Graf G, Bertrams Th, Neddermeyer H and
Bunsenges BerPhys. Chem.in press[104] Sandell A, Libuda J, Bruhwiler P, Andersson S, Baumer M, Maxwell A, Martensson N and Freund H-JJ.
Vac. Sci. Technol.accepted[105] Sandell A, Libuda J, Bruhwiler P, Andersson S, Baumer M, Maxwell A, Martensson N and Freund H-JJ.
Electr. Spectr. Rel. Phen.accepted[106] Sandell A, Libuda J, Baumer M and Freund H-JSurf. Sci.accepted[107] Chen P J and Goodman D W 1994Surf. Sci. Lett.312 L767[108] Wu Y, Tao H S, Garfunkel E, Madey T E and Shinn N D 1995Surf. Sci.336 123[109] Wu Y, Garfunkel E and T E Madey, in preparation[110] Isern H and Castro G R 1989Surf. Sci.211 865[111] Pfnur H, Schwennicke C and Schimmelpfennig J 1993Adsorption on Ordered Surfaces of Ionic Solids and
Thin Films(Springer Series in Surface Sciences33) ed H-J Freund and E Umbach (Heidelberg: Springer)[112] Moffat J B (ed) 1990Theoretical Aspects of Heterogeneous Catalysis(New York: Van Nostrand Reinhold)[113] van Santen R A 1991Theoretical Heterogeneous Catalysis(Singapore: World Scientific)[114] Desjonqueres M C and Spanjaard D 1993Concepts in Surface Physics(Springer Series in Surface Sciences
30) (Berlin: Springer)[115] Yoshida S, Sakaki S and Kobayashi H 1994Electronic Processes in Catalysis(Weinheim: VCH)[116] Sauer J 1989Chem. Rev.89 199[117] Sauer J, Ugliengo P, Garrone E and Saunders V R 1994Chem. Rev.94 2095[118] Pacchioni G, Bagus P S and Parmigiani F (ed) 1992Cluster Models for Surface and Bulk Phenomena (NATO
ASI Series, Series B: Physics, vol 283)(New York: Plenum)
344 H-J Freund et al
[119] Menzel D and Rosch N (ed) 1993 Special issue: Molecules at surfaces: Electronic structure and dynamicsChem. Phys.177 (2)
[120] Bagus P S and Pacchioni G (ed) 1994 Special issue: Cluster approach to the chemistry and physics ofsurfaces and interfacesJ. Electron Spectrosc. Relat. Phenom.69 (1)
[121] Catlow C R A, Faux I D and Norgett M J 1976J. Phys. C: Solid State Phys.9 419[122] Catlow C R A andMackrodt W C 1982Computer Simulation of Solids(Berlin: Springer)[123] Allan N L and Mackrodt W C 1987Adv. Ceram.23 257[124] Catlow C R A, James R, Mackrodt W C and Stewart R F 1982Phys. Rev.B 25 1006[125] Mackrodt W C, Davey R J, Black S N and Docherty R 1987J. Cryst. Growth80 441[126] Mackrodt W C 1989J. Chem. Soc. Faraday Trans.85 541[127] Gay D H and Rohl A L 1995J. Chem. Soc. Faraday Trans.91 925[128] Alavi A and McDonald I R 1990Molec. Phys.69 703[129] Catlow C R A, Mackrodt W C, Norgett M J and Stoneham A M 1977 Phil. Mag. 35 177[130] Lakhlifi A 1993 Mol. Phys.78 659[131] Picaud S, Hoang P N M, Girardet C, Meredith A and Stone A J 1993Surf. Sci.294 149[132] Chen W and Schaich W L 1989Surf. Sci.218 518[133] Lakhlifi A and Girardet C 1991Surf. Sci.241 400[134] Reinhardt P and Heß B A, private communication[135] Rittner F, Fink R and Staemmler V, to be published[136] Geiger A and Paschek D, private communication[137] Pohlchen M and Staemmler V 1992J. Chem. Phys.97 2583[138] Staemmler V 1993Adsorption on Ordered Surfaces of Ionic Solids and Thin Films(Springer Series in
Surface Sciences33) ed H-J Freund and E Umbach (Heidelberg: Springer)[139] Nygren M A and Pettersson L G M 1994J. Electron Spectrosc. Relat. Phenom.69 43[140] Pettersson L G M 1994Theor. Chim. Acta87 293[141] Pisani C, Dovesi R and Roetti C 1988Hartree–Fock ab initio Treatment of Crystalline Solids(Lecture Notes
in Chemistry48) (Berlin: Springer)[142] Perdew J P and Wang Y 1986Phys. Rev.B 33 8800
Perdew J P 1986Phys. Rev.B 33 8822[143] Becke A D 1986Phys. Rev.A 33 2786[144] Ziegler T 1991Chem. Rev.91 651[145] Manghi F, Calandra C and Ossicini S 1994Phys. Rev. Lett.73 3129[146] Fujimori A, Saitoh T, Mizokawa T and Bocquet A E 1993Jap. J. Appl. Phys. Suppl.32–3217[147] Freyria-Fava C, Dovesi R, Sanders V R, Leslie M and Roetti C 1993J. Phys: Condens. Matter5 4793[148] Pisani C, Cora F, Dovesi R and Orlando R 1994J. Electron Spectrosc. Relat. Phenom.96 1[149] Fahmi A and Minot C 1994Surf. Sci.304 343[150] Pacchioni G, Neyman K M and Rosch N 1994J. Electron Spectrosc. Relat. Phenom.69 13[151] Freitag J and Staemmler V 1994J. Electron Spectrosc. Relat. Phenom.69 99[152] Zhanpeisov N U, Freitag A and Staemmler V, to be published[153] Nygren M A, Pettersson L G M, Freitag A, Staemmler V, Gay D H and Rohl A LJ. Phys. Chem.accepted
for publication[154] Causa M, Dovesi R, Pisani C and Roetti C 1986Phys. Rev.B 33 1308[155] Causa M, Dovesi R, Pisani C and Roetti C 1986Surf. Sci.175 551[156] Rosch N R, Neyman K M and Birkenheuer U 1993Adsorption on Ordered Surfaces of Ionic Solids and Thin
Films (Springer Series in Surface Sciences33) ed H-J Freund and E Umbach (Heidelberg: Springer)[157] Zhanpeisov N U, Pelmenschikov A G and Zhidomirov G M 1990Kinet. Catal.31 563[158] Fahmi A, Minot C, Silvi B and M Causa 1993Phys. Rev.B 47 11717[159] Kobayashi H and Yamaguchi M 1989Surf. Sci.214 466[160] Groh D J, Pandey R and J M Recio 1994Phys. Rev.B 50 14860[161] Janssen G J M andNieuwpoort W C 1988Phys. Rev.B 38 3449[162] Boussard P, Siegbahn P E M and Wahlgren U 1993Adsorption on Ordered Surfaces of Ionic Solids and Thin
Films (Springer Series in Surface Sciences33) ed H-J Freund and E Umbach (Heidelberg: Springer)[163] Bagus P S, Pacchioni G and Parmigiani F 1993Chem. Phys. Lett.207 569[164] Kluner T, Freund H-J, Freitag J and Staemmler V, to be published[165] Fujimori A, Minami F and Sugano S 1984Phys. Rev.B 29 5225[166] Fujimori A and F Minami 1984Phys. Rev.B 30 957[167] Janssen G J M andNieuwpoort W C 1988Int. J. Quantum Chem. Symp.22 679[168] Pacchioni G, Cogliandro G and Bagus P S 1991Surf. Sci.255 344
Oxide surfaces 345
[169] Pacchioni G and Bagus P S 1992Cluster Models for Surface and Bulk Phenomena (NATO ASI Series, SeriesB: Physics, vol 283)ed G Pacchioni, P S Bagus and F Parmigiani (New York: Plenum) p 305
[170] Pacchioni G, Cogliandro G and Bagus P S 1992Int. J. Quantum Chem.42 1115[171] Blyholder G 1964J. Phys. Chem.68 2772[172] He J-W, Estrada C A, Corneille J S, Wu M-C and Goodman D W 1992Surf. Sci.261 164[173] Zhanpeisov N U, Staemmler V and Bearns M 1995J. Mol. Catal. A: Chem.101 51[174] Bredow T and Jug K 1995J. Phys. Chem.99 285[175] Barandiaran Z and Seijo L 1988J. Chem. Phys.89 5739[176] Seijo L and Barandiaran Z 1991J. Chem. Phys.94 8158[177] Nygren M A, Pettersson L G M, Barandiaran Z and Seijo L 1994J. Chem. Phys.100 2010[178] Mejias J A and Sanz J F 1995J. Chem. Phys.102 327[179] Mejias J A, Oviedo J and Sanz J F 1995Chem. Phys.191 133[180] Shen Z-X, Shi C K, Jepsen O, Spicer W E, Lindau I and Allen J W 1990Phys. Rev. Lett.64 2442[181] Brooks N B, Law D S, Warburton D R, Wincott P L and Thornton G 1989J. Phys: Condens. Matter1
4267[182] Hufner S, Steiner P, Sander I, Neumann M and Witzel S 1991Z. Phys.B 83 185
Hufner S and Wertheim G 1973Phys. Rev.B 8 4857[183] Hufner S, Hullinger F, Osterwalder J and Riesterer T 1984Solid State Commun.50 83[184] Lundquist B I 1967 Phys. Kond. Mat.6 193, 203; 19687 117; 19699 2236[185] Freund H-J, Eberhardt W, Heskett D and Plummer E W 1983Phys. Rev. Lett.50 768[186] Kevan S D (ed) 1992Studies in Surface Science and Catalysis (Angle Resolved Photoemission, vol 74)
(Amsterdam: Elsevier) ch 4, 5[187] Cox P A and Williams A A 1985Surf. Sci.152–3791[188] Kemp J P, Davies S T P and Cox P A1989J. Phys: Condens. Matter1 5313[189] Fromme B, Schmitt M, Kisker E, Gorschluter A and Merz H 1994Phys. RevB 50 1874[190] Wu M-C and Møller P J 1990Surf. Sci.235 228[191] Gorschluter A and Merz H 1994Phys. Rev.B 49 17293[192] Mohamed M H, Sadeghi H R and Henrich V E 1988Phys. Rev.B 37 8417[193] Gopel W, Anderson J A, Frankel D, Jaehnig M, Phillips K, Schafer J A and Rocker G 1984Surf. Sci.139
333[194] Newman R and Chrenko R M 1959Phys. Rev.114 1507
Powell R J 1967Stanford Electronics Laboratory ReportNo 5220–1 (unpublished)Adler D and Feinleib J 1970Phys. Rev.B 2 3112
[195] Propach V, Reinen D, Drenkhahn H and Muller-Buschbaum H 1978Z. Naturforsch.B 33 619[196] Woodruff D P and Bradshaw A M 1994 Rep. Prog. Phys.57 1029[197] Haßel M, Kuhlenbeck H, Freund H-J, Shi S, Freitag A, Staemmler V, Lutkehoff S and Neumann M 1995
Chem. Phys. Lett.240 205Shi S and Staemmler VPhys. Rev.B, accepted for publication
[198] Pratt G W Jr andCoelho R 1959Phys. Rev.166 281[199] Wu M-C, Estrada C A and Goodman D W 1991Phys. Rev. Lett.67 L910
Wu M-C, Truong Ch and Goodman D W 1993Adsorption on Ordered Surfaces of Ionic Solids and ThinFilms (Springer Series in Surface Science33) ed H-J Freund and E Umbach (Heidelberg: Springer)
[200] Hollas J M 1982High Resolution Spectroscopy(London: Butterworth)[201] Cappus D, Xu C, Ehrlich D, Dillmann B, Ventrice C A, Al-Shamery K, Kuhlenbeck H and Freund H-J
1993Chem. Phys.177 533[202] Vureno G A, Salmeron M B and Somorjai G A 1988 Surf. Sci.201 129[203] Kim Y-J and Fadley C S, private communication[204] Rohr FPhD thesisRuhr-Universitat Bochum, in preparation
Wirth K 1993 Diploma thesisRuhr-Universitat Bochum[205] Egersdorfer B and Papp H, private communication[206] Ignatiev A, Lee B W and VanHove M A 1977 Proc. 7th Int. Vac. Congr. and 3rd Int. Conf. Sol. Surf.
(Vienna, 1977)p 1733[207] Mays R B and Roberts M W 1977J. Catal.49 216[208] Haßel M 1995PhD thesisRuhr-Universitat Bochum[209] Neuhaus E 1994Diploma thesisRuhr-Universitat Bochum[210] Pignocco A J and Pellisier G E 1967Surf. Sci.7 261[211] Leygraf C and Ekelund S 1973Surf. Sci.40 609[212] Langell M and Somorjai G A 1982 J. Vac. Sci. Technol.21 858
346 H-J Freund et al
[213] Masuda S, Harada Y, Kato H, Yagi K, Kometa T, Miyano T, Onchi M and Sakisaka Y 1988Phys. Rev.B37 8088
[214] Smentkowski V S and Yates J T Jr1990Surf. Sci.232 113[215] Portele F 1969Z. NaturforschA 24 1268[216] Pirug G, Broden G and Bonzel H P 1980Surf. Sci.94 323[217] Brundle C R 1978IBM J. Rev. Develop.22 235[218] Muan A 1958Am. J. Sci.256 171[219] Migano T, Sakisata Y, Komeda T and Onchi M 1986Surf. Sci.169 197[220] Haßel M 1991Diploma thesisRuhr-Universitat Bochum[221] Al-Shamery K, Beauport I, Freund H-J and Zacharias H 1994Chem. Phys. Lett.222 107[222] Kennett H M and Lee A E 1972Surf. Sci.33 377[223] Michel P and Jardin C 1973Surf. Sci.36 478[224] Ekelund S and Leygraf C 1973Surf. Sci.40 179[225] Foster L S 1990Chem. Rev.90 331[226] Allos T I Y, Birss R R, Parker M R, Ellis E and Johnson D W 1977Solid State Commun.24 129[227] Schawlow A L, Wood D L and Clogston A M 1959 Phys. Rev. Lett.3 271[228] Kuhlenbeck H 1994Appl. Phys.A 59 469[229] Samuelsen E J, Hutchings M T and Shirane G 1970Physica 4813[230] Riesen H and Gudel H U 1987Mol. Phys.60 1221[231] Pacchioni G, Minerva T and Bagus P S 1992Surf. Sci.275 450[232] Pacchioni G 1993Surf. Sci.281 257[233] Pacchioni G and Bagus P S 1993Adsorption on Ordered Surfaces of Ionic Solids and Thin Films(Springer
Series in Surface Science33) ed H-J Freund and E Umbach (Heidelberg: Springer)[234] Neyman K M and Rosch N 1992J. Chem. Phys.168 267; 1993Surf. Sci.297 223; 1993Chem. Phys.177
561[235] Pisani C, Dovesi R, Nada R and Tamiro S 1989Surf. Sci.216 267[236] Zaki M I and Knozinger H 1989J. Catal.119 311
Littl e L H 1966Infrared Spectra of Adsorbed Species(London: Academic) p 84[237] Haßel M and Freund H-J 1995Surf. Sci.325 163[238] Xu C and Goodman D WHandbook of Heterogenous Catalysised G Ertl, H Knozinger and J Wertkamp
(Weinheim: Verlag Chemie) ch 4.6 (in press)[239] Sandos H E, Gardner P, King D A and Morris M A 1994Surf. Sci.304 159[240] Yoshinobu J, Ballinger T H, Xu Z, Jansch H J, Zaki M I, Xu J and Yates J T Jr1991Surf. Sci.255 295[241] Vesecky S M, Xu X and Goodman D W 1994J. Vac. Sci. Technol.A 12 2114
Wu M C, Truong C M and Goodman D W 1993J. Phys. Chem.97 4182Truong C M, Wu M C and Goodman D W 1993J. Am. Soc.115 3647He J W, Corneille J S, Estrada C A, Wu M C and Goodman D W 1992J. Vac. Sci. Technol.A 10 2248Wu M C, Estrada C A, Corneille J S and Goodman D W 1992J. Chem. Phys.96 3892
[242] Henzler M, Stock A and Bol M 1993 Adsorption on Ordered Surfaces of Ionic Solids and Thin Films(Springer Series in Surface Science33) ed H-J Freund and E Umbach (Heidelberg: Springer)
[243] Heidberg J, Cabigon L, Kampshoff E, Kandel M, Kuhnemuth R, Meine D, Redlich B, Schonekas O, SuhrenM, Weiss H and Wetter D 1993Adsorption on Ordered Surfaces of Ionic Solids and Thin Films(SpringerSeries in Surface Science33) ed H-J Freund and E Umbach (Heidelberg: Springer)
[244] Weiß H 1995HabilitationsschriftUniversity of Hannover, unpublished[245] Heidberg J, Meine D and Bunsenges Ber 1993Phys. Chem.97 211[246] Zecchina A, Scarano D, Bordiga S, Ricchiardi G, Spoto G and Geobaldo F IR-Studies of CO and NO
adsorbed on well characterized oxide single microcrystals, to be published[247] Marchese L, Coluccia S, Martra G and Zecchina A 1992Surf. Sci.269 135[248] Escalona Platero E, Coluccia S and Zecchina A 1985Langmuir1 407[249] Escalona Platero E, Coluccia S and Zecchina A 1986Surf. Sci.171 465[250] Escalona Platero E, Fubini B and Zecchina A 1987Surf. Sci.179 404[251] Freund H-J and Neumann M 1988Appl. Phys.A 47 3[252] Blyholder G 1974J. Vac. Sci. Technol.11 865[253] Stohr J 1992NEXAFS Spectroscopy(Springer Series in Surface Sciences25) (Berlin: Springer)[254] Fink K and Staemmler V, to be published
Pacchioni G and Bagus P S, private communication[255] Schmeisser D, Greuter F, Plummer E W and Freund H-J 1985Phys. Rev. Lett.54 2095[256] Jacobi C, Astaldi C, Geng P and Bertolo M 1989Surf. Sci.223 569
Oxide surfaces 347
[257] Lassetre E N 1969Canad. J. Chem.47 1733[258] Huber K P and Herzberg G 1979Molecular Spectra and Molecular Structure, IV: Constants of Diatomic
Molecules(New York: Van Nostrand Reinhold)[259] Homann K, Jaeger R M and Kuhlenbeck H 1993J. Electr. Spectrosc. Rel. Phen.62 273[260] Wu M C, Møller P J 1989Surf. Sci.221 250
Møller P J and Wu M C 1989Surf. Sci.224 265Wu M C and Møller P J 1990Surf. Sci.235 228
[261] Wu M C and Møller P J 1991The Structure of Surfaces IIIed S Y Tong, M A van Hove, K Takayanakiand X D Xider (Berlin: Springer) p 652
[262] Wu M C and Møller P J 1990Surf. Sci.250 179[263] Guo Q and Møller P J 1990Vacuum41 1114
Møller P J and Guo Q 1991Thin Sol. Films201 267[264] Møller P J and Nerlov J 1993Surf. Sci.307–9591[265] Ge O and Møller P JAppl. Surf. Sci.82–3305[266] Guo Q and Møller P JSurf. Sci. Lett.in press[267] Ludviksson A, Ernst K H, Zhang R and Campbell C T 1993J. Catal.141 380[268] Ernst K H, Ludviksson A, Zhang R and Campbell C T 1993Phys. Rev.B 47 13782[269] Altman E I and Gorte R J 1988Surf. Sci.195 392; 1988J. Catal.113 185[270] Cordatas H, Buulnesin T and Gorte R J 1995Surf. Sci.323 219[271] Altman E I and Gorte R J 1989Surf. Sci.216 386[272] Pan J-M, Maschhoff B L, Diebold U and Madey T E 1993Surf. Sci.291 381[273] Diebold U, Pan J-M and Madey T E 1993Phys. Rev.B 47 3868[274] Pan J-M and Madey T E 1993J. Vac. Sci. Technol.A 11 1667[275] Steinruck H-P, Pesty F, Zhang L and Madey T E 1995Phys. Rev.B 51 2427[276] Duviez C, Henry C R and Chapon C 1991Surf. Sci.253 190[277] Henry C R, Chapon C, Duriez C and Giorgio S 1991Surf. Sci.253 177[278] Henry C R, Chapon C, Goyhenex C and Monot R 1992Surf. Sci.272 283[279] Legare P and Bilwes B R 1992Surf. Sci.279 159[280] Legare P, Finck F, Roche R and Maire G 1989Z. Phys.D 12 19[281] Gillet E and Matolin V 1991Z. Phys.D 19 361[282] Ealet B and Gillet E 1993Surf. Sci.281 91[283] Ogawa S and Ichikawa S 1995Phys. Rev.B 51 17231[284] Gota S, Gantier M, Donillard L, Thromat N, Durand J P and Le Fevre P 1995Surf. Sci.323 163[285] Bender M, Al-Shamery K and Freund H-J 1994Langmuir10 3081[286] Ehrlich D, Bender M, Yakovkin I and Freund H-J, to be published
Ehrlich D 1995PhD thesisRuhr-Universitat Bochum[287] Kittel C 1971Introduction to Solid State Physics4th edn (New York: Wiley)[288] Raether H 1965Ergebnisse der exakten Naturwissenschaften38 84