Oxygen/Hydrogen–Planar-Laser-Induced FluorescenceMeasurements and Accuracy Investigation
in High-Pressure Combustion
Aravind Vaidyanathan∗
Iowa State University, Ames, Iowa 50011
and
Jonas Gustavsson† and Corin Segal‡
University of Florida, Gainesville, Florida 32611
DOI: 10.2514/1.39013
Inflow species concentration measurements in reacting flows at high pressures, based on nonintrusive methods,
have been acquired so far for isolated conditions in a range of experimental devices and by using a variety of
methods. Furthermore, extensive assessments of the uncertainties associated with the measurement techniques are
lacking. In general, these methods have been based on calibrations determined from assumptions that were not
sufficiently quantified to provide a detailed range of the uncertainties associated with these measurements. This
work quantifies the uncertainties associated with OH measurement in an oxygen–hydrogen system produced by a
shear, coaxial injector typical of those used in rocket engines. Planar OH distributions are obtained for a range of
pressures from 10 to 53 bar, providing instantaneous and averaged distribution in a unified study, using the same
experimental setup and maintaining the rest of the parameters the same. The uncertainty of 18 different
parameters was evaluated and the overall root mean square error was found as 21.9, 22.8, 22.5, and 22.9% at 10,
27, 37, and 53 bar, respectively.
I. Introduction
F UTURE power systems for flight or ground applications willincreasingly rely on computational fluid dynamics (CFD) as
design tools. They will require, in turn, reliable experimentalvalidation data. To date, this database is still limited [1]. Generally,high-pressure data are scarce and, in particular, uncertainty analysisis rarely addressed. Among the targeted inflow measurements,OH is of major importance because it serves as a marker of thenear-stoichiometric high-temperature flame zone [2–4]. A set ofexperimental studies that focused on the inflow species measure-ments for coaxial injectors in the past 10–15 years [4–21] is shownin Table 1, indicating the extent of uncertainty evaluation and, whenincluded, the value of these uncertainties. This review clearlyindicates that a thorough uncertainty analysis is still needed toimprove the quality of the inflow measurements for CFDvalidation.
The diagnostic methods used in the previous rocket injectorstudies included Raman spectroscopy for H2O, H2, and O2 molefraction measurements and OH emissions and planar-laser-inducedfluorescence (PLIF) for visualization. As an example, Singla et al. [4]recently provided semiquantitative OH distribution for gaseoushydrogen/liquid oxygen (GH2=LOX) cryogenic flames at 60 barwithout converting signal intensities to the actual number density.Potential error sources which typically originate from shot noise,
spatial variation in laser sheet intensity profiles, and laser shot-to-shot power fluctuations were not addressed. It can be seen fromTable 1 that only 4 out of 18 previous experimental studies addressedand included a limited number of uncertainty factors associated withthe measurements. Quantitative OH measurements with detaileduncertainty analysis for gaseous H2=O2 (GH2=GO2) systems athigh pressures, which are of particular interest for current codedevelopment of rocket engines, are scarce. Validation of gaseoussystems is of interest as a preliminary step before developing themore challenging liquid-fuel-based reacting computational capabi-lities. Hence, the current work is aimed at providing inflowquantitative OH measurements for a single element, shear coaxialGH2=GO2 injector at pressures in excess of 50 bar, including detaileduncertainty analysis.
Laser-induced fluorescence (LIF) techniques have been used forspecies concentration measurements in a wide range of environ-ments. Hanson [22], for example, provided a detailed review of theapplication of planar imaging of fluorescence, giving examples ofPLIF application to obtain species concentration, 2-D temperaturefields, velocity, and pressure imaging. Several research groups havesuccessfully applied LIF to obtain OH species concentration in harshcombustion environments [23–25]. The majority of these studieswere carried out at pressures below 20 bar; at high pressures,quantitative OH data are limited.
The results of the present study from low to high pressure,including 10, 27, 37, and 53 bar are described next, followed by adetailed uncertainty analysis of 18 parameters involved in thesemeasurements.
II. Experimental Technique, Facility Description,and Instrumentation Layout
A. Laser-Induced Fluorescence: Quantitative Method
Fluorescencemodeling has been discussed previously andwill notbe reviewed here; detailed explanations are given by Eckbreth [26]and others [4,24,27].Amathematical formulation of all the processesinvolved in the linear fluorescence regime of A-X(1,0) transition ismade to infer target species number density as
HereNp is the number of photons detected, n0 is the number density(cm3) of the target species, E is the laser energy per pulse (Joule),Alaser (cm
2) is the area of cross section of the laser beam/sheet, fB isthe Boltzmann factor of the transition excited, B12 is the Einstein Bcoefficient for absorption (cm3 J1 s2), c is the speed of light(cms1),
Rlaserabs dv is the overlap integral (centimeters),
A21=Q21 A21 is the fluorescence yield, V (cm3) is the volumeprobed by the laser, is the efficiency of the detection optics andcamera, and =4 is the fraction of solid angle detected. The term
X9
1
fBB12=c2
referred to as
X9
1
fBB012
includes the contributions of the nine rovibrational lines that areemployed for OH-PLIF in the current study. The absorbing speciesline shape functionabsv is simulated usingLIFBASE as describedin literature [4,26–29]. The fluorescence yield was calculated asdescribed in detail by Paul [30] and Singla et al. [4].
The physical significance of the terms from the experimental,modeling, and quantifying point of view are shown in Fig. 1.
The excitation and detection strategy of OH consists of the A-X(1,0) transition in the current study. The detection electronics used tocollect fluorescence was an intensified charge-coupled device(ICCD) camera. There are interference effects from other speciespresent in the combustion environment, elastic scattering, and thebackground emissions.
The laser pulse energy employed in PLIF measurements and theshot-to-shot power fluctuation needs to be monitored. The laserbeam/sheet profile is nonuniform in space and needs to be correctedfor quantitative measurements. The laser beam is attenuated as it
Table 1 Previous experimental studies on rocket injectors
Ref. Injector type P, bar Diagnosticmethod
Speciesquantification
Uncertaintysource, % error
RMSerror,%
Foust et al. [5] Single element shear(GH2=GO2)
13 Ramanspectroscopy
Mole fraction of H2O,H2, and O2
Nonlinear temperaturedependence of
Stokes band factor(40) 40
Foust et al. [6] Single element shear,swirl (GH2=GO2)
13–69 Ramanspectroscopy
Mole fraction of H2O,H2, and O2
1) Laser pulse energyfluctuation (5)
2) Nonlinear variationof Stokes band factor
(45) 45Brummund et al. [7] Single element shear
(LOX=GH2)20 PLIF OH distribution in signal
intensity—— ——
Mayer et al. [8] Single element shear(LOX=GH2)
15–100 Shadowgraph, flameemissions
Signal intensity(qualitative)
—— ——
Yeralan et al. [9] Single element swirl(LOX=GH2)
28 Ramanspectroscopy
Mole fraction of H2O,H2 and O2
Calibrationmeasurements (40) 40
Wehrmeyer et al. [10] Single element swirl(LOX=GH2)
60 Ramanspectroscopy
H2O, O2, and H2
distribution in signalintensity
—— ——
Herding et al. [11] Single element shear(LOX=GH2)
10 OH emissions Signal intensity(qualitative)
—— ——
Candel et al. [12] Single element shear(LOX=GH2)
10 PLIF for OH andO2.
Signal intensity(qualitative)
—— ——
Ivancic et al. [13] Single element shear(LOX=GH2)
60 OH emissions Signal intensity(qualitative)
—— ——
Juniper et al. [14] Single element shear(LOX=GH2)
70 OH emissions Signal intensity(qualitative)
—— ——
Mayer et al. [15] Single element shear(LOX=GH2)
20–60 Shadowgraph, flameemissions
Signal intensity(qualitative)
—— ——
Kalitan et al. [16] Single element swirl(LOX=CH4)
41 OH-PLIF and OHemissions, CO2
emissions
Signal intensity(qualitative)
—— ——
Singla et al. [17] Single element shear(LOX=CH4)
70 OH and CHemissions
Signal intensity(qualitative)
—— ——
Singla et al. [4] Single element shear(LOX=GH2)
63 PLIF for OHconcentration
Signal intensity(semiquantitative)
1) Boltzmann fractionvariation (10)
2) Laser absorption byOH (10–30) 32
Singla et al. [18] Single element shear(LOX=CH4)
25–30 PLIF for OHvisualization
Signal intensity(qualitative)
—— ——
Smith et al. [19] Single element shear(LOX=GH2)
40–60 Shadowgraph,OH emissions
Signal intensity(qualitative)
—— ——
Lux and Haiden [20] Single element shear(LOX=CH4)
40–60 OH emissions Signal intensity(qualitative)
—— ——
Lux and Haiden [21] Single element shear(LOX=CH4)
40–60 OH and CHemissions
Signal intensity(qualitative)
—— ——
VAIDYANATHAN, GUSTAVSSON, AND SEGAL 865
Dow
nloa
ded
by U
NIV
ER
SIT
Y O
F N
OT
RE
DA
ME
on
Aug
ust 2
5, 2
014
| http
://ar
c.ai
aa.o
rg |
DO
I: 1
0.25
14/1
.390
13
traverses through the flame due to absorption by OH and otherspecies. All these factors contribute to the measurementuncertainties.
Furthermore, the Boltzmann fraction fB in the initial state popu-lation n0fB varies with temperature and hence a careful selection ofrovibrational transitions with minimum temperature dependence isrecommended for PLIF diagnostics. The dependence of abs withtemperature and pressure is to be accounted for species quanti-fication. The determination of fluorescence yield in Eq. (1) alsorequires the knowledge of colliding species mole fraction in additionto temperature and pressure fields.
The strength of the fluorescence signal detected depends on theintersection volume of laser beam/sheet with the flame known as theprobe volume and the fraction of solid angle collected. To avoidthe interference signals and elastic scattering, optical filters areemployed while collecting fluorescence; however, most of theopticalfilters have transmission efficiency of less than 60%at 310 nmwhere the OH fluorescence is detected. In addition, the photondetection efficiency at 310 nm for an ICCD camera is less than 25%.All these factors reduce the strength of the detected fluorescencesignal. Thus, each step in the measurement and analysis involvesuncertainties; they are addressed, identified as random or systematic,and evaluated in the detailed uncertainty analysis.
In the current study, the relative uncertainties in the parametersinvolved in determination of OH concentration was calculated asthe ratio of the maximum variation, typically obtained as standarddeviation in the parameters to their respective mean values. System-atic error sources,which depend on the localflame conditions such astemperature and mole fraction of colliding species, and the difficultyto provide an environment with accurately controllable OH con-centration serve as the major difficulties for calibration [27]. Theimmediate consequence can be viewed as the limitations in statisticalanalysis of OH concentration measurements in the absence of athorough calibration. As OH concentration determined in the studywas not based on calibration, the statistical analysis is limited toparameters with random fluctuations in their measurements. In thecurrent study, the two major random errors based on measurementsincluded the laser shot-to-shot power fluctuation and the shot-to-shotlaser sheet spatial intensity fluctuation.
B. Experimental Facility and Instrumentation
A high-pressure combustion experimental facility with a singleshear GH2=GO2 injector was used in this study. The facility,described in detail in [31], can operate at pressures up to 60 bar. Thechamber configuration and injector details are shown schematicallyin Fig. 2. The oxidizer is injected into the chamber through the centertubewhile the fuel is injected through the annular region surroundingit. The nominal pressureswere selected to be in 10–55-bar range. TheGH2=GO2 experimental conditions investigated in the current studyare listed in Table 2. The oxidant to fuelmass ratioO=F aswell as the
A 4
=
OH-PLIF Measurement
(I)
1) Fluorescence
(i) Detection electronics
(ii) Excitation / detection strategy
(iii) Detection environment
2) Interference Signals
(iv) Laser internal scattering
(v) Background emission
(vi) Mie / Rayleigh scattering
(III)
1) Absorption and Excitation(i) Boltzmann factor (temperature)
(ii) Absorption coefficient (spectroscopy)2) Line Shape
(iii) Overlap integral (line shape & laser centerline shift)
(iv) Model (collisional & Doppler width ft)3) Fluorescence Efficiency
(v) Quench rate
(collider species cross section / mole fraction, pressure, temperature )
(vi) Model for quantum yield
/shi
(II)
1) Laser (i) Shot to shot power fluctuation
(ii) Laser sheet / beam profile variation
(iii) Laser absorption (OH & other molecules)
p
OH
12 21
2
21
N
B A
A c
EV
o
laser absBf
d
n
ν21Q
(IV)
1) Experimental
Constants
(i) Probe volume
(ii) Solid angle detected
(iii) Transmission efficiency of filters
(iv) Photon detection
efficiency of camera
π
=Φ Φ
+Ω
η
Fig. 1 Physical significance of the terms in OH number density expression based on fluorescence modeling, experimental, and quantification.
Injector Assembly
Segmented Chamber Wall
Injector AssemblyExit Nozzle
Quartz WindowsSegmented Chamber Wall
a) Combustion chamber
D1 (mm) D2 (mm) D3 (mm)
1.2 2.2 2.69
b) Injector details
Fig. 2 Experimental setup, including a) chamber geometry (the
chamber is a square with 2:5 2:5 cm2 cross section; the windows are
uncooled and flush with the surface), and b) injector details.
866 VAIDYANATHAN, GUSTAVSSON, AND SEGAL
Dow
nloa
ded
by U
NIV
ER
SIT
Y O
F N
OT
RE
DA
ME
on
Aug
ust 2
5, 2
014
| http
://ar
c.ai
aa.o
rg |
DO
I: 1
0.25
14/1
.390
13
velocity ratio were maintained the same. These two parameters areprimarily responsible for the development of the shear layers, hence,mixing among the two flows. Mass flows increased as the pressureincreased from one condition to the other. The experiments lasted for8–10 s following ignition. Data were taken toward the end of thesequence when the pressure in the chamber reached essentiallysteady state.
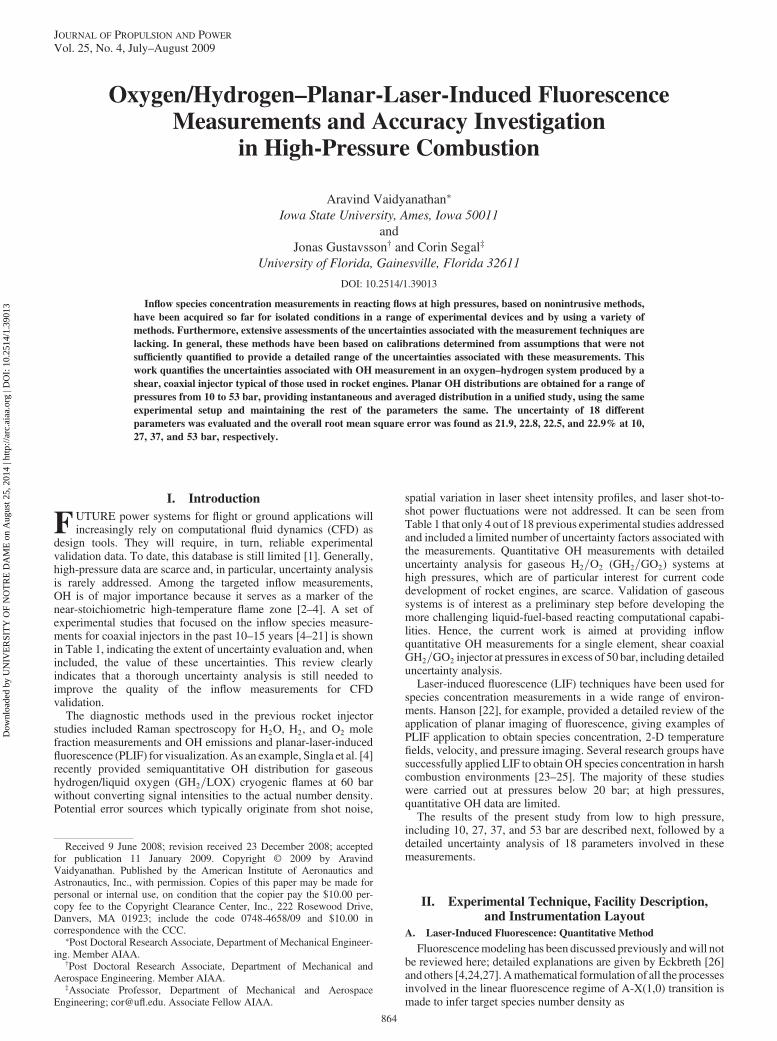
The schematic of theOH-PLIF diagnostic setup is shown in Fig. 3.The third harmonic output at 355 nm from a Nd-YAG (ContinuumSurelite II) pulsed laser was used to pump an optical parameteroscillator (OPO) (Continuum Panther). The full width at half-maximum spectral width of the OPO output beam, measured using aBurliegh WA-4500 wave meter, was 5 cm1 and the centerlinewavelength of the laser before doublingwas 566.03 nm.A frequencydoubler was then used to obtain a UV beam at 283 nm. The laserbeam at 283 nmwas formed into a sheet of 4 0:04 cm cross sectionusing a series of fused silica lenses. Only the central portion of thelaser sheet with cross section of 2 0:04 cm was used fordiagnostics. The UV sheet with 2 0:04 cm cross section had ameasured pulse energy of 0:89 0:1 mJ and was used to excite theOH A-X(1,0) rovibrational transitions. The laser shot-to-shot powerfluctuation was monitored for 290 pulses and contributes to randomerror. The average of the 290 laser pulse energies was 0:89 mJ=pulsewith a standard deviation of 0:10 mJ=pulse and accounted for anuncertainty of 11% in laser power.
Fluorescence images were collected perpendicular to the directionof laser beam propagation using an ICCD camera (Cooke Corp.DiCam-Pro) equipped with 105 mm=4 telephoto UV lens and withquantum efficiency of 12% at 310 nm. The laser and the camera weresynchronized using a pulse generator (Stanford Research SystemsDG 535) and were operated at 10 Hz. The camera was used in doubleshutter mode such that it collected fluorescence for 100 ns insynchronization with the laser in the first image. The second imagewas collected 500 ns after thefirst image for another 100 ns to captureinstantaneous flame emissions. The phosphor used in the ICCDcamerawas P46. The intensity decays to less than 10% in 500 ns. Themaximum signal levels recorded were 10 times the dark backgroundin this study. Hence, the decay of the signal to less than 10% of thepeak intensity will not be detected by the camera as it is less than thelevel of the dark background. The effective resolution of the camerawas 66 m=pixel in 4 4 binning mode. Thus, the delay of 500 nsbetween two double shutter images was employed so that pixelresolution was not affected by the flow fluctuations of a jet at
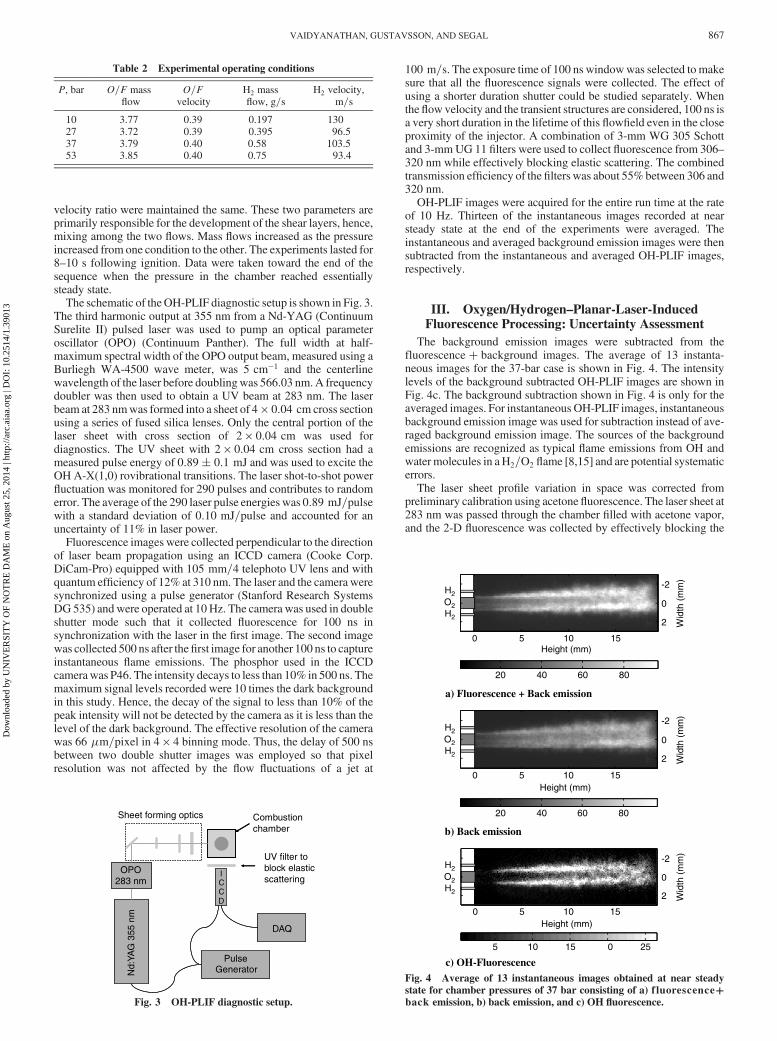
100 m=s. The exposure time of 100 ns windowwas selected to makesure that all the fluorescence signals were collected. The effect ofusing a shorter duration shutter could be studied separately. Whenthe flow velocity and the transient structures are considered, 100 ns isa very short duration in the lifetime of this flowfield even in the closeproximity of the injector. A combination of 3-mm WG 305 Schottand 3-mmUG 11 filters were used to collect fluorescence from 306–320 nm while effectively blocking elastic scattering. The combinedtransmission efficiency of the filters was about 55%between 306 and320 nm.
OH-PLIF images were acquired for the entire run time at the rateof 10 Hz. Thirteen of the instantaneous images recorded at nearsteady state at the end of the experiments were averaged. Theinstantaneous and averaged background emission images were thensubtracted from the instantaneous and averaged OH-PLIF images,respectively.
III. Oxygen/Hydrogen–Planar-Laser-InducedFluorescence Processing: Uncertainty Assessment
The background emission images were subtracted from thefluorescence background images. The average of 13 instanta-neous images for the 37-bar case is shown in Fig. 4. The intensitylevels of the background subtracted OH-PLIF images are shown inFig. 4c. The background subtraction shown in Fig. 4 is only for theaveraged images. For instantaneous OH-PLIF images, instantaneousbackground emission image was used for subtraction instead of ave-raged background emission image. The sources of the backgroundemissions are recognized as typical flame emissions from OH andwater molecules in aH2=O2 flame [8,15] and are potential systematicerrors.
The laser sheet profile variation in space was corrected frompreliminary calibration using acetone fluorescence. The laser sheet at283 nm was passed through the chamber filled with acetone vapor,and the 2-D fluorescence was collected by effectively blocking the
Fig. 4 Average of 13 instantaneous images obtained at near steady
state for chamber pressures of 37 bar consisting of a) fluorescenceback emission, b) back emission, and c) OH fluorescence.
VAIDYANATHAN, GUSTAVSSON, AND SEGAL 867
Dow
nloa
ded
by U
NIV
ER
SIT
Y O
F N
OT
RE
DA
ME
on
Aug
ust 2
5, 2
014
| http
://ar
c.ai
aa.o
rg |
DO
I: 1
0.25
14/1
.390
13
elastic scattering using the UV filters and ICCD camera. Ninetyacetone fluorescence images were averaged and normalized with themaximum intensity/counts along the width to obtain the spatialvariation of the laser sheet in the region of interest. The normalizedlaser sheet profile variation in a percentage intensity scale is shown inFig. 5. The laser sheet had maximum intensity of above 90% atheights of 11–15 mm, although it gradually decreased to 25% atheights of 1 and 19 mm on either side. Based on the normalizedacetone fluorescence images shown in Fig. 5, the laser sheet intensityvariation in spacewas corrected for all theOH-PLIF images acquiredin the current study. The uncertainty due to the shot-to-shotfluctuation of the laser sheet spatial profile contributes to randomerror and was calculated as the ratio of the standard deviation to theaverage values of the 90 normalized acetonefluorescence images andwas 5.9%.
The OH-PLIF diagnostic in this study is associated with 2-Dimaging of the fluorescence on a charge-coupled device chip. Thus,the volume V (cm3) in Eq. (1) corresponding to the collectedfluorescence signal intensity in each pixel in the camera is equal tothe product of the pixel projection area Apixel projection (cm
2) and thelaser sheet thickness l (centimeters). The uncertainty associated withthe volume probed is due to the accurate determination of the pixelresolution. The pixel resolutionwas obtained by calibrating it againstthe accurately known dimensions of a wire with constant diameterand length. The resultant uncertainty in the pixel resolutionaccounted for 2.8% uncertainty in the probe volume and is identifiedas systematic error. The laser sheet thickness was 400 m andappears in the expression for laser sheet cross section areaAlaser (cm
2)and volume probedV (cm3). FromEq. (1), it can be seen that the lasersheet thickness cancels and does not appear in the number densityexpression. Hence, the error in laser sheet thickness was notconsidered here. Regarding the experimentally collected informa-tion, the laser sheet thickness will affect the probe volume. In thesestudies, the laser sheet was very carefully aligned to make sure thatthe sheets passed diametrically through the injector.
To obtain absolute OH concentration in number density, thearbitrary selected unit, camera counts, are to be converted tophotometric units. This was done by camera calibration against alight source of known irradiance. The light source used here was a1000-W, quartz halogen, tungsten filament lamp. The uncertainty inthe irradiance levels near the 310-nm wavelength was 2.3%. Thecamera calibration corresponded to the detection strategy employedin the OH-PLIF measurements and region of interest. The un-certainty in the photon calibration due to the nonlinearity associatedwith the linear curve fit was calculated and was 1.8%. The netuncertainty in the photon calibration due to these two factors, that is,lamp irradiance uncertainty of 2.3 and 1.8% due to nonlinearity incalibration fit, accounted for 2.9% systematic error.
The uncertainty contribution from shot noise due to the Poissondistributed photon number [27] was calculated as the ratio of thestandard deviation to the average photon arrival from the OH-PLIFimages at 10, 27, 37, and 53 bar and is identified as randomerror. Thisuncertainty contribution accounted for 6.9, 7.05, 6.8, and 6.7%,respectively, for the four selected pressures.
The camera has spatial variation of pixel intensities and con-tributes to both systematic and random errors. The systematic andrandom spatial variation is eliminated by linearfiltering, also referred
to as pixel smoothening, in which the value of an output pixel in theimage is computed as a weighted average of neighboring pixels [11].In the current study, each pixel value was computed as a weightedaverage of the neighboring 5 5matrix of pixels with equalweights.The uncertainty due to systematic and random spatial variation ofpixel intensities, minimized by linear filtering [11], in which thevalue of an output pixel in the image is computed as a weightedaverage of neighboring pixels, was calculated as the ratio of thedifference in pixel intensities before and after filtering to theircorresponding averaged values. The uncertainty contribution due topixel smoothening of the OH-PLIF images at 10, 27, 37, and 53 baraccounted for 7, 7, 6.3, and 6%, respectively.
IV. Quantification of Oxygen–HydrogenConcentration
The OH-PLIF images were image-processed to 1) eliminatebackground emissions, 2) correct for spatial variation in laser inten-sity, and 3) pixel smoothen the images. The intensity levels of theimage-processed OH-PLIF images are related to the number densityof OH by Eq. (1).
To determine the number density from the image-processed OH-PLIF images, the values of absorption coefficient
X9
1
fBB012
overlap integralRlaserabs d, and collisional quench rate Q21 in
Eq. (1), which vary with the conditions in the flame, are identified aspotential sources of systematic errors and are calculated as follows.Abroad range of equivalence ratios for GH2=GO2 combustion, 0.5–3,was considered [32]. As the OH radical exists mostly in the region ofstoichiometry [3], the equivalence ratio range of 0.5–3 could beconsidered as an overestimation of the range of conditions in theflame. Therefore, this assumption is quite conservative and isexpected to yield a larger uncertainty than actually encountered inthe experiment. However, given the lack of specific inflow data, ithas been adopted here to bracket with confidence the possibleexperimental uncertainty. In a first approximation, equilibriumconditions are assumed. The equilibrium conditions for the chemicalreactions pertaining to the GH2=GO2 experiments were calculatedusing STANJAN [33]. It was found that the temperature could varybetween 2500 and 3500 K, with the maximum at stoichiometry.
The variation of
X9
1
fBB012 cmJ1
with temperature, which in turn varieswith the equivalence ratio,wascalculated and the mean value of
X9
1
fBB012
was used to determine OH number density. The uncertainty due tothe absorption coefficient variation with temperature and withrespect to the mean at 10, 27, 37, and 53 bar was found as 12.4, 14.6,14.5, and 15.1%, respectively.
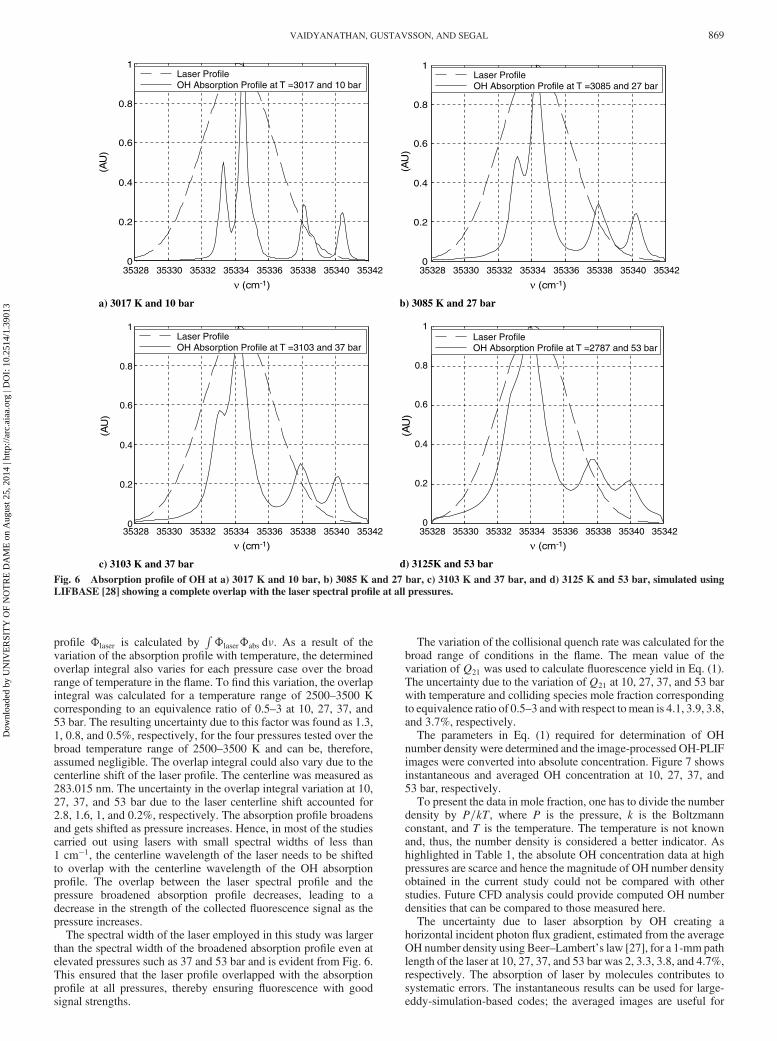
The absorption profiles of OH at 10, 27, 37, and 53 bar weresimulated using LIFBASE [28]. To simulate the absorption profileabs, the collisional andDoppler widthswere calculated as describedin literature [27,29]. The OH absorption profiles at 10, 27, 37, and53 barwere simulated for a broad temperature range of 2500–3500Kcorresponding to the equivalence ratio of 0.5–3. The absorptionprofile of OH at 3000 K in the 10–50-bar range along with the laserspectral profile is shown in Fig. 6. The OH absorption profilebroadens and the centerline of the OH absorption profile shifts withpressure and temperature. The overlap integral of the absorptionprofile ofOHat 10, 27, 37, and 53 bar, and theGaussian spectral laser
Fig. 5 Normalized laser sheet intensity profile variation obtained from
acetone fluorescence images. The intensity is provided in percentagescale. The intensity is above 90% at heights of 11–15 mm and gradually
decreases to 25% at heights of 1 and 19 mm.
868 VAIDYANATHAN, GUSTAVSSON, AND SEGAL
Dow
nloa
ded
by U
NIV
ER
SIT
Y O
F N
OT
RE
DA
ME
on
Aug
ust 2
5, 2
014
| http
://ar
c.ai
aa.o
rg |
DO
I: 1
0.25
14/1
.390
13
profile laser is calculated byRlaserabs d. As a result of the
variation of the absorption profile with temperature, the determinedoverlap integral also varies for each pressure case over the broadrange of temperature in the flame. To find this variation, the overlapintegral was calculated for a temperature range of 2500–3500 Kcorresponding to an equivalence ratio of 0.5–3 at 10, 27, 37, and53 bar. The resulting uncertainty due to this factor was found as 1.3,1, 0.8, and 0.5%, respectively, for the four pressures tested over thebroad temperature range of 2500–3500 K and can be, therefore,assumed negligible. The overlap integral could also vary due to thecenterline shift of the laser profile. The centerline was measured as283.015 nm. The uncertainty in the overlap integral variation at 10,27, 37, and 53 bar due to the laser centerline shift accounted for2.8, 1.6, 1, and 0.2%, respectively. The absorption profile broadensand gets shifted as pressure increases. Hence, in most of the studiescarried out using lasers with small spectral widths of less than1 cm1, the centerline wavelength of the laser needs to be shiftedto overlap with the centerline wavelength of the OH absorptionprofile. The overlap between the laser spectral profile and thepressure broadened absorption profile decreases, leading to adecrease in the strength of the collected fluorescence signal as thepressure increases.
The spectral width of the laser employed in this study was largerthan the spectral width of the broadened absorption profile even atelevated pressures such as 37 and 53 bar and is evident from Fig. 6.This ensured that the laser profile overlapped with the absorptionprofile at all pressures, thereby ensuring fluorescence with goodsignal strengths.
The variation of the collisional quench rate was calculated for thebroad range of conditions in the flame. The mean value of thevariation of Q21 was used to calculate fluorescence yield in Eq. (1).The uncertainty due to the variation ofQ21 at 10, 27, 37, and 53 barwith temperature and colliding species mole fraction correspondingto equivalence ratio of 0.5–3 andwith respect tomean is 4.1, 3.9, 3.8,and 3.7%, respectively.
The parameters in Eq. (1) required for determination of OHnumber density were determined and the image-processed OH-PLIFimages were converted into absolute concentration. Figure 7 showsinstantaneous and averaged OH concentration at 10, 27, 37, and53 bar, respectively.
To present the data in mole fraction, one has to divide the numberdensity by P=kT, where P is the pressure, k is the Boltzmannconstant, and T is the temperature. The temperature is not knownand, thus, the number density is considered a better indicator. Ashighlighted in Table 1, the absolute OH concentration data at highpressures are scarce and hence the magnitude of OH number densityobtained in the current study could not be compared with otherstudies. Future CFD analysis could provide computed OH numberdensities that can be compared to those measured here.
The uncertainty due to laser absorption by OH creating ahorizontal incident photon flux gradient, estimated from the averageOH number density using Beer–Lambert’s law [27], for a 1-mm pathlength of the laser at 10, 27, 37, and 53 bar was 2, 3.3, 3.8, and 4.7%,respectively. The absorption of laser by molecules contributes tosystematic errors. The instantaneous results can be used for large-eddy-simulation-based codes; the averaged images are useful for
35328 35330 35332 35334 35336 35338 35340 353420
0.2
0.4
0.6
0.8
1
ν (cm-1) ν (cm-1)
ν (cm-1) ν (cm-1)
(AU
)
Laser ProfileOH Absorption Profile at T =3017 and 10 bar
35328 35330 35332 35334 35336 35338 35340 353420
0.2
0.4
0.6
0.8
1
(AU
)
Laser ProfileOH Absorption Profile at T =3085 and 27 bar
a) 3017 K and 10 bar b) 3085 K and 27 bar
35328 35330 35332 35334 35336 35338 35340 353420
0.2
0.4
0.6
0.8
1
(AU
)
Laser ProfileOH Absorption Profile at T =3103 and 37 bar
35328 35330 35332 35334 35336 35338 35340 353420
0.2
0.4
0.6
0.8
1
(AU
)
Laser ProfileOH Absorption Profile at T =2787 and 53 bar
c) 3103 K and 37 bar d) 3125K and 53 bar
Fig. 6 Absorption profile of OH at a) 3017 K and 10 bar, b) 3085 K and 27 bar, c) 3103 K and 37 bar, and d) 3125 K and 53 bar, simulated using
LIFBASE [28] showing a complete overlap with the laser spectral profile at all pressures.
VAIDYANATHAN, GUSTAVSSON, AND SEGAL 869
Dow
nloa
ded
by U
NIV
ER
SIT
Y O
F N
OT
RE
DA
ME
on
Aug
ust 2
5, 2
014
| http
://ar
c.ai
aa.o
rg |
DO
I: 1
0.25
14/1
.390
13
Reynolds-averaged Navier–Stokes-based codes [1]. These resultsare discussed next.
V. Flame Structure
The OH number density contours in Fig. 7 show certainnoteworthy features. It can be observed from the 10-bar casecontours that the flame is smooth and less corrugated than is seen athigher pressures. For the four experimental conditions,O=F velocityand density ratios, which are largely responsible for the developmentof shear layers, remained the same. The difference in the fourexperiments is the turbulence and the heat release levels. In addition,Soret and Dufour cross-diffusion effects arising from concentrationand temperature gradients may also play a role. These secondaryeffects could be effectively evaluated in complimentaryCFDstudies.As noted, theOH radical in a nonpremixedflame is considered to be agood marker of the reaction zone. Similar to the study described in[3], the stoichiometric contour was traced from the axial evolution ofthe location of maximum OH number density in the flame, asindicative of the mean position of the reaction zone. Thus, from allfour average OH density contours shown in Fig. 7, the mean positionof the reaction zone was quantitatively determined and is shown in
Fig. 8. Themean position of the reaction zone at 10 bar shows that theflame is anchored at the lip of the oxidizer post, as is typical of thecoaxial shear flames [4].
For test cases at higher pressures of 27 and 37 bar, the OH-PLIFsignal would indicate a lifted flame, however, this is an effect ofstrong background correction in these images; in all cases, the flamewas anchored at the lip. The uncertainty of 23% in OH numberdensity refers to the maximum uncertainty at each point where OHconcentration is determined, as the contour plots in Fig. 7 show. Itshould be noted that the 23%uncertainty has no significance at pointsin the flame where OH concentration cannot be determined and istherefore not provided as part of data generation.
The location of the maximum OH concentration is similar for allcases, explaining the similar effect of same density and velocity ratioon shear layer development regardless of the difference in turbulenceand heat release rates.
To analyze the effect of turbulence, the Reynolds number of GO2
andGH2 were calculated as UD1= and UD3 D2=, where is the density,U is the velocity, and is the dynamic viscosity of thegas, and D1, D2, and D3 are the dimensions of the injector as shownin Fig. 2, respectively. The Reynolds number ReD for GO2 was38,100; 75,380; 112,767; and 148,637, and forGH2,ReD was 5752;
Fig. 7 OH number density contours: a) instantaneous, and b) average of 13 instantaneous contours at near steady chamber pressure of 10, 27, 37, and
53 bar, respectively.
870 VAIDYANATHAN, GUSTAVSSON, AND SEGAL
Dow
nloa
ded
by U
NIV
ER
SIT
Y O
F N
OT
RE
DA
ME
on
Aug
ust 2
5, 2
014
| http
://ar
c.ai
aa.o
rg |
DO
I: 1
0.25
14/1
.390
13
11,534; 16,936; and 21,900 at 10, 27, 37, and 53 bar, respectively.The ReD of GH2 and GO2 clearly indicate that the flow regime isturbulent. The momentum flux ratio, defined as
JU2GH2
U2GO2
governs the growth of the shear layer and remained the same,J 0:4, for all cases. In the study by Seitzman et al. [2], the OHstructures in turbulent nonpremixed hydrogen flame were char-acterized at ReD of 2300, 8600, 25,000, and 49,500. It was foundthat, as the flow makes the transition from laminar to the turbulentregime, there is a significant change in the OH structures from lowstrain rate, thickfilament zones to high strain rate, thin filament, morediffuse regions. Another notable observation was that, at higherReynolds number, the OH structures became increasingly con-voluted; a similar behavior was observed in the current study,as well.
Previous studies focused on shear coaxial cryogenic flames [4,11–13,17,18] identified the wrinkling, corrugation, and flapping of theflame to be caused by the combined effects of turbulence andinstabilities in the flowfield. The stability criteria based on the ratio ofoxidizer lip thickness to the flame thickness greater than unity for astable flame is discussed in detail in the literature [4,18,34]. As theflame anchors on the oxidizer lip, the size and dynamics of the
recirculation region in the lip wake influences the flame stability.Thus, in the current study, thewrinkling and corrugation of theflame,at higher pressures with higher Reynolds number, is attributed tothe increased turbulence, whereas the flapping of the flame, ob-served from the instantaneous OH distributions, is attributed to theinstability dictated by two factors: 1) the size of the recirculation zonein the wake of oxidizer lip and 2) the large-scale flow fluctuation inthe recirculation region formed on the injection face around the jetinjectors.
VI. Discussion of Uncertainties
The summary of OH-PLIF measurement uncertainties for the37-bar case is shown in Fig. 9.
The rms error includes the contributions from the followingfactors: 1) camera calibration, 2) shot noise, 3) pixel smoothening,4) laser power variation, 5) laser spatial variation, 6) laser absorptionby OH, 7) absorption coefficient, 8) overlap integral, 9) quench ratevariation, and 10) pixel area accuracy. The uncertainties in thequantitative OH concentration measurements at 10, 27, 37, and53 bar are listed in detail in Table 3.
The uncertainty due to camera calibration of 2.9%, laser shot-to-shot power fluctuation of 11%, laser sheet spatial variation of 5.9%,and pixel area of 2.8% remained the same for all the pressure cases.The uncertainties due to the laser shot-to-shot power fluctuationcould be eliminated by monitoring the laser energy variation duringthe experiments. The uncertainty in shot-to-shot laser sheet spatialvariation in intensity could be eliminated by monitoring the spatialprofile during experiments from a separate calibration.
The shot noise accounted for 6–7% in all the pressure cases. Theaverage number of photons collected in all the pressure cases was inthe 200–225 range. As the pressure increases, the drop in the OHsignal strength is expected due to collisional quenching. However,in the current study, the increase in the pressure was achievedby increasing the injectant mass-flow rate resulting in increasedOH production at higher pressures. Thus, as the pressure increased,the strength of the collected OH signal depended mostly on thecollisional quenching and increased OH production. The uncertaintydue to pixel smoothening used to minimize the contribution of pixelintensity randomness in camera sensor was also 6–7% for all thepressure cases.
The study by Atakan et al. [35] covered spectroscopic measure-ments employing A-X(1,0) transitions in premixed methane flamesfrom 1 to 36 bar, and the excellent agreement between the simulatedandmeasured spectra indicated that the A-X(1,0) transition is devoidof fluorescence trapping and interference from other molecules.
Fig. 8 Mean position of reaction zone determined from the averageOH
number density contours at a) 10, b) 27, c) 37, and d) 53 bar. The flame is
anchored at the lip for all conditions. The flame position is same for all
cases because the O=F velocity and density ratio governing shear layerdevelopment is the same.
Table 3 OH-PLIF uncertainties
Uncertainty source 10 bar,%
27 bar,%
37 bar,%
53 bar,%
Camera calibration 2.9Pixel area accuracy 2.8Laser shot-to-shot powerfluctuation 11
Overlap integral variation withabsorption line shape 1.3 1 0.8 0.5
Overlap integral variation withlaser centerline shift 2.8 1.6 1 0.2
Collisional quench rate variationwith temperature and collidingspecies mole fraction 4.1 3.9 3.8 3.7
Total rms error 21.4 22.8 22.5 22.9
VAIDYANATHAN, GUSTAVSSON, AND SEGAL 871
Dow
nloa
ded
by U
NIV
ER
SIT
Y O
F N
OT
RE
DA
ME
on
Aug
ust 2
5, 2
014
| http
://ar
c.ai
aa.o
rg |
DO
I: 1
0.25
14/1
.390
13
Hence, the effect of fluorescence trapping was considered negligiblehere.
The uncertainty due to the laser absorption byOHwas estimated toincrease from 2 to 4.7% in the 10–53-bar range. From the OH-PLIFimages in Fig. 7, it could be noticed that the effect of laser absorptionis negligible for all the pressure cases; this was confirmed by theuncertainty estimation.
Of all the uncertainties, the variation of the absorption coefficientwith temperature was found the highest: 12–15% in the 10–53-barrange. The uncertainty due to this factor could be reduced if the 2-Dtemperature field is available through measurements or calculations.For flames with wrinkling, corrugation, and large fluctuations, theuse of temperature field data from numerical simulation or areference flame could lead to additional errors, as the instantaneoustemperature field of the actual flame and simulated/reference flamecannot be precisely matched.
The uncertainty due to the variation of overlap integral due to lineshape broadening decreased from 1.3 to 0.5% at the 10–53-barpressure range. Similarly, the uncertainty in the overlap integral dueto the shift in the centerline of the laser decreased from 2.8 to 0.2% inthe 10–53-bar range. The relatively low variations in the overlapintegral is attributed to the use of large laser line width of 5 cm1,thereby obtaining a complete overlap between laser spectral and OHabsorption profile at all pressures, as evident from Fig. 6. Moreover,themean value of the overlap integral was reduced by only 10% from10 to 53 bar in the current study compared to the 30–40% reductionof overlap integral in other studies [36] due to the use of lasers withsmall line widths on the order of 0:5–1 cm1. The uncertainty due tovariation in collisional quenching was nearly 4% in all the pressurecases and is less significant than the absorption coefficient variationof 12–15% with temperature.
The uncertainty contributions from spectroscopic constants anduncertainty in the mathematical model describing the fluorescenceprocess, collisional/Doppler widths and shifts, and quench rate,which are identified as systematic error sources, were assumednegligible in this study. Thus, the total rms uncertainty in the OHnumber density measurements for a GH2=GO2 flame determinedfrom a broad range of uncertainty sources accounted for 21.4, 22.8,22.5, and 22.9% at 10, 27, 37, and 53 bar, respectively.
VII. Conclusions
This study generated a database of inflow, planar OH con-
centration and quantified in detail the uncertainty associated with
these measurements. The oxidant/fuel mass-flow ratio was fixed at
3.77 and chamber pressures varied from 10, 27, 37, to 53 bar. Nine
rovibrational lines at A-X(1,0) transition of OH and excited at
283 nm were employed to obtain OH distribution in the shear
reaction zone near the coaxial injector. The quality of the inflow data
assessment was improved from evaluation of two uncertainty
sources in previous studies to 18 contributing factors. The infor-
mation is valuable for CFD validation as it brackets the reliability of
the experimental database. This study indicated the following:1) The wrinkling, corrugation, and flapping of the flame at higher
pressures of 10–27 bar was noticed and was due to the combined
effects of turbulence as the Reynolds number increased and jet
instability caused by size and dynamics of the recirculation region in
the wake of the oxidizer postlip.2) The errors, which remained the same irrespective of the
experimental conditions, were evaluated; uncertainty due to camera
calibration, laser shot-to-shot power fluctuation, laser sheet spatial
variation, and pixel area accuracy was 2.9, 11, 5.9, and 2.3%,
respectively. The uncertainties due to laser shot-to-shot power
fluctuation and laser sheet spatial variation could be potentially
minimized in future studies.3) The uncertainty due to shot noise and pixel smoothening were
each 6–7% for all the pressures cases.4) The uncertainty due to absorption of laser across the flame by
H2O was negligible and by OH was 2–5% in the 10–50-bar range.5) The uncertainty in absorption coefficient variation with
temperature was 12–15% in the 10–50-bar range and was the
maximum among all the uncertainties. This uncertainty could be
potentially reduced if the temperature field data can be determined
from complementary experiments or computations.6) The uncertainty in overlap integral with temperature variation
was 1.3–0.5% and 2.8–0.2%with laser centerline shift, and themeanvalue of overlap integralwas reduced by 10% in the 10–50-bar range.The use of lasers with larger line widths is recommended for
Background emission - correctedFluorescence trapping -negligible for A-X(1,0)
AbsorptionBoltzmann factor (temperature)
Absorption coefficient (spectroscopy)
Line ShapeOverlap integral (line shape)
Overlap integral (laser centerline shift)
Model (collisional & Doppler width/shift)
Fluorescence Efficiency
Quench rate (collider species cross section/ mole fraction, pressure, temperature )
Model for quantum yield
Shot-to-shot power fluctuation - 11%
Laser sheet spatial variation- 5.9%
Laser absorption (OH) – 3.8%
Laser absorption(H2O) - negligible
Volume
Pixel area – 2.8%
)OH
9
1221 1
221 21
Np
BAE
VA c
o
laser abs
Bf
d
n
ν
=
Ω
+
∑∫ η
14.5%
Total uncertainties (rms error) = 22.5 %
Fig. 9 OH-PLIFmeasurement uncertainties at 37 bar. The rms error includes the contributions from 1) shot noise, 2) pixel smoothening, 3) laser power
variation, 4) laser spatial variation, 5) laser absorption by OH, 6) absorption coefficient, 7) overlap integral, 8) quench rate variation, and 9) pixel area
accuracy and accounted for total rms error of 22.5%.
872 VAIDYANATHAN, GUSTAVSSON, AND SEGAL
Dow
nloa
ded
by U
NIV
ER
SIT
Y O
F N
OT
RE
DA
ME
on
Aug
ust 2
5, 2
014
| http
://ar
c.ai
aa.o
rg |
DO
I: 1
0.25
14/1
.390
13
OH-PLIF measurements at high pressures for minimizing theuncertainty due to overlap integral.
7) The uncertainty in collisional quench rate variation withtemperature and colliding species mole fraction was nearly 4% at allpressures and is less significant compared to the 12–15% variation ofabsorption coefficient with temperature.
8) The uncertainty in the spectroscopic constants, mathematicalmodel used to describe fluorescence process, collisional andDopplerwidths, and collisional quenching are assumed negligible.
9) The total rms uncertainty contributions in OH number densityanalyzed and determined from 18 sources at 10, 27, 37, and 53 barwas 21.9, 22.8, 22.5, and 22.9%, respectively. To reduce theuncertainty to nearly 11% from the current 23%, potential areas forfuture improvements include elimination of the uncertainties due tolaser power and spatial variation, and absorption coefficient variationwith temperature.
Acknowledgments
This work has been performed with the support from the NASAConstellation University Institute Project. We thank Claudia Meyer,Program Manager. The authors would like to acknowledge thecontinuous support offered by K. Tucker (NASA Marshall SpaceFlight Center) and J. Hulka (Jacobs Sverdrup).
References
[1] Tucker, K., West, J., Williams, R., Lin, J., Rocker, M., Canabal, F.,Robles, B., and Garcia, R., “Using CFD as a Rocket Injector DesignTool: Recent Progress at Marshall Space Flight Center,” NASATR 20030112990, Oct. 2003.
[2] Seitzman, J. M., Ungut, A., Paul, P. H., and Hanson, R. K., “Imagingand Characterization of OH Structures in a Turbulent Non-PremixedFlame,” Proceedings of the Combustion Institute, Vol. 23, 1990,pp. 637–644.
[3] Theron, M., and Bellenoue, M., “Experimental Investigation of theEffects of Heat Release on Mixing Processes and Flow Structure in aHigh Speed Subsonic Turbulent H2 Jet,” Combustion and Flame,Vol. 145, No. 4, 2006, pp. 688–702.doi:10.1016/j.combustflame.2006.01.012
[4] Singla, G., Scouflaire, P.,Rolon, C., and Candel, S., “Planar Laser-InducedFluorescence ofOH inHighPressureCryogenicLOX=GH2 JetFlames,” Combustion and Flame, Vol. 144, Nos. 1–2, 2006, pp. 151–169.doi:10.1016/j.combustflame.2005.06.015
[5] Foust, M. J., Deshpande,M., Pal, S., Ni, T., Merkle, C. L., and Santoro,R. J., “Experimental andAnalytical Characterization of a Sheer CoaxialCombusting GO2/GH2 Flowfield,” AIAA Paper 96-0646, Jan. 1996.
[6] Foust, M. J., Pal, S., and Santoro, R. J., “Gaseous Propellant RocketStudies Using Raman Spectroscopy,”AIAAPaper 96-2766, July 1996.
[7] Brummund, U., Cassou, A., and Vogel, A., “PLIF ImagingMeasurements of a Coaxial Rocket Injector Spray at ElevatedPressure,” Proceedings of the Combustion Institute, Vol. 26, 1996,pp. 1687–1695.
[8] Mayer, W., and Tamura, H., “Propellant Injection in a Liquid Oxygen/Gaseous Hydrogen Rocket Engine,” Journal of Propulsion and Power,Vol. 12, No. 6, 1996, pp. 1137–1147.doi:10.2514/3.24154
[9] Yerlan, S., Pal, S., and Santora, R. J., “Major Species and TemperatureProfiles of LOX/GH2 Combustion,” AIAA Paper 97-2974, July 1997.
[10] Wehrmeyer, J. A., Cramer, J. M., Eskridge, R. H., and Dobson, C. C.,“UV Diagnostics for Rocket Engine Injector Development,” AIAAPaper 97-2843, July 1997.
[11] Herding, G., Snyder, R., Rolon, C., and Candel, S., “Investigation ofCryogenic Propellant Flames Using Computerized Tomography ofEmission Images,” Journal of Propulsion and Power, Vol. 14, No. 2,1998, pp. 146–151.doi:10.2514/2.5279
[12] Candel, S., Herding, G., Synder, R., Scouflaire, P., Rolon, C., Vingert,L., Habiballah, M., Grisch, F., Pealat, M., Bouchardy, P., Stepowski,D., Cessou, A., and Colin, P., “Experimental Investigation of ShearCoaxial Cryogenic Jet Flames,” Journal of Propulsion and Power,Vol. 14, No. 5, 1998, pp. 826–834.doi:10.2514/2.5346
[13] Ivancic, B.,Mayer,W.,Krulle, G., andBruggemann,D., “Experimentaland Numerical Investigation of Time and Length Scales in LOX=GH2-
Rocket Combustors,” AIAA Paper 99-2211, June 1999.[14] Juniper, M., Tripathi, A., Scouflaire, P., Rolon, J.-C., and Candel, S.,
“Structure of Cryogenic Flames at Elevated Pressures,” Proceedings ofthe Combustion Institute, Vol. 28, 2000, pp. 1103–1109.
[15] Mayer,W., Schik, A., and Schaffler, M., “Injection andMixing Processin High Pressure Liquid Oxygen/Gaseous Hydrogen RocketCombustors,” Journal of Propulsion and Power, Vol. 16, No. 5,2000, pp. 823–828.doi:10.2514/2.5647
[16] Kalitan, D. M., Salgues, D., Mouis, A. G., Lee, S. Y., Pal, S., andSantoro, R. J., “Experimental Liquid Rocket Swirl Coaxial InjectorStudy Using Non-Intrusive Optical Techniques,” AIAA Paper 2005-4299, June 2005.
[17] Singla, G., Scouflaire, P., Rolon, C., and Candel, S., “TranscriticalOxygen/Transcritical or SupercriticalMethane Combustion,”Proceed-ings of the Combustion Institute, Vol. 30, 2005, pp. 2921–2928.
[18] Singla, G., Scouflaire, P., Rolon, J. C., Candel, S., and Vingert, L., “OHPlanar Laser-Induced Fluorescence and Emission Imaging in High-Pressure LOX/Methane Flames,” Journal of Propulsion and Power,Vol. 23, No. 3, 2007, pp. 593–602.doi:10.2514/1.24895
[19] Smith, J. J., Schneider, G., Suslov, D., Oschwald, M., and Haidn, O.,“Steady-State High Pressure LOX=H2 Rocket Engine Combustion,”Aerospace Science and Technology, Vol. 11, No. 1, 2007, pp. 39–47.doi:10.1016/j.ast.2006.08.007
[20] Lux, J., and Haiden, O., “Flame Stabilization in High Pressure LiquidOxygen (LOX)/Methane Rocket Engine Combustion,” Journal of
Propulsion and Power, Vol. 25, No. 1, 2009, pp. 24–32.doi:10.2514/1.37308
[21] Lux, J., andHaidn, O., “Effect of recess in high pressure LiquidOxygen(LOX)/Methane coaxial injection and combustion,” Journal of
Propulsion and Power, Vol. 25, No. 1, 2009, pp. 15–23.doi:10.2514/1.36852
[22] Hanson, R. K., “Combustion Diagnostics: Planar Imaging Techni-ques,” Proceedings of the Combustion Institute, Vol. 21, 1986,pp. 1677–1691.
[23] Schefer, R. W., Namazian, M., and Kelly, J., “CH, OH and CH4Concentration Measurements in a Lifted Turbulent-Jet Flame,”Proceedings of the Combustion Institute, Vol. 23, 1990, pp. 669–676.
[24] Battles, B. E., and Hanson, R. K., “Laser-Induced FluorescenceMeasurements of No and OH Mole Fraction in Fuel-Lean, High-Pressure (1–10 atm) Methane Flames: Fluorescence Modeling andExperimental Validation,” Journal of Quantitative Spectroscopy and
Radiative Transfer, Vol. 54, No. 3, 1995, pp. 521–537.doi:10.1016/0022-4073(95)00020-L
[25] Arnold, A., Bombach, R., Kappeli, B., and Schlegel, A., “QuantitativeMeasurements ofOHConcentration Fields by TwoDimensional Laser-Induced Fluorescence,” Applied Physics B, Vol. 64, No. 5, 1997,pp. 579–583.doi:10.1007/s003400050218
[26] Eckbreth, A. C., Laser Diagnostics for Combustion Temperature and
Species, 2nd ed., Vol. 3, Gordon and Breach, New York, 1996.[27] Daily, J. W., “Laser Induced Fluorescence Spectroscopy in Flames,”
Progress in Energy and Combustion Science, Vol. 23, No. 2, 1997,pp. 133–199.doi:10.1016/S0360-1285(97)00008-7
[28] Luque, J., and Crosley, D., “LIFBASE : Database and SpectralSimulation Program, Technical Report,” SRI International Rept. MP99-009, Ver. 2.055, 1999.
[29] Davidson, D., Roehrig, M., Peterson, E., Di Rosa, and Hanson, R.,“Measurements of the OH A-X (0,0) 306 nm Absorption Bandhead at60 atm and 1735 K,” Journal of Quantitative Spectroscopy and
Radiative Transfer, Vol. 55, No. 6, 1996, pp. 755–762.doi:10.1016/0022-4073(96)00024-6
[30] Paul, P. H., “A Model for Temperature-Dependent CollisionalQuenching of OH A2,” Journal of Quantitative Spectroscopy andRadiative Transfer, Vol. 51, No. 3, 1994, pp. 511–524.doi:10.1016/0022-4073(94)90150-3
[31] Conley, A., Vaidyanathan, A., and Segal, C., “Heat FluxesMeasurements in a GO2/GH2 Single-Element, Shear Injector,”Journal of Spacecraft and Rockets, Vol. 44, No. 3, 2007, pp. 633–639.doi:10.2514/1.26678
[32] Meyer, T. R., Roy, S., Belovich, V. M., Corporan, E., and Gord, J. R.,“Simultaneous Planar Laser-Induced Fluorescence, OH Planar Laser-Induced Fluorescence and Droplet Mie Scattering in Swirl-StabilizedSpray Flames,” Applied Optics, Vol. 44, No. 3, 2005, pp. 445–454.doi:10.1364/AO.44.000445
[33] Reynolds, W. C., STANJAN: a Reaction Chemistry Computer
[34] Juniper, M., and Candel, S., “Edge Diffusion Flame StabilizationBehind a Step over a Liquid Reactant,” Journal of Propulsion and
Power, Vol. 19, No. 3, 2003, pp. 332–342.doi:10.2514/2.6134
[35] Atakan, B., Heinze, J., and Meier, U. E., “OH Laser-InducedFluorescence at High Pressures: Spectroscopic and Two-DimensionalMeasurements Exciting the A-X(1, 0) Transition,” Applied Physics B,Vol. 64, No. 5, 1997, pp. 585–591.
doi:10.1007/s003400050219[36] Seitzman, J. M. and Hanson, R. K., “Comparison of Excitation
Techniques for Quantitative Fluorescence Imaging of Reacting Flow,”AIAA Journal, Vol. 31, No. 3, 1993, pp. 513–519.doi:10.2514/3.11359