Page 1
Louisiana State UniversityLSU Digital Commons
LSU Master's Theses Graduate School
2012
Oyster reef restoration in the northern Gulf ofMexico: effect of substrate and age on ecosystemservicesLaura Alicia BrownLouisiana State University and Agricultural and Mechanical College, [email protected]
Follow this and additional works at: https://digitalcommons.lsu.edu/gradschool_theses
This Thesis is brought to you for free and open access by the Graduate School at LSU Digital Commons. It has been accepted for inclusion in LSUMaster's Theses by an authorized graduate school editor of LSU Digital Commons. For more information, please contact [email protected] .
Recommended CitationBrown, Laura Alicia, "Oyster reef restoration in the northern Gulf of Mexico: effect of substrate and age on ecosystem services"(2012). LSU Master's Theses. 3449.https://digitalcommons.lsu.edu/gradschool_theses/3449
Page 2
OYSTER REEF RESTORATION IN THE NORTHERN GULF OF MEXICO: EFFECT OF
SUBSTRATE AND AGE ON ECOSYSTEM SERVICES
A Thesis
Submitted to the Graduate Faculty of the
Louisiana State University and
Agricultural and Mechanical College
in partial fulfillment of the
requirements for the degree of
Master of Science
in
The Department of Biological Sciences
by
Laura Alicia Brown
B.A. University of North Carolina at Chapel Hill, 2010
August 2012
Page 3
ii
ACKNOWLEDGEMENTS
Funding for this study was provided by The Nature Conservancy of Louisiana, the United
States Geological Survey through the Louisiana Fish and Wildlife Cooperative Research Unit,
the Louisiana Department of Wildlife and Fisheries (LDWF) and Louisiana State University
Biograds. Also, this project enlisted the much appreciated facilities and services of the National
Wetlands Research Center, Stennis Space Center USGS, Cameron Prairie National Wildlife
Refuge, and LDWF Grand Isle Marine Lab.
Huge thanks goes to my major advisor, Dr. Kenneth M. Brown for all of his help in my
graduate school process, including but not limited to field help, writing process and overall
amazing support. Thanks so much to Dr. Megan K. La Peyre for opening the doors of her lab and
providing me with a project, boats, trucks, as well as great advice throughout my time at LSU.
Thanks also to Dr. Richard Stevens and Dr. James Geaghan for helpful comments on statistics
and the overall project throughout my thesis. This project could not have been done without the
army of help employed in sorting, sampling, constructing and identifying. This army consists of
Lindsay Schwarting, Shea Miller, Ben Eberline, Dr. Wesley Daniel, Aaron Honig, Dr. Jerome La
Peyre, Bran Wagner, Nathan Yeldell, Cynthia Hodnett, Marc Blouin, “Pops”, Andy Buehler,
Zach Goodnow, Mitchell Bogran and big thanks to Cheryl Duplechain. Additionally, thanks to
Natalie Engler for being such a great lab tech and getting things done in such an efficient
manner. Thanks so much to Jessica Furlong, whose help was invaluable... my time in the truck
and boat (all 1000 hours) will never be forgotten!
Thanks to Queso for being so understanding in my multiple departures throughout field
seasons, and for the happy tail wags when I returned. Thanks to every single person who
watched Queso while I was in the field, Joanna Borr, Justin Leonhardt, Lindsay Schwarting,
Page 4
iii
Jenessa Kay, Maria Gavilanez, Whitney Pilcher, and Clare Brown. Huge thanks to all of my
friends who have helped support me through needed distractions, many who have been
mentioned above, but also Rianna Mallard, Alison Hennessey, Erin Leonhardt and Maria Sagot.
Finally, special thanks go out to my entire family, especially my father (David Brown)
and sister (Stephanie Brown), who all support and love me no matter what. I have been so
fortunate to have a close-knit family full of strong, smart, opinionated and amazing women who
have been remarkable role models my entire life, which I truly appreciate. So thanks to my
family, as well as Dr. Timothy Otten, for being supportive, loving, and encouraging throughout
my time at Louisiana State University.
Page 5
iv
TABLE OF CONTENTS
ACKNOWLEDGEMENTS.............................................................................................................ii
LIST OF TABLES..........................................................................................................................v
LIST OF FIGURES.......................................................................................................................vi
ABSTRACT..................................................................................................................................vii
INTRODUCTION...........................................................................................................................1
METHODS......................................................................................................................................7
Field Site Selection...................................................................................................................7
Adult Blue Crab Abundance.....................................................................................................8
Commensal Community Assemblages.....................................................................................9
Settlement.................................................................................................................................9
Oyster Density........................................................................................................................10
Statistical Tests.......................................................................................................................10
Crab Refuge Experiment.........................................................................................................12
RESULTS......................................................................................................................................15
Adult Blue Crab Abundance...................................................................................................15
Commensal Community Assemblages...................................................................................15
Settlement...............................................................................................................................18
Crab Refuge Experiment........................................................................................................21
DISCUSSION................................................................................................................................29
LITERATURE CITED..................................................................................................................38
VITA..............................................................................................................................................45
Page 6
v
LIST OF TABLES
Table 1. Water quality data from reef categories sampled from April 2011 through November
2011................................................................................................................................................12
Table 2. Size and location of commensal organisms found on reef categories.............................22
Page 7
vi
LIST OF FIGURES
Figure 1. Map of artificial oyster reefs created across the northern Gulf of Mexico......................8
Figure 2. Map of 20 artificial oyster reefs selected for sampling across the northern Gulf of
Mexico...........................................................................................................................................11
Figure 3. Diagram of tank used in refuge preference experiment.................................................13
Figure 4. Histogram of mean log commensal abundances across different reef categories in May
and July..........................................................................................................................................16
Figure 5. Histogram of mean Shannon’s Diversity Index of commensal organisms in May across
different reef categories.................................................................................................................18
Figure 6. Class means of functional groups of commensal organisms across different reef
categories on a discriminant function............................................................................................19
Figure 7. Histogram of mean oyster spat densities across different reef categories......................20
Figure 8. Histogram of mean oyster spat densities across salinity intervals.................................21
Figure 9. Histogram of mean oyster spat sizes across salinity intervals........................................26
Figure 10. Histogram of mean oyster spat size across different reef categories............................26
Figure 11. Histogram of mean barnacle densities across different reef categories.......................27
Figure 12. Mean position of juvenile blue crab with and without adult blue crabs.......................28
Page 8
vii
ABSTRACT
Oyster reefs provide estuaries with ecosystem services including carbon sequestration,
shoreline stabilization, refugia for invertebrate biodiversity, and fisheries enhancement, but have
been disappearing over the past century due to increasing overharvesting, disease, and
eutrophication. The northern Gulf of Mexico has over 400 artificial oyster reefs constructed of
various materials created through efforts to restore ecosystem services lost with declining oyster
populations. The purpose of this study was to determine how two common artificial reef
construction materials (rock vs. oyster shell) at various ages affect ecosystem services,
specifically blue crab abundance, the commensal community, and oyster recruitment, as well as
to determine the refuge value of oyster reefs. To determine whether the provision of ecosystem
services varied over time, rock (n = 7) and oyster shell (n = 6) reefs of varying ages (new < 5
years since construction; old > 5 years since construction) were compared to natural oyster reefs
(n = 7) and were sampled twice in the summer of 2011. Sampling devices included baited crab
traps, spat settlement plates and commensal collectors. Results indicate no difference between
reef category (reef by age) and blue crab abundances, most likely due to their mobility.
Diversity, abundance and richness of the commensal community are lowest on old shell reefs.
Old rock reefs were most similar to natural reefs in regards to commensal community
assemblages, even surpassing them in commensal abundance seasonally. Spat densities and size
varied across reef categories, and were more closely correlated with salinity than reef category.
To determine refuge value of oyster structure, a mesocosm with a depth gradient and different
oyster reef complexities in the deepest end was used. When high complexity shell areas were
provided, juvenile crabs were more likely to use these deep water reef refugia when a predator
was introduced to the tank; when no shell areas were available, juvenile crabs selected shallow
Page 9
viii
water refuge. The refuge value of oyster reefs, based both on the field survey and laboratory
experiment, seems to be the driver of higher commensal abundances, richness, and diversity on
older rock reefs, which last longer than old shell reefs which seem to disperse over time in
sediments.
Page 10
1
INTRODUCTION
Reefs of the Eastern Oyster (Crassostrea virginica) found along the Gulf of Mexico offer
numerous ecosystem services that benefit surrounding environments as well as humans. Oyster
industries help support the northern Gulf of Mexico’s economy, bringing in millions of dollars a
year (Louisiana Department of Wildlife and Fisheries, LDWF 2004). The states along the Gulf of
Mexico produce nearly two-thirds of the country’s oyster harvest by volume, and over one-half
by value, and have been the dominant oyster production area in the U.S. since the mid-1980’s
(LDWF 2004). Oysters filter water, assimilating organic matter, and at their peak filtered the
volume of the Chesapeake Bay in 3.3 days (Dame et al., 1984, Newell 1988). Oysters remove
nutrients that have been anthropogenically concentrated in bays and estuaries by agriculture and
storm water run-off, lessening eutrophication (Cerco and Noel 2007). Oysters also filter
sediments out of the water, increasing water clarity and helping sunlight reach submerged
aquatic vegetation (SAV), aiding the role of SAV as nurseries for the juvenile blue crab,
Callinectes sapidus (Perkins-Visser et al., 1996). Oysters are also capable of reducing
phytoplankton biomass that has increased due to anthropogenic nutrient input (Newell et al.,
2007). Carbon sequestration in oyster biomass is another ecosystem service of oyster reefs
(Hargis et al., 1999). Since oysters secrete a calcium carbonate shell, they act as a carbon sink
(Peterson and Lipcius 2003) and aid in reducing carbon in the atmosphere, as current levels of
carbon dioxide are increase at a rate of 1.9 parts per million a year (Easterling and Karl 2008).
Oysters have also been shown to aid in de-nitrification, removing nitrogen from coastal systems
by transforming it into either N2 or N2O2 and releasing it into the atmosphere (Piehler and Smyth
2011).
Page 11
2
Oysters aggregate together forming reefs, which in turn provide more ecosystem services.
The reefs, when intertidal, act as a “living shoreline” for marshes. With the global mean sea level
rising at a rate of 1.7 mm per year (Easterling and Karl 2008), as well as a 50% reduction of
wetlands in America (Dahl 2006), oyster reefs parallel to the shore can reduce erosion on
marshes from waves and boat wakes (Piazza et al., 2005, Scyphers et al., 2011). Protecting
marshes is crucial to maintaining production of important fisheries such as shrimps and blue
crabs (Zimmerman et al., 2002), as the marsh offers refuge as well its own ecosystem services.
The vertical structure created by oysters allows smaller commensal organisms, such as the
xanthid or mud crab family, to find refuge from predation (McDonald 1982). Oyster reefs are
comparable to coral reefs in structural complexity (Harding and Mann 1999), and as oyster reef
complexity increases, predator-prey interactions are altered (Grabowski 2004, Grabowski et al.,
2005). Oyster reefs thus create vertical relief on muddy bottoms as well as a basal food resource
for larger predators, such as black drum, blue crabs, stone crabs, and sheepshead (Lenihan et al.,
2001, George et al., 2008 and O’Connor et al., 2008). By providing food as well as habitat,
oyster reefs thus increase total numbers of sand seatrout, atlantic croaker, catfish, flounder, red
drum, black drum, and blue crabs (Scyphers et al., 2011). Oyster reefs also support more
biodiversity than mud flats surrounding them (Summerson and Peterson 1984, Posey et al., 1999,
Coen and Luckenbach 2000, Plunket and La Peyre 2005, Tolley and Volety 2005, Grabowski et
al., 2005, Schyphers et al., 2011).
Oyster populations have declined 85% from historical abundance worldwide (Beck et al.,
2011), with more than 90% of oyster population declines resulting from anthropogenic factors
(Lotze et al., 2006), indicating oysters and the ecosystem services they provide are at risk. Oyster
reefs have deteriorated in many areas over the past century due to overharvesting and increased
Page 12
3
eutrophication (Jackson et al., 2001, Kemp et al., 2005). More development along the coast
leads to increased sediment loads, nutrient loads, primary productivity and hypoxic/anoxic
conditions, which together have led to a sharp decline in oysters over time (Jackson et al., 2001,
Lotze et al., 2006). In the Chesapeake Bay area alone populations have declined over 50 fold due
to destructive harvesting procedures such as trawling and dredging (Rothschild et al., 1994).
Trawling not only affects oysters by overharvesting, but also destroys the vertical complexity of
oyster reefs, reducing refuge and habitat, as well as reducing recruitment (Baker and Mann 1991,
Lenihan and Peterson 2004). Diseases such as Dermo and multinucleated sphere unknown
(MSX) can also cause significant mortality at higher salinities (Rothschild et al., 1994, Melancon
et al., 1998). The combination of disease, eutrophication, and overharvesting has thus, over a
short period of time, greatly depleted oyster populations along the Atlantic coast of the United
States.
Oyster reefs along the northern Gulf of Mexico are in fair condition, with only 50% to
89% of oyster reefs lost, compared to the Atlantic coast of North America, where reefs are
considered in poor condition or functionally extinct (e.g. 90% to 100% loss, Beck et al., 2011).
This is in part due to oyster fisheries along the Gulf of Mexico not reaching peak landings until
the 1950’s, while peaks in the New York area were in the1830’s, and in southern states were in
the early 1900’s (Kirby 2004). This delay in overexploitation along the Gulf coast benefitted
from lessons learned in Chesapeake and Long Island Sound (Rothschild et al., 1994, Kirby
2004). The fair condition of Gulf oyster populations can also partly be attributed to the Gulf’s
management of the fishery. For example, in Louisiana, Louisiana Department of Wildlife and
Fisheries (LDWF) requires that oystermen harvest off an oyster lease, instead of buying a permit.
This reduces the “tragedy of the commons”, where everyone ultimately overharvests. The LDWF
Page 13
4
works to license harvesters, oversee leases, seed public grounds, and continuously monitor water
quality and environmental conditions (LDWF 2004), even controlling salinities in order to yield
optimal production (La Peyre et al., 2009). The bays and bayous that contribute to the coastline
of the northern Gulf of Mexico provide more area at optimal salinities (5-15 PSU) for oysters to
grow with reduced rates of predation and disease (Melancon et al., 1998).
Although northern Gulf of Mexico oyster populations are in fair condition, lessons
learned from the Atlantic coast, as well as threats from the 2010 Deepwater Horizon oil spill,
disease, and hurricanes (Rothschild et al., 1994, Livingston et al., 1999, McCrea-Strub et al.,
2011) all suggest that oyster populations along the Gulf of Mexico are in a delicate situation,
warranting restoration efforts. Shellfish restoration, which includes creating artificial oyster
reefs, has become a popular method to increase reef habitat (Lipcius and Burke, 2006) as well as
restore ecological services (Grabowski and Peterson 2007). The restoration of oyster reefs has
become a best management practice (BMP) for states along the Gulf of Mexico, as well as the
eastern Atlantic coast. However, methods used to restore reefs can contribute to how well they
succeed. Since the reef is not only habitat, but also a prey source for numerous predators (Brown
and Richardson 1987, Eggleston 1990, Brown and Haight 1992, George et al., 2008), the health
of a reef can impact the nekton and commensal community around it, although an easily
determined index of reef health is difficult to develop (Coen and Luckenbach 2000). One good
indicator of reef health is the number of oyster spat that settle on the reef, which affects the
commensal community, as many organisms also consume juvenile oysters (Eggleston 1990,
Grabowski 2004). Restoration efforts began as an effort to restore oyster populations, but
recently the goal has shifted to restoring lost ecosystem services (Coen and Luckenbach 2000,
Peterson et al., 2003, Luckenbach et al., 2005, Grabowski and Peterson 2007). In the northern
Page 14
5
Gulf of Mexico alone, over 400 artificial oyster reefs have been constructed (Furlong 2012).
State, federal, and private organizations, including The Nature Conservancy, the LDWF and the
U.S. Army Corps of Engineers, have created reefs to promote habitat restoration, shoreline
protection, and fisheries enhancement.
Reefs can be placed intertidally and parallel to shoreline, or subtidally and offshore, and a
number of variables can affect the success of restored or artificial reefs. Factors such as salinity,
height, and dissolved oxygen can all have significant effects on the survival of oyster reefs along
the coast (Lenihan 1999), and could also indirectly affect the commensal community. Other
factors are less studied, such as construction methods and materials used to restore the reef. Two
common methods for artificial reef creation along the coast of the Gulf of Mexico are rock and
recycled oyster shell (Coen and Luckenbach 2000, Luckenbach et al., 2005, Piazza et al., 2005,
Powers et al., 2009). Little is known about how construction methods affect commensal and crab
communities surrounding reefs. Rock reefs can be created out of limestone, marl, or concrete,
and constructed in mounds, or hollow spheres, and range in size from cobble to large slabs. Shell
reefs are often whole oyster shells returned to the water through recovery programs (LDWF
2004). Shells can be distributed across existing oyster reefs, or placed on bare substrate.
Regardless of the material used, oyster spat are expected to recruit to the reef and help stabilize
the restoration effort. While oysters are gregarious organisms preferring to settle with other
oysters (Hidu 1969), results are mixed regarding whether shell or rock provide the best surface
for recruitment. Crisp (1967) found that organic bio-films on an oyster shell promoted
recruitment, compared to oyster shells with the bio-films removed, while the LDWF (2004)
instead found greater recruitment to rock reefs than shell reefs. Few studies have been explicitly
designed to determine the differences between shell versus rock as materials for artificial reefs
Page 15
6
(LDWF 2004), or how differing materials affect ecosystem services. Although some researchers
have looked specifically at how their constructed reefs have fared (Lenihan 1999, Meyer and
Townsend 2000, Grabowski et al., 2005, Luckenbach et al., 2005, Piazza et al., 2005, Gregalis et
al., 2009), a detailed study examining how artificial reefs develop their ecosystem services over
time is still much needed.
The purpose of my study is therefore to determine how artificial oyster reef construction
material affects ecosystem services, and how those services change over time. In particular, I am
interested in the effect that reef construction material and age have on commensal and crab
communities surrounding reefs. I am particularly interested in habitat for commercially
important blue crabs (Callinectes sapidus), and refuge value for commensal invertebrates and
juvenile fish on the reef, which provide food for higher trophic levels (Grabowski 2004, Tolley
and Volety 2005, Grabowski and Peterson 2007). My null hypothesis is that construction
material and age of reefs will have no effect on surrounding commensal and crab communities. I
am also interested in the effect of age and construction material on recruitment to the reef of
oyster spat and barnacles, since higher juvenile recruitment sustains reefs (O’Beirn et al., 2000).
My null hypothesis is that there will be no difference between age and construction material in
promoting oyster spat colonization. To determine these effects of age and construction material
on commensals, blue crabs, and oyster spat densities, a field study was conducted along the
northern Gulf of Mexico. Finally, to determine the refuge value of oyster reefs for commensals
like juvenile blue crabs, I also performed a mesocosm experiment in the laboratory.
Page 16
7
METHODS
Field Site Selection
To determine how artificial oyster reef construction materials affect ecosystem services
over time, a list of reefs created along the northern Gulf of Mexico for conservation and
restoration purposes was compiled, along with the material, date, and location of their creation
(Figure 1). Of over 400 artificial oyster reefs constructed, twenty reefs were chosen, spanning the
northern Gulf of Mexico, from Copano Bay, Texas, to Apalachicola Bay, Florida (Figure 2). The
independent variables were reef construction material (rock, shell, natural) and date of
construction, from 1991-2009. Reefs included those constructed from rock materials (n = 7),
oyster shell (n = 6), and natural oyster reefs as controls (n = 7). Oyster shell reefs were
constructed by spreading oyster shells over an area, to provide a substrate for spat recruitment,
and the second method involved rock substrates from small cobbles to larger concrete fragments
spread over an area. Reefs were also divided into two age categories, reefs built before 2006,
and after 2006. The final reef categories (reef material by age group) were thus old rock reefs (n
= 6), new rock reefs (n = 2), old shell reefs (n = 2), new shell reefs (n = 3), and natural, control
reefs (n = 7). I selected reefs that were not fringing reefs parallel to shorelines, but subtidal, with
an average depth of 2.11 ± 0.60 meters. Reefs were also chosen with the understanding that they
were not harvested for oysters, but created for conservation purposes only.
To compare commensal organisms on reefs to organisms on mudflats adjacent to the reef,
I used two paired sampling sites: on-reef and adjacent to the reef. The first was on a reef, and the
adjacent site was selected by using a PVC pole to determine where the reef ended and muddy
substrata began, then after five consistent soundings with non-reef substrate, the boat was driven
Page 17
8
at 1000 rpm for 10 seconds in the same direction as the five soundings. After those ten seconds,
the substrate below was again checked for muddy bottom substrate, and if it was muddy bottom,
this site was selected as the adjacent to reef site. All reefs were sampled in May and July 2011.
At each site and date, salinity (PSU), dissolved oxygen (mg/L), and temperature (oC) were
measured with an YSI 85 meter, as well as secchi depth (cm) (Table 1).
Figure 1. A map created by The Nature Conservancy of the oyster reef restoration efforts along
the northern Gulf of Mexico, as well as the material reefs were created from.
Adult Blue Crab Abundance
To determine adult blue crab abundances at each site, two baited commercial crab traps
were set per site (one on the reef and one adjacent to the reef). Traps were baited with chicken
Page 18
9
legs and set out overnight. I recorded catch per unit effort (CPUE), which is total count of blue
crabs per trap, and measured carapace widths (cm) and sex of the blue crabs.
Commensal Community Assemblages
To sample the commensal community, 0.3 m x 0.3 m bags constructed from 2 cm Vexar mesh
were filled with clean, unbleached oyster shell, and attached to a cinderblock anchor.
Commensal organisms recruit to the oyster shell within the bags (Stuck and Perry 1992). At each
site, three bags were attached to a cinderblock with a rope and buoy. One cinderblock with three
bags was placed on and adjacent to each reef and the bags were retrieved after one month. Bags
were carefully lifted out of the water and collected in a tub so that loose invertebrates would also
be collected. Organisms were kept on ice until they were returned to the LSU laboratory, where
bags were opened, oyster shells washed over a 1mm mesh sieve, and all organisms placed in
80% ethanol. Organisms were identified to species in most cases (Hopkins and Valentine 1989).
For each site, species richness, total commensal abundance, and Shannon’s Index of diversity
(Spellerburg and Fedor 2003) were calculated. Commensal organisms were also divided into
several functional groups, with total number of individual filter feeders, grazers, meso-predators
and omnivores noted. Filter feeders were classified as any organism filtering water, grazers as
consuming algae and detritus, meso-predators as oyster predators, and omnivores as consuming
detrital matter and other organisms.
Settlement
Settlement of fouling organisms was quantified on a 15 cm x 15 cm clay tile caulked to
the cinder block anchors, and enumerated taxa included oyster spat and barnacles (Banks and
Brown 2002). The tile was attached with the rougher, unglazed side facing outwards. Settlement
Page 19
10
plates were deployed for two one-month long sampling periods on and adjacent to the reef, and
kept on ice or in a cold room until counted. Densities of oyster spat and barnacles per rough side
of the plate were quantified, and the sizes of individual spat were measured.
Oyster Density
Oyster densities were sampled at each of the sites by SCUBA divers in October of 2011.
Five 0.25 m2 quadrats were haphazardly thrown out at each site. Two divers collected samples
by removing the top 10 cm of the reef using hands, hand tongs, and chisels. All loose material
was placed in labeled buckets, kept on ice, and then brought to LSU laboratories. Material was
sorted by live oyster, dead oyster, crushed shell, and rock, determining the total volume of each
category at each of the sites. Oyster densities were used as a covariate in initial analyses, but
were not significant in all cases.
Statistical tests
Dependent variables for adult blue crabs were CPUE, sex ratios, and size. Dependent
variables for the commensal community were total commensal abundance, commensal species
richness, commensal Shannon’s diversity, and functional group abundances. Finally, for
settlement plates, spat densities, spat size, and barnacle densities were dependent variables.
In order to determining whether or not to pool samples from on and adjacent to the reef, a
t-test was used with dependent variables of sex ratios, crab size, commensal abundances, species
richness, Shannon’s diversity, and barnacle densities. For CPUE and spat densities, a Mann-
Whitney test was used due to a lack of normality. Over all dependent variables, there was no
significant difference between on the reef and adjacent to the reef, therefore all samples were
pooled.
Page 20
11
Figure 2. A map of 20 oyster reef sites along the northern Gulf of Mexico, with 7 natural reefs, 7
rock reefs, and 6 shell reefs evenly spread along the coast and sampled twice in the summer of
2011.
A two-way ANCOVA was used with reef category (each substrate/age group and season)
as the categorical variables and salinity (if significant) as the covariate with all the above
dependent variables. Other variables (dissolved oxygen, secchi depth, and oyster density) were
initially used as covariates but did not have significant effects on dependent variables. If season
was not a significant treatment, seasons were pooled, and only the reef category variable was
looked at, though if seasons were a significant treatment, they were separated and two one-way
ANCOVA was used. Significant differences among categories were analyzed in PROC
GLIMMIX in SAS 9.2, with a binomial, negative binomial, Poisson or normal distribution
Page 21
12
determined by the lowest AIC score. Differences between reef categories and seasons (when
significant) were tested using Tukey’s a posteriori tests. Finally, a discriminant analysis was
used as a holistic way to determine if the composition of the commensal community (e.g.
functional groups, including filter feeders, omnivores, meso-predators, and grazers) differed
among reef substrate and age categories. All of the statistical tests were completed with SAS 9.2.
Table 1. Water quality data, including means (+ SE), and ranges for salinity (PSU), dissolved
oxygen (%), temperature (oC), and Secchi depth (cm) for all treatments during sampling trips
April 2011 through November 2011.
Category
Salinity
Mean
(PSU)
Salinity
Range
(PSU)
DO
Mean
(mg/L)
DO
Range
(mg/L)
Temperature
Mean (oC)
Secchi
Depth
Mean
(cm)
Secchi
Depth
Range
(cm)
Control 17.7±1.0 0.6-31.2 6.5±0.1 4.6-9.0 28.9±0.4 50±3 1-117
Old Rock 17.2±2.7 2.7-31.7 6.9±0.2 4.5-8.8 29.3±0.4 63±3 36-
109
New
Rock 13.9±2.3 2.1-29.5 7.4±0.2 5.4-8.9 29.7±0.9 36±5 12-61
Old Shell 8.2±1.6 0.2-16.0 6.4±0.3 4.8-7.7 30.7±0.4 33±4 9-57
New
Shell 18.6±1.7 9.5-29.7 6.8±0.2 5.5-9.5 28.5±0.7 70±5
30-
113
Crab Refuge Experiment
To determine the refuge value of oyster reefs to juvenile blue crabs in the presence of a
cannibalistic adult blue crab, juvenile blue crabs were collected from oyster mariculture bags in
Grand Isle, Louisiana, and brought back to LSU laboratories along with adult blue crabs
collected from baited crab traps in Grand Isle, Louisiana. This experiment determined how
Page 22
13
juvenile distribution changed with water depth and oyster refuge relief when juveniles were
exposed to a cannibalistic adult blue crab. All crabs were maintained in aquaria at 15 PSU and
29oC and fed every 3 days. Two indoor tanks (1.25 m x 0.5 m x 0.45 m) held at a salinity of 15
PSU had a depth gradient, ranging from shallow (7 cm), medium (20 cm), and deep (42 cm), as
in Dittel et al., 1995 (Figure 3). Three oyster shell treatments were constructed: 1) no complexity
(no oyster shell), 2) low complexity (oyster shell = 10 cm relief), and 3) high complexity (oyster
clumps = 40 cm relief) in the deep end of each tank. Each tank had only one oyster shell
treatment. Treatment 1 tested if juvenile crabs prefer deep water or shallow water as a refuge, as
in Dittel et al, (1995). Treatment 2 mimicked a degraded oyster reef in nature (shallow water
versus low complexity deep water reef refuge). Treatment 3 mimicked a high complexity,
healthy oyster reef (shallow water versus high complexity deep water reef refuge). By having a
depth gradient, as well as a vertical complexity treatment, the interactive role of depth and
structure in oyster reef refugia was assessed.
Figure 3. Diagram of the tank used in the experiment for testing refuge preference of juvenile
blue crabs. Differing oyster complexities were placed in the deepest section of the tank to
determine whether juvenile crabs prefer the shallow water refuge or the oyster reef refuge. A =
42 cm, B = 20 cm, C = 7 cm, D = 125 cm.
A juvenile blue crab (mean carapace width = 2.74 ± 0.27 cm) was placed in the medium
depth of each treatment, and then allowed to acclimate for 24 hours (Dittel et al., 1995). At the
A B C
D
Page 23
14
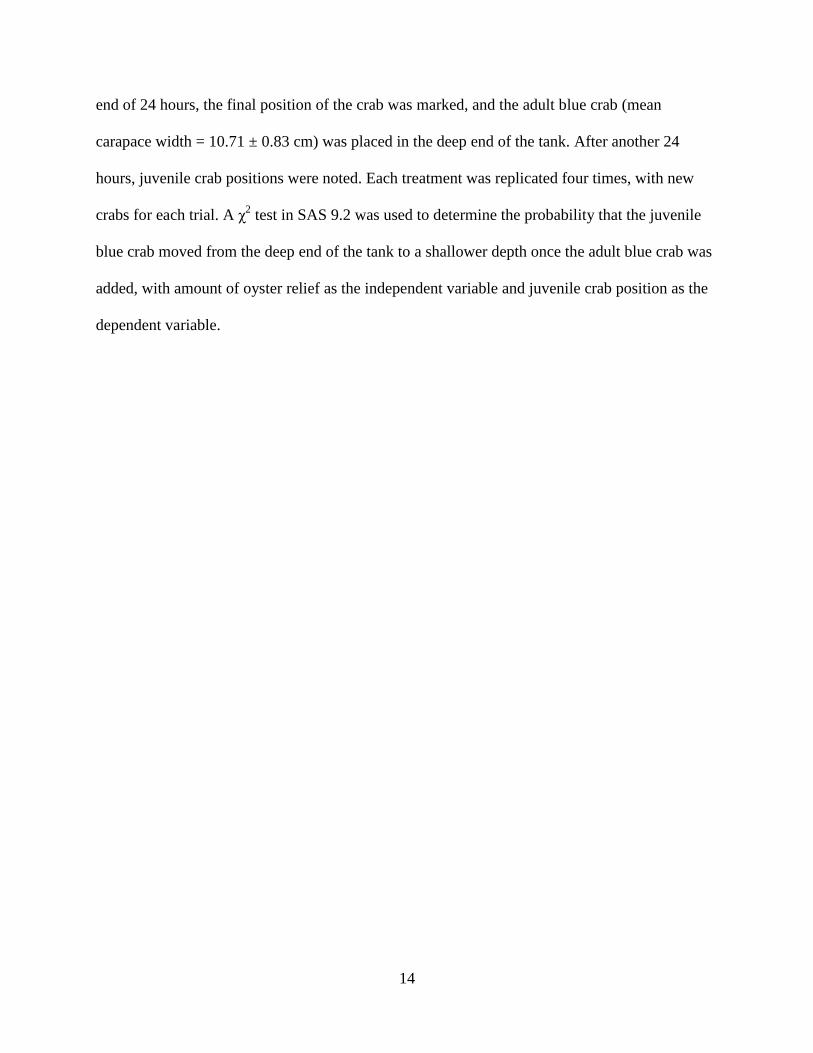
end of 24 hours, the final position of the crab was marked, and the adult blue crab (mean
carapace width = 10.71 ± 0.83 cm) was placed in the deep end of the tank. After another 24
hours, juvenile crab positions were noted. Each treatment was replicated four times, with new
crabs for each trial. A χ2 test in SAS 9.2 was used to determine the probability that the juvenile
blue crab moved from the deep end of the tank to a shallower depth once the adult blue crab was
added, with amount of oyster relief as the independent variable and juvenile crab position as the
dependent variable.
Page 24
15
RESULTS
Adult Blue Crab Abundance
Reef categories had no effect on blue crab CPUE, sex ratios, or size. Blue crab abundance
on and adjacent to the reef were pooled (Mann-Whitney test, p = 0.65), as were seasons (two
way ANCOVA, F = 3.47, p = 0.07). There was no significant difference in log-transformed
CPUE’s among reef categories (two way ANCOVA, F = 1.70, p = 0.16), nor was salinity a
significant covariate (F = 0.46, p = 0.50). In addition, there was no reef category by sampling
date interaction (F = 2.01, p = 0.11).
Again, on and adjacent to the reefs (t-test, p = 0.54), as well as seasons (two way
ANCOVA, F = 0.00, p = 0.95), were pooled in regards to sex ratios. Salinity had no effect on sex
ratios (two way ANCOVA, Binomial Distribution, F = 0.34, p = 0.56), nor was there a difference
among reef categories in sex ratios (F = 0.45, p = 0.77). In addition, there was no reef type by
sampling date interaction (F = 0.19, p = 0.94).
On and adjacent to the reef samples were pooled (t-test, p = 0.75), as well as sampling
dates (two way ANCOVA, F = 0.55, p = 0.46) in regards to adult blue crab size. Reef categories
had no effect on the size of the adult blue crabs (two way ANCOVA, F = 2.03, p = 0.09), nor did
salinity (F = 0.87, p = 0.35). Reef category and sampling dates did not interact (F = 0.77, p =
0.52).
Commensal Community Assemblages
Commensal abundances were pooled from on versus adjacent to the reefs (t-test, p =
0.09), but there were seasonal differences (two way ANCOVA, F = 6.55, p = 0.01). Even with
Page 25
16
salinity as a significant covariate (two way ANCOVA, F = 23.41, p = 0.0001), there was still a
significant difference in the log of total commensal abundance among reef categories (F = 9.33,
p = 0.0001). However, there was no reef type by sampling date interaction (F = 1.00, p = 0.42).
In May, commensal abundances on old rock reefs were significantly higher than old shell reefs
(Tukey a posteriori test, p = 0.01), and control reefs (Tukey a posteriori test, p = 0.04). In July,
the commensal abundances were however significantly higher on new shell reefs than new rock
reefs (Tukey a posteriori test, p = 0.03) and old shell reefs (Tukey a posteriori test, p = 0.007).
Old rock reef commensal abundances were higher than on new rock reefs (Tukey a posteriori
test, p = 0.04) and old shell reefs (Tukey a posteriori test, p = 0.008) (Figure 4).
Figure 4. Log of mean total abundance of commensal organisms ± standard errors on four
different types of artificial oyster reefs, old rock reefs, old shell reefs, new rock reefs and new
shell reefs, compared to control reefs during May and July. Letters above histograms indicates
significant differences in total abundance from Tukey’s tests.
Page 26
17
Samples were pooled on and adjacent to the reef (t-test, p = 0.07), as well as seasonally
(two way ANCOVA, F = 0.00, p = 0.56) for species richness. There was no significant
difference in species richness among reef categories (two way ANCOVA, Poisson Distribution,
F = 0.93, p = 0.46), although salinity was significant as a covariate (F = 27.59, p < 0.0001).
There was no reef category by sampling date interaction (F = 0.75, p = 0.56).
Shannon’s diversity was pooled from on and adjacent to the reef (t-test, p = 0.19), but
was significantly different between seasons (two way ANCOVA, F = 8.57, p = 0.005).
Shannon’s was significantly different among reef category (two way ANCOVA, F = 3.47, p =
0.01), and there was no category by sampling date interaction (F = 0.21, p = 0.93). Salinity was
not a significant covariate (F = 0.44, p = 0.51). In May, old shell reefs had the lowest diversity of
all reef types, differing from all others but new shell reefs (Figure 5). During July, there was no
significant difference among reef categories (one way ANCOVA, F = 1.66, p = 0.18), with no
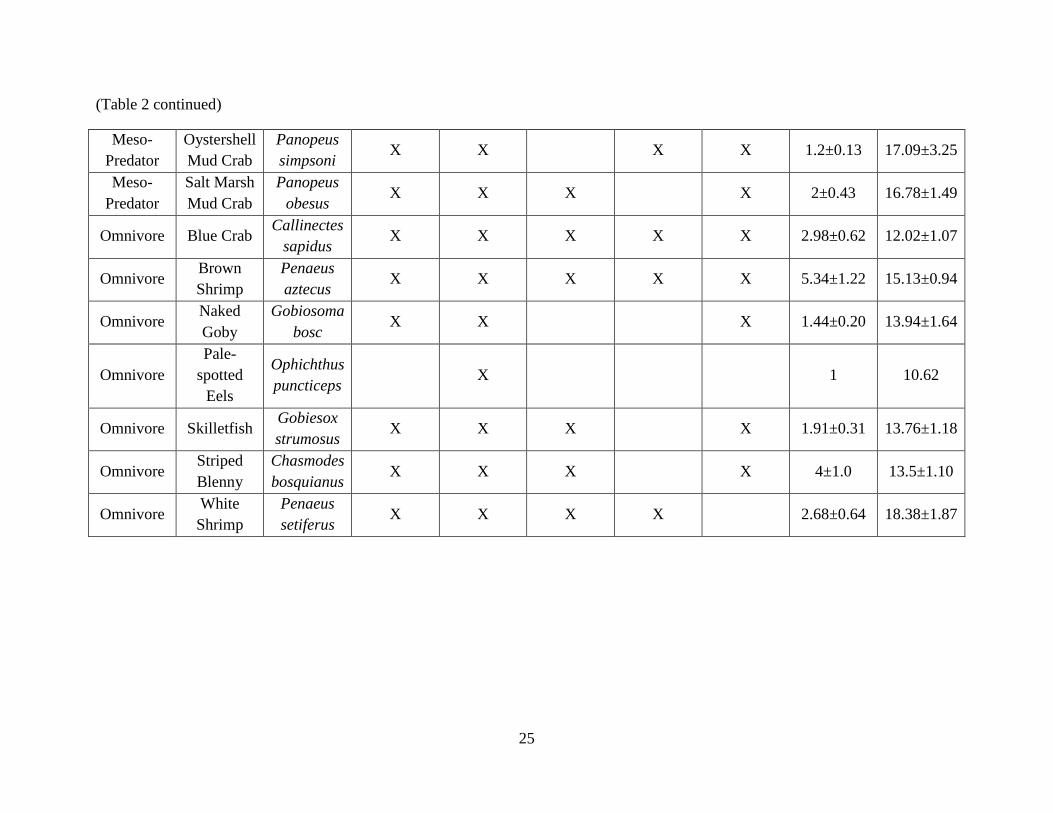
salinity effect (F = 0.03, p = 0.86). All species found on reef types are indicated in Table 2, along
with presence or absence on reef types, average salinities, and salinity ranges of organisms.
When the commensal community was divided into total numbers of individual
omnivores, grazers, meso-predators, and filter feeders, the discriminant analysis was successful
in separating reef categories (Wilks-λ = 0.64, F-value = 1.69, p = 0.05). Only the first
discriminant function was significant, with the canonical correlation explaining 79% of the
variation. All class means on canonical variables for each reef category were negative, except the
old rock reefs (0.82) and new shell reefs (0.15), and old shell had the lowest discriminant score (-
1.04) (Figure 6).
Page 27
18
Figure 5. Average values for Shannon’s diversity Index of commensal organisms ± standard
errors during May on four types of artificial oyster reefs, old rock reefs, old shell reefs, new rock
reefs and new shells reefs, compared to control reefs. Letters above histograms indicates
significant differences in diversity. July was not shown since there were no significant
differences.
Settlement
Settlement was similar on and adjacent to the reef, and densities were pooled (Mann-
Whitney test, p = 0.06). Densities were also pooled between sampling dates (two way
ANCOVA, F = 0.60, p = 0.44). Oyster spat densities were higher on control reefs, as shown by
the LSMeans. Reef type had a significant effect on oyster spat densities (two way ANCOVA,
Negative Binomial Distribution, F = 3.90, p = 0.006), with control reefs having significantly
higher spat densities than old rock reefs (Tukey a posteriori test, p = 0.0032) (Figure 7). Salinity
had a significant effect on oyster spat densities (F = 111.54, p = 0.0001), with higher spat
Page 28
19
densities at higher salinities (Figure 8). There was a significant reef type by sampling date
interaction (F = 2.58, p = 0.04).
Figure 6. The class means on the first discriminant function. Old rock reefs are separated from
other reef types, including the control reefs (Wilks-λ = 0.64, F-value = 1.69, p = 0.05)
Oyster spat were larger in July (8.96 ± 0.38 mm) than in May (4.91 ± 0.13 mm) (two way
ANCOVA, Poisson Distribution, F = 13.56, p = 0.003). There was also a reef type by sampling
date interaction for spat size (F= 3.16, p = 0.04). In May, reef category had no effect on spat size
(two way ANCOVA, Poisson Distribution, F = 0.21, p = 0.94), and salinity was not significant
(F = 1.44, p = 0.23). In July, there was a significant effect of reef category (F = 27.50, p =
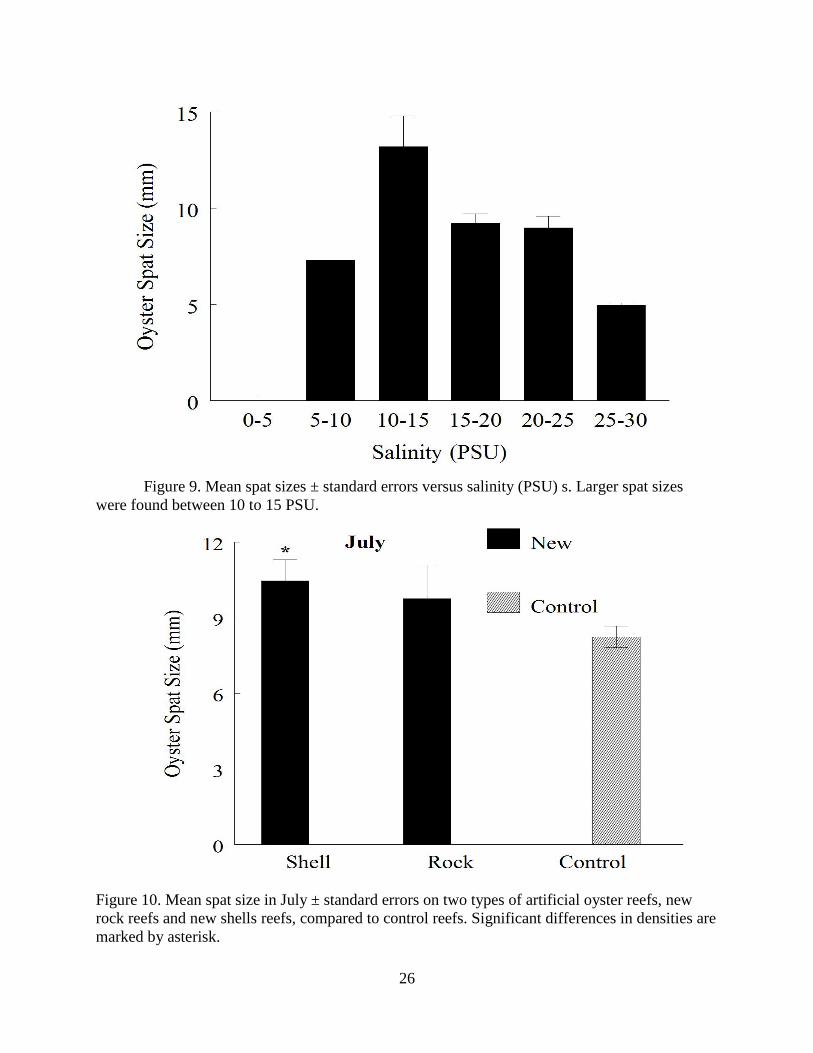
0.0001), with salinity as a significant covariate (F = 57.44, p = 0.0001). Larger spat were found
around 10 to 15 PSU (Figure 9). The LSMeans show significant difference in reef categories
Page 29
20
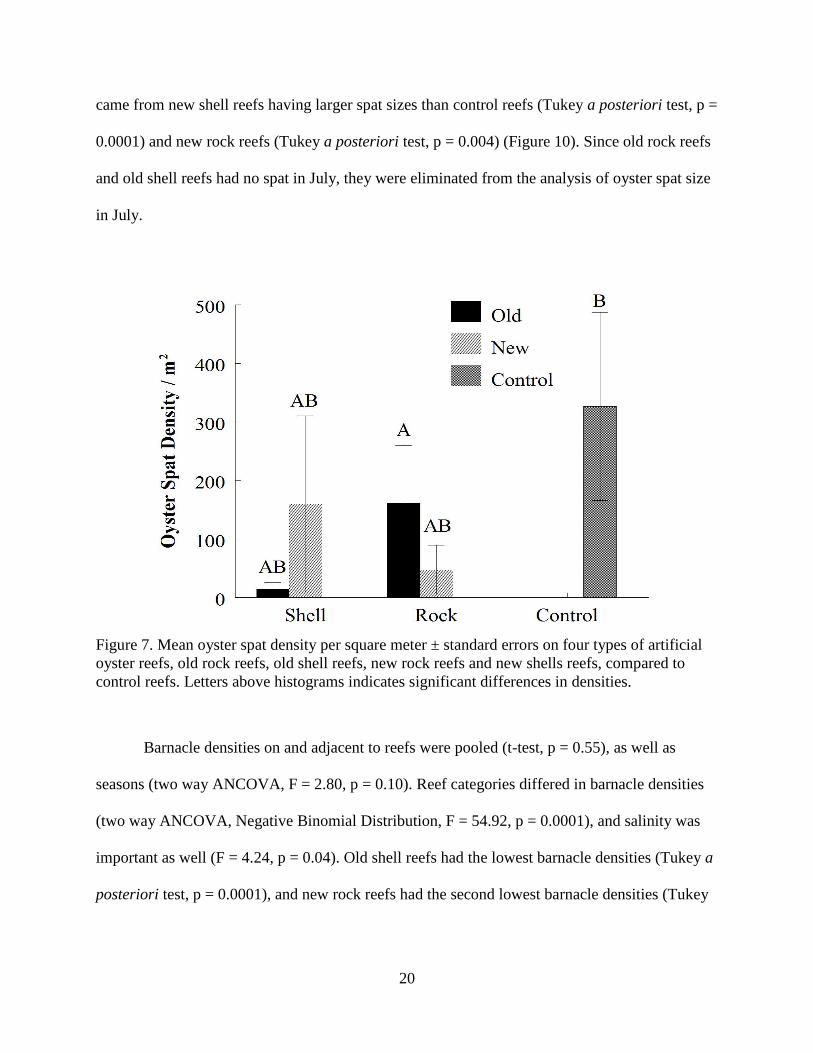
came from new shell reefs having larger spat sizes than control reefs (Tukey a posteriori test, p =
0.0001) and new rock reefs (Tukey a posteriori test, p = 0.004) (Figure 10). Since old rock reefs
and old shell reefs had no spat in July, they were eliminated from the analysis of oyster spat size
in July.
Figure 7. Mean oyster spat density per square meter ± standard errors on four types of artificial
oyster reefs, old rock reefs, old shell reefs, new rock reefs and new shells reefs, compared to
control reefs. Letters above histograms indicates significant differences in densities.
Barnacle densities on and adjacent to reefs were pooled (t-test, p = 0.55), as well as
seasons (two way ANCOVA, F = 2.80, p = 0.10). Reef categories differed in barnacle densities
(two way ANCOVA, Negative Binomial Distribution, F = 54.92, p = 0.0001), and salinity was
important as well (F = 4.24, p = 0.04). Old shell reefs had the lowest barnacle densities (Tukey a
posteriori test, p = 0.0001), and new rock reefs had the second lowest barnacle densities (Tukey
Page 30
21
a posteriori test, p < 0.01) (Figure 11). There was no sampling date and reef category interaction
(F = 2.43, p = 0.06).
Figure 8– Mean oyster spat densities per square meter ± and standard errors versus salinity
(PSU)s.
Crab Refuge Experiment
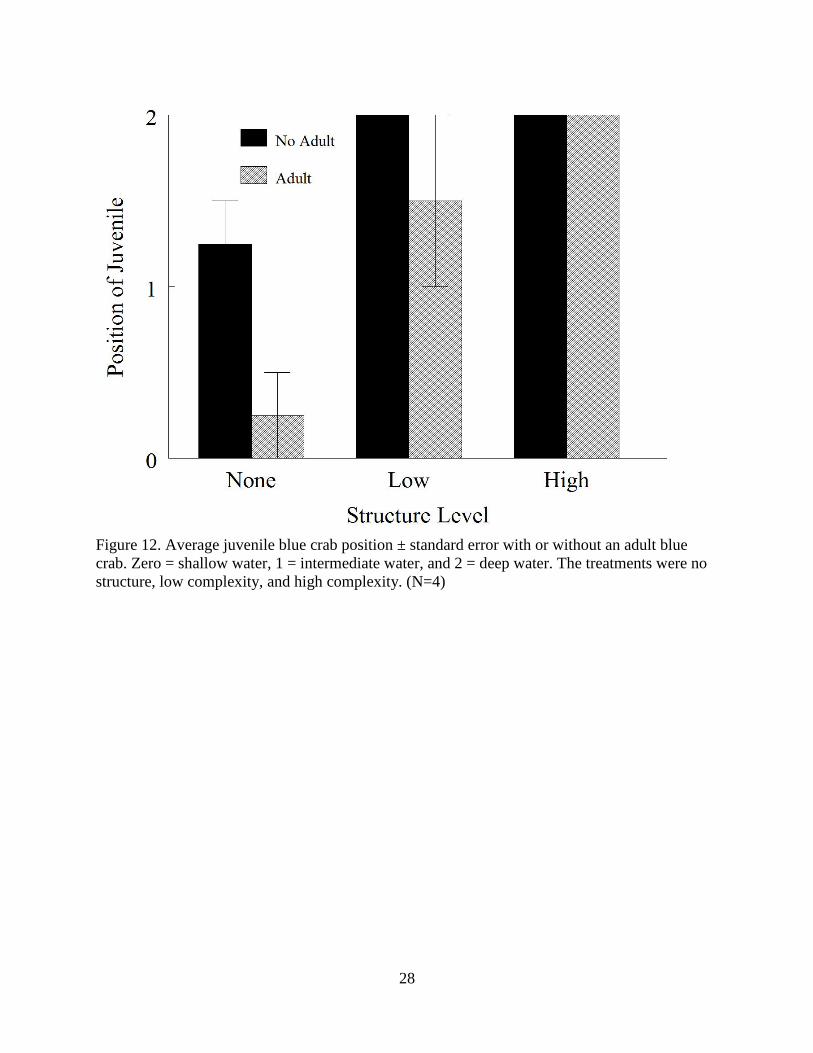
There was a significant difference between the level of structure and the probability that a
juvenile blue crab would move from deeper water to shallower water when an adult blue crab
was added to the tank (χ2
= 8.91, p = 0.01). There was no difference in the position of the
juvenile in high structure reefs, but crab positions in low structure reefs were variable (Figure
12).
Page 31
22
Table 2. Species list with Latin names, common names, average species abundance + standard error, and average salinity where
species were found + standard error. An “X” indicates which reefs each species occurred in.
Functional
Guild
Common
Name Latin Names Control
Old
Rock
New
Rock Old Shell
New
Shell
Average
Number
Salinity
Mean
Filter
Feeder Blood Ark
Anadara
ovalis X X X 2±0.58 25.48±1.41
Filter
Feeder
Channeled
Barrel-
Bubble
Acteocina
canaliculata X X X 3.11±0.79 24.81±1.13
Filter
Feeder Copepod Harpacticoida X 1 25.71
Filter
Feeder
Daggerblade
Grass
Shrimp
Palaemonetes
pugio X X X 4±1.41 20.58±3.63
Filter
Feeder
Green
Porcelain
Crab
Petrolisthes
armatus
X
X
X
X
50.28±11.51
22.31±0.54
Filter
Feeder Hard Clam
Probythinella
louisianae X X X 4.8±2.63 22.71±1.66
Filter
Feeder Hard Clam
Tellina
versicolor X 1 17.11
Filter
Feeder Mud Snail
Texadina
barrette X X 10.5±8.5 12.46±11.58
Filter
Feeder
Ribbed
Mussel
Geukensia
demissa X X X X X 9.86±1.66 15.91±0.68
Page 32
23
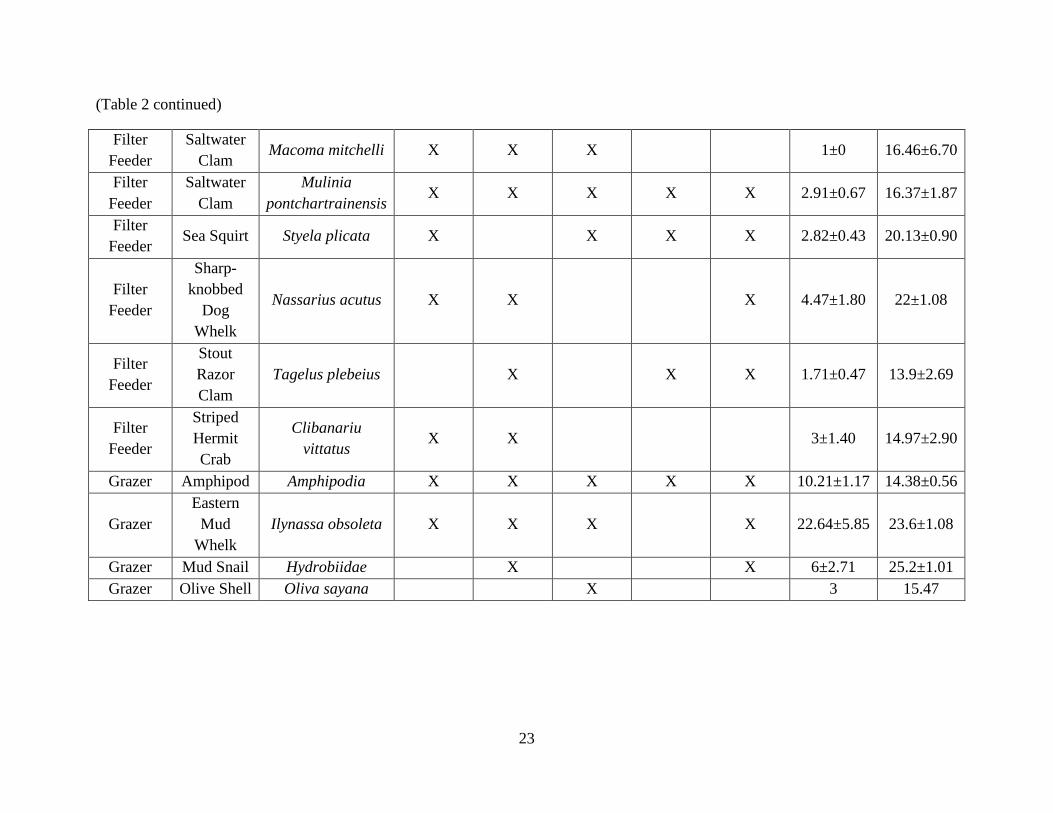
(Table 2 continued)
Filter
Feeder
Saltwater
Clam Macoma mitchelli X X X 1±0 16.46±6.70
Filter
Feeder
Saltwater
Clam
Mulinia
pontchartrainensis X X X X X 2.91±0.67 16.37±1.87
Filter
Feeder Sea Squirt Styela plicata X X X X 2.82±0.43 20.13±0.90
Filter
Feeder
Sharp-
knobbed
Dog
Whelk
Nassarius acutus X X X 4.47±1.80 22±1.08
Filter
Feeder
Stout
Razor
Clam
Tagelus plebeius X X X 1.71±0.47 13.9±2.69
Filter
Feeder
Striped
Hermit
Crab
Clibanariu
vittatus X X 3±1.40 14.97±2.90
Grazer Amphipod Amphipodia X X X X X 10.21±1.17 14.38±0.56
Grazer
Eastern
Mud
Whelk
Ilynassa obsoleta X X X X 22.64±5.85 23.6±1.08
Grazer Mud Snail Hydrobiidae X X 6±2.71 25.2±1.01
Grazer Olive Shell Oliva sayana X 3 15.47
Page 33
24
(Table 2 continued)
Grazer Polychaeta X X X X X 17.4±2.14 14.6±0.60
Meso-
Predator
Bigclaw
Snapping
Shrimp
Alpheus
heterochaelis X X X X 2.32±0.36 20.8±1.05
Meso-
Predator
Bruised
Nassa Nassarius vibex X X X X X 25.67±5.94 22.19±1.07
Meso-
Predator
Depressed
Mud Crab
Eurypanopeus
depressus X X X X X 6.91±0.65 15.01±0.67
Meso-
Predator
Dwarf
Crab
Rhithropanopeus
harrisii X X X X X 3.79±0.49 12.31±0.96
Meso-
Predator
Gulf
Oyster
Drill
Stamonita
haemastoma X X 1±0 19.24±3.77
Meso-
Predator
Gulf Stone
Crab Menippe adina X X X X 1.29±0.16 23.39±1.41
Meso-
Predator
Gulf
Toadfish Opsanus beta X X 1.8±0.37 14.15±2.80
Meso-
Predator
Longnose
Spider
Crab
Libinia dubia X X 1.25±0.25 26.4±3.35
Page 34
25
(Table 2 continued)
Meso-
Predator
Oystershell
Mud Crab
Panopeus
simpsoni X X X X 1.2±0.13 17.09±3.25
Meso-
Predator
Salt Marsh
Mud Crab
Panopeus
obesus X X X X 2±0.43 16.78±1.49
Omnivore Blue Crab Callinectes
sapidus X X X X X 2.98±0.62 12.02±1.07
Omnivore Brown
Shrimp
Penaeus
aztecus X X X X X 5.34±1.22 15.13±0.94
Omnivore Naked
Goby
Gobiosoma
bosc X X X 1.44±0.20 13.94±1.64
Omnivore
Pale-
spotted
Eels
Ophichthus
puncticeps X 1 10.62
Omnivore Skilletfish Gobiesox
strumosus X X X X 1.91±0.31 13.76±1.18
Omnivore Striped
Blenny
Chasmodes
bosquianus X X X X 4±1.0 13.5±1.10
Omnivore White
Shrimp
Penaeus
setiferus X X X X 2.68±0.64 18.38±1.87
Page 35
26
Figure 9. Mean spat sizes ± standard errors versus salinity (PSU) s. Larger spat sizes
were found between 10 to 15 PSU.
Figure 10. Mean spat size in July ± standard errors on two types of artificial oyster reefs, new
rock reefs and new shells reefs, compared to control reefs. Significant differences in densities are
marked by asterisk.
Page 36
27
Figure 11. Mean barnacle density per square meter ± and standard errors on four types of
artificial oyster reefs, old rock reefs, old shell reefs, new rock reefs and new shells reefs,
compared to control reefs. Letters indicates significant differences in densities.
To relate these data to the field, a linear regression was performed on the relationship
between adult blue crab and juvenile blue crab CPUE from field collection, but it was not
significant (simple linear regression, p = 0.64). Juvenile blue crab CPUE from field collection
did not vary among reef categories (one way ANCOVA, F = 0.77, p = 0.59), nor was salinity
significant (F = 0.38, p = 0.55).
Page 37
28
Figure 12. Average juvenile blue crab position ± standard error with or without an adult blue
crab. Zero = shallow water, 1 = intermediate water, and 2 = deep water. The treatments were no
structure, low complexity, and high complexity. (N=4)
Page 38
29
DISCUSSION
In this study, I investigated the effect of artificial oyster reef construction material on
ecosystem services, and how those services change over time. Adult blue crab CPUE was not
affected by reef category, most likely due to mobility of adults, while commensal communities
had lowest diversity and abundance on old shell reefs. This result is most likely due to shell loss
over long time periods, therefore decreasing habitat and refuge value. Spat densities and spat
sizes were variable across reef categories, probably owing to variation in spawning times across
bays and salinities. Ultimately, shell reefs seemed to lose ecosystem service function over time,
while rock reefs were able to maintain structure and provide for commensal communities.
The lack of an effect of reef category on adult blue crab CPUE was most likely due to
adult blue crab mobility. Females move long distances across estuaries to higher salinities to
spawn (Van Engle 1958), and both males and females often move between habitat types in
response to temperature, food availability, salinity, and tides (Meise and Stehlik 2003, Gregalis
et al., 2009). Similarly, the mobile nature of these crabs may have resulted in the lack of
difference in sex ratios between reef categories, and the not significant effect of salinity was
most likely an artifact of the seasons sampled. Females prefer higher salinity waters during
spawning, and lower salinities when they co-occur with males in pre- and post-spawn periods.
Therefore a higher male to female ratio would be expected at lower salinities during spawning
months (Meise and Stehlik 2003). However, sampling was not conducted during spawning,
which occurs in early spring in the Gulf of Mexico (Darnell 1959). The lack of a difference in
crab size among reef categories also suggested that no reef material or age offered greater
resources for crab growth.
Page 39
30
Perhaps also not surprising was the lack of a reef category effect on juvenile blue crab
CPUE. That is, since there was no trend in adult CPUE, no trend in juvenile CPUE might be
expected. The results of my laboratory experiment supported the findings of Dittel et al. (1995)
who observed juvenile blue crabs taking refuge in shallow waters when structure was
unavailable. In presence of degraded structure, juveniles were half as likely to take refuge in
shallow water as they were to take refuge in oyster shells. When greater vertical complexity was
provided, juveniles took refuge in oyster shell 100% of the time in the presence of cannibalistic
adults, which are a principle source of mortality (Hines and Ruiz 1995). The greater vertical
complexity of oyster reefs as superior refugia as determined in this laboratory study is
corroborated by other studies of reefs as refugia (Grabowski 2004, Soniat et al., 2004, Tolley and
Volety 2005). Refuge is quite important as it can enhance or inhibit the cascading effect of
predators (Pace et al., 1999).
The different reef categories also appeared to offer similar ecosystem services compared
to natural reefs in regards to commensal assemblages, with the exception of older shell reefs. Old
shell reefs had lower diversity and abundance of commensals, and over time periods longer than
5 years, rock reefs had greater commensal species richness, diversity, and abundance than old
shell reefs, and occasionally more than control reefs. This can likely be attributed to the presence
of greater structure remaining at the old rock reefs compared to the old shell reefs. Furlong
(2012) sampled the same reef treatments and found higher adult oyster density on rock reefs
compared to shell reefs, as well as greater numbers of oyster clusters and hard substrates.
Commensal organisms appear to utilize reef structure whether the oysters are alive or dead
(Plunket and La Peyre 2005, Tolley and Volety 2005, Grabowski et al., 2008), with structure
being the primary driving force and not food sources (Humphries 2010). Structure provides a
Page 40
31
refuge, and oyster clusters are a nearly impenetrable refuge for decapod predators (Glancy et al.,
2003). Even during periods of low spat recruitment, reefs anchored by heavy rock still provide
structure. Vertical complexity from adult oysters, clusters, and hard substrate thus increase
refugia from predation (McDonald 1982, Grabowski 2004, Gregalis et al., 2009) and provide
increased chances for resource partitioning (Hughes and Grabowski 2006).
Shell scattering over time thus could explain the lack of commensal diversity and
abundance on old shell reefs. In years of low spat recruitment, often at lower salinities, no live
oysters are present on shell reefs to hold the reef together. In Delaware Bay, half of the oyster
shell added to reefs was lost over a period of 2-10 years, with lowest shell half-lives at
intermediate salinities (Powell et al., 2006). Oyster shell is less dense than rock and when shell
reefs are created, loose shell is placed on top of substrate, making them more vulnerable to high
flow velocities, resulting in shell movement (LDWF 2004, Lenihan 1999, Thompson and Amos
2002). With shifting, shell reefs either accrue sediment, or are spread too thinly and sink in the
mud. Disturbances from fisheries trawling also increase shell spreading across sediment by
dragging trawls across the shells, and shells spread thinly on a mud substrate do not add any
vertical refuge, and thus protection from predation (Soniat et al., 2004). Once the shells are
spread thinly, they can also be exposed to hypoxic conditions by being closer to the muddy
hypoxic zone, further reducing oyster growth and settlement (Baker and Mann 1991, Lenihan
1999).
The finding of a lack of difference between nearby mud flats and reef treatments may be
a sampling artifact. Scyphers et al., (2011) found higher blue crab densities on breakwater reefs
compared to control areas based on a seine net sampling methods, which showed differences on
and off the reef. For a subtidal oyster reef, a seine net would have been impractical, if not
Page 41
32
impossible, to use as a sampling method. The use of crab pots introduced an experimental bias,
since seine nets provide for an instantaneous grab sample whereas crab pots set overnight
permitted crabs that were residing on the reef to swim to the crab pot adjacent to the reef. In
regards to commensal samples, the commensal bags in this study created structure in mud flats,
and may actually have attracted invertebrate recruits competing for space on nearby reefs. Other
sampling methods besides bags include Grabowski et al. (2005)’s finger combing method, as
well as lift net methods (Tolley and Volety 2005). Both of these studies, as well as others
(Summerson and Peterson 1984, Posey et al., 1999, Coen and Luckenbach 2000, Plunket and La
Peyre 2005) found greater numbers of commensals compared to the adjacent mudflats. Only
Plunket and La Peyre (2005) used a method that was not instantaneous, but their method of using
trays was done in a way that reduced structure on and off the reefs. While the commensal bags
provide a good estimate of organisms in the area of the reef, regardless of structure, they may not
provide an accurate representation of differences between adjacent mud flats and reefs.
All reef types yielded the same spat densities; with the exception that old rock had lower
recruitment than natural control reefs, which could be related to differences in larval supply and
flow velocities (Bushek 1998). Most of the natural reefs were located at the mouth of the bays
sampled, which tend to be areas with higher flows, higher salinities, and potentially higher food
sources, allowing oysters populations to thrive. Another factor that could leave to natural reefs
having higher rates of recruitment is that if a natural reef was not successful at recruiting spat, it
would not last over time and be present at the time of my sampling. By picking natural reefs that
have lasted over time, I may bias my sampling by picking only successful natural reefs. Bushek
(1988) found greater numbers of barnacles on offshore sites with higher flows, compared to
oysters, which were found at lower flow, intertidal sites (Soniat et al., 2004). Barnacles recruit
Page 42
33
year round, with highest peaks in the spring, whereas oysters have a settlement peak in early
summer and again in late summer (Supan 1983, Banks and Brown 2002). Oyster spawning and
settlement rates are a function of salinity and temperature (Kennedy et al., 1996). Since this
survey spanned the entire northern Gulf of Mexico, and salinity was a significant covariate, it is
possible that certain bays had passed their settlement peak before the settlement plates were
deployed.
Oyster spawning is affected by salinity, with greater settlement at higher salinities
(Ortega and Sutherland 1992), and my results agree. While the risk of predation and disease
increases at higher salinities (Melancon et al., 1998), growth also increases (Eberline 2012).
Lower salinities have less growth and recruitment, and extremely low salinities can actually halt
spawning (Pollack et al., 2011, Eberline 2012). My results indicate the largest spat occur at
intermediate salinities, but the higher number of predators at greater salinities may have also
consumed the larger spat (Melancon et al., 1998). There are numerous predators of oyster spat,
including xanthid mud crabs (Grabowski 2004), the flatworm Stylochus ellipticus (Newell et al.,
2000), and blue crabs (personal observation). Oysters were larger in July compared to May,
likely due to higher growth rates. Increases in oyster growth are correlated with increasing water
temperature (Ingle and Dawson 1952, Dame 1972), which could have led to larger spat sizes in
July compared to May. I attempted to standardize salinities across sites, but the variability in the
Gulf of Mexico’s salinity range was too great. A flood in Louisiana brought salinities in
Vermilion Bay to 0.1 PSU, while a drought in Texas brought salinities that average around 19.3
PSU to 32 PSU in August of 2011 (Pollack et al., 2011).
The temporal uncertainty of oyster spawning in different bays could also lead to error in
interpreting spat data. Unless spat monitoring is ongoing through the whole spawning season, a
Page 43
34
bay’s spawning season may be missed. Likewise, the seasonal effect on spat size was most likely
determined by when oysters spawned and settled. Oysters spawning in July, as settlement plates
were being deployed, had the opportunity to settle earlier and start growing earlier than oysters
that spawned in early June, and settled just in time for May sampling settlement plate retrieval
(Losee 1979). Since spat densities are variable and dependent upon salinities and temperature for
spawning (Kenny et al., 1990, Ortega and Sutherland 1992), in retrospect, my protocol should
have included monthly sampling of spat densities.
New rock and new shell reefs were thus generally similar to natural reefs with regard to
ecosystem services provided. Oyster reefs are colonized rapidly by invertebrates (Meyer and
Townsend 2000, Peterson et al., 2000, Peterson et al., 2003). Grabowski et al. (2005) found no
significant seasonal effect on number of invertebrates; and concluded that most change in
invertebrate densities is due to rapid colonization. When monitoring oyster reef restoration
projects, the similarities between natural reefs and new rock and shell reefs, which are less than
five years old, imply that there is no difference between construction material and commensal
abundances. Though, if monitoring stops after a five-year period, the drastic change in
commensal communities between construction materials is missed. This study, along with others,
point out that long term monitoring of restored reefs is important to see if ecosystem services
remain constant over time (Coen and Luckenbach 2000, Grabowski et al., 2005, Lukenbach et
al., 2005, Grabowski and Peterson 2007, Kennedy et al., 2011).
In fact, this study suggested that over time, shell reefs lose their functional ecosystem
services, while rock reefs retain them. Many of the shell reefs had degraded over time to the
extent that only a few shells were found buried in the mud, with one reef being nonexistent.
These reefs were still included in this study since the main question was to determine how
Page 44
35
ecosystem service functions over time; clearly older shell reefs are more likely to lose their
function. When creating an artificial oyster reef, my results thus suggest rock is a more resilient
and effective material, although placement in regard to salinity variation is important as well.
From a management perspective, the first step in building artificial reefs would be to
determine what ecosystem services to restore (Kennedy et al., 2011). If the goal is oyster
settlement, and in turn ecosystem services like water filtration, de-nitrification, and other
economic benefits, paying attention to the salinity ranges of potential areas is important, as
salinity seems to have a greater effect on size and densities of oyster spat than reef material. If
the goal is fisheries enhancement, and live oysters are not a priority (Tolley and Volety 2005),
salinity is still critical, but reefs created from rock last longer.
Ideally, successfully restored reefs will provide all the ecosystem services lost by
declining oyster populations (Luckenbach et al., 2005), although determining success on these
reefs is complicated. While setting broad restoration goals like maintaining biodiversity, fish and
shellfish production, and ecosystem services are important, the lack of methods to monitor
success complicates designing projects, as well as determining if restoration goals have been met
(Coen and Luckenbach 2000, Oyster Metrics Workgroup 2011, Furlong 2012). Metrics like
habitat complexity, recruitment and species richness are good determinants of functional
ecosystem services, although there is no universal standard to compare to. Referencing such
metrics to a natural reef is a reasonable option, but often these reefs have been previously
harvested, making them patchy and less effective as benchmarks for restoration success
(Eggleston et al., 1999, Glancy 2003, Macreadie et al., 2011). The Oyster Metrics Workgroup,
based in the Chesapeake Bay, noted that complete failures are much more easily noted than
successful reefs, and that success must be measured in metrics that can apply to all reefs. They
Page 45
36
suggested exploring relationships between different metrics, such as reef size, oyster biomass,
total suspended solids and temperature in a controlled experiment, and using a few of these
characteristics to determine the health of the reef, although such an approach is not politically
popular nor cheap. By defining first what a reef is, success can be more easily measured. If a reef
is simply structure (live or dead) that attracts fishes and offers refuge for invertebrates, success
criteria could be high species richness, commensal abundance, and vertical complexity; whereas
if a reef is a living community, oyster biomass and production may be determinants of success.
State and private restoration efforts ultimately will do what is most practical in an
economic sense. One of the major considerations comes from shell being a limiting component.
Oyster shell recycling programs, such as those in North Carolina, South Carolina, and Virginia
benefit those states, but along the Gulf coast, recycled shell is difficult to find. Part of this results
from most of the Gulf of Mexico’s oyster shell being shipped out to states like North and South
Carolina, and Virginia, which end up in their shell recycling programs. Oyster shells that are not
exported are used in road construction and poultry feed, ultimately creating a shell deficit along
the Gulf coast (LDWF 2004). Economically, oyster shell is not the cheapest route, and rock or
concrete is more cost effective (LWDF 2004).
This study provides support for a best management practice of using rock materials to
create artificial oyster reefs along the Northern Gulf of Mexico. Rock material will not only
result in more live oysters and make more sense economically (LDWF 2004), but it will continue
to provide refuge and habitat for invertebrates at the bottom of the food web, regardless of
variation in oyster recruitment. Determining the correct placement in regard to salinity regimes is
still quite important to having successful recruitment and growth on the reef. However, if rock is
used, if nothing recruits to the reef, all money spent and ecosystem services are not lost. In the
Page 46
37
Gulf of Mexico, where sediment is mostly mud and salinity is highly variable, rock reefs may
actually provide more ecosystem services than shell reefs over time, and in a few cases more
services than natural reefs, therefore providing an optional if not optimal material to restore
ecosystem services. As restoration efforts increase due to loss of ecosystem services from threats
to Gulf of Mexico habitats, finding best management practices that efficiently and effectively
restore lost ecosystem services of oyster reefs is crucial.
Page 47
38
LITERATURE CITED
Baker, S.M. and R. Mann. 1991. Effects of hypoxia and anoxia on larval settlement, juvenile
growth, and juvenile survival of the oyster Crassostrea virginica. Biological Bulletin
182:265-269.
Banks, P.D. and K.M. Brown. 2002. Hydrocarbon effects on fouling assemblages: the
importance of taxonomic differences, seasonal, and tidal variation. Marine Environmental
Research 53:311-326.
Beck, M.W., R.D. Brumbaugh, L. Airoldi, A. Carranza, L.D. Coen, C. Crawford, O. Defeo, G.J.
Edgar, B. Hancock, M.C. Kay, H.S. Lenihan, M.W. Luckenbach, C.T. Toropova, G.
Zhang, and X. Guo. 2011. Oyster reefs at risk and recommendations for conservation,
restoration, and management. BioScience 61:107-116.
Brown, K.M. and E.S. Haight. 1992. The foraging ecology of the Gulf of Mexico stone crab,
Menippe adina. Journal of Experimental Marine Biology and Ecology 160:67-80.
Brown, K.M. and T.D. Richardson. 1987. Foraging ecology of the southern oyster drill Thais
haemastoma (Grey): constraints on prey choice. Journal of Experimental Marine Biology
and Ecology 114:123-141.
Bushek, D. 1988. Settlement as a major determinant of intertidal oyster and barnacle
distributions along a horizontal gradient. Journal of Experimental Marine Biology and
Ecology 122:1-18.
Cerco, C.F. and M.R. Noel. 2007. Can oyster restoration reverse cultural eutrophication in
Chesapeake Bay? Estuaries and Coasts 30:331-343.
Coen, L.D. and M.W. Luckenbach. 2000. Developing success criteria and goals for evaluating
oyster reef restoration: ecological function or resource exploitation. Ecological
Engineering 15:323-343.
Crisp, D.J. 1967. Chemical factors inducing settlement in Crassostrea virginica (Gmelin).
Journal of Animal Ecology 36:329-335.
Dahl, T.E. 2006. Status and trends of wetlands in conterminous United States 1998 to 2004. Fish
and Wildlife Service, US Department of the Interior, Washington, D.C. 112pp.
Dame, R. F. 1972. The ecological energies of growth, respiration and assimilation in the
intertidal American oyster Crassostrea virginica. Marine Biology 17:243-250.
Dame, R. F., R.G. Zingmark, and E. Haskin. 1984. Oyster reefs as processors of estuarine
materials. Journal of Experimental Marine Biology and Ecology 83:239-247.
Page 48
39
Darnell, R.M. 1959. Studies of the life history of the blue crab (Callinectes sapidus Rathbun) in
Louisiana waters. Transactions of the American Fisheries Society 88:294-304.
Dittel., A.I., A.H. Hines, G.M. Ruiz, and K.K. Ruffin. 1995. Effects of shallow water refuge on
behavior and density-dependent mortality of juvenile blue crabs in Chesapeake Bay.
Bulletin of Marine Science 75:902-916.
Easterling, D. and T. Karl. 2008. Global warming: frequently asked questions. Retrieved May
21, 2012, from http://www.ncdc.noaa.gov/oa/climate/globalwarming.html#q11.
Eberline, B.S. 2012. Population dynamics of the eastern oyster in the northern Gulf of Mexico.
Masters Thesis, Louisiana State University, Baton Rouge.
Eggleston, D.B. 1990. Foraging behavior of the blue crab, Callinectes sapidus, on juvenile
oysters, Crassostrea virginica: effects of prey density and size. Bulletin of Marine
Science 46:62-82.
Eggleston, D.B., W.E. Elis, L.L. Etherington, C.P. Dahlgren, and M.H. Posey. 1999. Organism
response to habitat fragmentation and diversity: habitat colonization by estuarine
macrofauna. Journal of Experimental Marine Biology and Ecology 236:107-432.
Furlong, J.N., 2012. Artificial oyster reefs in the Northern Gulf of Mexico: management,
materials, and faunal effects. Masters Thesis, Louisiana State University, Baton Rouge.
George, G.J., K.M. Brown, G.W. Peterson, and B.A. Thompson. 2008. Removal of black drum
on Louisiana reefs to increase survival of eastern oysters Crassostrea virginica. North
American Journal of Fisheries Management 28:1802-1811.
Glancy, T.P., T.K. Frazier, C.E. Cichra, and W.J. Lindberg. 2003. Comparative patterns of
occupancy by decapod crustaceans in seagrass, oysters, and marsh edge habitats in a
Northeast Gulf of Mexico estuary. Estuaries 26:1291-1301.
Grabowski, J.H. 2004. Habitat complexity disrupts predator-prey interactions but not the trophic
cascade on oyster reefs. Ecology 85:995-1004.
Grabowski, J.H., A.R. Hughes, D.L. Kimbro, and M.A. Dolan. 2005. How habitat setting
influences restored oyster reef communities. Ecology 86:1926-1935.
Grabowski, J.H., A.R. Hughes, and D.L. Kimbro. 2008. Habitat complexity influences cascading
effects of multiple predators. Ecology 89:3413-3422.
Grabowski, J.H. and C.H. Peterson. 2007. Restoring oyster reefs to recover ecosystem services.
Theoretical Ecology Series 4:281-298.
Page 49
40
Gregalis, K.C., M.W. Johnson, and S.P. Powers. 2009. Restored oyster reef location and design
affect responses of resident and transient fish, crab, and shellfish species in Mobile Bay,
Alabama. Transaction of the American Fisheries Society 138:314-327.
Harding, J.M. and R. Mann. 1999. Fish species richness in relation to restored oyster reefs,
Piankatank River, Virginia. Bulletin of Marine Science 65:289-300.
Hargis Jr., W.J., D.S. Haven, M.W. Luckenbach, R. Mann, and J. A. Wesson. 1999. Chesapeake
oyster reefs, their importance, destruction and guidelines for restoring them. Virginia
Institute of Marine Science Press, Gloucester Point, VA. Chapter 23:329-358.
Hidu, H. 1969. Gregarious setting in the American oyster Crassostrea virginica Gmelin.
Chesapeake Science 10:85-92.
Hines, A.H. and G.M. Ruiz. 1995. Temporal variation in juvenile blue crab mortality: nearshore
shallows and cannibalism in Chesapeake Bay. Bulletin of Marine Science 57:884-901.
Hopkins, T.S., J.F. Valentine, and L.B. Lutz. 1989. An illustrated guide with key to selected
benthic invertebrate fauna of the northern Gulf of Mexico. Dauphin Island, Alabama:
Marine Environmental Sciences Consortium of Alabama.
Hughes, A.R. and J.H. Grabowski. 2006. Habitat context influences predator interference
interactions and the strength of resource partitioning. Oecologia 149:256-264.
Humphries, A.T. 2010. Effects of habitat structural complexity on nekton assemblages: lab and
field observations in Southern Louisiana. Masters Thesis, Louisiana State University,
Baton Rouge.
Ingle, R.M, and C.E. Dawson Jr. 1952. Growth of the American oyster Crassostrea virginica in
Florida waters. Bulletin of Marine Science 2:393-404.
Jackson, J.B.C., M.X. Kirby, W.H. Berger, K.A. Bjorndal, L.W. Botsford, B.J. Bourque, R.H.
Bradbury, R. Cooke, J. Erlandson, J.A. Estes, T.P. Hughes, S. Kidwell, C.B. Lange, H.S.
Lenihan, J.M. Pandolfi, C.H. Peterson, R.S. Steneck, M.J. Tegner, and R.R. Warner.
2001. Historical overfishing and the recent collapse of coastal ecosystems. Science
239:629-638.
Kirby, M.X. 2004. Fishing down the coast: historical expansion and collapse of oyster fisheries
along continental margins. PNAS 101:13096-1399.
Kemp, W.M., W.R. Boynton, J.E. Adolf, D.F. Boesch, W.C. Boicourt, G. Brush, J.C. Cornwell,
T.R. Fisher, P.M. Glibert, J.D. Hagy, L.W. Harding, E.D. Houde, D.G. Kimmel, W.D.
Miller, R.I.E Newell, M.R. Roman, E.M. Smith, J.C. Stevenson. 2005. Eutrophication of
Chesapeake Bay: historical trends and ecological interactions. Marine Ecology Progress
Series 303:1-29.
Page 50
41
Kennedy, V.S., R.I.E. Newell, and A.F. Eble. 1996. The eastern oyster Crassostrea virginica.
Maryland: University of Maryland Sea Grant Publications.
Kennedy, V.S., D.L. Breitburg, M.C. Christman, M.W. Luckenbach, K. Paynter, J. Kramer, K.G.
Sellner, J. Dew-Baxter, C. Keller, and R. Mann. 2011. Lessons learned from efforts to
restore oyster populations in Maryland and Virginia, 1990 to 2007. Journal of Shellfish
Research 30:1-13.
Kenny, P.D., M.W. Michener, and D.M. Allen. 1990. Spatial and temporal patterns of oyster
settlement in a high salinity estuary. Journal of Shellfish Research 9:329-339.
La Peyre, M.K., B. Gossman, and J.F. La Peyre. 2009. Defining optimal freshwater flow for
oyster production: effect of freshet rate and magnitude of change and duration on eastern
oyster and Perkinsus marinus infection. Estuaries and Coasts 32:522-534.
Lenihan, H.S. 1999. Physical-biological coupling on oyster reefs: how habitat structure
influences individual performance. Ecological Monographs 69:251-275.
Lenihan, H.S. and C.H. Peterson. 2004. Conserving oyster reef habitat by switching from
dredging and tonging to diver-harvesting. Fishery Bulletin 102:298-305.
Lenihan, H.S., C.H. Peterson, J.E. Byers, J.H. Grabowski, G.W. Thayer, and D.R. Colby. 2001.
Cascading of habitat degradation: oyster reefs invaded by refugee fishes escaping stress.
Ecological Applications 11:764-782.
Lipcius, R.N. and R.P. Burke. 2006. Abundance, biomass and size structure of eastern oyster and
hooked mussel on a modular artificial reef in the Rappahannock River, Chesapeake Bay.
Applied Marine Science and Ocean Engineering, VIMS, Gloucester Point, Virginia.
No:390.
Livingston, R.J., R.L. Howell, X.F. Niu, F.G. Lewis, and G.C. Woodsum. 1999. Recovery of
oyster reefs (Crassostrea virginica) in a gulf estuary following disturbance by two
hurricanes. Bulletin of Marine Science 64:465-483.
Losee, Ellen. 1979. Relationship between larval and spat growth rates in the oyster (Crassostrea
virginica). Aquaculture 16:123-126.
Lotze, H.K., H.S. Lenihan, B.J. Bourque, R.G. Cooke, M.C. Kay, S.M. Kidwell, M.X. Kirby,
C.H. Peterson, and J.B.C. Jackson. 2006. Depletion, degradation, and recovery potential
of estuaries and coastal seas. Science 312:1806-1809.
Louisiana Department of Wildlife and Fisheries (LDWF). 2004. Louisiana’s oyster shell
recovery pilot project. Socioeconomics Research and Development Section and Marine
Fisheries Division.
Page 51
42
Luckenbach, M.W., L.D. Coen, P.G. Ross, Jr., and J.A. Stephen. 2005. Oyster reef habitat
restoration: relationships between oyster abundance and community development based
on two studies in Virginia and South Carolina. Journal of Coastal Research 40:64-78.
Macreadie, P.I., N.R. Geraldi, and C.H. Peterson. 2011. How small-scale variation in oyster reef
patchiness influences predation on bivalves. Marine Ecology Progress Series 429:87-91.
McCrea-Strub, A., K. Kleisner, U.R. Sumaila, W. Swartz, R. Watson, D. Zeller, and D. Pauly.
2011. Potential impact of the Deepwater Horizon oil spill on commercial fisheries in the
Gulf of Mexico. Fisheries 36:332-336.
McDonald, J. 1982. Divergent life history patterns in the co-occurring intertidal crabs Panopeus
herbstii and Eurypanopeus depressus (Crustacea: Brachyura: Xanthidae). Marine
Ecology Progress Series 8:173-180.
Meise, C.J. and L.L. Stehlik. 2003. Habitat use, temporal abundance variability, and diet of blue
crabs from a New Jersey estuarine system. Estuaries 26:731-745.
Melancon EJ, Soniat TM, Cheramie V, Dugas RJ, Barras J, and LaGarde M. 1998. Oyster
resource zones of the Barataria and Terrebonne estuaries of Louisiana. Journal of
Shellfish Research 17:1143-1148.
Meyer, D.L., and E.C. Townsend. 2000. Faunal utilization of created intertidal eastern oyster
(Crassostrea virginica) reefs in the Southeastern United States. Estuaries 23:34-45.
Newell, R.I.E. 1988. Ecological changes in Chesapeake Bay: are they the result of overharvesting
the eastern oyster (Crassostrea virginica)? In: Lynch M.P., E.C. Krome (eds)
Understanding the estuary. Advances in Chesapeake Bay research, Chesapeake Research
Consortium Publ 129, Gloucester Point, VA p 536-546 (available at
www.vims.edu/grelit/crc129.pdf).
Newell, R.I.E., T.R. Fisher, R.R. Holyoke, and J.C. Cornwell. 2000. Mortality of newly
metamorphosed eastern oysters (Crassostrea virginica Gmelin) in mesohaline
Chesapeake Bay. Marine Biology 136:665-676.
Newell, R.I.E., W.M. Kemp, J.D. Hagy III, C.F. Cerco, J.M. Testa, and W.R. Boynton. 2007.
Top down control of phytoplankton by oysters in Chesapeake Bay, USA: Comment on
Pomeroy et al. (2006). Marine Ecology Progress Series 341:293-298.
O’Beirn, F.X., M.W. Luckenbach, J.A. Nestlerode, and G.M. Coates. 2000. Toward design
criteria in constructed oyster reefs: oyster recruitment as a function of substrate type and
tidal height. Journal of Shellfish Research 19:387-395.
O’Connor, N.E., J.H. Grabowski, L.M. Ladwig, and J.F. Bruno. 2008. Simulated predator
extinctions: predator identity affects survival and recruitment of oysters. Ecology 89:428
438.
Page 52
43
Ortega, S. and J.P. Sutherland. 1992. Recruitment and growth of the eastern oyster, Crassostrea
virginica in North Carolina. Estuaries 15:158-170.
Oyster Metrics Workgroup. 2011. Restoration goals, quantitative metrics and assessment
protocols for evaluating success on restored oyster reef sanctuaries. Sustainable Fisheries
Goal Implementation Team of the Chesapeake Bay Program December 2011.
Pace, M.L., J.J. Cole, S.R. Carpenter, and J.F. Kitchell. 1999. Trophic cascades revealed in
diverse ecosystems. Trends in Ecology and Evolution 14:483-488.
Perkins-Visser, E., T.G. Wolcott, and D.L. Wolcott. 1996. Nursery role of seagrass beds:
enhanced growth of juvenile blue crabs (Callinectes sapidus Rathbun). Journal of
Experimental Marine Biology and Ecology 198:155-173.
Peterson, C.H. and R.N. Lipcius. 2003. Conceptual progress towards predicting quantitative
ecosystem benefits of ecological restorations. Marine Ecology Progress Series 264:297
307.
Peterson, C.H., J.H. Grabowski, and S.P. Powers. 2003. Estimated enhancement of fish
production resulting from restoring oyster reef habitat: quantitative valuation. Marine
Ecology Progress Series 264:249-264.
Peterson, C.H., H.C. Summerson, E. Thomson, H.S. Lenihan, J. Grabowski, L. Manning, F.
Micheli, and G. Johnson. 2000. Synthesis of linkages between benthic and fish
communities as a key to protecting essential fish habitat. Bulletin of Marine Science
66:759-774.
Piazza, B.P., P.D. Banks, and M.K. La Peyre. 2005. The potential for created oyster shell reefs as
a sustainable shoreline protection strategy in Louisiana. Restoration Ecology 13:499-506.
Piehler, M.F. and A.R. Smyth. 2011. Habitat-specific distinctions in estuarine denitrification
affect both ecosystem function and services. Ecosphere 2:art12.
Plunket, J. and M.K. La Peyre. 2005. Oyster beds as fish and macroinvertebrate habitat in
Barataria Bay, Louisiana. Bulletin of Marine Science 77:155-164.
Posey, M.H., T.D. Alphin, C.M. Powell, and E. Townsend. 1999. Use of oyster reefs as habitat
for epibenthic fish and decapods. In: Luckenbach, M.W., R. Mann and J.A. Wesson
(eds.), Oyster reef habitat restoration: a synopsis and synthesis of approaches. Gloucester
Point, Virginia: Virginia Institute of Marine Science Press, pp. 229-237.
Pollack, J.B., H. Kim, E.K. Morgan, and P.A. Montagna. 2011. Role of flood disturbance in
natural oyster (Crassostrea virginica) population maintenance in an estuary in south
Texas, USA. Estuaries and Coasts 34:187-197.
Page 53
44
Powell, E.N., J.N. Kraeuter, and K.A. Ashton-Alcox. 2006. How long does oyster shell last on an
oyster reef? Estuarine, Coastal and Shelf Science 69:531-542.
Powers, S.P., C.H. Peterson, J.H. Grabowski, and H.S. Lenihan. 2009. Success of constructed
oyster reefs in no-harvest sanctuaries: implications for restoration. Marine Ecology
Progress Series 389:159-170.
Rothschild, B.J., J.S. Ault, P. Goulletquer, and M. Heral. 1994. Decline of the Chesapeake Bay
oyster population: a century of habitat destruction and overfishing. Marine Ecology
Progress Series 111:29-39.
Scyphers, S.B., S.P. Powers, K.L. Heck, and D. Byron. 2011. Oyster reefs as natural breakwaters
mitigate shoreline loss and facilitate fisheries. PLoS One 6:e22396.
Soniat, T.M., C.M. Finelli, and J.T. Ruiz. 2004. Vertical structure and predator refuge mediate
oyster reef development and community dynamics. Journal of Experimental Marine
Biology and Ecology 310:163-182.
Spellerberg, I.F. and P.J. Fedor. 2003. A tribute of Claude Shannon (1916-2001) and a plea for
more rigorous use of species richness, species diversity and the ‘Shannon-Wiener’ Index.
Global Ecology and Biogeography 12:177-179.
Stuck, K.C. and H.M. Perry. 1992. Life history characteristics of Menippe adina in coastal
Mississippi waters. Fla Mar Res Publ 50:82-98.
Summerson, H.C. and C.H. Peterson. 1984. Role of predation in organizing benthic communities
of a temperate-zone seagrass bed. Marine Ecology Progress Series 15:63-77.
Supan, J. 1983. Evaluation of a leased oyster bottom in Mississippi Sound USA. Gulf Research
Reports 7:261-266.
Thompson, C.E.L. and C.L. Amos. 2002. The impact of mobile disarticulated shells of
Cerastoderma edulis on the abrasion of a cohesive substrate. Estuaries 25:204-214.
Tolley, S.G. and A.K. Volety. 2005. The role of oysters in habitat use of oyster reefs by resident
fishes and decapod crustaceans. Journal of Shellfish Research 24:1007-1012.
Zimmerman, R.J., T.J. Minello, and L.P. Rozas. 2002. Salt marsh linages to productivity of
penaeid shrimps and blue crabs in the Northern Gulf of Mexico. Concepts and
Controversies in Tidal Marsh Ecology 4:293-314.
Page 54
45
VITA
Laura Brown was born in November of 1987 in the beautiful mountains of Asheville,
North Carolina. Although raised around mountain streams, after a summer program at the coast
during her undergraduate days at the University of North Carolina-Chapel Hill (UNC), Laura
found her niche in marine ecology. She worked for three summers as an intern in Dr. Charles
Peterson’s laboratory, doing salt marsh and oyster reef ecology, and during the school year
worked in Dr. Justin Ries’s laboratory working in marine biogeochemistry. Throughout her time
at UNC, Laura helped answer questions about how increasing ocean acidification effects growth
of organisms that calcify carbon, including oysters and corals. Other projects looked at trophic
cascades across oyster reefs, and how overfishing can alter these interactions. She won the Mary
Watts-Hill award from UNC to continue her research over the summer of 2009.
After graduating from UNC in 2010, Laura spent a summer working as a snorkel and
SCUBA tour guide in Ketchikan, Alaska, taking cruise passengers through the kelp forests and
rocky intertidal waters of the Pacific while teaching them fun facts about the ecosystem. This
allowed Laura to expand her experience to cold water diving and Pacific ecosystems, and to
facilitate her love of marine systems.
Once her summer stint was over, Laura traveled to Baton Rouge, Louisiana, to pursue her
masters of science in biology at Louisiana State University (LSU) in Dr. Kenneth Brown’s
laboratory. During her time at LSU, Laura has been deeply involved in active research on the
Deepwater Horizon oil spill’s effect on oyster populations in Louisiana, including presenting
findings at national conferences. Her thesis work has allowed her to collaborate with groups such
as Louisiana Department of Wildlife and Fisheries, USGS, and The Nature Conservancy to help
Page 55
46
determine how differing oyster reef restoration efforts affect ecosystem services and their
functions over time. Her research will suggest best management practices for restoration projects
across the northern Gulf of Mexico. This research was also presented at national conferences.
Laura’s current interests are directed at maintaining sustainable marine ecosystems and lessening
anthropogenic effects on these already fragile systems.