Environ. Sci. Technoi. l98S9 23, 838-847 Triton X-405, 9002-93-1; Brij 35,9002-92-0. Literature Cited McBain, J. W.; Richards, P. H. Znd. Eng. Chem. 1946,38, 642. McBain, M. E. L.; Hutchinson, E. Solubilization and Re- lated Phenomena; Academic Press: New York, 1955. Elworthy, P. E.; Florence, A. T.; McFarlane, C. B. Solu- bilization by Surface Active Agents; Chapman and Hall: London, 1968. Mukerjee, P.; Mysels, K. J. Critical Micelle Concentrations of Aqueous Surfactant Systems; US. Dept. of Commerce: Washington, DC, 1971; NSRDS-NBS 36. Rosen, M. J. Surfactants and Interfacial Phenomena; John Wiley and Sons: New York, 1978. Schwartz, A. M.; Perry, J. W. Surface Active Agents-Their Chemistry and Technology; Robert E. Krieger Publishing Co.: Huntington. NY, 1978. Klevens, H. B. Chem. Rev. 1950,47,1. Tokiwa, F. J. Phys. Chem. 1968,72,1214. Moroi, Y.; Sato, K.; Noma, H.; Matuura, R. J. Phys. Chem. 1982,86, 2463. Moroi, Y.; Noma, H.; Matuura, R J. Phys. Chem. 1983,87, 812. Carter, W. C.; Suffet, I. H. Environ. Sei. Technol. 1982,16, 735. Chiou, C. T.; Malcolm, R. L.; Brinton, T. I.; Kile, D. E. Environ. Sei. Technol. 1986,20,502. Chiou, C. T.; Kile, D. E.; Brinton, T. I.; Malcolm, R. L.; Leenheer, J. A.; MacCarthy, P. Environ. Sci. Technol. 1987, 21,1231. Shinoda, K.; Hutchinson, E. J. Phys. Chem. 1962,66,517. Chiou, C. T.; Schmedding, D. W.; Manes, M. Environ. Sei. Technol. 1982, 16, 4. Chiou, C. T. Environ. Sei. Technol. 1985, 19, 57. Saito, S. J. Colloid Interface Sei. 1967, 24, 227. Nagarajan, R : ; Ruckenstein, E. In Surfactants in Solution; Mittal, K. L., Lindman, B., Eds.; Plenum: New York and London, 1984; Vol. 2, pp 923-947. Received for review September 26,1988. Accepted February 13, 1989. Oronation Byproducts. 2. Improvement of an Aqueous-Phase Derivatization Method for the Detection of Formaldehyde and Other Carbonyl Compounds Formed by the Oronation of Drinking Water William H. Glaze," Mlnoru Koga,+and Devon Cancilla Environmental Science and Engineering Program, School of Public Health, University of California, Los Angeles, Los Angeles, California 90024 A method for the determination of low molecular weight aldehydes in water using aqueous-phasederivatization with 0-(2,3,4,5,6-pentafluorobenzyl)hydroxylamine hydro- chloride has been improved by the use of high-resolution capillary GC. Detection limits with GC/ECD and GC/MS with selected ion monitoring are in the low microgram per liter (ppb) range. The method has been used to evaluate levels of aldehydes in three surface water treatment plants and one ground water treatment plant before and after ozonation. Aldehydes are increased as result of ozonation, with formaldehyde being the most prevalent. Higher yields are observed in the plant treating surface water with the highest TOC level, but very low yields are observed in a high TOC ground water. Spiking studies show that the raw ground water has a very high demand for form- aldehyde, suggesting that the aldehydes may be converted into secondary byproducts. Introduction Public water utilities have been searching for alterna- tives to the use of chlorine in drinking water treatment since the discovery of potentially harmful chlorination byproducts such as trihalomethanes. Of the alternatives, ozone is becoming increasingly attractive, especially for pretreatment and for treatment (I). It has been shown that the use of ozone is effective for removal of taste and odor compounds, color, and dissolved iron and manganese. Ozone treatment has also been shown to decrease tri- *To whom correspondenceshould be addressed. Current address: Department of Environmental Sciences and Engineering, University of North Carolina, Chapel Hill, NC 27599-7400. t Department of Environmental Health Engineering, University of Occupational and Environmental Health, Japan, Kitakyushu 807, Japan. halomethane formation potential and improve flocculation. Recently, ozone in combination with hydrogen peroxide has been shown to be effective for the oxidation of organics such as trichloro- and tetrachloroethylene in contaminated ground water (2, 3). In spite of the use of ozone in drinking water treatment for over eight decades, there is not enough information available about the formation of ozone byproducts during drinking water treatment or the fate of these byproducts in distribution systems. Of special interest are byproducts that may be toxic to humans or other species that use or may be exposed to ozonated water. Ozone, like chlorine, reacts with the natural constituents present in water to produce a number of byproducts (4-8). Ozone byproducts are usually oxygenated compounds, polar in nature, and sometimes unstable. As a result, the analyses of ozonation byproducts using conventional analytical techniques has proven to be difficult. In this paper we have modified a method first used by Yamada and Somiya (8) for the analysis of C1-CB carbonyl compounds in ozonated water and applied the modified method to the study of three full-scale water treatment plants and one pilot plant using ozonation. Methods for the Analysis of Carbonyl Compounds in Water In the first paper of this series (9) ozonation byproducts from a treatment plant were analyzed by the Closed Loop Stripping Analysis method. This method is exceptionally sensitive for neutral volatiles in the C6-CI5 range but fails to detect low molecular weight, polar compounds such as formaldehyde, glyoxal, etc. Techniques for direct aqueous derivatization, for example with 2,4-dinitrophenyl- hydrazine appear to be useful for the analyses of such compounds and have been widely used (10-12). Another 838 Environ. Sci. Technol., Vol. 23, No. 7, 1989 0013-936X/89/0923-0838$01.50/0 0 1989 American Chemical Society
Transcript
Environ. Sci. Technoi. l98S9 23, 838-847
Triton X-405, 9002-93-1; Brij 35, 9002-92-0.
L i t e r a t u r e Ci ted McBain, J. W.; Richards, P. H. Znd. Eng. Chem. 1946,38, 642. McBain, M. E. L.; Hutchinson, E. Solubilization and Re- lated Phenomena; Academic Press: New York, 1955. Elworthy, P. E.; Florence, A. T.; McFarlane, C. B. Solu- bilization by Surface Active Agents; Chapman and Hall: London, 1968. Mukerjee, P.; Mysels, K. J. Critical Micelle Concentrations of Aqueous Surfactant Systems; US. Dept. of Commerce: Washington, DC, 1971; NSRDS-NBS 36. Rosen, M. J. Surfactants and Interfacial Phenomena; John Wiley and Sons: New York, 1978. Schwartz, A. M.; Perry, J. W. Surface Active Agents-Their Chemistry and Technology; Robert E. Krieger Publishing Co.: Huntington. NY, 1978.
Klevens, H. B. Chem. Rev. 1950,47,1. Tokiwa, F. J. Phys. Chem. 1968, 72,1214. Moroi, Y.; Sato, K.; Noma, H.; Matuura, R. J. Phys. Chem. 1982,86, 2463. Moroi, Y.; Noma, H.; Matuura, R J. Phys. Chem. 1983,87, 812. Carter, W. C.; Suffet, I. H. Environ. Sei. Technol. 1982,16, 735. Chiou, C. T.; Malcolm, R. L.; Brinton, T. I.; Kile, D. E. Environ. Sei. Technol. 1986, 20, 502. Chiou, C. T.; Kile, D. E.; Brinton, T. I.; Malcolm, R. L.; Leenheer, J. A.; MacCarthy, P. Environ. Sci. Technol. 1987, 21, 1231. Shinoda, K.; Hutchinson, E. J. Phys. Chem. 1962,66,517. Chiou, C. T.; Schmedding, D. W.; Manes, M. Environ. Sei. Technol. 1982, 16, 4. Chiou, C. T. Environ. Sei. Technol. 1985, 19, 57. Saito, S. J. Colloid Interface Sei. 1967, 24, 227.
Nagarajan, R:; Ruckenstein, E. In Surfactants in Solution; Mittal, K. L., Lindman, B., Eds.; Plenum: New York and London, 1984; Vol. 2, pp 923-947.
Received for review September 26,1988. Accepted February 13, 1989.
Oronation Byproducts. 2. Improvement of an Aqueous-Phase Derivatization Method for the Detection of Formaldehyde and Other Carbonyl Compounds Formed by the Oronation of Drinking Water
William H. Glaze," Mlnoru Koga,+ and Devon Cancilla
Environmental Science and Engineering Program, School of Public Health, University of California, Los Angeles, Los Angeles, California 90024
A method for the determination of low molecular weight aldehydes in water using aqueous-phase derivatization with 0-(2,3,4,5,6-pentafluorobenzyl)hydroxylamine hydro- chloride has been improved by the use of high-resolution capillary GC. Detection limits with GC/ECD and GC/MS with selected ion monitoring are in the low microgram per liter (ppb) range. The method has been used to evaluate levels of aldehydes in three surface water treatment plants and one ground water treatment plant before and after ozonation. Aldehydes are increased as result of ozonation, with formaldehyde being the most prevalent. Higher yields are observed in the plant treating surface water with the highest TOC level, but very low yields are observed in a high TOC ground water. Spiking studies show that the raw ground water has a very high demand for form- aldehyde, suggesting that the aldehydes may be converted into secondary byproducts.
I n t r o d u c t i o n Public water utilities have been searching for alterna-
tives to the use of chlorine in drinking water treatment since the discovery of potentially harmful chlorination byproducts such as trihalomethanes. Of the alternatives, ozone is becoming increasingly attractive, especially for pretreatment and for treatment (I). It has been shown that the use of ozone is effective for removal of taste and odor compounds, color, and dissolved iron and manganese. Ozone treatment has also been shown to decrease tri-
*To whom correspondence should be addressed. Current address: Department of Environmental Sciences and Engineering, University of North Carolina, Chapel Hill, NC 27599-7400.
t Department of Environmental Health Engineering, University of Occupational and Environmental Health, Japan, Kitakyushu 807, Japan.
halomethane formation potential and improve flocculation. Recently, ozone in combination with hydrogen peroxide has been shown to be effective for the oxidation of organics such as trichloro- and tetrachloroethylene in contaminated ground water (2, 3).
In spite of the use of ozone in drinking water treatment for over eight decades, there is not enough information available about the formation of ozone byproducts during drinking water treatment or the fate of these byproducts in distribution systems. Of special interest are byproducts that may be toxic to humans or other species that use or may be exposed to ozonated water. Ozone, like chlorine, reacts with the natural constituents present in water to produce a number of byproducts (4-8). Ozone byproducts are usually oxygenated compounds, polar in nature, and sometimes unstable. As a result, the analyses of ozonation byproducts using conventional analytical techniques has proven to be difficult. In this paper we have modified a method first used by Yamada and Somiya (8) for the analysis of C1-CB carbonyl compounds in ozonated water and applied the modified method to the study of three full-scale water treatment plants and one pilot plant using ozonation.
M e t h o d s for t h e Ana lys i s of Carbonyl C o m p o u n d s i n W a t e r
In the first paper of this series (9) ozonation byproducts from a treatment plant were analyzed by the Closed Loop Stripping Analysis method. This method is exceptionally sensitive for neutral volatiles in the C6-CI5 range but fails to detect low molecular weight, polar compounds such as formaldehyde, glyoxal, etc. Techniques for direct aqueous derivatization, for example with 2,4-dinitrophenyl- hydrazine appear to be useful for the analyses of such compounds and have been widely used (10-12). Another
838 Environ. Sci. Technol., Vol. 23, No. 7, 1989 0013-936X/89/0923-0838$01.50/0 0 1989 American Chemical Society
reagent of interest is 0-(2,3,4,5,6-pentafluorobenzyl)- hydroxylamine (PFBOA), which reacts with carbonyl compounds in aqueous solution to form the corresponding oximes (eq 1). With most carbonyl compounds, except
-0.05 mL (1 drop) 18 N HzSO4
-1.0 mL n-hexane with internal standard (400 ug/L)
PFBOA (I)
I Ia I I b
for symmetrical ketones and formaldehydes, two geome- t r i d isomers of the derivatives will be formed, IIa and IIb. PFBOA derivatives are extractable with organic solvents such as hexane, are readily subject to gas chromatography, and are easily detected by electron capture or selective ion mass spectrometry. PFBOA has been successfully used to detect ketosteroids (13,14) and low molecular weight carbonyl compounds in aqueous solution (15).
Yamada and Somiya (8) used a PFBOA derivatization method to demonstrate for the first time the presence of low molecular weight aldehydes in ozonated surface and wastewater. Their method utilizes packed column GC, necessitating two temperature programs for analysis of carbonyl derivatives in the range of interest. Moreover, no details are available on the detection limit, linearity, or other significant descriptors of the analytical method.
amine hydrochloride (PFBOASHCl) (Aldrich Chemical, Milwaukee, WI) was prepared gravimetrically as a 1.0 mg/mL aqueous solution. About 135 mg of formaldehyde (37% solution in water), 50 mg of acetaldehyde, 125 mg of glyoxal (40% solution in water), and 125 mg of me- thylglyoxal (40% solution in water) were dissolved in 50 mL of water to make a 1000 ppm stock solution of all components. The stock solution was diluted with water to prepare standard solutions. Stock solutions of other aliphatic aldehydes (up to Clo), unsaturated aliphatic al- dehydes, benzaldehyde, and acetone were prepared in methanol and diluted with water. All chemicals used were reagent grade and obtained from Aldrich.
Water used for standard solutions, reagent solutions, and blanks had been prepared by a Millipore Super-Q water filter system. For some experiments Arrowhead distilled water, a commercially available bottled drinking water (Arrowhead Water Co., Monterey Park, CA) was used as received. To minimize traces of formaldehyde in either water source, it was distilled from acidified potassium permanganate after refluxing for several hours.
Hexane (Fisher, OPTIMA) was used as an extraction solvent. An internal standard, decafluorobiphenyl (Ald- rich, 99%), was added to the hexane at a concentration of 400 pg/L.
Analytical Procedure for Cakbonyl Compounds in Water. The analytical procedure for the determination of low molecular weight carbonyl compounds in water, which is essentially the same as that described by Yamada and Somiya (8), is shown in Figure 1. Five milliliters of water was collected in 10-mL screw-capped culture tubes. To this, 2 drops of a 0.1 M Na2S203 solution and 0.5 mL of the PFBOA solution were added. The solution was left a t room temperature for 2 h (Yamada and Somiya use 1 h) and then acidified with 1 drop of 18 N H2SOI. Deriv- atives were extracted in the same vial with 1 mL of n-
t HEXANE LAYER
5 mL 0.1 N HzSO4 t Anhydrous NazSO4 , t GC/ECD or GC/MS/SIM
Figure 1. Analytical procedure for carbonyl compounds in water using PFBOA derivatlzatlbn.
hexane containing the internal standard by shaking for 30 s. The hexane extract was transferred to another vial with a Pasteur pipet, shaken with 5 mL of 0.1 N H2S04, transferred again, and dried by adding -50 mg of an- hydrous sodium sulfate.
The extracts were analyzed by using either a Perkin- Elmer Model 8300 or Varian Model 3500 GC equipped with 63Ni electron capture detector (GC/ECD) or a Hew- lett-Packard Model 5890/5970 GC/MSD scanning in ei- ther the full scan (GC/MS) or selected ion mode fGC/ MS/SIM) for m / z 181 and 334, the latter for the internal standard. A 30 m X 0.32 mm chemically bonded DB-5 fused-silica column (J&W Scientific) was used for GC/ ECD analysis. For GC/MS, a 30 m X 0.25 mm DB-5 chemically bonded fused-silica column was used. The ionizing voltage of the mass spectrometer was 75 eV. In each case, the flow rate of helium as a carrier gas was kept a t 3 mL/min. The temperature program for the Perkin- Elmer GC and GC/MS was as follows: 50 O C isothermal for 1 min, programming to 220 "C at 5O/min, hold at 220 OC. With the Varian GC, used only for plants B and C, the final temperature was 250 "C. Retention times for standards and calibration curves were redetermined for the Varian GC since retention times were somewhat dif- ferent than with the other two instruments.
Water Samples. Water samples were collected from three full-scale plants that use ozone. The full-scale plants are located in the west coast, mid-south, and southern parta of the United States, and the pilot-scale plant is on the west coast. They will be referred to as plants A-D, re- spectively, in this report.
Diagrams of the four plants are shown in Figures 2-5. Plant A utilizes preozonation, ferric chloride/polymer treatment, coagulation/sedimentation, rapid multimedia filtration and postdisinfection with chlorine. Samples were collected from plant A between May 6 and May 16,1988. During this period water was treated by the plant under two conditions: (1) chlorination only, Le., with pre- chlorination at 1.9 mg/L replacing preozonation and (2) preozonation with postchlorination. Samples were col- lected at four locations within the plant: (Al) raw water, (A2) post-ozone contact basin, (A3) postfiitrated water, and
Arrowhead distilled water used as received. *Asterisks denote solvent partially evaporated. I, derivatized and extracted at UCLA, kept in freezer during trip. 11, derivatized and extracted at UCLA, carried hexane extracts to and from sites. eIII, deriva- tized and extracted at plant B, shipped hexane extracts with blue ice to UCLA. fIV, derivatized and extracted at plant C, shipped hexane extracts with blue ide to UCLA. g V , water shipped to and from site, derivatized and extracted at UCLA after travel com- oleted.
July 18,1988, from the following plant locations: (Bl) raw water, (B2) after permanganate treatment, (B3) from the aeration basin after first-stage ozonation, (B4) after the first point of chloramination, (B5) after second-stage ozonation, and (B6) from the plant effluent (Figure 3).
Plant C uses preaeration, primary ozonation, lime sof- tening, recarbonation, second-stage ozonation, filtration, and postchlorination. Samples from plant C were collected on July 20,1988, from the following plant locations: (Cl) raw water, (C2) after preozonation, (C3) after lime sof- tening, (C4) after recarbonation and midpoint ozonation, and (C5) after filtration and postchlorination from the following plant locations: (Cl) raw water, (C2) after preozonation, (C3) after lime softening, (C4) after re- carbonation and midpoint ozonation, and (C5) after fil- tration and postchlorination (Figure 4). Two different sets of ozone doses were used during the study.
Pilot plant D uses preozonation or preozonation with hydrogen peroxide, chemical treatment, coagulation/sed- imentation, dual media filtration, and postchlorination. Samples were collected between February 24 and March 15,1988, from the following locations: (Dl) raw water, (D2) after preozonation, (D3) after remainder of treatment except chlorination, and (D4) after postchlorination with 5-day storage (Figure 5).
Travel Blanks and Spikes. Arrowhead distilled water was used as received to prepare several sets of travel blanks and spikes. Formaldehyde, acetaldehyde, and glyoxal were spiked into the water to make solutions of 0 (background), 5.2,10.4, and 20.8 pg/L solutions. Duplicates samples were prepared for each of the cases shown in Table I. In the first (I), spiked samples were analyzed before the sampling
P)
C
-j R
C 0 Y
4 4 U
r
1
'I I
11
Retention Time (rain)
Figure 6. Reconstructed total ion chromatogram of PFBOA derivatives of carbonyl compounds. Code numbers of compounds refer to llst In Table 11.
trip and the hexane extracts stored in 2-mL minivials with PTFE-lined tops in a freezer (-20 "C) during the trip. The second (11) set of extracts, prepared exactly the same way, was carried for the entire trip in the minivials, during which they warmed up considerably. In some cases it was apparent that hexane had leaked from the vial during the trip. The third set of spikes (111) was transferred to 125- mL amber bottles with PTFE-lined screw caps, taken to plant B (a 3-day trip) in an ice chest packed with UOTEX polyfoam refrigerant packs (blue ice), and extracted on site, and the hexane extracts were sent back to UCLA in the chest with (refrozen) blue ice. The fourth set (IV) was handled exactly as the third, except that the water spikes made the trip to plant C, an extra day and a half. The f f i (V) set of spiked water samples was handled exactly the same as the third and fourth, except it was brought back to UCLA after the entire trip and reanalyzed. Analysis of each of the hexane extracts was made using GC/ECD as described above.
Formaldehyde Recovery Studies. Two sets of re- covery studies were carried out. The first used Arrowhead distilled water (as received) to prepare reagents and as one of the spiking media. The second used Arrowhead distilled water after distillation from acidic potassium per- manganate. After being spiked, the samples were left a t room temperature overnight, then derivatized, and ana- lyzed by GC/ECD according to the procedure described above. The 100 Mg/L spikes were analyzed by GC/MS/ SIM to avoid saturation of the ECD detector.
Results and Discussion GC Separation and Mass Spectra of PFBOA De-
rivatives. Figure 6 shows the high-resolution total ion chromatogram of a standard mixture of acetone and 17 aldehydes that had been derivatized by the PFBOA me- thod. Satisfactory separation among the PFBOA-deriva- tized compounds was obtained by utilizing the chroma- tographic conditions described in the experimental section, making it possible to analyze all of the aldehydes with a single GC run. The PFBOA derivatives of the tested carbonyl compounds, except formaldehyde and acetone, form the (S) and (2) geometrical isomers (IIa and I I b R1 = alkyl, R2 = H). Most, but not all of these isomer pairs can be separated by using the conditions described in the experimental section. GC retention data and mass spectral data of the tested carbonyl compounds are listed in Table 11. Figure 7 shows the full mass spectrum of the PFkOA
841 Environ. Sci. Technol., Vol. 23, No. 7, 1989
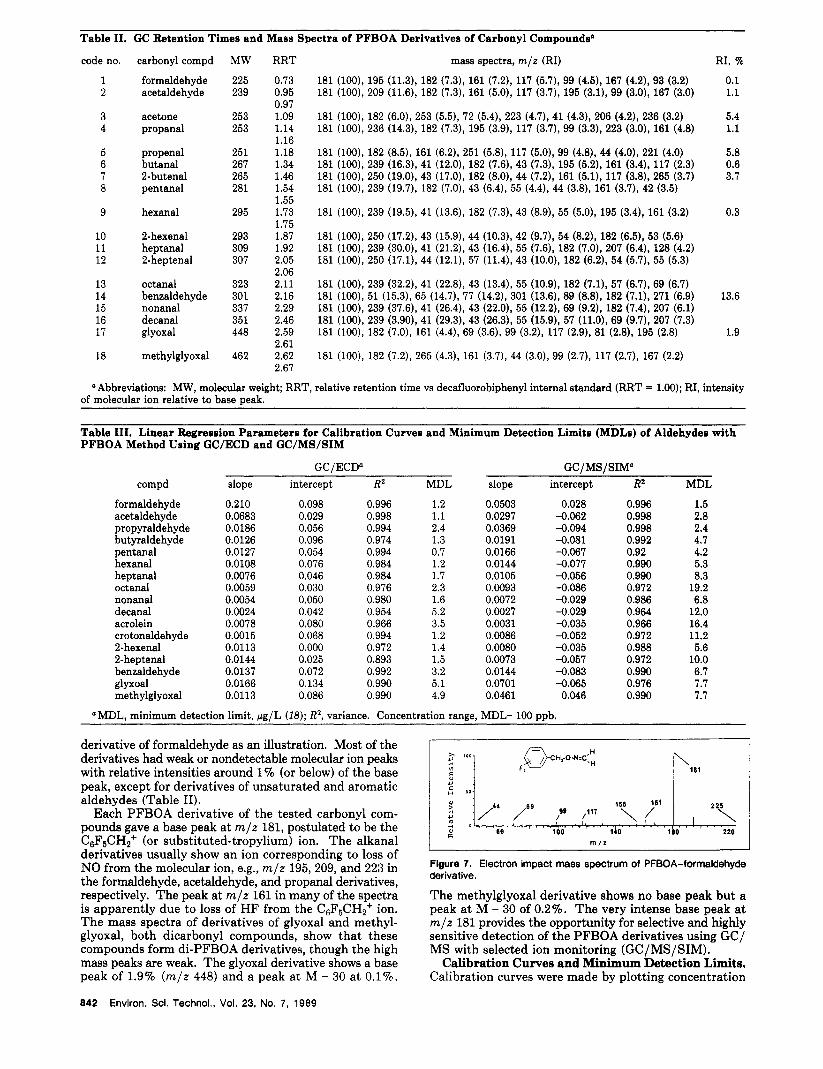
Table 11. GC Retention Times and Mass Spectra of PFBOA Derivatives of Carbonyl Compoundsa
" Abbreviations: MW, molecular weight; RRT, relative retention time vs decafluorobiphenyl internal standard (RRT = 1.00); RI, intensity of molecular ion relative to base peak.
Table 111. Linear Regression Parameters for Calibration Curves and Minimum Detection Limits (MDLs) of Aldehydes with PFBOA Method Using GC/ECD and GC/MS/SIM
derivative of formaldehyde as an illustration. Most of the derivatives had weak or nondetectable molecular ion peaks with relative intensities around 1 % (or below) of the base peak, except for derivatives of unsaturated and aromatic aldehydes (Table 11).
Each PFBOA derivative of the tested carbonyl com- pounds gave a base peak at m/z 181, postulated to be the C6F5CH2+ (or substituted-tropylium) ion. The alkanal derivatives usually show an ion corresponding to loss of NO from the molecular ion, e.g., m/z 195, 209, and 223 in the formaldehyde, acetaldehyde, and propanal derivatives, respectively. The peak at m/z 161 in many of the spectra is apparently due to loss of HF from the C6F5CH2+ ion. The mass spectra of derivatives of glyoxal and methyl- glyoxal, both dicarbonyl compounds, show that these compounds form di-PFBOA derivatives, though the high mass peaks are weak. The glyoxal derivative shows a base peak of 1.9% (m/ z 448) and a peak at M - 30 at 0.1%.
842 Environ. Sci. Technol., Vol. 23, No. 7, 1989
Figure 7. Electron impact mass spectrum of PFBOA-formaldehyde derivative.
The methylglyoxal derivative shows no base peak but a peak at M - 30 of 0.2%. The very intense base peak at m/z 181 provides the opportunity for selective and highly sensitive detection of the PFBOA derivatives using GC/ MS with selected ion monitoring (GC/MS/SIM).
Calibration Curves and Minimum Detection Limits. Calibration curves were made by plotting concentration
_. .
120 2 4 hr 0 60
REACTION TIME. KIN
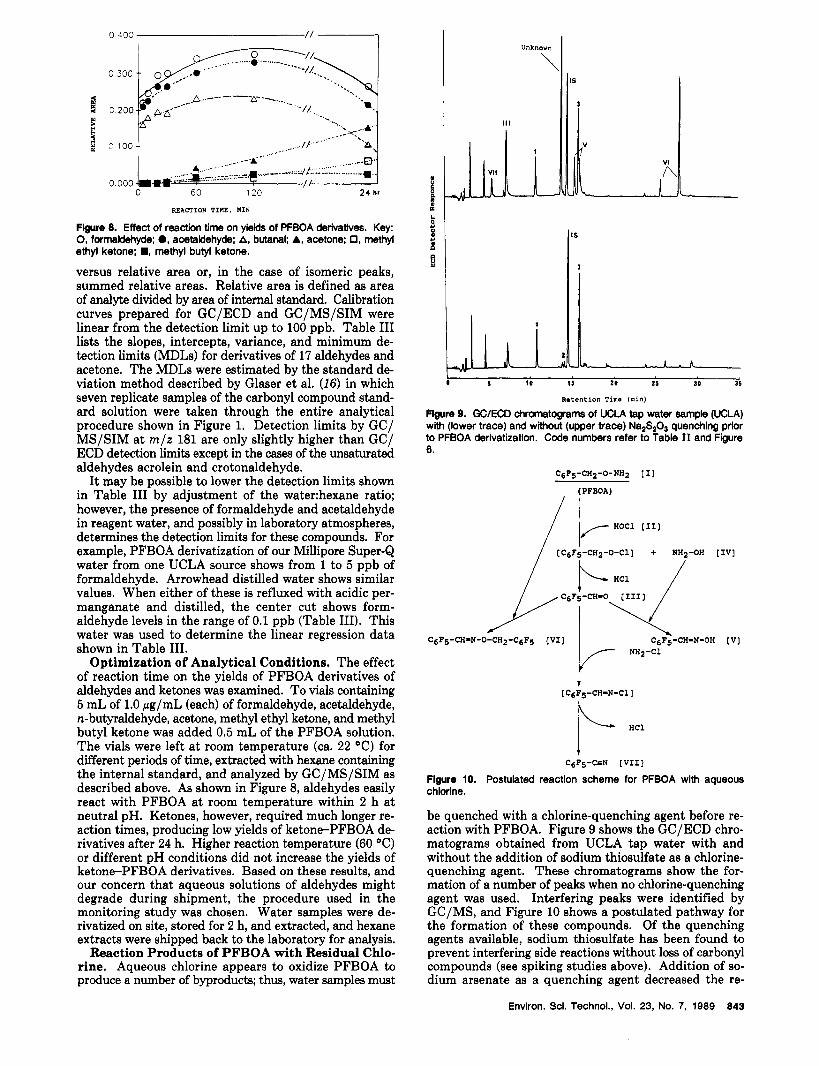
Figure 8. Effect of reaction time on yields of PFBOA derivatives. Key: 0, formaldehyde; 0, acetaldehyde: A, butanal; A, acetone; 0, methyl ethyl ketone; B, methyl butyl ketone.
versus relative area or, in the case of isomeric peaks, summed relative areas. Relative area is defined as area of analyte divided by area of internal standard. Calibration curves prepared for GC/ECD and GC/MS/SIM were linear from the detection limit up to 100 ppb. Table I11 lists the slopes, intercepts, variance, and minimum de- tection limits (MDLs) for derivatives of 17 aldehydes and acetone. The MDLs were estimated by the standard de- viation method described by Glaser et al. (16) in which seven replicate samples of the carbonyl compound stand- ard solution were taken through the entire analytical procedure shown in Figure 1. Detection limits by GC/ MS/SIM at m / z 181 are only slightly higher than GC/ ECD detection limits except in the cases of the unsaturated aldehydes acrolein and crotonaldehyde.
It may be possible to lower the detection limits shown in Table I11 by adjustment of the water:hexane ratio; however, the presence of formaldehyde and acetaldehyde in reagent water, and possibly in laboratory atmospheres, determines the detection limits for these compounds. For example, PFBOA derivatization of our Millipore Super-Q water from one UCLA source shows from 1 to 5 ppb of formaldehyde. Arrowhead distilled water shows similar values. When either of these is refluxed with acidic per- manganate and distilled, the center cut shows form- aldehyde levels in the range of 0.1 ppb (Table 111). This water was used to determine the linear regression data shown in Table 111.
Optimization of Analytical Conditions. The effect of reaction time on the yields of PFBOA derivatives of aldehydes and ketones was examined. To vials containing 5 mL of 1.0 pg/mL (each) of formaldehyde, acetaldehyde, n-butyraldehyde, acetone, methyl ethyl ketone, and methyl butyl ketone was added 0.5 mL of the PFBOA solution. The vials were left a t room temperature (ca. 22 "C) for different periods of time, extracted with hexane containing the internal standard, and analyzed by GC/MS/SIM as described above. As shown in Figure 8, aldehydes easily react with PFBOA at room temperature within 2 h at neutral pH. Ketones, however, required much longer re- action times, producing low yields of ketone-PFBOA de- rivatives after 24 h. Higher reaction temperature (60 "C) or different pH conditions did not increase the yields of ketone-PFBOA derivatives. Based on these results, and our concern that aqueous solutions of aldehydes might degrade during shipment, the procedure used in the monitoring study was chosen. Water samples were de- rivatized on site, stored for 2 h, and extracted, and hexane extracts were shipped back to the laboratory for analysis.
Reaction Products of PFBOA with Residual Chlo- rine. Aqueous chlorine appears to oxidize PFBOA to produce a number of byproducts; thus, water samples must
IS
5
I
I (0 15 LO 25 50 55
Retention Time (min)
Figure 9. GCIECD chromatograms of UCLA tap water sample (UCLA) with (lower trace) and without (upper trace) Na,S,O, quenching prior to PFBOA derlvatiration. Code numbers refer to Table I1 and Figure 6.
/ [C&-CH2-0-C11 + NHz-OH [IV]
HCI
t C6Fs-CcN [VII]
Figure 10. Postulated reaction scheme for PFBOA with aqueous chlorine.
be quenched with a chlorine-quenching agent before re- action with PFBOA. Figure 9 shows the GC/ECD chro- matograms obtained from UCLA tap water with and without the addition of sodium thiosulfate as a chlorine- quenching agent. These chromatograms show the for- mation of a number of peaks when no chlorine-quenching agent was used. Interfering peaks were identified by GC/MS, and Figure 10 shows a postulated pathway for the formation of these compounds. Of the quenching agents available, sodium thiosulfate has been found to prevent interfering side reactions without loss of carbonyl compounds (see spiking studies above). Addition of so- dium arsenate as a quenching agent decreased the re-
843 Environ. Sci. Technol., Vol. 23, No. 7, 1989
Table IV. Aldehyde Formation by Ozone Treatment at Plant A, a West Coast Surface Water Treatment Plant
1.6 Ob formaldehyde nd nd nd nd 1.2 formaldehyde nd 5.3 f 0.2 5.8 f 0.7 6.3 f 0.7 1.2 formaldehyde nd 8.4 f 0.1 11.0 f 0.2 8.0 f 0.1
(nd) (9.0 f 0.1) (11.7 f 0.7) (7.1 f 0.1)
"PFBOA derivatives analyzed with GC/ECD; values in parentheses analyzed with GC/MS/SIM, nd, lower than minimum detection limit; f, deviation of duplicate sample analysis. * Prechlorination at 1.9 mg/L substituted for preozonation.
Table V. Aldehyde Formation by Ozone Treatment at Plant B, a Mid-South Surface Water Treatment Plant
3.2 f 0.7 3.0 f 0.3 18.1 f 3.4 nd nd 3.2 f 1.1 nd nd 2.2 f 0.4 nd nd 4.2 f 0.2 nd nd 7.4 f 1.1 4.6 f 0.8 3.6 f 0.6 9.2 f 1.5 nd nd 5.9 f 1.2 nd nd 7.3 f 1.5
16.0 f 3.5 5.1 f 0 nd 3.0 f 0.2 9.7 f 0.1 nd 7.4 i 0.1 15.8 f 0.4
28.3 f 0.8 9.7 f 0.5 2.7 f 0.2 4.1 f 0.3
15.2 f 0.3 3.7 f 0.5
13.0 f 1.3 28.3 f 0.3
25.4 f 1.3 9.5 f 0.6 2.6 f 0.1 3.1 f 0.8 4.8 f 0.2 2.3 f 0.3 nd nd
" PFBOA derivatives analyzed with GC/ECD; nd, lower than minimum detection limit; f, deviation of duplicate analyses. Preozonation dose. Second-state ozonation dose.
coveries of PFBOA derivatives of formaldehyde, glyoxal, and methylglyoxal.
Carbonyl Byproducts of Ozonation in Drinking Water Treatment. The PFBOA method was used to determine the presence of aldehydes in samples taken from three full-scale water treatment plants and a pilot plant using ozonation. As described in the Experimental Section, the full-scale plants were located on the west coast (plant A), the mid-south (plant B), and the south (plant C) parts of the United States. The pilot plant (plant D) was also located on the west coast.
Plant A. Data from this study are shown in Table IV. No aldehydes were detected in water treatment at plant A by the usual treatment scheme except that pre- chlorination was used instead of preozonation. Form- aldehyde was detected after ozone treatment at location 2, persisting with little abatement through the remainder of the plant. No other aldehydes were detected. Deter- mination of formaldehyde using GC/MS/SIM provided good agreement with the data obtained with GC/ECD. The distribution system of this plant has also been studied cursorily and formaldehyde levels found were about the same as those that are shown in Table IV. However, formaldehyde has also been found in distribution systems using treatment without ozonation. Further information on levels of formaldehyde in distribution systems is the subject of a future report.
Plant B. Data obtained from the study of Plant B are shown in Table V. As noted, this plant treats water that is substantially higher in natural organics than plant A. Also, the plant uses a higher net ozone dose, applied in a two-stage process. At the time of sampling, ozone doses were 5.5 and 1.5 mg/L for first- and second-stage ozona- tion, respectively.
Figure 11 shows GC/ECD traces of PFBOA derivatives obtained from the raw water before entering plant B and after preozonation. It is apparent from these data that more carbonyl species were formed when this water was ozonated, and their concentrations are higher than from
844 Environ. Sci. Technol., Vol. 23, No. 7, 1989
I O I (0 (I 20 25 10 I5 40
Retention Time (min)
Flgure 11. GC/ECD traces of PFBOA derivatives of carbonyl com- pounds in samples from plant B before (above) and after (below) preozonation. Code numbers refer to Table 11.
plant A. Glyoxal and methylglyoxal were apparently formed in yields comparable to formaldehyde, but were not found in finished water. It is possible that post- chloramination has an effect on the levels of these com- pounds, but a mechanism to explain such an effect is not known.
Plant C. This plant uses a dual-stage ozonation process to treat a ground water that was rich in organic and sulfur compounds. (The first stage of treatment was aeration to remove hydrogen sulfide, and the plant site has a strong odor of hydrogen sulfide.) During the sampling period two different ozone doses were used in the plant. The first sampling was performed while the total ozone dose rate was -5 mg/L. The time between the change of the ozone
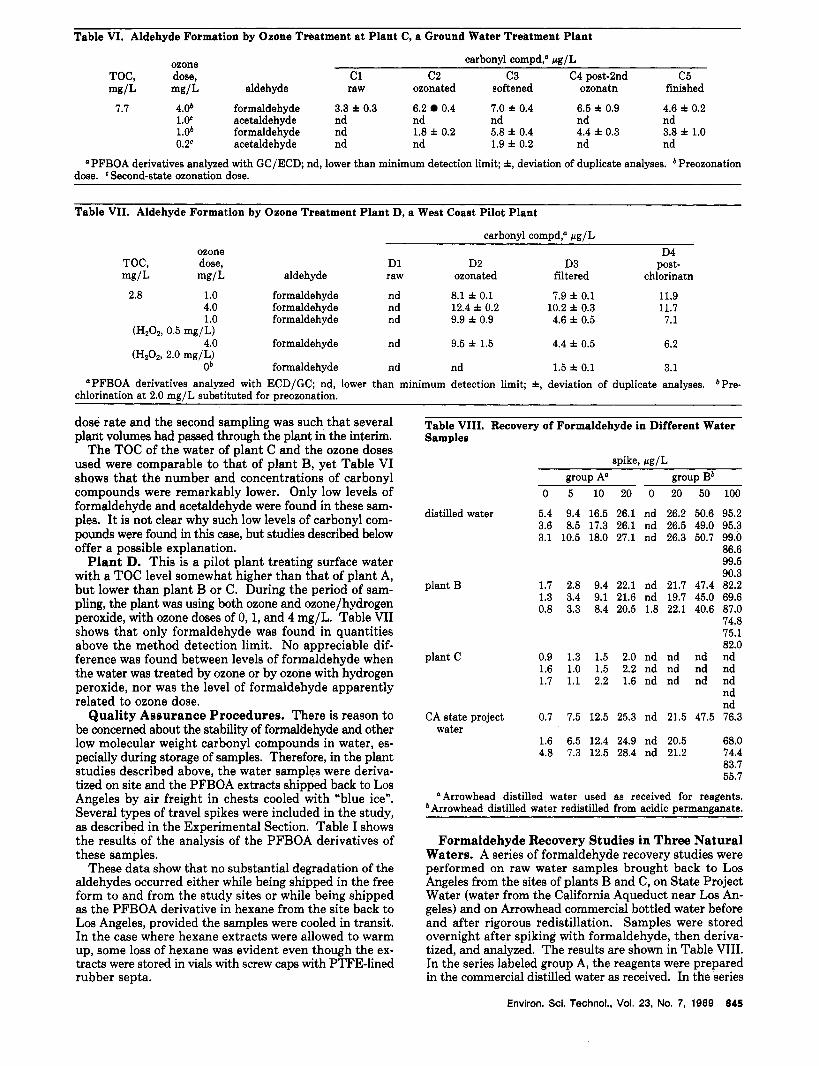
Table VI. Aldehyde Formation by Ozone Treatment at Plant C, a Ground Water Treatment Plant
ozone TOC. dose,
carbonyl compd,' rg/L c1 c2 c 3 C4 ~ost-2nd c 5
mg/L mg/L aldehyde raw ozonated softened oionatn finished
4.6 f 0.2 1.oc acetaldehyde nd nd nd nd nd 1.0b formaldehyde nd 1.8 f 0.2 5.8 f 0.4 4.4 f 0.3 3.8 f 1.0 0.2' acetaldehyde nd nd 1.9 f 0.2 nd nd
7.7 4.0b formaldehyde 3.3 f 0.3 6.2 0.4 7.0 f 0.4 6.5 f 0.9
a PFBOA derivatives analyzed with GC/ECD; nd, lower than minimum detection limit; f, deviation of duplicate analyses. Preozonation dose. Second-state ozonation dose.
Table VII. Aldehyde Formation by Ozone Treatment Plant D, a West Coast Pilot Plant
4.0 formaldehyde nd 12.4 f 0.2 10.2 f 0.3 11.7 1.0 formaldehyde nd 9.9 f 0.9 4.6 f 0.5 7.1
4.0 formaldehyde nd 9.5 * 1.5 4.4 f 0.5 6.2
Ob formaldehyde nd nd 1.5 f 0.1 3.1 "PFBOA derivatives analyzed with ECD/GC; nd, lower than minimum detection limit; f, deviation of duplicate analyses. bPre-
chlorination at 2.0 mg/L substituted for preozonation.
dose rate and the second sampling was such that several plant volumes had passed through the plant in the interim.
The TOC of the water of plant C and the ozone doses used were comparable to that of plant B, yet Table VI shows that the number and concentrations of carbonyl compounds were remarkably lower. Only low levels of formaldehyde and acetaldehyde were found in these sam- ples. It is not clear why such low levels of carbonyl com- pounds were found in this case, but studies described below offer a possible explanation.
Plant D. This is a pilot plant treating surface water with a TOC level somewhat higher than that of plant A, but lower than plant B or C. During the period of sam- pling, the plant was using both ozone and ozone/hydrogen peroxide, with ozone doses of 0, 1, and 4 mg/L. Table VI1 shows that only formaldehyde was found in quantities above the method detection limit. No appreciable dif- ference was found between levels of formaldehyde when the water was treated by ozone or by ozone with hydrogen peroxide, nor was the level of formaldehyde apparently related to ozone dose.
Quality Assurance Procedures. There is reason to be concerned about the stability of formaldehyde and other low molecular weight carbonyl compounds in water, es- pecially during storage of samples. Therefore, in the plant studies described above, the water samples were deriva- tized on site and the PFBOA extracts shipped back to Los Angeles by air freight in chests cooled with "blue ice". Several types of travel spikes were included in the study, as described in the Experimental Section. Table I shows the results of the analysis of the PFBOA derivatives of these samples.
These data show that no substantial degradation of the aldehydes occurred either while being shipped in the free form to and from the study sites or while being shipped as the PFBOA derivative in hexane from the site back to Los Angeles, provided the samples were cooled in transit. In the case where hexane extracts were allowed to warm up, some loss of hexane was evident even though the ex- tracts were stored in vials with screw caps with PTFE-lined rubber septa.
Table VIII. Recovery of Formaldehyde in Different Water Samples
" Arrowhead distilled water used as received for reagents. Arrowhead distilled water redistilled from acidic permanganate.
water
Formaldehyde Recovery Studies in Three Natural Waters. A series of formaldehyde recovery studies were performed on raw water samples brought back to Los Angeles from the sites of plants B and C, on State Project Water (water from the California Aqueduct near Los An- geles) and on Arrowhead commercial bottled water before and after rigorous redistillation. Samples were stored overnight after spiking with formaldehyde, then deriva- tized, and analyzed. The results are shown in Table VIII. In the series labeled group A, the reagents were prepared in the commercial distilled water as received. In the series
Environ. Sci. Technol., Vol. 23. NO. 7, 1989 845
labeled group B, the reagents were prepared in the same water after rigorous redistillation from acidic per- manganate.
The results show recovery of formaldehyde is good in the redistilled water and in all of the surface waters, except for slightly depressed recoveries at the 100 pg/L level. No recovery was obtained in the raw water from plant C with doses of formaldehyde up to 100 pg/L. It is not clear why this is the case, but given the rather high reactivity of formaldehyde, it is possible that it and other carbonyl compounds formed by ozonation may react with other constituents present in this water. One constituent that is present in the ground water that is probably not present in the surface waters is hydrogen sulfide (see above). Both hydrogen sulfide and organic thiols are known to react with carbonyl compounds to form gem-thioglycols and hemi- thioacetals (1 7). Also, the reaction between formaldehyde and sulfite, an oxidation product of sulfide, is well-known (18). Thus, it is possible that the low levels of form- aldehyde found after ozonation of plant C water and the low recoveries of formaldehyde in this water are due to reactions with these contaminants. It is not clear, however, if these reactions occur when formaldehyde is in the mi- crogram per liter range or if they would interfere with the PFBOA derivatization process.
To provide more evidence on this subject, samples of redistilled water containing 1.0 mg/L added formaldehyde were spiked with hydrogen sulfide (64 mg/L) or sodium sulfite (2.0 mg/L). As expected, formaldehyde was con- sumed in both cases: 74% in the case of hydrogen sulfide and 50% in the case of sulfite. Again, it is not clear that this is the explanation for the unusual results observed in plant C water. However, the results suggest a more general principle: primary ozone byproducts as reactive as car- bonyl compounds may react with constituents in the water to produce secondary byproducts. Thus, the logic that is used to predict the types of ozone byproducts to search for in monitoring studies (1) must be extended. One must also use chemical knowledge plus the known characteristics of the source water to search for possible secondary by- products.
Summary and Conclusions The PFBOA derivatization method appears to be a
convenient method that is sensitive enough to detect al- dehydes in drinking water a t low ppb levels. The use of high-resolution capillary GC allows one to determine al- dehydes in the C1-C7 range, as well as glyoxal and me- thylglyoxal, with a single 35-min GC run. The most fa- vorable detection limits are obtained with electron capture detection, but the PFBOA derivatives have a strong peak at m/z 181 that makes GC/MS/SIM a method of com- parable sensitivity. When used for field monitoring studies, water samples should be derivatized with PFBOA on site and the hexane extracts shipped in refrigerated chests.
Experiments at three full-scale drinking water treatment plants and a pilot plant provide evidence that ozone treatment produces measurable amounts of formaldehyde in all of the plants studied. For the three surface water plants (A, B, and D), the amount of formaldehyde found in finished water is roughly proportional to the TOC of the influent. In the surface water of highest TOC level, many aldehydic compounds other than formaldehyde were detected, particularly glyoxal and methyl glyoxal, sug- gesting that these compounds may also be present in the other plant effluents below their detection limits. Most of the aldehydes remain after chemical flocculation, fil- tration, and chlorination. Unexpectedly low levels of
carbonyl byproducts were found in a high TOC ground water after ozone treatment. I t is not clear what agents are present in the water that are responsible for these results; however, high levels of hydrogen sulfide are present in the raw water. Laboratory experiments confirm that formaldehyde and hydrogen sulfide (or its oxidation product, sulfite) react with formaldehyde.
Implications of the Presence of Carbonyl Compounds in Drinking Water
Formaldehyde is a product of natural metabolic pro- cesses and is produced for commercial purposes in massive quantities. These sources of formaldehyde combine to make formaldehyde a ubiquitous chemical in the envi- ronment (19-22). Because formaldehyde has shown evi- dence of mutagenicity and carcinogenicity (23-29) in lab- oratory experiments, the question of possible health effects from chronic low-dose formaldehyde exposure has been raised (30). Inhalation studies have demonstrated health risks when animals are exposed to formaldehyde in the gas phase; however, effects observed from chronic ingestion of formaldehyde have been limited to mild pharyngeal and gastric discomfort, for humans, to slight, inconsistent ef- fects on conditioned reflexes and histologic changes in the liver and spleen of rats (31). Guidance levels have been proposed for short-term exposure to formaldehyde in drinking water of 0.11 mg/L for adults (32) and 0.030 mg/L for children (31), both using noncarcinogenic effects.
A t this time no severe health effects can be attributed to the low levels of formaldehyde and other carbonyl compounds formed when ozone is used in drinking water treatment, but based on the reactivity of carbonyl com- pounds with nucleophiles, there is reason for concern (33). As the production of carbonyl compounds appears to de- pend on the raw water characteristics, and possibly on treatment conditions such as ozone dose rate, form- aldehyde and other carbonyl compounds in ozone-treated water should be monitored on a more extensive basis. Further, more studies should be done to determine the possible health effects of low concentrations of selected carbonyl compounds in drinking water and the nature of the secondary byproducts that may form when ozone is used in drinking water treatment.
Acknowledgments
We are particularly appreciative to Dr. H. Yamada of Kyoto University for discussion of her seminal work on aldehydes in drinking water, to laboratory personnel of MWDSC, especially Stewart Krasner, and to our colleagues J.-W. Kang, K. Wang, J. Zarnoch and T. Woiwode for their help in this work.
Literature Cited (1) Glaze, W. Enuiron. Sci. Technol. 1987, 21, 224-230. (2) Glaze, W. H.; Kang, J . W. J.-Am. Water Works Assoc.
1988, 80, 57-63. (3) Aieta, E. M.; Reagan, K. M.; Lang, J. S.; McReynalds, L.;
Kang, J. W.; Glaze, W. H . J.-Am. Water Works Assoc. 1988,80, 64-72.
846 Environ. Sci. Technol., Vol. 23, No. 7, 1989
(4) Sievers, R. E.; Batkely, R. M.; Eiceman, G. A.; Shapiro, R. H.; Walton, H. F.; Kolonko, K. J.; Field, L. R. J. Chro- matogr. 1977, 142, 745-754.
(5) Lawrence, J.; Toshine, H.; Onuska, F. I.; Comba, M. E. Ozone: Sei. Eng. 1980, 2, 55-64.
(6) Schalekamp, M. Ozone: Sci. Eng. 1986, 8, 151-186. (7) Killops, S. D. Water Res. 1986, 20, 1537165. (8) Yamada, H.; Somiya, I. Ozone: Sci. Eng. 1989,11,125-141. (9) Part 1: Glaze, W. H.; Koga, M.; Ruth, E. C.; Cancilla, D.
Application of closed loop stripping and XAD resin ad- sorption for the determination of ozone by-products from natural water. In Biohazards of Drinking Water Treat- ment; Larson, R., Ed.; Lewis Publishers Inc.: Alexandria, VA, 1988; Chapter 16.
(10) Fung, K.; Grosjean, D. Anal. Chem. 1981, 53, 168-171. (11) Selim, S. J. Chromatogr. 1977, 136, 271-277. (12) Graven, J. T.; Giabbai, M. F.; Pohland, F. G. In Form-
aldehyde: Analytical Chemistry and Toxicology; Turoski, V., Ed.; Advances in Chemistry 210; American Chemical Society: Washington, DC, 1985; pp 43-55.
(13) Kosy, K. T.; Kaiser, D. G.; Van Der Slik, A. L. J. Chro- matogr. Sei. 1975, 13, 97-104.
(14) Nambara, T.; Kigawa, K.; Iwata, T.; Ibuki, M. J. Chro- matogr. 1975, 114, 81-86.
(15) Kobayashi, K.; Tanaka, M.; Kawai, S.; Ohno, T. J. Chro- matogr. 1979, 176, 118-122.
(16) Glaser, J. A.; Foerst, D. L.; McKee, G. D.; Quave, S. A,; Budde, W. L. Enuiron. Sei. Technol. 1981,15, 1426-1435.
(17) Ogata, Y.; Kawasaki, A. In The Chemistry of the Carbonyl Group; Zabicky, J., Ed.; Interscience Publishers: London,
(18) Walker, F. J. Formaldehyde; Reinhold Publishing Corp.: New York, 1964; pp 483-510.
(19) Mansfield, C. T.; Hodge, B. T.; Hege, R. B., Jr.; Hamlin, W. C. J. Chromatogr. Sei. 1977, 15, 301-302.
(20) Cleveland, W. S.; Graedel, T. E.; Kleiner, B. Atmos. En- viron. 1977, 11, 357-360.
(21) Lipari, F.; Dasch, J. M.; Scruggs, W. F. Environ. Sei. Technol. 1984, 18, 326-330.
(22) Preuss, P. W.; Dailey, R. L.; Lehman, E. S. In Form- aldehyde: Analytical Chemistry and Toxicology; Turoski, V., Ed.; Advances in Chemistry 210; American Chemical Society: Washington, DC, 1985; pp 247-259.
(23) Sasaki, Y.; Endo, R. Mutat . Res. 1978,54, 251-252.
1970, Vol. 2, pp 38-42.
(24) Swenberg, J.; Kerns, E. D.; Mitchell, R. I.; Gralla, E. J.; Pavkov, K. L. Cancer Res. 1980,40, 3398-3402.
(25) Griesemer, R. A,; Ulsamer, A. G.; Arcos, J. C.; Beall, J. R.; Blair, A. E.; Collins, T. F. X.; de Serres, F. J.; Everson, R. B.; Gamble, J. F.; Gaylor, D. W.; Groth, D. H.; Kang, H. K.; Keenlyside, R. A.; Lloyd, J. W.; Nettesheim, P.; Saffiotti, U.; Weisburger, E. K. EHP, Enuiron. Health Perspect. 1982,
(26) Albert, R. E.; Sellakumar, A. R.; Laskin, S.; Kuschner, M.; Nelson, N.; Snyder, C. A. J. Natl . Cancer Inst . 1982, 68,
(27) Kerns, W. D.; Pavkov, K. L.; Donofrio, D. J.; Gralla, E. J.; Swenberg, J. A. Cancer Res. 1983,43, 4382-4392.
(28) Bernstein, R. S.; Stayner, L. T.; Elliott, L. J.; Kimbrough, R.; Falk, H.; Blade, L. Am. Ind. Hyg. Assoc. J. 1984, 45,
(29) Marnett, L. J.; Hurd, H. K.; Hollstein, M. C.; Levin, D. E.; Esterbauer, H.; Ames, B. N. Mutat. Res. 1985,148,25-34.
(30) Scheupein, R. J. In Formaldehyde: Analytical Chemistry and Toxicology; Turoski, V., Ed.; Advances in Chemistry 210; American Chemistry Society: Washington, DC, 1985;
(31) U.S. Environmental Protection Agency, Draft Informal Guidance Document, Washington, DC, Office of Drinking Water, 1981.
(32) NAS/NRC, Committee on Aldehydes. Formaldehyde and Other Aldehydes; Board of Toxicology and Environmental Health Hazards, Assembly of Life Sciences; National Academy Press: Washington, DC, 1981; p p 276-287.
(33) National Academy of Sciences. Drinkrng Water and Health; National Academy of Sciences: Washington, DC,
43, 139-168.
597-603.
778-785.
pp 237-245.
1987; pp 152-153.
Received for review September 16,1988. Accepted February 23, 1989. W e are grateful for support t o the following agencies: the city of Los Angeles, Department of Water and Power (in part from funds derived from U S . E P A Cooperative Agreement CR-813188-01-0); the Metropolitan Water District of Southern California (MWDSC); the University of California Water Re- sources Center; the U C L A Center for Hazardous Substances Control; and the UC Toxic Substances Research and Teaching Program. This article has not been subjected to review by the U S . EPA. Therefore, i t does not necessarily reflect the views of this agency, and no official endorsement should be inferred.