Page 1
Prepared by INSIGHT NUMERICS
OLIVER HEYNES
[email protected]
INSIGHT NUMERICS | 51 Melcher Street 1st Floor, Boston, MA 02210, USA
Issue 01: 23rd April 2015
P-12 Docking Platform
Fire and Gas Mapping Report
Page 2
Disclaimer This report is an example of a typical fire and gas mapping report using Detect3D, produced for
demonstration and marketing purposes only.
The work detailed in this report is purely an invention, and did not occur for an actual project. The
geometry used is publically available.
Page 3
Contents Disclaimer ..........................................................................................................................................2
Introduction ......................................................................................................................................4
Methodology .....................................................................................................................................4
Software Description ................................................................................................................................ 4
Geometry Import ...................................................................................................................................... 4
Detector Import from MS Excel ................................................................................................................ 5
Flame Detector Field of View .................................................................................................................... 6
Zone Definition ......................................................................................................................................... 7
Coverage Calculation ................................................................................................................................ 8
Performance Targets ..........................................................................................................................9
Current Layout Coverage Results ........................................................................................................9
Zone PZ-L-001 ........................................................................................................................................... 9
Flame Detector Coverage ..................................................................................................................... 9
Gas Detector Coverage ....................................................................................................................... 11
Zone PZ-L-002 ......................................................................................................................................... 13
Flame Detector Coverage ................................................................................................................... 13
Gas Detector Coverage ....................................................................................................................... 13
Improved Coverage Layout and Results ............................................................................................ 15
Zone PZ-L-001 ......................................................................................................................................... 15
Flame Detector Coverage ................................................................................................................... 15
Gas Detector Coverage ....................................................................................................................... 17
Zone PZ-L-002 ......................................................................................................................................... 18
Flame Detector Coverage ................................................................................................................... 18
Gas Detector Coverage ....................................................................................................................... 19
Conclusions ..................................................................................................................................... 20
Appendix A – Revised Flame Detector Layout Work Pack .................................................................. 21
Page 4
Introduction The P-12 platform is an offshore tanker docking station currently located at the client’s facility in
the Gulf of Oman. Originally installed in the early 1980’s, the detection systems have been
adjusted multiple times due to design changes and improvements. The client is now carrying out
a full safety review of facilities in this area. As part of that review, fire and gas mapping is required
for all offshore platforms including P-12. This report details the results of the assessment of the
current detector layout, and provides recommendations for low-cost improvements.
Methodology
Software Description The Fire and Gas Mapping was performed using the state-of-the-art software Detect3D developed
by Insight Numerics. Detect3D is a widely used software product for Fire and Gas mapping, and
has the advantage that it can interface directly with CAD. The primary technology of Detect3D is
the highly accurate and fast ray-casting used for flame detector calculations. Both fire and gas
detectors were considered in this study.
Geometry Import Three-dimensional CAD files were available for this site from a recent review. The CAD was
originally created in Aveva PDMS and output directly to a DGN file, which was read into Detect3D.
The resulting geometry is shown in Figure 1 below. The original triangle count was 1.6 million
triangles, but using Detect3D’s mesh simplification techniques, this was reduced to just over
500,000 triangles.
Figure 1. A screenshot of Detect3D showing the P-12 geometry used in the project.
Page 5
Detector Import from MS Excel The locations and orientations for the fire and gas detectors were available in Microsoft Excel
format. These were imported using Detect3D’s Excel import tool. A plan view of the detector
locations is shown below.
Figure 2. Plan view of the P-12 platform showing the locations of the flame detectors
(unobstructed FOV shown in green for FD-009)
Figure 3. Plan view of the P-12 platform showing the locations of the point gas detectors
A flame detector
A point gas detector
Page 6
Flame Detector Field of View The flame detector used on the P-12 is the Honeywell Analytics Fire Sentry SS-4 UV/IR flame
detector. The specifications for the Field of View (FOV) were specified in the manual available
online, and input into Detect3D as shown below. The sensitivity was set to HIGH, resulting in a
maximum range of 65 feet with a wide viewing angle of 120° in both the horizontal and vertical
planes. The FOV in Detect3D in the Flame Detector Model Viewer is shown below.
Figure 4. The Honeywell SS-4 detector FOV for a 1 ft2 n-Heptane pan file
Figure 5. Three-dimensional view of the Honeywell SS-4 FOV in the Detect3D model for FD-009
Page 7
Zone Definition Two zones were identified on the platform for the coverage, and are show in plan view and
perspective view below. The two zones are PZ-L-001 (yellow) and PZ-L-002 (orange).
Figure 6. Plan view of the P-12 platform showing the location of the two zones
Figure 7. The two zones in perspective view in Detect3D
Page 8
Coverage Calculation The calculation of coverage for both the flame and gas detectors was performed in Detect3D by
filling each zone with a point cloud of 0.125 meter spacing. The software calculated the coverage
of each point, and used this data to calculate volume-based coverage statistics.
A unique aspect of Detect3D is its ability to account for equipment volume. The software contains
specialized algorithms to determine if points are inside, or outside, equipment. Point that are
inside equipment do not count towards the coverage calculation – effectively, Detect3D does not
penalize the detectors for not being able to cover volumes inside equipment.
An example of the equipment volume for PZ-L-001 is shown on the figure below. The purple
volumes indicated where Detect3D calculated the points were inside equipment.
Accounting for the equipment volume reduced the total volume of PZ-L-001 from 355.8 m3 to
323.4 m3, and from 363.9 m3 to 320.2 m3 for PZ-L-002. Although the changes may seem small,
they are, in fact, critical when attempting to achieve 90% coverage.
Figure 8. The equipment volume calculated in Detect3D for PZ-L-001
Page 9
Performance Targets The performance target set by the client’s internal Fire and Gas Philosophy is as follows:
90% 1ooN coverage (one or more detectors)
50% 2ooN coverage (two or more detectors)
Current Layout Coverage Results
Zone PZ-L-001
Flame Detector Coverage The flame detector coverage for Zone PZ-L-001 was calculated in Detect3D by performing ray
casting for all the detectors imported from the original Excel spreadsheet. An example of the ray
casting for one of the flame detectors is shown below. The resolution of the detectors was set to
1° with 2 adaptive refinements, resulting in an effective resolution of 0.25°. The typical
computation time for a single detector was 3 seconds.
The flame detector coverage for the zone was calculated in Detect3D by filling the zone with a
point cloud of 0.125 meter resolution, resulting in nearly 200,000 points for PZ-L-001. The visibility
of each point was determined to each detector by calculating whether the point was within the
obstructed FOV. The data for each point was then compiled into a statistical data set for the
coverage of the zone. The results of the coverage assessment were output from Detect3D to Excel,
and are shown below:
Figure 9. The obstructed FOV of FD-009 in Detect3D, generated from 148,000 rays (4 seconds computation time)
Page 10
Fire Zone Zero (0ooN) 1 or more (≥ 1ooN) 2 or more (≥ 2ooN) 3 or more (≥ 3ooN)
Zone PZ-L-001 16.2% 83.8% 45.5% 18.4%
As can be seen from the data, the detector layout does not comply with the required performance
standard, as the 1ooN coverage is 83.8% (at least 90% coverage is required) and the 2ooN
coverage is 45.5% (50% coverage required).
Note that the coverage given by Detect3D is volume-based, and is not dependent on the height
of a plan under consideration.
The coverage of the zone can be visualized in two and three dimensions, using contours (shown
at 2 meters height above the base of the zone in Figure 10 and isovolumes of zero coverage in
Figure 11).
Both the coverage contours and isovolumes reveal the complex coverage of the detectors. The
output also demonstrates the accuracy of Detect3D, and the software’s ability to capture the
details of the obstructions present on the platform to the detectors.
Figure 10. Flame detector coverage contour at 2 meters height above the zone base – color key shown at bottom-right
Page 11
Gas Detector Coverage The gas detector coverage in PZ-L-001 was calculated using the “Design Gas Cloud” approach
commonly used for standard similar to BP and Shell. This approach uses a spherical gas cloud of a
certain diameter, at the LEL concentration, to determine the coverage. The coverage for each
point in the zone is calculated by positioning the center of the gas cloud at that point, and
calculating the number of detectors that would be in alarm.
For the purposes of the initial assessment, a gas cloud diameter of 5 meters has been used. Based
on this gas cloud, the following gas detector coverage is calculated.
Gas Zone Zero (0ooN) 1 or more (≥ 1ooN) 2 or more (≥ 2ooN) 3 or more (≥ 3ooN)
Zone PZ-L-001 20.9% 79.1% 40.2% 12.7%
Similar to the flame detector coverage, the gas detectors do not provide sufficient coverage to
comply with the performance criteria at either the 1ooN or 2ooN coverage levels.
Coverage contours and isovolumes for the gas detectors are shown on Figure 12 and Figure 13
respectively.
Figure 11. Zero-coverage isovolume for the flame coverage for Zone PZ-L-001.
Page 12
Figure 12. Gas detector coverage contour at 2 meters height above the zone base – color key shown at bottom-right
Figure 13. Zero-coverage isovolume for the gas coverage for Zone PZ-L-001
Page 13
Zone PZ-L-002
Flame Detector Coverage The flame detector coverage for Zone PZ-L-002 was calculated in Detect3D as shown on the table
below. The zone does not comply with the performance criteria for the 1ooN or 2ooN coverage.
Fire Zone Zero (0ooN) 1 or more (≥ 1ooN) 2 or more (≥ 2ooN) 3 or more (≥ 3ooN)
Zone PZ-L-002 25.5% 74.5% 36.5% 12.9%
Coverage contours at a height of 2 meters above the base of the zone are shown below.
Gas Detector Coverage The gas detector coverage for Zone PZ-L-002 indicates only 74.5% 1ooN coverage and 36.5% 2ooN
coverage for the 5 meter diameter gas cloud. Coverage contours for the gas mapping are shown
on Figure 15.
Gas Zone Zero (0ooN) 1 or more (≥ 1ooN) 2 or more (≥ 2ooN) 3 or more (≥ 3ooN)
Zone PZ-L-002 39.5% 60.5% 10.6% 0.3%
Figure 14. Flame detector coverage contour at 2 meters height above the zone base – color key shown at bottom-right
Page 14
Figure 15. Gas detector coverage contour at 2 meters height above the zone base – color key shown at bottom-right
Page 15
Improved Coverage Layout and Results
Zone PZ-L-001
Flame Detector Coverage The Detector Ranking Tool was used on the original layout to determine the effectiveness of each
detector. The tool operates by briefly switching off each detector in turn, and recording the
reduction in coverage. Detectors that have little impact on coverage when switched off are less
effectively positioned than those that have a large impact. The results are shown on the table
below. The 1ooN and 2ooN coverage deficits are shown for each detectors, together with the
ranking of those deficits and then the final ranking based on an 80/20 bias of the 1ooN and 2ooN.
The ranking labels are shown in red on Figure 16, indicating the best and worst positioned
detectors. This information was very useful as it indicated that in order to improve coverage,
attention should be focused on repositioning FD-007, FD-002 and FD-001.
Figure 16. Results of the detector ranking tool on Zone PZ-L-001 showing best to least effective flame detectors
Page 16
In order to improve coverage, poorly positioned detectors were first re-oriented in the azimuth
and declination angles to make sure that the FOV covered the zone as effectively as possible.
Often detectors were positioned with too high a declination, such that they were pointing towards
the deck at too steep an angle to provide good coverage, or the azimuth angle pointed the
detector away from the zone. Once this step was complete, the detector ranking tool was run
several times, and the worst performing detectors were repositioned to provide better coverage.
The new position was judged based on ease of installation and proximity to zero-coverage areas,
as highlighted by the zero-coverage isovolume. If coverage could not be achieved from
repositioning the detectors, new detectors would be added as a last resort.
For Zone PZ-L-001, flame detectors FD-001 and FD-002 were re-orientated, while flame detectors
FD-004 and FD-007 were repositioned. No new detectors were required for the coverage of this
zone. In fact, FD-004 was repositioned to improve coverage on the adjacent zone PZ-L-002. The
updated locations are given in the Appendices of this report. The improved coverage is as follows:
Fire Zone Zero (0ooN) 1 or more (≥ 1ooN) 2 or more (≥ 2ooN) 3 or more (≥ 3ooN)
Zone PZ-L-001 8.9% 91.1% 67.7% 37.5%
The coverage for PZ-L-002 is now compliant with the performance standard. The new layout of
detectors is shown on Figure 17.
Figure 17. New flame detector layout for PZ-L-001
Page 17
Gas Detector Coverage The gas detector coverage for Zone PZ-L-001 was originally calculated using a 5 meter diameter
gas cloud. However, closer inspection of the risk associated with the equipment in the zone
resulted in a redefinition of the risk areas. The high risk zone, highlighted in red below, was
marked separately from the lower risk zone, marked in purple. While a 5 meter diameter gas cloud
was appropriate for the high risk areas, a 10 meter diameter gas cloud was instead used for the
lower risk areas. This was achieved in Detect3D by adding a new risk grade (“Grade D”) and setting
the gas cloud diameter for the risk grade to 10 meters. Subsequently, two subzones were defined
as shown in Figure 18, one at Risk Grade A (red) and the other at Risk Grade D (blue).
The coverage for the subzones with the original placement of the detectors is now above 90% for
the newly identified risk zones. As these are the only ones under consideration, this layout is
deemed acceptable without any further changes.
Fire Zone Zero (0ooN) 1 or more (≥ 1ooN) 2 or more (≥ 2ooN) 3 or more (≥ 3ooN)
Zone PZ-L-001 8.9% 91.9% 67.7% 37.5%
High Risk Sub-Zone
(Grade A. 5m cloud)
0.9% 99.1% 73.0% 28.7%
Low Risk Sub-Zone
(Grade D, 10m cloud)
0.0% 100.0% 99.4% 56.1%
Figure 18. Gas Risk Zoning in PZ-L-001
Page 18
Zone PZ-L-002
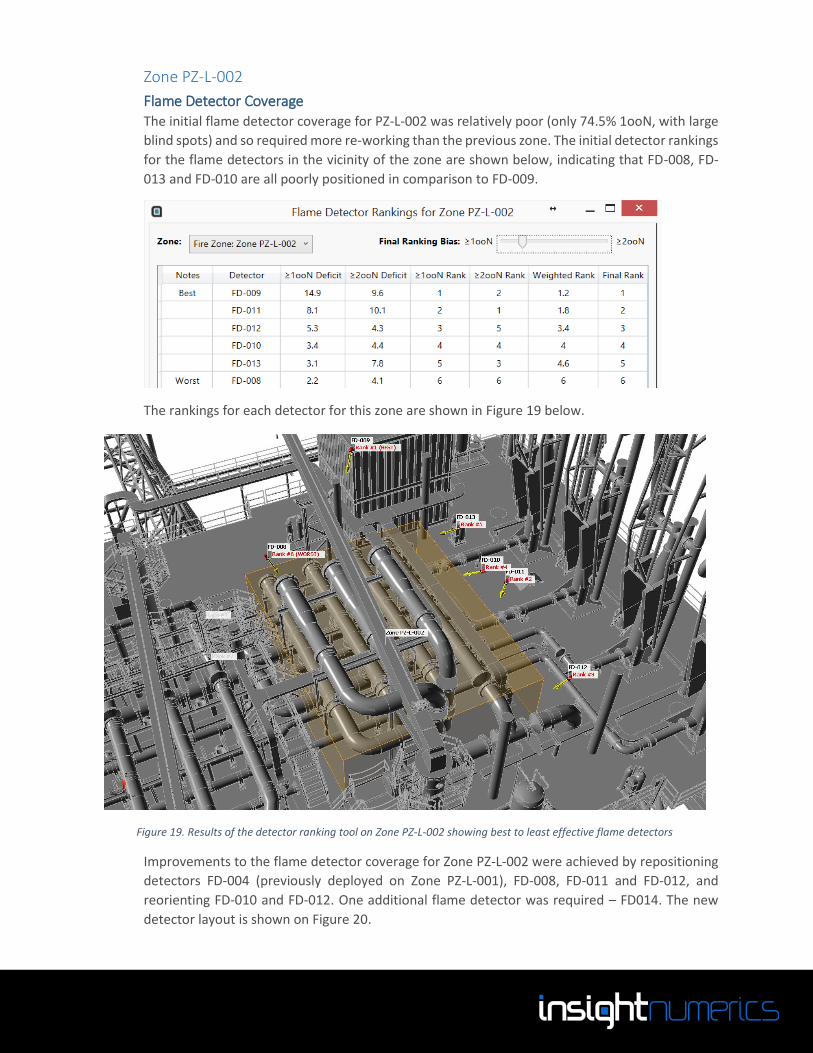
Flame Detector Coverage The initial flame detector coverage for PZ-L-002 was relatively poor (only 74.5% 1ooN, with large
blind spots) and so required more re-working than the previous zone. The initial detector rankings
for the flame detectors in the vicinity of the zone are shown below, indicating that FD-008, FD-
013 and FD-010 are all poorly positioned in comparison to FD-009.
The rankings for each detector for this zone are shown in Figure 19 below.
Improvements to the flame detector coverage for Zone PZ-L-002 were achieved by repositioning
detectors FD-004 (previously deployed on Zone PZ-L-001), FD-008, FD-011 and FD-012, and
reorienting FD-010 and FD-012. One additional flame detector was required – FD014. The new
detector layout is shown on Figure 20.
Figure 19. Results of the detector ranking tool on Zone PZ-L-002 showing best to least effective flame detectors
Page 19
The coverage of the new layout is over 90% 1ooN and nearly 70% 2ooN, well above the required
performance criteria.
Fire Zone Zero (0ooN) 1 or more (≥ 1ooN) 2 or more (≥ 2ooN) 3 or more (≥ 3ooN)
Zone PZ-L-002 8.9% 91.1% 69.3% 42.8%
Gas Detector Coverage The gas detector risk grade for PZ-L-002 was downgraded to Risk Grade D, which resulted in the
coverage now being calculated using a 10 meter diameter gas cloud instead of the original 5 meter
gas cloud. Without any further changes in the gas detector layout, the coverage of the zone was
recalculated as shown below, complying with the required performance criteria.
Gas Zone Zero (0ooN) 1 or more (≥ 1ooN) 2 or more (≥ 2ooN) 3 or more (≥ 3ooN)
Zone PZ-L-002 0.1% 99.9% 88.3% 64.5%
Figure 20. New flame detector layout for PZ-L-002
Page 20
Conclusions The fire and gas detector layout on the P-12 platform was reviewed using Detect3D Fire and Gas
Mapping software. Two zones were analyzed – PZ-L-001 and PZ-L-002.
The primary conclusions are as follows:
The initial layout of fire and gas detectors did not provide coverage that was adequate to
comply with the required performance criteria.
Using the Detector Ranking Tool in Detect3D, the effectiveness of each detector was
calculated.
To improve the effectiveness of the flame detectors at the lowest possible cost, the
detectors were first re-oriented, then repositioned if necessary, and as a final resort, new
detectors were added.
For both zones to comply with the required flame detector coverage:
o 4 of the 13 flame detectors required re-orienting alone
o 5 of the 13 flame detectors required re-positioning
o 1 new flame detector was required
o 4 of the 13 flame detectors did not need any adjustment
The gas detectors could also have been analyzed using the Detector Ranking Tool in
Detect3D. However, instead the risk levels of the zones were inspected in more detail,
and areas that were previously analyzed using a 5 meter gas cloud were instead analyzed
with a 10 meter gas cloud, to account for a low risk level. This improved coverage to such
an extent that no gas detectors required repositioning.
Based on the adjustments in the report, both PZ-L-001 and PZ-L-002 can comply with the
required performance target of 90% 1ooN and 50% 2ooN.
Page 21
Appendix A – Revised Flame Detector Layout Work Pack Note that the images for re-oriented or re-positioned detectors also include the laser aiming ray
for additional validation.
Flame Detector: FD-001 (reoriented)
Model
Manufacturer : Honeywell Analytics
Model : SS4
Description : High Sensitivity
Location
X : -47.37 [ meters ]
Y : 47.62 [ meters ]
Z : 21.53 [ meters ]
Orientation
Azimuth : -55°
Declination : 10°
Page 22
Flame Detector: FD-002 (reoriented)
Model
Manufacturer : Honeywell Analytics
Model : SS4
Description : High Sensitivity
Location
X : -36.1 [ meters ]
Y : 40.91 [ meters ]
Z : 21.53 [ meters ]
Orientation
Azimuth : 180°
Declination : 10°
Flame Detector: FD-003
Model
Manufacturer : Honeywell Analytics
Model : SS4
Description : High Sensitivity
Location
X : -36.53 [ meters ]
Y : 35.02 [ meters ]
Z : 21.53 [ meters ]
Orientation
Azimuth : 135°
Declination : 20°
Flame Detector: FD-005
Model
Manufacturer : Honeywell Analytics
Model : SS4
Description : High Sensitivity
Page 23
Location
X : -45.57 [ meters ]
Y : 38.5 [ meters ]
Z : 24.27 [ meters ]
Orientation
Azimuth : 45°
Declination : 60°
Flame Detector: FD-006
Model
Manufacturer : Honeywell Analytics
Model : SS4
Description : High Sensitivity
Location
X : -36.23 [ meters ]
Y : 42.58 [ meters ]
Z : 21.73 [ meters ]
Orientation
Azimuth : -135°
Declination : 30°
Flame Detector: FD-009
Model
Manufacturer : Honeywell Analytics
Model : SS4
Description : High Sensitivity
Location
X : -56.14 [ meters ]
Y : 29.96 [ meters ]
Z : 26.4 [ meters ]
Orientation
Azimuth : 45°
Declination : 50°
Page 24
Flame Detector: FD-010 (reoriented)
Model
Manufacturer : Honeywell Analytics
Model : SS4
Description : High Sensitivity
Location
X : -60.65 [ meters ]
Y : 36.34 [ meters ]
Z : 21.53 [ meters ]
Orientation
Azimuth : 0°
Declination : 30°
Flame Detector: FD-012 (reoriented)
Model
Manufacturer : Honeywell Analytics
Page 25
Model : SS4
Description : High Sensitivity
Location
X : -60.58 [ meters ]
Y : 44.45 [ meters ]
Z : 21.53 [ meters ]
Orientation
Azimuth : -45°
Declination : 20°
Flame Detector: FD-013 (repositioned)
Model
Manufacturer : Honeywell Analytics
Model : SS4
Description : High Sensitivity
Location
X : -48.72 [ meters ]
Y : 36.57 [ meters ]
Z : 24.63 [ meters ]
Orientation
Azimuth : 180°
Declination : 40°
Page 26
Flame Detector: FD-011 (repositioned)
Model
Manufacturer : Honeywell Analytics
Model : SS4
Description : High Sensitivity
Location
X : -55.02 [ meters ]
Y : 46.81 [ meters ]
Z : 25.09 [ meters ]
Orientation
Azimuth : -90°
Declination : 45°
Flame Detector: FD-014 (new detector)
Model
Manufacturer : Honeywell Analytics
Page 27
Model : SS4
Description : High Sensitivity
Location
X : -52.99 [ meters ]
Y : 31.05 [ meters ]
Z : 24.29 [ meters ]
Orientation
Azimuth : 90°
Declination : 45°
Flame Detector: FD-004 (repositioned)
Model
Manufacturer : Honeywell Analytics
Model : SS4
Description : High Sensitivity
Location
X : -60.92 [ meters ]
Y : 40.8 [ meters ]
Z : 21.56 [ meters ]
Orientation
Azimuth : 0°
Declination : 0°
Page 28
Flame Detector: FD-008 (repositioned)
Model
Manufacturer : Honeywell Analytics
Model : SS4
Description : High Sensitivity
Location
X : -51.47 [ meters ]
Y : 36.99 [ meters ]
Z : 23.78 [ meters ]
Orientation
Azimuth : 90°
Declination : 60°
Flame Detector: FD-007 (repositioned)
Model
Manufacturer : Honeywell Analytics
Page 29
Model : SS4
Description : High Sensitivity
Location
X : -41.76 [ meters ]
Y : 47.58 [ meters ]
Z : 24.38 [ meters ]
Orientation
Azimuth : -90°
Declination : 60°