60
Private Bank Funds I Société d’Investissement à Capital Variable, Luxembourg (R.C.S. No. B 114 378) AUDITED ANNUAL REPORT 31 MARCH 2017

Private Bank Funds I
Société d’Investissement à Capital Variable, Luxembourg
(R.C.S. No. B 114 378)
AUDITED ANNUAL REPORT 31 MARCH 2017
Private Bank Funds I
Audited Annual Report
As at 31 March 2017
Contents
Board of Directors 1
Management and Administration 2
Board of Directors’ Report 3
Investment Managers’ Report 7
Audit Report 9
Financial Statements and Statistical Information
Combined Statement of Net Assets 10
Combined Statement of Operations and Changes in Net Assets 12
Statement of Changes in the Number of Shares 15
Statistical Information 17
Notes to the Financial Statements 19
Schedule of Investments
Private Bank Funds I - Access Balanced Fund (EUR) 24
Private Bank Funds I - Access Balanced Fund (GBP) 26
Private Bank Funds I - Access Balanced Fund (USD) 28
Private Bank Funds I - Access Capital Preservation Fund (EUR) 29
Private Bank Funds I - Access Capital Preservation Fund (USD) 31
Private Bank Funds I - Access Growth Fund (USD) 32
Private Bank Funds I - Dynamic Multi-Asset Fund (EUR) 33
Private Bank Funds I - Dynamic Multi-Asset Fund (USD) 35
Private Bank Funds I - Montes Excelsis Fund 37
Appendix - Unaudited Additional Disclosures
1. Total Expense Ratios 39
2. Summary of Investment Objectives of the Sub-Funds 41
3. Performance and Volatility 42
4. Interest Rate Received/(Charged) on Bank Accounts 43
5. Sub-Fund Share Classes Subject to Taxe d’Abonnement Rate of 0.01% 43
6. Portfolio Turnover Ratio 44
7. Calculation Method of the Risk Exposure 45
8. Securities Financing Transactions 46
9. UCITS Remuneration Disclosures 46
10. Historical Statement of Changes in the Number of Shares 47
11. Management Fees of Undertakings Managed by Investment Managers which are not Members of JPMorgan Chase & Co. group 51
For additional information please consult http://www.jpmorganassetmanagement.com/jpmpbfi.
No subscriptions can be received solely on the basis of this report. Subscriptions are only valid if made on the basis of the current Prospectus, the currentKey Investor Information Documents, supplemented by the latest audited annual report and, if published thereafter, the latest unaudited semi-annualreport.
The current Prospectus, the current Key Investor Information Documents, the unaudited semi-annual reports, as well as the audited annual reports can beobtained free of charge from the registered office of the SICAV and from local paying agents.Details of the Investment Manager(s) for the individual Sub-Funds are available within the Prospectus and from the Management Company at its registeredoffice, or from http://www.jpmorganassetmanagement.lu.

Private Bank Funds IBoard of Directors
ChairmanJacques ElvingerElvinger Hoss Prussen2, place Winston ChurchillB.P. 425, L-2014 LuxembourgGrand Duchy of Luxembourg
DirectorsAlain FeisInterinvest S.A.6B, route de TrèvesL-2633 SenningerbergGrand Duchy of Luxembourg
Jean FuchsFuchs & Associés Finance47, Boulevard Prince HenriL-1724 LuxembourgGrand Duchy of Luxembourg
Registered Office6, route de TrèvesL-2633 SenningerbergGrand Duchy of Luxembourg
Benoit DumontJ.P. Morgan (Suisse) S.A.8, rue de la ConfédérationCH-1204 GenevaSwitzerland
1

Private Bank Funds IManagement and Administration
Management Company, Registrar and Transfer Agent,Global Distributor and Domiciliary AgentJPMorgan Asset Management (Europe) S.à r.l.6, route de TrèvesL-2633 SenningerbergGrand Duchy of Luxembourg
Investment ManagersJ.P. Morgan International Bank Limited25 Bank Street, Canary WharfLondon E14 5JPUnited Kingdom
JPMorgan Asset Management (UK) Limited60 Victoria EmbankmentLondon EC4Y 0JPUnited Kingdom
Depositary, Corporate, Administrative and Listing AgentJ.P. Morgan Bank Luxembourg S.A.6, route de TrèvesL-2633 SenningerbergGrand Duchy of Luxembourg
Independent AuditorPricewaterhouseCoopers, Société coopérative2, rue Gerhard MercatorB.P. 1443, L-1014 LuxembourgGrand Duchy of Luxembourg
Luxembourg Legal AdviserElvinger Hoss Prussen2, place Winston ChurchillB.P. 425, L-2014 LuxembourgGrand Duchy of Luxembourg
2

The Board of Directors (the “Board”) is pleased to present the Audited Annual Report of Private Bank Funds I (the ‘Fund’) for the year ended31 March 2017.
Members of the Board
Jacques Elvinger, Independent Director and Chairman. A member of the Board since February 2006.
Mr Elvinger became a member of the Luxembourg Bar in 1984 and has been a partner of the Luxembourg law firm Elvinger Hoss Prussensince 1987. Mr Elvinger practices general corporate and banking law and specialises in the field of investment and pension funds. He is amember of the High Committee for the Development of the Financial Sector instituted by the Luxembourg Government. He is also a memberof the Advisory Committee to the Luxembourg Commission for the Supervision of the Financial Sector in the area of investment fundmanagers. He is a member of the Board of Directors of the Association of the Luxembourg Fund Industry (ALFI) and is currently chairman ofALFI’s Regulatory Board. Mr Elvinger currently holds a number of board mandates with Luxembourg investment funds including severalJPMorgan managed Luxembourg-domiciled investment funds.
Benoit Dumont, Independent Director since 31 March 2017. A member of the Board since February 2006.
Mr Dumont was an employee of JPMorgan Suisse S.A. from 1999 until March 2017. Prior to his retirement, Mr Dumont held several positionsas Chairman of the Board of JPMorgan Suisse S.A. from 2007, Managing Director with JPMorgan in Brussels from 1980 and in New York from1996. He holds a Bachelor degree in Commercial Engineering and a postgraduate degree in Economics and Finance and taught Finance atULB-CEPAC. Mr Dumont represents JPMorgan as Director of the Association of Foreign Banks in Switzerland, the Geneva Financial Center andthe Geneva Finance and Research Institute. He is also a Director of Intec SA, a Belgian technology venture firm, Trace Technologies, a Swisstech start up and Edmond de Rothschild Holding SA – Switzerland and Holding Benjamin et Edmond de Rothschild Pregny - Switzerland. MrDumont also sits on the Academic Advisory Board of Business School Lausanne and the Advisory Board of Immodating - Switzerland.
Alain Feis, Independent Director. A member of the Board since February 2006.
Active in the field of Private Banking for more than 30 years, Mr Feis has been working in management positions with various institutions inLuxembourg. He is a member of the Board of Directors of the “Association Luxembourgeoise de Professionnels du Patrimoine” (ALPP). Withrespect to the various consultative bodies of the Commission for the Supervision of the Financial Sector (CSSF), Mr Feis is a member of the“Comité Consultatif de la Réglementation Prudentielle” as well as a member of the mixed “Banks and Investment Firms Committee”.
Jean Fuchs, Independent Director. A member of the Board since February 2006.
Mr Fuchs has been the Chairman of Fuchs et Associés Finance Lux S.A. since 2000 and was the Managing Director of ATAG AssetManagement from 1996. He also held various positions with BNP Paribas from 1982 to 1995. Mr Fuchs holds a Bachelor degree in Law andEconomics from the University of Strasbourg, attended the Institut d’Etudes Politiques Section Economie and attained a Masters degree inTechnical Finance and Banking. Mr Fuchs is an advisory member of the Commission for the Supervision of the Financial Sector (CSSF), amember of the European Federation of Independent Advisers and of the Luxembourg Financial Development Council. He is also theChairman of the Association Luxembourgeoise de Professionnels du Patrimoine” (ALPP).
Structure of the Fund
The Fund is a variable capital investment company, organised as a “Société Anonyme”, under the laws of the Grand Duchy of Luxembourg.The Board has appointed JPMorgan Asset Management (Europe) S.à r.l. (JPMAME) as Management Company of the Fund. The Fund isorganised as an “umbrella” with a number of Sub-Funds each of which has its own investment objective, policies and restrictions.The objective of the Fund is to place the money available to it in transferable securities and other permitted assets of any kind, in accordancewith the Fund’s Prospectus, with the purpose of spreading investment risks and affording shareholders the results of the management oftheir portfolios.The Fund qualifies as an Undertaking for Collective Investment in Transferable Securities (UCITS) under the EC Directive 2009/65/EC of 13July 2009 and is subject to the Luxembourg law of 17 December 2010 on undertakings for collective investment. The Fund may therefore beoffered for sale in European Union Member States, subject to notification in countries other than the Grand Duchy of Luxembourg. Inaddition, applications to register the Fund and its Sub-Funds may be made in other countries.As at the year end the Fund had 9 Sub-Funds. All of the Sub-Funds and Share Classes are registered for offer and distribution in the GrandDuchy of Luxembourg and a number of the Sub-Funds and Share Classes are registered for distribution in the following jurisdictions:Austria, Belgium, Denmark, France, Germany, Greece, Ireland, Italy, Luxembourg, The Netherlands, Spain, Sweden, Switzerland and UnitedKingdom.
Role and Responsibility of the Board
The responsibility of the Board is governed exclusively by Luxembourg law. With respect to the annual accounts of the Fund, the duties of theDirectors are governed by the law of 10 December 2010 on, inter alia, the accounting and annual accounts of undertakings for collectiveinvestment and by the law of 17 December 2010 relating to undertakings for collective investment.A management agreement between the Fund and JPMorgan Asset Management (Europe) S.à r.l sets out the matters over which theManagement Company has authority under Chapter 15 of the Law of 17 December 2010. This includes management of the Fund’s assets andthe provision of administration, registration, domiciliation agent and marketing services. All other matters are reserved for approval by theBoard and a schedule setting out such matters for clarity is in place between the Board and the Management Company. The matters reservedfor the Board include determination of each Sub-Fund’s investment objective and policies, investment restrictions and powers, amendmentsto the Prospectus, reviewing and approving key investment and financial data, including the annual accounts, as well as the appointment of,and review of the services provided by, the Management Company, Auditor and Depositary.
3
Private Bank Funds IBoard of Directors’ Report
Prior to each Board meeting the Directors receive detailed and timely information allowing them to be prepared for the items underdiscussion during the meeting. For each quarterly meeting the Board requests, and receives, reports from, amongst others, the ManagementCompany, the investment managers, risk management as well as proposals for changes to existing Sub-Funds or proposals to launch newones as appropriate. Senior representatives of each of these functions attend Board meetings by invitation to enable the Directors toquestion the reports presented to it.The Directors take decisions in the interests of the Fund and its shareholders as a whole and refrain from taking part in any deliberation ordecision which creates a conflict of interest between their personal interests and those of the Fund and its shareholders. The subject ofconflicts of interest is documented in the Prospectus and the Management Company’s policy on conflicts of interest is available for inspectionon the website: http://www.jpmorganassetmanagement.lu/ENG/Document_LibraryThe Board can take independent professional advice if necessary and at the Fund’s expense.
Board Composition
The Board is chaired by Mr Elvinger and consists of three Independent Directors and one Connected Director. The Board defines a connectedDirector as someone who is employed by JPMorgan Chase & Co or any of its affiliates. All Board meetings require a majority of IndependentDirectors to be in attendance and as such the Board acts independently from the Management Company.In appointing a Director the Board takes into account the relative mix and composition of the Board, which as a whole has a breadth ofinvestment knowledge, financial skills, as well as legal and other experience relevant to the Fund’s business.The Board has agreed that a proposal will be put to shareholders to appoint Directors on a rotational basis and believes that this is of benefitto shareholders as it will ensure that there is always continuity of Directors. In order to facilitate this proposal it is necessary that the Articlesof Incorporation be altered; the decision to amend them is subject to a shareholder vote at an Extraordinary General Meeting and it isanticipated that this meeting will take place during 2017.The Board does not limit the number of years of Directors’ service and it does take into account the nature and requirements of the fundindustry and of the Fund’s business when making recommendation to shareholders that Directors be elected. The terms of each Director’sappointment are set out in a contract for services and these are available at the Fund’s registered office for inspection.
Induction and Training
All new Directors will receive an induction incorporating relevant information regarding the Fund and their duties and responsibilities as aDirector. In addition, the Board takes active steps to keep up to date with developments relevant to the Fund and have ensured that a formaltraining programme is in place.
Board Evaluation
The Board carries out a biennial review of its performance.
Board Remuneration
The Board believes that the remuneration of its members should reflect the responsibilities and experience of the Board as a whole and befair and appropriate given the size, complexity and investment objectives of the Fund.The Board reviews the remuneration paid on an annual basis. The Chairman is currently paid EUR 17,500 and the other Directors EUR 16,000apart from the Connected Director who has agreed to waive his right to remuneration. No element of the remuneration paid by the Fund tothe Directors is performance related.
Board Meetings and Committees
The Board meets quarterly but if necessary additional meetings will be arranged.Given the scope and nature of the business of the Fund, the Board does not currently consider it necessary to have a formal Audit orRemuneration Committee or indeed any other standing committees. However, this is kept under review.All Board related matters are therefore currently approved by the Board or, where there are specific matters that need furtherconsideration, a Sub-Committee of the Board could be formed for this specific purpose. Such circumstances could be where the Boardrequests some amendments to the Prospectus and where it is not appropriate to wait till the next quarterly Board meeting for this to beapproved. These Sub-Committee meetings are usually formed of a minimum of two Directors.There were five Board meetings held during the reporting year. Four of these were the quarterly Board meetings where, amongst othermatters, the agenda included those items highlighted under the section above called ‘Role and Responsibility of the Board’. The othermeeting was an ad-hoc meeting to consider a Board initiative.
Internal Control
Investment management and all administrative services are provided by the Management Company and custody of assets is provided byJ.P. Morgan Bank Luxembourg S.A. The Board’s system of internal control therefore mainly comprises monitoring the services provided bythe Management Company and the Depositary, including the operational and compliance controls established by them to meet the Fund’sobligations to shareholders as set out in the Prospectus, Articles of Incorporation as well as all relevant regulations. The ManagementCompany formally reports to the Board on a quarterly basis on the various activities it is responsible for and in addition shall inform the Boardwithout delay of any material administrative or accounting matters.
4
Private Bank Funds IBoard of Directors’ Report (continued)

Corporate Governance and ALFI Code of Conduct
The Board is responsible for ensuring that a high level of corporate governance is met and considers that the Fund has complied with the bestpractices in the Luxembourg funds industry.In particular the Board has adopted the ALFI Code of Conduct (the “Code”) which sets out principles of good governance. These principles areset out below:1. The Board should ensure that high standards of corporate governance are applied at all times;2. The Board should have good professional standing and appropriate experience and ensure that it is collectively competent to fulfil itsresponsibilities;3. The Board should act fairly and independently in the best interests of the investors;4. The Board should act with due care and diligence in the performance of their duties;5. The Board should ensure compliance with all applicable laws and regulations and with the Fund's constitutional documents;6. The Board should ensure that investors are properly informed, are fairly and equitably treated, and receive the benefits and services towhich they are entitled;7. The Board should ensure that an effective risk management process and appropriate internal controls are in place;8. The Board should identify and manage fairly and effectively, to the best of its ability, any actual, potential or apparent conflict of interestand ensure appropriate disclosure;9. The Board should ensure that shareholder rights are exercised in a considered way and in the best interests of the Fund;10. The Board should ensure that the remuneration of the Board members is reasonable and fair and adequately disclosed.The Board considers that the Fund has been in compliance with the principles of the Code in all material aspects throughout the financial yearended 31 March 2017. The Board undertakes an annual review of ongoing compliance with the principles of the Code.
Proxy Voting Policy
The Board delegates responsibility for proxy voting to the Management Company. The Management Company manages the voting rights ofthe shares entrusted in a prudent and diligent manner, based exclusively on their reasonable judgement of what will best serve the financialinterests of their clients. So far as is practicable, the Management Company will vote at all of the meetings called by companies in which theyare invested.A copy of the proxy voting policy is available from the Fund’s registered office upon request or on the website:https://am.jpmorgan.com/uk/institutional/corporate-governance
Directors and Officers Indemnity Insurance
The Fund’s Articles of Incorporation indemnify the Directors against expenses reasonably incurred in connection with any claim againstthem arising in the course of their duties or responsibilities as long as they have not acted fraudulently or dishonestly. To protectshareholders against any such claim, the Board has taken out Directors and Officers Indemnity Insurance which indemnifies the Directorsagainst certain liabilities arising in the course of their duties and responsibilities but does not cover against any fraudulent or dishonestactions on their part.
Independent Auditor
PricewaterhouseCoopers, Société Coopérative, has been the Fund’s Auditor since February 2006. The provision of audit services was last putto competitive tender in 2016. The Board reviewed the services of PwC in 2016 and decided that, subject to any other influencing factor, theyshould continue to be proposed to the Shareholders to be appointed as Auditor.
Annual General Meeting
The next Annual General Meeting of the Fund will be held on 28 July 2017 at the Registered Office of the Fund to consider matters relating tothe year ending on 31 March 2017. At this meeting shareholders will, amongst other matters, be requested to consider the usual matters atsuch meetings including:1. the adoption of the financial statements and approval of the allocation of the results;2. the approval of Directors fees;3. the election of the Directors, all of whom wish to stand for election;4. the election of the Auditor;5. the discharge of Directors duties.No special business is being proposed by the Board.
Discharge of Directors
One of the resolutions in the AGM is to discharge the directors of their duties for the fiscal year in question. This discharge is only valid wherethe annual accounts contain no omission or false information concealing the real financial situation of the Fund.
Cleansing of Impure Income
The Private Bank Funds I - Islamic Global Dynamic Equity Fund invested in a diversified portfolio of equity securities within the Dow JonesIslamic Market World Index (the “Islamic Index”).
5
Private Bank Funds IBoard of Directors’ Report (continued)

The Islamic Index was established in accordance with the Dow Jones Indexes’s methodology and the Islamic investment guidelines set by theIslamic Index’s Shari’ah Supervisory Board. The Islamic Index is constructed from the universe of the pool of stocks contained in the DowJones Global Indexes. The components for the Islamic Index are selected by filtering this index universe through screens for businessactivities and financial ratios to remove stocks that are not suitable for Islamic investment purposes.The impure income cleansing is done quarterly upon receipt of the impure income information provided by the Islamic Index. The Net AssetValue of the Sub-Fund is adjusted to take into account the portion of impure income received on the investments of the Sub-Fund.Until the Sub-Fund’s liquidation on 13 February 2017, a total of USD 26,367 had been considered for income cleansing. USD 26,367 will bepaid to the foundation [Children in Crisis].
Events during the Year
During the year, the total net assets of the Fund increased from USD 4.5 billion to USD 4.6 billion at year end.With effect from 29 April 2016, Private Bank Funds I - Discretionary Fixed Income Government Fund was liquidated.With effect from 1 July 2016, the following Sub-Funds were renamed:- Private Bank Funds I - Access Conservative Fund (EUR) to Private Bank Funds I - Access Capital Preservation Fund (EUR);- Private Bank Funds I - Access Conservative Fund (USD) to Private Bank Funds I - Access Capital Preservation Fund (USD).With effect from 25 October 2016, Private Bank Funds I - Blue and Green Fund was liquidated.With effect from 16 November 2016, Private Bank Funds I - Access Growth Fund (GBP) and Access Conservative Funds (GBP) were liquidated.With effect from 13 February 2017, Private Bank Funds I - Islamic Dynamic Equity Fund was liquidated.
Events After the Year-End
With effect from 11 May 2017, the Calcula Fund SICAV, S.A. and the Extensis Uno SICAV, S.A. (the “Absorbed Funds”) have been merged intothe Private Bank Funds I - Access Balanced Fund (EUR) (the “Absorbing Fund”).
The Board of DirectorsLuxembourg, 27 June 2017
6
Private Bank Funds IBoard of Directors’ Report (continued)

Private Bank Funds IInvestment Managers’ Report
Market ReviewIn the 12 months to the end of March 2017, MSCI World appreciated 14.8%, while fixed income markets were up only +1.1% (Barclays Global Aggregate Index).U.S. 10 year yield rallied from 1.77% at the end of March 2016 to 2.38% at the end of March 2017. Fed raised rates twice during this time period and long termrates appreciated in the wake of the U.S. election.Global markets had a shaky start to 2016 as heightened economic growth concerns, energy market declines, credit market pressure and broad volatilityunited to dampen returns and frustrate active managers. After a challenging first quarter in 2016, risky assets rebounded from 1 April 2016 to end of 31March 2017 which explains the strong appreciation for the MSCI World Index. Geopolitical concerns did not derail the equity rally.During the second quarter of 2016, most risky assets rallied until the Brexit vote on 23 June, which triggered a sharp selloff in equity markets. MSCI Europelost as much as 6.8% on 24 June as markets adapted to an unexpected outcome. This correction was short-lived and indices rebounded after a few weeks. UKEquities were supported by the weakening of the British Pound which allowed exports companies to gain a competitive advantage. Bank of England adaptedits monetary policy with new easing measures to support the economy (cut of interest rates to 0.25% and a renewed QE program). In the end, FTSE 100 wasone of the best performing equity market during the quarter gaining as much as +5.3%.Stocks appreciated during the third quarter of 2016 with further improvement in the global economy and resilient quarterly corporate earnings, especially inthe technology sector in the U.S. Even though the Fed remained on hold in July and September, they hinted at a rate hike before the end of the year. Japanesestocks gained +5.6% during the quarter. Equity markets in Japan rallied as the government announced a new fiscal program to support spending includingseveral infrastructure projects. Bank of Japan introduced an interest rate target for 10 year government bond yields and further easing monetary policymeasures.Q4 2016 saw government bond yields in most markets lifted by the anticipations of both higher inflation and growth, and more restrictive monetary policyafter the U.S. election victory for Donald Trump. Long term rates rose significantly with the U.S. 10 year yield going from 1.59% to 2.44% during the quarter.Equity market rally went on, with financial stocks performing well as long term yields rallied. U.S. equities gained +3.2% during the quarter; this rally wassupported by improving macroeconomic data and the expectations of a new expansive fiscal policy. The Federal Open Market Committee raised its targetrange from a range of 0.25% to 0.5% to 0.5% to 0.75% in mid-December. This was overall a strong quarter for the USD currency as the DXY Index gained asmuch as 7.1%. Appreciation of the USD currency helped Japanese equity markets to over perform and the Nikkei index gained as much as +16.2% in JPYduring the quarter. Performance of this market was much subdued translated in USD terms.Equity markets had a good start to 2017, following on last quarter’s strong performance. The U.S. election, and the associated expectations for further taxcuts, increased public spending and regulatory changes, have supported the rally in risky assets since November 2016. The Fed raised rates once again inMarch 2017. Confidence in the economic outlook has also been improving outside the U.S. In Europe, business surveys have risen to their highest levels overfive years and consumer confidence has recovered to close to pre-crisis highs. Euro area PMIs rose to 56.4 for the month of March highlighting a continuedrecovery in economic conditions. MSCI Europe Index gained +5.3% during the first quarter of 2017. Brexit was formally triggered on 29 March 2017 with a billinvoking Article 50.
Market Outlook - Access Sub-FundsMarkets have quickly focused on the reflationary aspects of what lighter regulation, tax cuts and pro-investment policy mean for US growth and inflation.Global growth is improving, and central banks have stepped back from the shock-and-awe of protracted easing. The Federal Reserve is raising rates, theBank of Japan has backed away from extending negative interest rates and there is a risk that the European Central Bank will announce further tapering ofquantitative easing later this year. Economic surprise indicators are moving higher along with business sentiment.Across portfolios, this leaves us invested but not overreaching for risk - right now, we prefer to diversify how we are taking risk across a multi-asset fund.Earnings growth will be crucial this year for equity markets. We continue to be overweight US equity markets across portfolios and modestly overweightJapan versus Europe. We expect developed markets earnings growth to range between 5% and 8% as a base case. We have the highest conviction in the UScurrently and expect earnings to grow at the high end of this range with upside, depending on what happens with tax reform. We see similar high earningsgrowth in Japan this year. Europe is the outlier, where returns may remain challenged as we start the year.We are far more constructive on emerging equity markets than we have been in quite a while. What keeps us cautious is the tail risk around US trade policy."Currency manipulator" headlines for China and "renegotiations are coming" headlines around NAFTA will put additional pressure on EM foreign exchangemarkets. Valuations don't stand out as particularly inexpensive in EM equity markets either.Our largest underweight across portfolios remains to core bonds. We are underweight core duration, but continue to hold onto short to intermediate bondsto help diversify risk and navigate a volatile market ahead. Credit and Extended Fixed Income remains our largest overweight across portfolios. We like whatwe hold in high yield, dollar-denominated emerging market debt as well as investment grade credit. However, coming into this year, return expectationsneed to be reset lower.We are positioned the way we are across our funds because we see a firm and stable global macro backdrop ahead. We expect global growth to reach 3.4%annualized rate. Our economics team is currently arguing for resurgence in corporate profits ahead, as global growth and inflation accelerate andproductivity improves. We aren't in an environment where reflationary risks are running ahead of central banks or markets. Rather, it's that disinflationaryforces are fading. That is a subtle but very important backdrop for risk assets - it's supportive.We remain neutral in our equity allocations to reflect global equity markets that we feel are fully valued. We have had a great start to the year 2017 acrossequity markets, and a little digestion of current valuations seems in order. I would say the same about credit markets, although we have seen someconsolidation. Across our fixed income allocations, the team continues to like how we are positioned, though we are having some active discussions aboutwhether we would dial back duration should longer-dated government bond yields move lower. We are also looking at some shorter-duration inflation linkedbonds as a potential addition across portfolios.The Fed will raise policy driven uncertainty that may weigh on market sentiment as we move into April. That is likely to keep equity markets range bound andbouncy until we get far enough along in the earnings season. It's also likely to keep government bond yields contained. While the Fed has a policy meeting inearly May, markets have around a 15% probability of the Fed raising policy rates at that meeting. That probability rises to above 50% for a rate hike at theJune FOMC meeting. Markets are focused on June for the next Fed rate hike.
7

Private Bank Funds IInvestment Managers’ Report (continued)
Market Outlook - Dynamic Multi Asset Strategy Sub-FundsOverall we remain cautiously optimistic on forward looking returns, but would perhaps emphasise the word “cautious” slightly more than we would havethree months ago. We’re currently doing some work on a number of diversifying trades in the portfolio in all three of our broad asset classes – equities, fixedincome and alternatives. We remain excited about continuing to add new idiosyncratic ideas into the portfolio such as infrastructure equity, non-lifeinsurance equities, mortgages and un-correlated holdings within the relative value sub-strategy of liquid alternative managers.Taking a step back, risk appetite has stalled a bit globally thus far in March, with a widening of credit spreads, weakness in the EM/commodity complex, andpoor performance of small cap and value styles indicating a mild defensive rotation is underway. We believe a number of factors are at play. The US taxreform timeline continues to get extended, as Republican disagreement over the recently released Health Care bill threatens to push the tax deal farther andfarther out in the year. There’s also the acknowledgement that economic data surprises in and of themselves are not true leading indicators, and very oftenprecede equity market declines as they lead to tighter financial conditions. In addition to the Fed, China is becoming less stimulative, the ECB isacknowledging a better growth outlook, 10 year yields are rising globally, and investors are beginning to question whether underlying fundamentals aretruly strong enough to shake off money that will be less easy than before.We remain constructive on emerging equity markets, which have topped the performance leader board year to date. The Fed delivered what was widelyinterpreted as a dovish hike in March, sending real yields lower and benefitting the portfolio’s exposure to EM equity. India was the top performing holdingover the month, as Modi’s unexpectedly strong victory in a key state election boosted the odds of his re-election in the 2019 national polls. Both the currencyand local market reacted strongly.After a strong Q1 and growing risks to the global reflation trade, the general direction of the portfolio is one of mildly reducing risk. Since launch, credit hasbeen one of our favoured expressions of risk in the portfolio. In absolute terms, we would have been better served simply by buying equity, however, on a riskadjusted basis, high yield and investment grade spreads in late 2015 / early 2016 offered a more compelling risk adjusted return. As spreads have movedback toward cycle lows and our economic outlook has evolved, the allocation to credit in the portfolio has come down steadily since H2 2015. March sawfurther trades out of normal maturity high yield and investment grade exposure. The sole exposure to traditional credit now lies in short duration vehicles,where we are giving up minimal yield but taking on far less duration risk.In light of the strong performance of physical gold year to date and the recent fall in real yields, we have taken the opportunity to realise some profits in theholding. Elsewhere within our alternatives allocation, we added two new positions –as equity valuations increasingly become less attractive in core marketsand bond prices continue to offer scant value, good quality alterative managers can offer a compelling means to helping the strategy to meet itsperformance objective.In terms of outlook, much of the media continues to focus on Trump. We do not dismiss the importance of the President’s ability to pass market friendly taxand infrastructure reforms, but are focused more on the global cycle as a driver of asset prices. The global reflation trade has paused for within U.S. growthstocks and under performance in operationally leveraged markets like Japan thus far year to date. A mix of equity regional styles, a less credit heavy fixedincome book, smaller positions in uncorrelated liquid alternatives, exposure to gold and an elevated cash position feels like a more balanced portfolioallocation given the sharp rally in risk assets and the uncertain outlook that lies ahead.
Investment ManagersLuxembourg, 27 June 2017
The information stated in this report is historical and not necessarily indicative of future performance.
8

Audit Report
To the Shareholders ofPrivate Bank Funds I
We have audited the accompanying financial statements of Private Bank Funds I and of each of its Sub-Funds, which comprise the CombinedStatement of Net Assets and the Schedule of Investments as at 31 March 2017 and the Combined Statement of Operations and Changes in NetAssets for the year then ended, and a summary of significant accounting policies and other explanatory notes to the financial statements.
Responsibility of the Board of Directors of the SICAV for the financial statementsThe Board of Directors of the SICAV is responsible for the preparation and fair presentation of these financial statements in accordance withLuxembourg legal and regulatory requirements relating to the preparation of the financial statements and for such internal control as theBoard of Directors of the SICAV determines is necessary to enable the preparation of financial statements that are free from materialmisstatement, whether due to fraud or error.
Responsibility of the “Réviseur d’entreprises agréé”Our responsibility is to express an opinion on these financial statements based on our audit. We conducted our audit in accordance withInternational Standards on Auditing as adopted for Luxembourg by the “Commission de Surveillance du Secteur Financier”. Those standardsrequire that we comply with ethical requirements and plan and perform the audit to obtain reasonable assurance about whether thefinancial statements are free from material misstatement.
An audit involves performing procedures to obtain audit evidence about the amounts and disclosures in the financial statements. Theprocedures selected depend on the judgment of the “Réviseur d’entreprises agréé”, including the assessment of the risks of materialmisstatement of the financial statements, whether due to fraud or error. In making those risk assessments, the “Réviseur d’entreprisesagréé” considers internal control relevant to the entity’s preparation and fair presentation of the financial statements in order to designaudit procedures that are appropriate in the circumstances, but not for the purpose of expressing an opinion on the effectiveness of theentity’s internal control. An audit also includes evaluating the appropriateness of accounting policies used and the reasonableness ofaccounting estimates made by the Board of Directors of the SICAV, as well as evaluating the overall presentation of the financial statements.
We believe that the audit evidence we have obtained is sufficient and appropriate to provide a basis for our audit opinion.
OpinionIn our opinion, the financial statements give a true and fair view of the financial position of Private Bank Funds I and of each of its Sub-Fundsas of 31 March 2017, and of the results of their operations and changes in their net assets for the year then ended in accordance withLuxembourg legal and regulatory requirements relating to the preparation of the financial statements.
Other informationThe Board of Directors of the SICAV is responsible for the other information. The other information comprises the information included in theannual report but does not include the financial statements and our audit report thereon.
Our opinion on the financial statements does not cover the other information and we do not express any form of assurance conclusionthereon.
In connection with our audit of the financial statements, our responsibility is to read the other information and, in doing so, consider whetherthe other information is materially inconsistent with the financial statements or our knowledge obtained in the audit or otherwise appears tobe materially misstated. If, based on the work we have performed, we conclude that there is a material misstatement of this otherinformation, we are required to report this fact. We have nothing to report in this regard.
PricewaterhouseCoopers, Société coopérative Luxembourg, 27 June 2017Represented by
Emmanuel Chataignier
PricewaterhouseCoopers, Société coopérative, 2 rue Gerhard Mercator, B.P. 1443, L-1014 LuxembourgT: +352 494848 1, F:+352 494848 2900, www.pwc.lu
Cabinet de révision agréé. Expert-comptable (autorisation gouvernementale n° 10028256)R.C.S. Luxembourg B 65 477 - TVA LU25482518
9

Private Bank Funds ICombined Statement of Net AssetsAs at 31 March 2017
Private BankFunds I
CombinedUSD
AccessBalanced
Fund (EUR)EUR
AccessBalanced
Fund (GBP)GBP
AssetsInvestments in Securities at Market Value 4,332,583,710 657,501,869 139,331,072Acquisition Cost: 4,009,239,078 567,323,372 117,009,821Cash at Bank and at Brokers 250,185,735 29,627,750 7,205,178Amounts Receivable on Sale of Investments 72,772,956 1,361,691 291,523Interest and Dividends Receivable, Net 544,941 327,927 156,089Fee Waiver* 19,398 - 1,813Net Unrealised Gain on Forward Currency Exchange Contracts 4,657,995 698,912 716,372
Total Assets 4,660,764,735 689,518,149 147,702,047
LiabilitiesAmounts Payable on Purchase of Investments 9,563,146 5,159,864 1,177,455Management and Advisory Fees Payable 2,861,785 558,397 87,770Other Payables** 419,400 50,347 13,031Net Unrealised Loss on Forward Currency Exchange Contracts 2,034,845 - -Net Unrealised Loss on Financial Futures Contracts 46,625 - -
Total Liabilities 14,925,801 5,768,608 1,278,256
Total Net Assets 4,645,838,934 683,749,541 146,423,791
Historical Total Net Assets31 March 2016 4,456,869,639 825,527,101 195,175,42331 March 2015 5,221,375,109 1,066,863,829 249,181,024
* Please refer to Note 3c).** Other Payables are principally comprised of Directors’ fees, audit and tax related fees and expenses, registration, publication, mailing, printing, legal and marketing expenses.
The accompanying notes form an integral part of these Financial Statements.
10

Private Bank Funds ICombined Statement of Net Assets (continued)As at 31 March 2017
AccessBalanced
Fund (USD)USD
AccessCapital Preservation
Fund (EUR) (1)EUR
AccessCapital Preservation
Fund (USD) (2)USD
AccessGrowth
Fund (USD)USD
DynamicMulti-AssetFund (EUR)
EUR
DynamicMulti-AssetFund (USD)
USD
MontesExcelsis
FundUSD
768,371,290 512,181,475 297,947,207 50,071,673 795,461,527 761,549,194 181,373,863692,826,155 480,637,791 280,184,352 45,685,930 765,436,848 733,732,883 173,492,80425,568,628 23,963,289 5,312,070 2,786,699 63,393,718 66,015,249 16,533,4343,539,903 - 7,510,087 188,370 26,287,527 25,600,417 6,030,066
- - - - - - -- 489 - 7,651 - 2,781 6,183- 190,772 - - 2,634,212 - -
797,479,821 536,336,025 310,769,364 53,054,393 887,776,984 853,167,641 203,943,546
- 2,417,125 - - - - -704,544 305,968 207,505 24,767 472,034 387,733 -
56,408 48,741 26,334 11,812 103,224 80,029 12,420- - - - - 1,623,070 411,775- - - - 20,577 19,880 4,760
760,952 2,771,834 233,839 36,579 595,835 2,110,712 428,955
796,718,869 533,564,191 310,535,525 53,017,814 887,181,149 851,056,929 203,514,591
1,003,262,833 621,030,367 411,884,838 66,857,095 362,219,589 260,313,102 193,314,1991,284,867,458 895,537,022 490,780,444 80,711,961 - - 198,113,887
(1) This Sub-Fund was renamed from Private Bank Funds I - Access Conservative Fund (EUR) to Private Bank Funds I - Access Capital Preservation Fund (EUR) on 1 July 2016.(2) This Sub-Fund was renamed from Private Bank Funds I - Access Conservative Fund (USD) to Private Bank Funds I - Access Capital Preservation Fund (USD) on 1 July 2016.
11

Private Bank Funds ICombined Statement of Operations and Changes in Net AssetsFor the Year Ended 31 March 2017
Private BankFunds I
CombinedUSD
AccessBalanced
Fund (EUR)EUR
AccessBalanced
Fund (GBP)GBP
Net Assets at the Beginning of the Year* 4,278,074,836 825,527,101 195,175,423
IncomeDividend Income, Net 9,733,471 1,391,272 1,858,781Interest Income, Net 444,941 79,687 21,199Bank Interest 129,627 12,279 9,102
Total Income 10,308,039 1,483,238 1,889,082
ExpensesManagement and Advisory Fees 39,619,478 8,548,668 1,299,729Depositary, Corporate, Administration and Domiciliary Agency Fees 1,959,899 283,297 82,104Registrar and Transfer Agency Fees 152,576 19,203 17,125Taxe d’Abonnement 1,194,412 180,447 41,105Overdraft Interest 488,782 83,499 8,996Income Cleansing** 26,367 - -Interest on Swap Transactions 79,473 - -Sundry Fees*** 1,149,728 113,917 64,712
44,670,715 9,229,031 1,513,771
Less: Fee Waiver**** 412,690 16,627 18,466
Total Expenses 44,258,025 9,212,404 1,495,305
Net Investment Income/(Loss) (33,949,986) (7,729,166) 393,777
Net Realised Gain/(Loss) on Sale of Investments 172,330,001 40,899,887 14,428,385Net Realised Gain/(Loss) on Forward Currency Exchange Contracts (60,838,441) (11,562,694) (24,904,528)Net Realised Gain/(Loss) on Financial Futures Contracts (539,473) - -Net Realised Gain/(Loss) on Foreign Exchange 14,811,932 4,629,865 3,434,357Net Realised Gain/(Loss) on Other Derivative Instruments (1,880,140) - -
Net Realised Gain/(Loss) for the Year 123,883,879 33,967,058 (7,041,786)
Net Change in Unrealised Gain/(Loss) on Investments 180,925,584 46,386,450 12,053,886Net Change in Unrealised Gain/(Loss) on Forward Currency Exchange Contracts (1,472,498) (14,869,044) 10,105,427Net Change in Unrealised Gain/(Loss) on Financial Futures Contracts (75,233) - -Net Change in Unrealised Gain/(Loss) on Foreign Exchange 471,524 1,290,722 (565,912)Net Change in Unrealised Gain/(Loss) on Other Derivative Instruments (277,333) - -
Net Change in Unrealised Gain/(Loss) for the Year 179,572,044 32,808,128 21,593,401
Increase/(Decrease) in Net Assets as a Result of Operations 269,505,937 59,046,020 14,945,392
Movements in Share CapitalSubscriptions 2,199,424,389 202,574,688 32,843,300Redemptions (2,098,802,710) (403,398,262) (95,099,920)
Increase/(Decrease) in Net Assets as a Result of Movements in Share Capital 100,621,679 (200,823,574) (62,256,620)
Dividend Distribution (2,363,518) (6) (1,440,404)
Net Assets at the End of the Year 4,645,838,934 683,749,541 146,423,791
* The opening balance was combined using the foreign exchange rates as at 31 March 2017. The same net assets when combined using the foreign exchange rates ruling as at 31 March 2016 reflected afigure of USD 4,456,869,639.** Please refer to Note 12.*** Sundry Fees are principally comprised of Directors’ fees, audit and tax related fees and expenses, registration, publication, mailing, printing, legal and marketing expenses.**** Please refer to Note 3c).
The accompanying notes form an integral part of these Financial Statements.
12

Private Bank Funds ICombined Statement of Operations and Changes in Net Assets (continued)For the Year Ended 31 March 2017
AccessBalanced
Fund (USD)USD
AccessCapital Preservation
Fund (EUR) (1)EUR
AccessCapital Preservation
Fund (USD) (2)USD
AccessConservative
Fund (GBP) (3)GBP
AccessGrowth
Fund (GBP) (3)GBP
AccessGrowth
Fund (USD)USD
1,003,262,833 621,030,367 411,884,838 15,326,889 9,134,888 66,857,095
346,433 - - 197,078 40,246 207,450100,518 - - - 590 6,376
13,174 25,109 10,565 606 506 1,195
460,125 25,109 10,565 197,684 41,342 215,021
10,536,356 4,050,394 3,013,843 70,509 45,012 618,386321,256 225,327 133,061 18,639 17,317 40,30916,644 21,984 11,364 2,771 902 11,321
208,781 92,544 51,853 2,384 1,405 16,40947,076 51,721 14,245 489 472 4,791
- - - - - -- - - - - -
127,107 110,980 93,377 26,947 27,725 73,611
11,257,220 4,552,950 3,317,743 121,739 92,833 764,827
1,527 23,296 6,471 36,281 44,497 49,358
11,255,693 4,529,654 3,311,272 85,458 48,336 715,469
(10,795,568) (4,504,545) (3,300,707) 112,226 (6,994) (500,448)
40,562,532 21,813,899 13,076,563 1,352,603 1,468,380 1,705,428(7,617,888) (1,340,703) (1,541,991) (1,188,342) (1,442,341) (605,588)
- - - - - -2,810,044 2,110,649 764,425 58,607 104,966 159,197
- - - - - -
35,754,688 22,583,845 12,298,997 222,868 131,005 1,259,037
39,779,907 8,448,420 5,313,722 (167,413) (178,871) 4,187,6206,223,830 (6,439,258) 1,129,194 293,364 516,259 541,456
- - - - - -(1,190,278) 873,458 (313,599) (18,018) (14,471) (64,112)
- - - - - -
44,813,459 2,882,620 6,129,317 107,933 322,917 4,664,964
69,772,579 20,961,920 15,127,607 443,027 446,928 5,423,553
209,147,579 196,506,588 82,045,262 6,628,917 28,920 14,008,115(485,464,122) (304,692,971) (198,522,182) (22,256,088) (9,577,303) (33,184,811)
(276,316,543) (108,186,383) (116,476,920) (15,627,171) (9,548,383) (19,176,696)
- (241,713) - (142,745) (33,433) (86,138)
796,718,869 533,564,191 310,535,525 - - 53,017,814
(1) This Sub-Fund was renamed from Private Bank Funds I - Access Conservative Fund (EUR) to Private Bank Funds I - Access Capital Preservation Fund (EUR) on 1 July 2016.(2) This Sub-Fund was renamed from Private Bank Funds I - Access Conservative Fund (USD) to Private Bank Funds I - Access Capital Preservation Fund (USD) on 1 July 2016.(3) This Sub-Fund was liquidated on 16 November 2016.
13

Private Bank Funds ICombined Statement of Operations and Changes in Net Assets (continued)For the Year Ended 31 March 2017
Blue andGreen
Fund (4)EUR
DiscretionaryFixed Income
Government Fund (5)EUR
DynamicMulti-AssetFund (EUR)
EUR
DynamicMulti-AssetFund (USD)
USD
IslamicGlobal DynamicEquity Fund (6)
USD
MontesExcelsis
FundUSD
91,849,841 7,203,779 362,219,589 260,313,102 30,297,725 193,314,199
893,737 - 466,139 2,717,748 337,273 572,209203,031 8,261 - - - -
1,758 - 2,421 37,837 282 9,431
1,098,526 8,261 468,560 2,755,585 337,555 581,640
338,296 - 4,307,694 4,327,504 188,090 746,26372,790 7,361 261,121 276,767 53,787 79,508
625 1,245 13,151 18,763 6,372 2,1324,609 - 239,252 245,179 8,670 55,345
23,745 - 205,954 14,963 132 5,280- - - - 26,367 -
74,384 - - - - -30,197 6,091 108,544 175,684 53,276 82,827
544,646 14,697 5,135,716 5,058,860 336,694 971,355
- 36,410 22,976 33,937 88,347 3,230
544,646 (21,713) 5,112,740 5,024,923 248,347 968,125
553,880 29,974 (4,644,180) (2,269,338) 89,208 (386,485)
2,694,400 170,243 10,033,682 7,753,614 3,781,090 3,162,979(687,521) 293,220 (5,691,025) 3,125,047 2,701 412,412
(1,931,404) - 542,672 564,024 - 380,2381,344,913 (2,562) (2,036,230) 96,631 10,654 25,516
(1,759,755) - - - - -
(339,367) 460,901 2,849,099 11,539,316 3,794,445 3,981,145
68,294 (181,079) 27,800,485 24,845,049 (2,441,193) 6,477,846(1,318,738) (308,868) 2,439,053 (1,128,595) - 53,960
(26,777) - (20,577) (19,880) - (4,760)8,783 (16,460) 18,065 380,452 3,012 78,686
(259,575) - - - - -
(1,528,013) (506,407) 30,237,026 24,077,026 (2,438,181) 6,605,732
(1,313,500) (15,532) 28,441,945 33,347,004 1,445,472 10,200,392
- - 640,372,792 734,394,091 24,136 -(90,536,341) (7,188,247) (143,852,269) (176,994,344) (31,767,333) -
(90,536,341) (7,188,247) 496,520,523 557,399,747 (31,743,197) -
- - (908) (2,924) - -
- - 887,181,149 851,056,929 - 203,514,591
(4) This Sub-Fund was liquidated on 25 October 2016.(5) This Sub-Fund was liquidated on 29 April 2016.(6) This Sub-Fund was liquidated on 13 February 2017.
14

Private Bank Funds I
Statement of Changes in the Number of Shares (continued)
For the Year Ended 31 March 2017
Shares Outstandingat the Beginning
of the Year
SharesSubscribed
SharesRedeemed
Shares Outstandingat the End
of the Year
Private Bank Funds I - Access Balanced Fund (EUR)Access Balanced Fund (EUR) A (acc) 2,638,625.545 52,481.319 1,236,104.436 1,455,002.428Access Balanced Fund (EUR) A (inc) 21,010.289 - 21,000.000 10.289Access Balanced Fund (EUR) B (acc) 828,096.238 - 580,731.501 247,364.737Access Balanced Fund (EUR) C (acc) 1,688,849.032 1,377,998.473 423,876.494 2,642,971.011Access Balanced Fund (EUR) D (acc) 13,541.282 - 9,579.601 3,961.681Access Balanced Fund (EUR) Inst (acc) 1,254,700.365 21,622.861 832,244.926 444,078.300
Private Bank Funds I - Access Balanced Fund (GBP)Access Balanced Fund (GBP) A (acc) 60,113.675 - 20,147.254 39,966.421Access Balanced Fund (GBP) A (inc) 26,181.921 3.779 15,001.275 11,184.425Access Balanced Fund (GBP) B (acc)* 28,454.778 - 28,454.778 -Access Balanced Fund (GBP) B (inc) 39,181.397 - 26,437.327 12,744.070Access Balanced Fund (GBP) C (acc) 110,812.772 64,575.247 11,007.290 164,380.729Access Balanced Fund (GBP) C (inc) 52,604.225 11,882.131 56,797.331 7,689.025Access Balanced Fund (GBP) D (acc) 42,125.989 32,224.927 744.320 73,606.596Access Balanced Fund (GBP) D (inc) 58,951.638 6,039.053 48,367.461 16,623.230Access Balanced Fund (GBP) Inst (acc) 217,662.405 75,201.944 120,915.276 171,949.073Access Balanced Fund (GBP) Inst (inc) 1,228,982.825 113,770.256 549,213.282 793,539.799
Private Bank Funds I - Access Balanced Fund (USD)Access Balanced Fund (USD) A (acc) 4,941,564.216 3,022.052 2,794,119.357 2,150,466.911Access Balanced Fund (USD) B (acc) 1,045,343.852 - 459,276.345 586,067.507Access Balanced Fund (USD) C (acc) 844,497.957 1,172,002.097 363,501.319 1,652,998.735Access Balanced Fund (USD) D (acc) 73,611.510 3,623.517 58,647.639 18,587.388Access Balanced Fund (USD) Inst (acc) 1,730,859.487 480,006.868 383,042.004 1,827,824.351
Private Bank Funds I - Access Capital Preservation Fund (EUR) (1)Access Capital Preservation Fund (EUR) A (acc) 2,105,926.445 42,172.961 1,324,486.519 823,612.887Access Capital Preservation Fund (EUR) B (acc) 459,388.800 - 344,655.776 114,733.024Access Capital Preservation Fund (EUR) C (acc) 2,029,464.362 1,570,406.085 652,936.384 2,946,934.063Access Capital Preservation Fund (EUR) C (inc) 103,393.819 - 91,487.271 11,906.548Access Capital Preservation Fund (EUR) D (acc) 15,525.050 - 10,774.907 4,750.143Access Capital Preservation Fund (EUR) Inst (acc) 728,550.456 7,336.657 144,090.638 591,796.475Access Capital Preservation Fund (EUR) Inst (inc) 109,677.027 - 109,667.157 9.870Access Capital Preservation Fund (EUR) Inst (inc) - GBP (hedged) - 52,681.082 - 52,681.082
Private Bank Funds I - Access Capital Preservation Fund (USD) (2)Access Capital Preservation Fund (USD) A (acc) 2,173,066.010 14,639.000 1,038,893.949 1,148,811.061Access Capital Preservation Fund (USD) B (acc) 462,874.329 - 4,475.834 458,398.495Access Capital Preservation Fund (USD) C (acc) 1,054,207.889 709,630.139 656,955.226 1,106,882.802Access Capital Preservation Fund (USD) Inst (acc) 101,054.268 - 73,811.005 27,243.263
Private Bank Funds I - Access Conservative Fund (GBP) (3)Access Conservative Fund (GBP) B (inc) 12,884.595 - 12,884.595 -Access Conservative Fund (GBP) C (inc) 10.000 7,804.117 7,814.117 -Access Conservative Fund (GBP) D (acc) 5,027.110 6,822.271 11,849.381 -Access Conservative Fund (GBP) Inst (inc) 135,373.919 50,932.080 186,305.999 -
Private Bank Funds I - Access Growth Fund (GBP) (3)Access Growth Fund (GBP) Inst (inc) 92,189.129 295.917 92,485.046 -
Private Bank Funds I - Access Growth Fund (USD)Access Growth Fund (USD) A (acc) 334,869.513 - 157,716.893 177,152.620Access Growth Fund (USD) C (acc) 1,528.168 56,224.234 34,525.262 23,227.140Access Growth Fund (USD) D (inc) 30,292.407 - 1,375.768 28,916.639Access Growth Fund (USD) Inst (acc) 19,986.888 11,007.058 4,987.008 26,006.938Access Growth Fund (USD) Inst (inc) 273,779.804 62,910.655 118,399.377 218,291.082
Private Bank Funds I - Blue and Green Fund (4)Blue and Green Fund A (acc) - EUR 3,393.749 - 3,393.749 -
Private Bank Funds I - Discretionary Fixed Income Government Fund (5)Discretionary Fixed Income Government Fund A (acc) 4,654.711 - 4,654.711 -Discretionary Fixed Income Government Fund A (acc) - USD (hedged) 19,421.024 - 19,421.024 -Discretionary Fixed Income Government Fund B (acc) 9,151.663 - 9,151.663 -Discretionary Fixed Income Government Fund C (acc) 18,589.999 - 18,589.999 -Discretionary Fixed Income Government Fund C (acc) - USD (hedged) 10,455.166 - 10,455.166 -Discretionary Fixed Income Government Fund C (inc) 34.360 - 34.360 -
Private Bank Funds I - Dynamic Multi-Asset Fund (EUR)Dynamic Multi-Asset Fund (EUR) C (acc) 3,521,935.941 5,943,649.966 1,213,623.294 8,251,962.613Dynamic Multi-Asset Fund (EUR) C (inc) 90,757.852 259,728.100 195,933.328 154,552.624Dynamic Multi-Asset Fund (EUR) Inst (acc) - 102,946.912 - 102,946.912Dynamic Multi-Asset Fund (EUR) Inst (inc) - 10.000 - 10.000
(1) This Sub-Fund was renamed from Private Bank Funds I - Access Conservative Fund (EUR) to Private Bank Funds I - Access Capital Preservation Fund (EUR) on 1 July 2016.(2) This Sub-Fund was renamed from Private Bank Funds I - Access Conservative Fund (USD) to Private Bank Funds I - Access Capital Preservation Fund (USD) on 1 July 2016.(3) This Sub-Fund was liquidated on 16 November 2016.(4) This Sub-Fund was liquidated on 25 October 2016.(5) This Sub-Fund was liquidated on 29 April 2016.
15

Private Bank Funds I
Statement of Changes in the Number of Shares (continued)
For the Year Ended 31 March 2017
Shares Outstandingat the Beginning
of the Year
SharesSubscribed
SharesRedeemed
Shares Outstandingat the End
of the Year
Private Bank Funds I - Dynamic Multi-Asset Fund (USD)Dynamic Multi-Asset Fund (USD) C (acc) 2,385,760.611 6,617,234.674 1,545,347.570 7,457,647.715Dynamic Multi-Asset Fund (USD) C (acc) - AUD (hedged) - 75,916.579 - 75,916.579Dynamic Multi-Asset Fund (USD) C (acc) - SGD (hedged) - 348,887.082 101,443.761 247,443.321Dynamic Multi-Asset Fund (USD) C (inc) 209,948.101 205,424.175 50,104.318 365,267.958Dynamic Multi-Asset Fund (USD) C (inc) - GBP (hedged) - 89,303.710 3,391.617 85,912.093Dynamic Multi-Asset Fund (USD) Inst (acc) - 258,750.869 119,548.362 139,202.507Dynamic Multi-Asset Fund (USD) Inst (inc) - 10.000 - 10.000
Private Bank Funds I - Islamic Global Dynamic Equity Fund (6)Islamic Global Dynamic Equity Fund (USD) A (acc) 9,061.057 183.658 9,244.715 -Islamic Global Dynamic Equity Fund (USD) B (acc) 46,235.507 - 46,235.507 -Islamic Global Dynamic Equity Fund (USD) C (acc) 108,973.109 - 108,973.109 -Islamic Global Dynamic Equity Fund (USD) Inst (acc) 65,836.161 - 65,836.161 -
Private Bank Funds I - Montes Excelsis FundMontes Excelsis Fund C (acc) - USD 1,738,705.748 - - 1,738,705.748
(6) This Sub-Fund was liquidated on 13 February 2017.
* Share Class inactive as at the end of the year.
The accompanying notes form an integral part of these Financial Statements.
16

Private Bank Funds I
Statistical Information (continued)
Net Asset Value per Share in Share Class Currency
31 March 2017 31 March 2016 31 March 2015
Private Bank Funds I - Access Balanced Fund (EUR)Access Balanced Fund (EUR) A (acc) 139.90 129.59 138.19Access Balanced Fund (EUR) A (inc) 106.15 98.93 -Access Balanced Fund (EUR) B (acc) 141.12 130.33 138.55Access Balanced Fund (EUR) C (acc) 147.45 135.62 143.53Access Balanced Fund (EUR) D (acc) 117.62 108.43 115.03Access Balanced Fund (EUR) Inst (acc) 124.13 114.03 120.55
Private Bank Funds I - Access Balanced Fund (GBP)Access Balanced Fund (GBP) A (acc) 126.72 115.69 122.40Access Balanced Fund (GBP) A (inc) 124.26 113.70 121.32Access Balanced Fund (GBP) B (acc)* - 127.13 134.08Access Balanced Fund (GBP) B (inc) 124.20 113.53 121.78Access Balanced Fund (GBP) C (acc) 107.29 97.31 102.30Access Balanced Fund (GBP) C (inc) 121.86 113.52 121.34Access Balanced Fund (GBP) D (acc) 117.86 107.07 112.69Access Balanced Fund (GBP) D (inc) 118.93 108.83 115.67Access Balanced Fund (GBP) Inst (acc) 116.13 105.21 110.39Access Balanced Fund (GBP) Inst (inc) 112.40 103.01 109.98
Private Bank Funds I - Access Balanced Fund (USD)Access Balanced Fund (USD) A (acc) 125.25 115.82 121.12Access Balanced Fund (USD) B (acc) 125.95 116.11 121.06Access Balanced Fund (USD) C (acc) 136.86 125.66 130.42Access Balanced Fund (USD) D (acc) 116.95 107.60 111.97Access Balanced Fund (USD) Inst (acc) 123.17 112.97 117.13
Private Bank Funds I - Access Capital Preservation Fund (EUR) (1)Access Capital Preservation Fund (EUR) A (acc) 116.68 112.61 117.12Access Capital Preservation Fund (EUR) B (acc) 117.75 113.48 117.84Access Capital Preservation Fund (EUR) C (acc) 119.51 114.87 118.92Access Capital Preservation Fund (EUR) C (inc) 103.90 101.88 106.05Access Capital Preservation Fund (EUR) D (acc) 110.27 105.90 109.57Access Capital Preservation Fund (EUR) Inst (acc) 107.77 103.53 107.14Access Capital Preservation Fund (EUR) Inst (inc) 102.57 100.56 104.06Access Capital Preservation Fund (EUR) Inst (inc) - GBP (hedged) 102.35 - -
Private Bank Funds I - Access Capital Preservation Fund (USD) (2)Access Capital Preservation Fund (USD) A (acc) 114.30 109.69 112.48Access Capital Preservation Fund (USD) B (acc) 103.51 99.19 101.56Access Capital Preservation Fund (USD) C (acc) 116.43 111.28 113.60Access Capital Preservation Fund (USD) Inst (acc) 106.53 101.85 103.82Access Capital Preservation Fund (USD) Inst (inc)* - - 101.02
Private Bank Funds I - Access Conservative Fund (GBP) (3)Access Conservative Fund (GBP) B (inc) - 99.24 102.14Access Conservative Fund (GBP) C (inc) - 102.42 -Access Conservative Fund (GBP) D (acc) - 97.61 -Access Conservative Fund (GBP) Inst (inc) - 100.14 103.66
Private Bank Funds I - Access Growth Fund (GBP) (3)Access Growth Fund (GBP) Inst (inc) - 99.09 106.18
Private Bank Funds I - Access Growth Fund (USD)Access Growth Fund (USD) A (acc) 110.40 100.42 106.02Access Growth Fund (USD) C (acc) 114.94 103.88 -Access Growth Fund (USD) D (inc) 112.08 101.58 106.77Access Growth Fund (USD) Inst (acc) 113.39 102.37 107.25Access Growth Fund (USD) Inst (inc) 112.70 102.08 107.24
Private Bank Funds I - Blue and Green Fund (4)Blue and Green Fund A (acc) - EUR - 27,064.42 -
Private Bank Funds I - Discretionary Fixed Income Government Fund (5)Discretionary Fixed Income Government Fund A (acc) - 122.44 118.46Discretionary Fixed Income Government Fund A (acc) - USD (hedged) - 117.66 113.05Discretionary Fixed Income Government Fund A (inc) - - 101.51Discretionary Fixed Income Government Fund B (acc) - 125.21 120.85Discretionary Fixed Income Government Fund C (acc) - 128.86 123.75Discretionary Fixed Income Government Fund C (acc) - USD (hedged) - 118.31 113.15Discretionary Fixed Income Government Fund C (inc) - 104.49 102.58Discretionary Fixed Income Government Fund C (inc) - GBP (hedged) - - 75.33Discretionary Fixed Income Government Fund C (inc) - USD (hedged) - - 113.15
Private Bank Funds I - Dynamic Multi-Asset Fund (EUR)Dynamic Multi-Asset Fund (EUR) C (acc) 104.27 100.28 -Dynamic Multi-Asset Fund (EUR) C (inc) 103.64 99.71 -Dynamic Multi-Asset Fund (EUR) Inst (acc) 103.98 - -Dynamic Multi-Asset Fund (EUR) Inst (inc) 104.00 - -
(1) This Sub-Fund was renamed from Private Bank Funds I - Access Conservative Fund (EUR) to Private Bank Funds I - Access Capital Preservation Fund (EUR) on 1 July 2016.(2) This Sub-Fund was renamed from Private Bank Funds I - Access Conservative Fund (USD) to Private Bank Funds I - Access Capital Preservation Fund (USD) on 1 July 2016.(3) This Sub-Fund was liquidated on 16 November 2016.(4) This Sub-Fund was liquidated on 25 October 2016.(5) This Sub-Fund was liquidated on 29 April 2016.
17

Private Bank Funds I
Statistical Information (continued)
Net Asset Value per Share in Share Class Currency
31 March 2017 31 March 2016 31 March 2015
Private Bank Funds I - Dynamic Multi-Asset Fund (USD)Dynamic Multi-Asset Fund (USD) C (acc) 105.22 100.29 -Dynamic Multi-Asset Fund (USD) C (acc) - AUD (hedged) 10.06 - -Dynamic Multi-Asset Fund (USD) C (acc) - SGD (hedged) 10.30 - -Dynamic Multi-Asset Fund (USD) C (inc) 105.18 100.28 -Dynamic Multi-Asset Fund (USD) C (inc) - GBP (hedged) 102.56 - -Dynamic Multi-Asset Fund (USD) Inst (acc) 104.61 - -Dynamic Multi-Asset Fund (USD) Inst (inc) 104.65 - -
Private Bank Funds I - Islamic Global Dynamic Equity Fund (6)Islamic Global Dynamic Equity Fund (USD) A (acc) - 129.53 134.43Islamic Global Dynamic Equity Fund (USD) B (acc) - 134.34 138.89Islamic Global Dynamic Equity Fund (USD) C (acc) - 123.52 127.07Islamic Global Dynamic Equity Fund (USD) Inst (acc) - 143.57 147.39
Private Bank Funds I - Montes Excelsis FundMontes Excelsis Fund C (acc) - USD 117.05 111.18 113.17
(6) This Sub-Fund was liquidated on 13 February 2017.
* Share Class inactive as at the end of the year.
The accompanying notes form an integral part of these Financial Statements.
18

1. OrganisationPrivate Bank Funds I (the “Fund” or the “SICAV”) is an investment company incorporated on 16 February 2006 for an unlimited period of time. The name ofthe SICAV was changed from JPMorgan Private Bank Funds I to Private Bank Funds I on 1 August 2015.It is organised under Part I of the Luxembourg Law of 17 December 2010 on Undertakings for Collective Investment, as amended, as a Société Anonymequalifying as a Société d’Investissement à Capital Variable (SICAV). As at 31 March 2017, it comprises of 9 Sub-Funds each relating to a separate investmentportfolio consisting of securities, cash and other instruments.On 16 February 2006, JPMorgan Asset Management (Europe) S.à r.l. was appointed by the SICAV to act as Management Company. From 1 July 2011,JPMorgan Asset Management (Europe) S.à r.l. is acting as a Chapter 15 Management Company under the amended Luxembourg Law of 17 December 2010and complies with UCITS regulations.The SICAV is registered with the Registre de Commerce et des Sociétés of Luxembourg, under number B 114 378.Each Sub-Fund may contain A, B, C, D and Inst Share Classes. These Share Classes may differ in the minimum subscription amount, minimum holdingamount, currency and/or eligibility requirements, the fees and expenses, and the dividend policy applicable to them.Within each Sub-Fund, individual Share Classes may have a currency of denomination that differs from the currency of denomination of the Sub-Fund. Thecurrency of denomination for each Share Class is indicated by a suffix in the name of the Share Class.
2. Significant Accounting PoliciesThe Financial Statements are presented in accordance with Luxembourg regulations relating to Undertakings for Collective Investment.
a) Investment ValuationThe value of securities and/or financial derivative instruments which are quoted or dealt in on any stock exchange shall be based on the latest available priceon the relevant stock exchange.Securities and/or financial derivative instruments dealt in on another regulated market are valued on the basis of the latest available price on such market.In the event that any of the securities held in the SICAV’s portfolio on the Valuation Date are not quoted or dealt in on a stock exchange or another RegulatedMarket, or for any of such securities, no price quotation is available, or if the price as determined pursuant to sub-paragraph is not in the opinion of theDirectors representative of the fair market value of the relevant securities, the value of such securities shall be determined based on the reasonablyforeseeable sales price determined prudently and in good faith.Shares or Units in UCITS or other UCIs are valued at the latest available price or net asset value, as reported or provided by such undertakings or their agents.Liquid assets and money market instruments may be valued at nominal value plus any accrued interest or on an amortised cost basis. All other assets, wherepractice allows, may be valued in the same manner.The Financial Statements are presented on the basis of the net asset values of the Sub-Funds with weekly Net Asset Value frequency calculated on 29 March2017. In accordance with the Prospectus, the net asset values were calculated using the latest exchange rates known at the time of calculation.
b) Swing Pricing AdjustmentA Sub-Fund may suffer dilution of the Net Asset Value per Share due to investors buying or selling Shares in a Sub-Fund at a price that does not reflect thedealing and other costs that arise when security trades are undertaken by the Investment Manager to accommodate cash inflows or outflows.In order to counter this impact, a Swing Pricing mechanism may be adopted to protect the interests of Shareholders of the SICAV. If on any Valuation Day, theaggregate net transactions in Shares of a Sub-Fund exceed a pre-determined threshold, as determined and reviewed for each Sub-Fund on a periodic basisby the Management Company, the Net Asset Value per Share may be adjusted upwards or downwards to reflect net inflows and net outflows respectively.The net inflows and net outflows will be determined by the Management Company based on the latest available information at the time of calculation of theNet Asset Value per Share. The extent of the price adjustment will be set by the Management Company to reflect dealing and other costs. Such adjustmentmay vary from Sub-Fund to Sub-Fund and will not exceed 2% of the original Net Asset Value per Share. The price adjustment applicable to a specificSub-Fund is available on request from the Management Company at its registered office.The swing pricing mechanism has been applied to Private Bank Funds I - Islamic Global Dynamic Equity Fund. As at the end of the year, no swing adjustmenthas been applied.
c) Realised and Unrealised Gains and Losses on InvestmentsInvestment transactions are accounted for on the trade date (the date the order to buy or sell is executed). For trades into other collective investmentschemes, transactions are accounted for on receipt of the trade confirmation from the underlying transfer agents.Realised gains and losses on sales of investments are calculated on the average book cost. The associated foreign exchange movement between the date ofpurchase and date of sale of investments is included in realised gains and losses on investments. Unrealised gains and losses on holdings of investments arecalculated on the total book cost and include the associated unrealised gains and losses on foreign exchange.
d) Conversion of Foreign CurrenciesThe books and records of each Sub-Fund are denominated in the base currency of the corresponding Sub-Fund. Amounts denominated in other currenciesare translated into the base currency on the following basis: (i) investment valuations and other assets and liabilities initially expressed in other currenciesare converted each business day into the base currency using currency exchange rates prevailing on each such business day; (ii) purchases and sales offoreign investments, income and expenses are converted into the base currency using currency exchange rates prevailing on the respective dates of suchtransactions.Net realised and unrealised gains or losses on foreign exchange represent: (i) foreign exchange gains and losses from the sale and holding of foreigncurrencies and instruments; (ii) gains and losses between trade date and settlement date on securities transactions and forward currency exchangecontracts; and (iii) gains and losses arising from the difference between amounts of dividends and interest recorded and the amounts actually received.The resulting gains and losses on translation are included in “Net Realised Gain/(Loss) on Foreign Exchange” in the Combined Statement of Operations andChanges in Net Assets.The reference currency of the SICAV as reflected in the combined statements is USD.The principal exchange rates applied for the year ended 31 March 2017 are the latest exchange rates known at the time of the NAV calculation:1 USD = 1.30512531 AUD;1 USD = 0.92979148 EUR;1 USD = 0.80456997 GBP;1 USD = 1.39463000 SGD.
19
Private Bank Funds INotes to the Financial StatementsAs at 31 March 2017

e) Income RecognitionInterest income is accrued daily and includes the amortisation of premiums and accretion of discounts, where applicable. Bank interest income is recognisedon an accrual basis, except for Private Bank Funds I - Islamic Global Dynamic Equity Fund, which was not allowed to be charged with debit interest norallowed to receive credit interest. Dividend income is accrued on the ex-dividend date. This income is shown net of any withholding taxes and adjustedaccordingly when tax reclaims apply. Dividends concerning Private Bank Funds I - Islamic Global Dynamic Equity Fund were subject to a cleansing processexplained in Note 12.
f) Forward Currency Exchange ContractsUnrealised gains or losses on outstanding forward currency exchange contracts are valued on the basis of currency exchange rates prevailing at the relevantvaluation date. The changes in such amounts are included in the Combined Statement of Operations and Changes in Net Assets under “Net Change inUnrealised Gain/(Loss) on Forward Currency Exchange Contracts”. When a contract is closed, the Realised Gain/(Loss) is recorded under “Net RealisedGain/(Loss) on Forward Currency Exchange Contracts” in the Combined Statement of Operations and Changes in Net Assets. Unrealised Gains or Losses arerecorded under “Net Unrealised Gain/(Loss) on Forward Currency Exchange Contracts” in the Combined Statement of Net Assets.
g) Financial Futures Contracts on Securities and IndicesRegulated financial futures contracts are valued at the exchange quoted settlement price. Initial margin deposits are made upon entering into the contractsand can be either in cash or securities. During the period the contracts are open, changes in the value of the contracts are recognised as unrealised gains andlosses by “marking-to-market” on a daily basis to reflect the market value of the contracts at the end of each business day’s trading. Variation marginpayments are made or received on a daily basis, depending upon whether losses or gains are incurred. When a contract is closed, the SICAV records arealised gain or loss equal to the difference between the proceeds from, or cost of, the closing transaction and the initial cost of the contract in “Net RealisedGain/(Loss) on Financial Futures Contracts” in the Combined Statement of Operations and Changes in Net Assets.Unrealised gains or losses are recorded under “Net Unrealised Gain/(Loss) on Financial Futures Contracts” in the Combined Statement of Net Assets. Thechanges in such amounts are recorded under “Net Change in Unrealised Gain/(Loss) on Financial Futures Contracts” in the Combined Statement ofOperations and Changes in Net Assets.Daily margin calls are recorded under “Net Realised Gain/(Loss) on Financial Futures Contracts” in the Combined Statement of Operations and Changes inNet Assets.
h) Option ContractsThe SICAV may write options on securities, futures and currencies. These options are settled in cash and subject the SICAV to unlimited risk of loss. TheSICAV, however, is not subject to credit risk on written options as the counterparty has already performed its obligation by paying the premium at theinception of the contract.Options purchased would be recorded as investments; options written or sold would be recorded as liabilities under “Other Derivative Instruments at MarketValue” in the Combined Statement of Net Assets. When the exercise of an option results in a cash settlement, the difference between the premium and thesettlement proceeds is accounted for as a realised gain or loss. When securities are acquired or delivered upon exercise of an option, the acquisition cost orsale proceeds are adjusted by the amount of the premium. When an option is closed, the difference between the premium and the cost to close the position isaccounted for as a realised gain or loss. When an option expires, the premium is accounted for as a realised gain for options written or as a realised loss foroptions purchased.For options on futures, where the investment manager is based in the United Kingdom, variation margin payments are made or received daily, dependingupon whether losses or gains are incurred on the underlying futures contracts.As at 31 March 2017, no Sub-Funds held Option Contracts. The realised gains or losses in relation to contracts closed during the year, are recorded under “NetRealised Gain/(Loss) on Other Derivative Instruments” in the Combined Statement of Operations and Changes in Net Assets.
i) Credit Default SwapsA Credit Default Swap is a credit derivative transaction in which two parties enter into an agreement, whereby one party pays the other a fixed periodiccoupon for the specified life of the agreement. The other party makes no payments unless a credit event, relating to a predetermined reference asset,occurs. If such an event occurs, the party will then make a payment to the first party, and the swap will terminate. The value of the underlying securities shallbe taken into account for the calculation of the investment and borrowing powers applicable to individual issuers.As at 31 March 2017, no Sub-Funds held Credit Default Swaps. The realised gains or losses in relation to contracts closed during the year, are recorded under“Net Realised Gain/(Loss) on Other Derivative Instruments” in the Combined Statement of Operations and Changes in Net Assets.
3. Fees and Expensesa) Charging StructuresThe Management Company is entitled to receive the initial charge, redemption charge, Management and Advisory Fee and any charge on switches whereapplicable to the Share Class as per the Prospectus. The initial charge, redemption charge, Management and Advisory Fee and any charge on switches whereapplicable to a Share Class may be applied, or may be waived in whole or in part at the discretion of the Management Company. The Management Companymay pay all or part of the fees and charges it receives as a commission or discount to financial intermediaries or Distributors.Investment in the SICAV is generally offered via different charging structures, as represented by the A, B, C, D and Inst Share Classes.All fees, charges, expenses and costs to be borne by the SICAV will be subject, where applicable to the addition of United Kingdom VAT or any analogoustaxation.Any exceptions to the charging structures detailed above are noted in the Prospectus.
b) Management and Advisory FeesThe SICAV pays to the Management Company a management fee calculated as a percentage of the average daily net assets of each Sub-Fund or Share Classunder its management (“Management and Advisory Fee”). The Management and Advisory Fee is accrued daily and payable monthly in arrears at the ratespecified in the Prospectus.Subject to the investment restrictions described in the Prospectus, Sub-Funds may invest in UCITS, other UCIs and closed ended investment undertakingsqualifying as transferable securities within the meaning of UCITS rules including investment trusts (the “Undertakings”) managed by the ManagementCompany, the Investment Managers or any other member of JPMorgan Chase & Co. In accordance with the Prospectus, no double-charging of fees will occurwith the exception of performance fees. The avoidance of a double-charge of the Management and Advisory Fee on such assets is achieved by either a)excluding the assets from the net assets on which the Management and Advisory Fee are calculated or b) investing in Undertakings via Classes that do notaccrue a Management and Advisory Fee or other equivalent fees payable to the relevant Investment Manager’s group; or c) the Management and AdvisoryFee being netted off by a rebate to the SICAV or Sub-Fund of the management and advisory fee (or equivalent) charged to the underlying Undertakings; or d)charging only the difference between the Management and Advisory Fee of the SICAV or Sub-Fund as per the Prospectus and the Management and AdvisoryFee (or equivalent) charged to the Undertakings.
20
Private Bank Funds INotes to the Financial Statements (continued)As at 31 March 2017

Where a Sub-Fund invests in Undertakings managed by investment managers which are not members of JPMorgan Chase & Co. group, the Management andAdvisory Fee, as specified in the Prospectus, may be charged regardless of any fees reflected in the price of the shares or units of the Undertakings. SeeAppendix 11.As at 31 March 2017, the Sub-Funds (except Private Bank Funds I - Dynamic Multi-Asset Fund (EUR), Private Bank Funds I - Dynamic Multi-Asset Fund (USD)and Private Bank Funds I - Montes Excelsis Fund) invested in Institutional I or X Share Classes of UCITS managed by members of JPMorgan Chase & Co.
c) Operating and Administrative ExpensesThe SICAV bears all its ordinary operating and administrative expenses at the rates set out in the Prospectus (“Operating and Administrative Expenses”) tomeet all fixed and variable costs, charges, fees and other expenses incurred in the operation and administration of the SICAV from time to time.The Operating and Administrative Expenses are calculated as a percentage of the average daily net assets of each Sub-Fund or Share Class. They are accrueddaily and payable monthly in arrears at a maximum rate as specified in the relevant section of the Prospectus.The Operating and Administrative Expenses cover:i) Expenses directly contracted by the SICAV, including but not limited to the custodian fees, Depositary fees, auditing fees and expenses, the Luxembourgtaxe d’abonnement, Directors’ fees (no fees will be paid to Directors who are also directors or employees of JPMorgan Chase & Co.) and reasonableout-of-pocket expenses incurred by the Directors.ii) A “fund servicing fee” paid to the Management Company for administrative and related services which will be the remaining amount of the Operating andAdministrative Expenses after deduction of the expenses detailed under section i) above. The Management Company then bears all expenses incurred in theday to day operation and administration of the SICAV, including but not limited to formation expenses such as organisation and registration costs;accounting expenses covering fund accounting and administration services; transfer agency expenses covering registrar and transfer agency services; theadministrative services and domiciliary agent services; the fees and reasonable out-of-pocket expenses of the paying agents and representatives; legal feesand expenses; ongoing registration, listing and quotation fees, including translation expenses; the cost of postage, telephone, facsimile transmission andother electronic means of communication; and the costs and expenses of preparing, printing, and distributing the SICAV’s Prospectus, Key InvestorInformation Documents or any offering document, financial reports and other documents made available to Shareholders.Operating and Administrative Expenses do not include Transaction Fees and Extraordinary Expenses.The Operating and Administrative Expenses borne by the A, B and D Share Classes are set at a fixed rate specified in the Prospectus. Unless otherwise statedin the Prospectus, the Operating and Administrative Expenses borne by the C and Inst Share Classes will be the lower of the actual expenses incurred by theSICAV and the maximum rate detailed in the Prospectus. To the extent that actual expenses exceed the rate specified in Appendix III of the Prospectus, theamount borne by the Management Company is separately disclosed as a “Fee Waiver” in the Combined Statement of Net Assets and Combined Statement ofOperations and Changes in Net Assets.
4. Transactions with Connected PartiesAll transactions with connected parties were carried out on an arm’s length basis.JPMorgan Chase & Co. and its affiliates are counterparties for certain forward currency exchange contracts and financial futures contracts. The ManagementCompany, Registrar and Transfer Agent, Global Distributor and Domiciliary Agent, Investment Managers, Depositary, Corporate, Administrative and ListingAgent and other related Agents of the SICAV are considered as connected parties as they are affiliated entities of JPMorgan Chase & Co. In addition ElvingerHoss Prussen (of which Mr Jacques Elvinger who is Chairman of the Board of the Directors of the SICAV, is a partner) is compensated for legal services to theSICAV.
5. Dividend PolicyShare Classes with the suffix “(inc)” may pay dividends.Share Classes with the suffix “(acc)” will not normally pay dividends.During the year ended 31 March 2017, the SICAV paid dividends as follows:Class Name Currency Dividend Amount per Share Payment DateAccess Balanced Fund (EUR) A (inc) EUR 0.55 22 June 2016Access Balanced Fund (GBP) A (inc) GBP 0.26 22 June 2016Access Balanced Fund (GBP) B (inc) GBP 0.48 22 June 2016Access Balanced Fund (GBP) C (inc) GBP 2.98 22 June 2016Access Balanced Fund (GBP) D (inc) GBP 0.79 22 June 2016Access Balanced Fund (GBP) Inst (inc) GBP 1.21 22 June 2016Access Capital Preservation Fund (EUR) C (inc) (1) EUR 1.97 22 June 2016Access Capital Preservation Fund (EUR) Inst (inc) (1) EUR 1.99 22 June 2016Access Conservative Fund (GBP) C (inc)* GBP 0.22 22 June 2016Access Conservative Fund (GBP) Inst (inc)* GBP 1.03 22 June 2016Access Growth Fund (GBP) Inst (inc)* GBP 0.37 22 June 2016Access Growth Fund (USD) D (inc) USD 0.13 22 June 2016Access Growth Fund (USD) Inst (inc) USD 0.33 22 June 2016Dynamic Multi-Asset Fund (EUR) C (inc) EUR 0.01 22 June 2016Dynamic Multi-Asset Fund (USD) C (inc) USD 0.01 22 June 2016
(1) This Sub-Fund was renamed from Private Bank Funds I - Access Conservative Fund (EUR) to Private Bank Funds I - Access Capital Preservation Fund (EUR) on 1 July 2016. Further to this change, ShareClasses have been renamed.* Share Class closed as at the end of the year.
6. TaxationThe SICAV is not subject to taxation in Luxembourg on its income, profits or gains. The SICAV is not subject to net wealth tax in Luxembourg. The only tax towhich the SICAV in Luxembourg is subject is the subscription tax (“taxe d’abonnement”) up to a rate of 0.05% per annum based on the net asset valueattributed to each Share Class at the end of the relevant quarter, calculated and paid quarterly. A reduced tax rate of 0.01% per annum of the net assets willbe applicable to Share Classes as identified in the Appendix. The 0.01% and 0.05% rates described above, as appropriate, are not applicable for the portionof the assets of the SICAV invested in other Luxembourg collective investment undertakings which are themselves already subject to the taxe d’abonnement.No stamp duty, capital duty or other tax is payable in the Grand Duchy of Luxembourg upon the issue of the Shares of the SICAV. No tax is payable on realisedor unrealised capital appreciation of the assets of the SICAV in the Grand Duchy of Luxembourg. Although the SICAV’s realised capital gains, whether short orlong-term, are not expected to become taxable in another country, the shareholders must be aware and recognise that such a possibility is not totallyexcluded. The regular income of the SICAV from some of its securities, as well as interest earned on cash deposits in certain countries, may be subject towithholding taxes at varying rates, which normally cannot be recovered.
21
Private Bank Funds INotes to the Financial Statements (continued)As at 31 March 2017

7. Statement of Changes in InvestmentsA list, specifying for each investment within the existing Sub-Funds the total purchases and sales which occurred during the financial year, may be obtainedfree of charge upon request at the registered office of the SICAV. Additional information on investments within that Sub-Fund’s portfolio is available toShareholders at the registered office of the SICAV.
8. Value of Financial Instruments and Associated RisksThe SICAV entered into forward currency exchange contracts and financial futures contracts which, to varying degrees, represent a market risk in excess ofthe amount reflected on the Combined Statement of Net Assets. The amount of the contracts represents the extent of the SICAV’s participation in thesefinancial instruments. Market risks associated with such contracts arise due to the possible movements in foreign exchange rates, indices, and securityvalues underlying these instruments. Other market and credit risks include the possibility that there may be an illiquid market for the contracts, that achange in the value of the contracts may not directly correlate with changes in the value of the underlying currencies, indices, or securities, or that thecounterparty to a contract defaults on its obligation to perform under the terms of the contract.
9. Commission Sharing ArrangementsThe Investment Managers may enter into commission sharing arrangements only where there is a direct and identifiable benefit to the clients of theInvestment Managers, including the SICAV, and where the Investment Managers are satisfied that the transactions generating the shared commissions aremade in good faith, in strict compliance with applicable regulatory requirements and in the best interests of the SICAV and the Shareholders. Any sucharrangements must be made by the Investment Manager on terms commensurate with best market practice. Due to their local regulatory rights, certainInvestment Managers may make use of soft commission to pay for research or execution services. Other jurisdictions may have other arrangements in placeto pay for such services in accordance with local regulatory obligations.
10. Information for German Registered ShareholdersA list, specifying for each investment within each Sub-Fund the total purchases and sales which occurred during the financial year, may be obtained free ofcharge upon request at the registered office of the SICAV and at the office of the German paying and information agent, J.P. Morgan AG, Taunustor 1,D-60310 Frankfurt am Main, Germany. Additional information on investments within each Sub-Fund’s portfolio is available to shareholders at the registeredoffice of the SICAV and at the office of the German paying and information agent.
11. Information for Investors in SwitzerlandRepresentative in Switzerland: JPMorgan Asset Management (Switzerland) LLC, Dreikönigstrasse 21, 8002 Zürich.Paying Agent in Switzerland: J.P. Morgan (Suisse) SA, 8 Rue de la Confédération, 1204 Geneva.The Prospectus, the Key Investor Information Documents, the articles of incorporation, the annual and semi-annual financial report as well as a list of thepurchases and sales which the SICAV has undertaken during the financial year may be obtained free of charge from the representative.
12. Income CleansingThe Private Bank Funds I - Islamic Global Dynamic Equity Fund invested in a diversified portfolio of equity securities within the Dow Jones Islamic MarketWorld Index (the “Islamic Index”).The Islamic Index was established in accordance with the Dow Jones Indexes’s methodology and the Islamic investment guidelines set by the Islamic Index’sShari’ah Supervisory Board. The Islamic Index is constructed from the universe of the pool of stocks contained in the Dow Jones Global Indexes. Thecomponents for the Islamic Index are selected by filtering this index universe through screens for business activities and financial ratios to remove stocksthat are not suitable for Islamic investment purposes.The impure income cleansing was accrued quarterly upon receipt of the impure income information provided by the Islamic Index. The Net Asset Value of theSub-Fund was adjusted to take into account the portion of impure income received on the investments of the Sub-Fund.Until the Sub-Fund’s liquidation on 13 February 2017, a total of USD 26,367 had been considered for income cleansing and paid to the foundation [Children inCrisis].
13. Directors FeesThe only remuneration paid to Directors is an annual fee. This was waived by Mr Benoit Dumont. The total Directors’ fees for the year amounted toEUR 49,500 of which EUR 17,500 was due to the Chairman.
14. Transaction CostsFor the year ended 31 March 2017, the SICAV incurred transaction costs which have been defined as brokerage fees relating to purchase or sale oftransferable securities, derivatives (except OTC derivatives) or other eligible assets. The SICAV also incurred transaction costs charged by the custodianagent and relating to purchase and sale of transferable securities as follows:Sub-Fund Base Currency Custodian Transaction Costs and Brokerage Fees
(in Base Currency)
Private Bank Funds I - Access Balanced Fund (EUR) EUR 47,576
Private Bank Funds I - Access Balanced Fund (GBP) GBP 23,465
Private Bank Funds I - Access Balanced Fund (USD) USD 166,406
Private Bank Funds I - Access Capital Preservation Fund (EUR) EUR 144,500
Private Bank Funds I - Access Capital Preservation Fund (USD) USD 96,122
Private Bank Funds I - Access Conservative Fund (GBP) GBP 10,300
Private Bank Funds I - Access Growth Fund (GBP) GBP 5,048
Private Bank Funds I - Access Growth Fund (USD) USD 18,657
Private Bank Funds I - Blue and Green Fund EUR 156,141
Private Bank Funds I - Discretionary Fixed Income Government Fund EUR 3,011
Private Bank Funds I - Dynamic Multi-Asset Fund (EUR) EUR 349,546
Private Bank Funds I - Dynamic Multi-Asset Fund (USD) USD 356,429
Private Bank Funds I - Islamic Global Dynamic Equity Fund USD 40,304
Private Bank Funds I - Montes Excelsis Fund USD 90,076
22
Private Bank Funds INotes to the Financial Statements (continued)As at 31 March 2017

15. Significant Events during the Yeara) Changes to Sub-Fund Benchmark IndicesWith effect from 1 April 2016, benchmark indices of the following Sub-Funds changed as follows:Sub-Fund Old Benchmark New Benchmark
Private Bank Funds I -Access Balanced Fund(EUR)
MSCI World Index Local Currency (Total Return Net) (45%)/Barclays GlobalAggregate 1-10 Year ex-Japan Index (Total Return Gross) Hedged to EUR(35%)/EONIA (5%)/Bloomberg Commodity Index Total Return (5%)/HFRX GlobalHedge Fund Index USD Hedged to EUR (10%)
MSCI World Index Local Currency (Total Return Net) (55%)/Barclays Global AggregateIndex Hedged to EUR (30%)/Barclays Euro Treasury Bills 0-3 Months Index (5%)/HFRXGlobal Hedge Fund USD Index Hedged to EUR (10%)
Private Bank Funds I -Access Balanced Fund(GBP)
MSCI World Index Local Currency (Total Return Net) (50%)/Barclays GlobalAggregate 1-10 Year ex-Japan Index (Total Return Gross) Hedged to GBP (30%)/1Week GBP LIBID (5%)/Bloomberg Commodity Index Total Return (5%)/HFRXGlobal Hedge Fund Index USD Hedged to GBP (10%)
MSCI World Index Local Currency (Total Return Net) (55%)/Barclays Global AggregateIndex Hedged to GBP (30%)/Barclays Sterling Treasury Bills 0-3 Month (5%)/HFRXGlobal Hedge Fund USD Index Hedged to GBP (10%)
Private Bank Funds I -Access Balanced Fund(USD)
MSCI World Index (Total Return Net) (45%)/Barclays Global Aggregate 1-10 Yearex-Japan Index (Total Return Gross) Hedged to USD (35%)/ICE Overnight USDLIBOR (5%)/Bloomberg Commodity Index Total Return (5%)/HFRX Global HedgeFund USD Index (10%)
MSCI World Index (Total Return Net) (55%)/Barclays Global Aggregate Index Hedged toUSD (30%)/Barclays U.S. Treasury Bills 1-3 Months (5%)/HFRX Global Hedge Fund USDIndex (10%)
Private Bank Funds I -Access CapitalPreservation Fund(EUR)
Barclays Global Aggregate 1-10 Year ex-Japan Index (Total Return Gross) Hedgedto EUR (60%)/MSCI World Index Local Currency (Total Return Net) (20%)/EONIA(5%)/Bloomberg Commodity Index Total Return (5%)/HFRX Global Hedge FundIndex USD Hedged to EUR (10%)
Barclays Global Aggregate Index Hedged to EUR (65%)/MSCI World Index Local Currency(Total Return Net) (20%)/Barclays Euro Treasury Bills 0-3 Months Index (5%)/HFRXGlobal Hedge Fund USD Index Hedged to EUR (10%)
Private Bank Funds I -Access CapitalPreservation Fund(USD)
Barclays Global Aggregate 1-10 Year ex-Japan Index (Total Return Gross) Hedgedto USD (60%)/MSCI World Index (Total Return Net) (20%)/ICE Overnight USDLIBOR (5%)/Bloomberg Commodity Index Total Return (5%)/HFRX Global HedgeFund USD Index (10%)
Barclays Global Aggregate Index Hedged to USD (65%)/MSCI World Index (Total ReturnNet) (20%)/Barclays U.S. Treasury Bills 1-3 Months (5%)/HFRX Global Hedge Fund USDIndex (10%)
Private Bank Funds I -Access ConservativeFund (GBP)
MSCI World Index Local Currency (Total Return Net) (30%)/Barclays GlobalAggregate 1-10 Year ex-Japan Index (Total Return Gross) Hedged to GBP (50%)/1Week GBP LIBID (5%)/Bloomberg Commodity Index Total Return (5%)/HFRXGlobal Hedge Fund Index USD Hedged to GBP (10%)
Barclays Global Aggregate Index Hedged to GBP (50%)/MSCI World Index Local Currency(Total Return Net) (35%)/Barclays Sterling Treasury Bills 0-3 Month (5%)/HFRX GlobalHedge Fund USD Index Hedged to GBP (10%)
Private Bank Funds I -Access Growth Fund(GBP)
MSCI World Index Local Currency (Total Return Net) (70%)/Barclays GlobalAggregate 1-10 Year ex-Japan Index (Total Return Gross) Hedged to GBP (10%)/1Week GBP LIBID (5%)/Bloomberg Commodity Index Total Return (5%)/HFRXGlobal Hedge Fund Index USD Hedged to GBP (10%)
MSCI World Index Local Currency (Total Return Net) (75%)/Barclays Global AggregateIndex Hedged to GBP (10%)/Barclays Sterling Treasury Bills 0-3 Month (5%)/HFRXGlobal Hedge Fund USD Index Hedged to GBP (10%)
Private Bank Funds I -Access Growth Fund(USD)
MSCI World Index (Total Return Net) (70%)/Barclays Global Aggregate 1-10 Yearex-Japan Index (Total Return Gross) Hedged to USD (10%)/ICE Overnight USDLIBOR (5%)/Bloomberg Commodity Index Total Return (5%)/HFRX Global HedgeFund USD Index (10%)
MSCI World Index (Total Return Net) (75%)/Barclays Global Aggregate Index Hedged toUSD (10%)/Barclays U.S. Treasury Bills 1-3 Months (5%)/HFRX Global Hedge Fund USDIndex (10%)
b) Sub-Fund LiquidationsDuring the year, the following Sub-Funds were liquidated:- Private Bank Funds I - Discretionary Fixed Income Government Fund on 29 April 2016;- Private Bank Funds I - Blue and Green Fund on 25 October 2016;- Private Bank Funds I - Access Conservative Fund (GBP) on 16 November 2016;- Private Bank Funds I - Access Growth Fund (GBP) on 16 November 2016;- Private Bank Funds I - Islamic Global Dynamic Equity Fund on 13 February 2017.
c) Changes to Sub-Fund namesWith effect from 1 July 2016, the following Sub-Funds were renamed as follows:- Private Bank Funds I - Access Conservative Fund (EUR) to Private Bank Funds I - Access Capital Preservation Fund (EUR);- Private Bank Funds I - Access Conservative Fund (USD) to Private Bank Funds I - Access Capital Preservation Fund (USD).Further to this change, the respective Share Classes were renamed accordingly.
d) Management Fees WaivedWith effect from 29 April 2016, the Management Company decided to waive the Management Fees on Private Bank Funds I - Discretionary Fixed IncomeGovernment Fund until liquidation.
16. Events after the Year-Enda) Sub-Fund MergerWith effect from 11 May 2017, the Calcula Fund SICAV, S.A. and the Extensis Uno SICAV, S.A. (the “Absorbed Funds”) have been merged into the Private BankFunds I - Access Balanced Fund (EUR) (the “Absorbing Fund”).
23
Private Bank Funds INotes to the Financial Statements (continued)As at 31 March 2017

Units of authorised UCITS or other collective investment undertakings
Collective Investment Schemes - UCITS
IrelandBlackRock Europe Equity 1 Fund - Class JEUR EUR 330,688 38,339,583 5.61BlackRock Japan Equity 1 Fund - Class JJPY JPY 163,220 16,813,752 2.46FundLogic MS PSAM Global Event UCITSFund - Share Class I EUR EUR 6,393 7,815,141 1.14GAM Star Global Rates Fund - ClassOrdinary EUR Accumulation EUR 1,019,072 11,943,420 1.75MAJEDIE ASSET MANAGEMENT UKEQUITY FUND (GBP) - Class Z Acc GBP 4,498,297 6,338,713 0.93Man GLG Japan CoreAlpha Equity Fund -Class I JPY Shares JPY 80,671 13,374,368 1.95Marshall Wace TOPS UCITS Fund - Class FEUR Shares EUR 120,051 16,201,226 2.37Nomura Japan Strategic Value Fund -Class I JPY JPY 49,602 7,714,669 1.13PIMCO Global Investment Grade CreditFund - Institutional EUR (Hedged)Accumulation EUR 1,999,465 36,870,135 5.39Vanguard Pacific ex-Japan Stock IndexFund - Institutional Plus “Euro” Shares EUR 100,355 13,918,190 2.03
169,329,197 24.76
LuxembourgAlken European Opportunities Fund -Class R Accumulation EUR EUR 62,054 13,678,458 2.00BBH Core Select Fund - Class R[i] USD 1,510,685 24,457,642 3.58BlackRock US Dollar High Yield BondFund - Class I2 EUR Hedged EUR 2,537,928 27,028,936 3.95DB Platinum IV Systematic Alpha Fund -Class I5C-E EUR 114,610 11,706,260 1.71Edgewood US Select Growth Fund - ClassI USD Z USD 139,734 21,890,846 3.20Henderson CONTINENTAL EUROPEANFUND - Class G¤ Acc EUR 1,069,676 12,625,386 1.85JPMorgan Aggregate Bond Fund - JPMAggregate Bond X (acc) - EUR (hedged)† EUR 540,798 44,302,176 6.48JPMorgan Europe Select Equity Fund -JPM Europe Select Equity X (acc) - EUR† EUR 72,881 14,458,109 2.11JPMorgan Global Corporate Bond Fund -JPM Global Corporate Bond X (acc) - EUR(hedged)† EUR 413,274 37,004,566 5.41JPMorgan Global High Yield Bond Fund -JPM Global High Yield Bond X (acc) - EUR(hedged)† EUR 184,160 30,690,258 4.49JPMorgan Systematic Alpha Fund - JPMSystematic Alpha X (acc) - EUR† EUR 83,674 10,270,926 1.50JPMorgan US Select Equity Plus Fund -JPM US Select Equity Plus X (acc) - USD† USD 1,309,005 27,665,675 4.05Merrill Lynch AQR Global Relative ValueUCITS Fund - EUR A (acc) EUR 60,065 7,428,872 1.09Nordea US Total Return Bond Fund -HBI-EUR Share Class EUR 158,053 13,349,182 1.95Pictet Global Emerging Debt Fund - HJEUR EUR 82,151 19,039,234 2.79Robeco BP US Large Cap Equities Fund - IUSD USD 130,176 26,548,587 3.88T. Rowe Price US Smaller CompaniesEquity Fund - Class I USD 407,328 19,347,112 2.83
361,492,225 52.87
Total Collective Investment Schemes - UCITS 530,821,422 77.63
Exchange Traded Funds
IrelandiShares Core S&P 500 UCITS Fund USD 218,220 45,525,767 6.66iShares Edge MSCI USA Value FactorUCITS Fund USD 1,923,715 10,188,979 1.49Vanguard S&P 500 UCITS Fund USD 1,702,480 70,965,701 10.38
126,680,447 18.53
Total Exchange Traded Funds 126,680,447 18.53
Total Units of authorised UCITS or other collective investmentundertakings
657,501,869 96.16
Total Investments 657,501,869 96.16
Cash 29,627,750 4.33
Other Assets/(Liabilities) (3,380,078) (0.49)
Total Net Assets 683,749,541 100.00
† Related Party Fund.
Geographic Allocation of Portfolio as at 31 March 2017 % of Net AssetsLuxembourg 52.87Ireland 43.29Total Investments 96.16Cash and Other Assets/(Liabilities) 3.84
Total 100.00
Geographic Allocation of Portfolio as at 30 September 2016(Unaudited)
% of Net Assets
Ireland 47.44Luxembourg 45.90Germany 2.54Total Investments 95.88Cash and Other Assets/(Liabilities) 4.12
Total 100.00
24
Private Bank Funds I - Access Balanced Fund (EUR)Schedule of InvestmentsAs at 31 March 2017
Investments Currency
Quantity/Nominal
Value
MarketValue
EUR
%of
NetAssets Investments Currency
Quantity/Nominal
Value
MarketValue
EUR
%of
NetAssets

Private Bank Funds I - Access Balanced Fund (EUR)
Schedule of Investments (continued)
As at 31 March 2017
Forward Currency Exchange Contracts
CurrencyPurchased
AmountPurchased Currency Sold Amount Sold
MaturityDate Counterparty
UnrealisedGain/(Loss)
EUR
%of
NetAssets
EUR 266,173,197 USD 285,000,000 01/06/2017 Societe Generale 1,852,630 0.27GBP 900,000 EUR 1,036,909 01/06/2017 HSBC 819 -USD 3,500,000 EUR 3,028,599 04/04/2017 UBS 226,351 0.03
Total Unrealised Gain on Forward Currency Exchange Contracts 2,079,800 0.30
EUR 8,625,889 GBP 7,535,000 01/06/2017 State Street (62,205) (0.01)EUR 44,168,763 JPY 5,405,000,000 01/06/2017 State Street (1,092,607) (0.16)EUR 3,028,224 USD 3,500,000 07/04/2017 UBS (226,076) (0.03)
Total Unrealised Loss on Forward Currency Exchange Contracts (1,380,888) (0.20)
Net Unrealised Gain on Forward Currency Exchange Contracts 698,912 0.10
25

Units of authorised UCITS or other collective investment undertakings
Collective Investment Schemes - UCITS
IrelandBlackRock Europe Equity 1 Fund - Class JEUR EUR 78,103 7,842,324 5.35BlackRock Japan Equity 1 Fund - Class JJPY JPY 41,173 3,673,234 2.51FundLogic MS PSAM Global Event UCITSFund - Share Class I GBP GBP 1,332 1,587,215 1.08GAM Star Global Rates Fund - ClassOrdinary GBP Income Distribution GBP 2,104,268 2,533,328 1.73Man GLG Japan CoreAlpha Equity Fund -Class I JPY Shares JPY 22,099 3,173,042 2.17Marshall Wace TOPS UCITS Fund - Class FGBP Shares GBP 25,665 3,590,458 2.45Nomura Japan Strategic Value Fund -Class I JPY JPY 12,189 1,641,864 1.12PIMCO Global Investment Grade CreditFund - Institutional GBP (Hedged) Income GBP 565,536 7,860,947 5.37Vanguard Pacific ex-Japan Stock IndexFund - Institutional Plus GBPAccumulation Shares GBP 22,144 2,894,477 1.98
34,796,889 23.76
LuxembourgAlken European Opportunities Fund -Class U Distribution EUR EUR 18,333 2,716,854 1.86BBH Core Select Fund - Class R[i] USD 258,187 3,620,134 2.47BlackRock US Dollar High Yield BondFund - Class I4RF GBP Hedged GBP 605,050 5,911,341 4.04DB Platinum IV Systematic Alpha Fund -Class I5C-G GBP 27,712 2,693,089 1.84Edgewood US Select Growth Fund - ClassI USD Z USD 27,475 3,727,692 2.55Henderson CONTINENTAL EUROPEANFUND - Class G¤ Acc EUR 264,910 2,707,946 1.85JPMorgan Aggregate Bond Fund - JPMAggregate Bond X (dist) - GBP (hedged)† GBP 135,710 8,595,895 5.87JPMorgan Europe Select Equity Fund -JPM Europe Select Equity X (dist) - EUR† EUR 32,511 3,384,429 2.31JPMorgan Global Corporate Bond Fund -JPM Global Corporate Bond X (dist) - GBP(hedged)† GBP 128,544 8,249,940 5.63JPMorgan Systematic Alpha Fund - JPMSystematic Alpha X (dist) - GBP (hedged)† GBP 18,677 1,767,012 1.21JPMorgan US Select Equity Plus Fund -JPM US Select Equity Plus X (dist) - USD† USD 27,405 3,952,982 2.70Merrill Lynch AQR Global Relative ValueUCITS Fund - GBP A (acc) GBP 12,226 1,554,500 1.06Nordea US Total Return Bond Fund -HAI-GBP Share Class GBP 47,253 2,910,778 1.99Pictet Global Emerging Debt Fund - HJ dyGBP GBP 20,722 4,686,858 3.20Robeco BP US Large Cap Equities Fund -IE GBP GBP 19,003 4,312,363 2.94T. Rowe Price US Smaller CompaniesEquity Fund - Class I USD 123,994 5,100,627 3.48
65,892,440 45.00
United KingdomJPMorgan Global High Yield Bond Fund -JPM Global High Yield Bond Fund I - GrossAccumulation† GBP 3,015,172 5,725,812 3.91MAJEDIE UK EQUITY FUND (GBP) - Class XAcc GBP 810,092 1,414,420 0.97
7,140,232 4.88
Total Collective Investment Schemes - UCITS 107,829,561 73.64
Exchange Traded Funds
IrelandiShares Core S&P 500 UCITS Fund USD 72,394 13,080,204 8.93iShares Edge MSCI USA Value FactorUCITS Fund USD 454,357 2,084,185 1.43Vanguard S&P 500 UCITS Fund USD 452,543 16,337,122 11.16
31,501,511 21.52
Total Exchange Traded Funds 31,501,511 21.52
Total Units of authorised UCITS or other collective investmentundertakings
139,331,072 95.16
Total Investments 139,331,072 95.16
Cash 7,205,178 4.92
Other Assets/(Liabilities) (112,459) (0.08)
Total Net Assets 146,423,791 100.00
† Related Party Fund.
Geographic Allocation of Portfolio as at 31 March 2017 % of Net AssetsIreland 45.28Luxembourg 45.00United Kingdom 4.88Total Investments 95.16Cash and Other Assets/(Liabilities) 4.84
Total 100.00
Geographic Allocation of Portfolio as at 30 September 2016(Unaudited)
% of Net Assets
Ireland 45.74Luxembourg 41.30United Kingdom 5.29Germany 3.42Total Investments 95.75Cash and Other Assets/(Liabilities) 4.25
Total 100.00
26
Private Bank Funds I - Access Balanced Fund (GBP)Schedule of InvestmentsAs at 31 March 2017
Investments Currency
Quantity/Nominal
Value
MarketValue
GBP
%of
NetAssets Investments Currency
Quantity/Nominal
Value
MarketValue
GBP
%of
NetAssets

Private Bank Funds I - Access Balanced Fund (GBP)
Schedule of Investments (continued)
As at 31 March 2017
Forward Currency Exchange Contracts
CurrencyPurchased
AmountPurchased Currency Sold Amount Sold
MaturityDate Counterparty
UnrealisedGain/(Loss)
GBP
%of
NetAssets
GBP 11,670,052 EUR 13,356,038 01/06/2017 Merrill Lynch 86,642 0.06GBP 54,020,874 USD 66,180,000 01/06/2017 HSBC 789,020 0.54
Total Unrealised Gain on Forward Currency Exchange Contracts 875,662 0.60
GBP 9,174,574 JPY 1,285,200,000 01/06/2017 Credit Suisse (159,290) (0.11)
Total Unrealised Loss on Forward Currency Exchange Contracts (159,290) (0.11)
Net Unrealised Gain on Forward Currency Exchange Contracts 716,372 0.49
27

Units of authorised UCITS or other collective investment undertakings
Collective Investment Schemes - UCITS
IrelandBlackRock Europe Equity 1 Fund - Class JEUR EUR 444,433 55,391,636 6.95BlackRock Japan Equity 1 Fund - Class JJPY JPY 208,068 23,041,236 2.89FundLogic MS PSAM Global Event UCITSFund - Share Class I USD USD 6,204 7,403,848 0.93GAM Star Global Rates Fund - ClassOrdinary USD Accumulation USD 1,233,296 14,913,384 1.87MAJEDIE ASSET MANAGEMENT UKEQUITY FUND (GBP) - Class Z Acc GBP 5,449,443 8,254,933 1.04Man GLG Japan CoreAlpha Equity Fund -Class I JPY Shares JPY 79,394 14,149,881 1.78Marshall Wace TOPS UCITS Fund - Class FUSD Shares USD 146,010 19,986,522 2.51Nomura Japan Strategic Value Fund -Class I JPY JPY 58,572 9,792,993 1.23PIMCO Global Investment Grade CreditFund - Institutional USD Accumulation USD 1,862,524 33,655,809 4.22Vanguard Pacific ex-Japan Stock IndexFund - Institutional Plus “U.S. Dollar”Shares USD 148,204 16,424,056 2.06
203,014,298 25.48
LuxembourgAlken European Opportunities Fund -Class R Accumulation EUR EUR 21,825 5,171,757 0.65BBH Core Select Fund - Class R[i] USD 1,261,363 21,952,762 2.75BlackRock US Dollar High Yield BondFund - Class I2 USD USD 2,502,038 32,176,214 4.04DB Platinum IV Systematic Alpha Fund -Class I5C-U USD 137,116 14,235,383 1.79Edgewood US Select Growth Fund - ClassI USD Z USD 105,621 17,787,593 2.23Henderson CONTINENTAL EUROPEANFUND - Class G¤ Acc EUR 872,242 11,067,203 1.39JPMorgan Aggregate Bond Fund - JPMAggregate Bond X (acc) - USD† USD 670,025 76,557,067 9.61JPMorgan Europe Select Equity Fund -JPM Europe Select Equity X (acc) - EUR† EUR 59,820 12,757,120 1.60JPMorgan Global Corporate Bond Fund -JPM Global Corporate Bond X (acc) -USD† USD 301,265 32,714,366 4.11JPMorgan Global High Yield Bond Fund -JPM Global High Yield Bond X (acc) -USD† USD 248,123 37,479,029 4.70JPMorgan Systematic Alpha Fund - JPMSystematic Alpha X (acc) - USD (hedged)† USD 95,556 14,235,933 1.79JPMorgan US Dollar Liquidity Fund - JPMUS Dollar Liquidity X (acc.)† USD 896 12,891,746 1.62JPMorgan US Select Equity Plus Fund -JPM US Select Equity Plus X (acc) - USD† USD 1,269,830 28,850,538 3.62Merrill Lynch AQR Global Relative ValueUCITS Fund - USD A (acc) USD 44,010 5,528,976 0.69Nordea US Total Return Bond Fund -BI-USD Share Class USD 74,285 8,176,527 1.03Pictet Global Emerging Debt Fund - J USD USD 45,636 17,970,418 2.26Robeco BP US Large Cap Equities Fund - IUSD USD 109,206 23,942,244 3.00T. Rowe Price US Smaller CompaniesEquity Fund - Class I USD 307,161 15,683,658 1.97
389,178,534 48.85
Total Collective Investment Schemes - UCITS 592,192,832 74.33
Exchange Traded Funds
IrelandiShares Core S&P 500 UCITS Fund USD 317,023 71,098,748 8.92iShares Edge MSCI USA Value FactorUCITS Fund USD 2,093,403 11,919,313 1.50Source S&P 500 UCITS Fund USD 227,118 93,160,397 11.69
176,178,458 22.11
Total Exchange Traded Funds 176,178,458 22.11
Total Units of authorised UCITS or other collective investmentundertakings
768,371,290 96.44
Total Investments 768,371,290 96.44
Cash 25,568,628 3.21
Other Assets/(Liabilities) 2,778,951 0.35
Total Net Assets 796,718,869 100.00
† Related Party Fund.
Geographic Allocation of Portfolio as at 31 March 2017 % of Net AssetsLuxembourg 48.85Ireland 47.59Total Investments 96.44Cash and Other Assets/(Liabilities) 3.56
Total 100.00
Geographic Allocation of Portfolio as at 30 September 2016(Unaudited)
% of Net Assets
Ireland 50.40Luxembourg 43.48Germany 2.91Total Investments 96.79Cash and Other Assets/(Liabilities) 3.21
Total 100.00
28
Private Bank Funds I - Access Balanced Fund (USD)Schedule of InvestmentsAs at 31 March 2017
Investments Currency
Quantity/Nominal
Value
MarketValue
USD
%of
NetAssets Investments Currency
Quantity/Nominal
Value
MarketValue
USD
%of
NetAssets

Units of authorised UCITS or other collective investment undertakings
Collective Investment Schemes - UCITS
IrelandBlackRock Europe Equity 1 Fund - Class JEUR EUR 87,621 10,158,678 1.90BlackRock Japan Equity 1 Fund - Class JJPY JPY 71,551 7,370,705 1.38FundLogic MS PSAM Global Event UCITSFund - Share Class I EUR EUR 6,289 7,687,114 1.44GAM Star Global Rates Fund - ClassOrdinary EUR Accumulation EUR 826,130 9,682,158 1.81Man GLG Japan CoreAlpha Equity Fund -Class I JPY Shares JPY 27,094 4,491,826 0.84Man Numeric Market Neutral AlternativeFund - Class INU H EUR Shares EUR 76,842 7,682,663 1.44Marshall Wace TOPS UCITS Fund - Class FEUR Shares EUR 87,175 11,764,421 2.21Muzinich Enhancedyield Short-Term Fund- Hedged Euro Accumulation A Units EUR 78,732 12,545,870 2.35Nomura Japan Strategic Value Fund -Class I JPY JPY 18,210 2,832,268 0.53PIMCO Global Investment Grade CreditFund - Institutional EUR (Hedged)Accumulation EUR 2,432,480 44,854,932 8.41Vanguard Global Bond Index Fund -Institutional Plus “Euro” Hedged Shares EUR 567,757 61,815,138 11.59Vanguard Pacific ex-Japan Stock IndexFund - Institutional Plus “Euro” Shares EUR 38,535 5,344,420 1.00
186,230,193 34.90
LuxembourgAlken European Opportunities Fund -Class R Accumulation EUR EUR 29,504 6,503,520 1.22BBH Core Select Fund - Class R[i] USD 469,410 7,599,638 1.43BlackRock US Dollar High Yield BondFund - Class I2 EUR Hedged EUR 2,017,824 21,489,826 4.03DB Platinum IV Systematic Alpha Fund -Class I5C-E EUR 110,954 11,332,892 2.13Edgewood US Select Growth Fund - ClassI USD Z USD 56,230 8,809,072 1.65Henderson UNITED KINGDOM ABSOLUTERETURN FUND - Class G¤ Acc (hedged) EUR 1,213,317 6,892,613 1.29JPMorgan Aggregate Bond Fund - JPMAggregate Bond X (acc) - EUR (hedged)† EUR 966,006 79,135,251 14.83JPMorgan Euro Liquidity Fund - JPM EuroLiquidity X (acc.)† EUR 20 279,821 0.05JPMorgan Europe Select Equity Fund -JPM Europe Select Equity X (acc) - EUR† EUR 33,843 6,713,772 1.26JPMorgan Global Corporate Bond Fund -JPM Global Corporate Bond X (acc) - EUR(hedged)† EUR 502,365 44,981,771 8.43JPMorgan Global High Yield Bond Fund -JPM Global High Yield Bond X (acc) - EUR(hedged)† EUR 188,061 31,340,324 5.87JPMorgan Systematic Alpha Fund - JPMSystematic Alpha X (acc) - EUR† EUR 66,868 8,208,002 1.54JPMorgan US Select Equity Plus Fund -JPM US Select Equity Plus X (acc) - USD† USD 468,249 9,896,389 1.86Merrill Lynch AQR Global Relative ValueUCITS Fund - EUR A (acc) EUR 45,899 5,676,824 1.06Nordea US Total Return Bond Fund -HBI-EUR Share Class EUR 268,481 22,675,921 4.25Pictet Global Emerging Debt Fund - HJEUR EUR 49,814 11,544,916 2.16Robeco BP US Large Cap Equities Fund - IUSD USD 56,833 11,590,773 2.17
294,671,325 55.23
Total Collective Investment Schemes - UCITS 480,901,518 90.13
Exchange Traded Funds
IrelandiShares Core S&P 500 UCITS Fund USD 125,991 26,284,653 4.93iShares Edge MSCI USA Value FactorUCITS Fund USD 943,131 4,995,304 0.93
31,279,957 5.86
Total Exchange Traded Funds 31,279,957 5.86
Total Units of authorised UCITS or other collective investmentundertakings
512,181,475 95.99
Total Investments 512,181,475 95.99
Cash 23,963,289 4.49
Other Assets/(Liabilities) (2,580,573) (0.48)
Total Net Assets 533,564,191 100.00
† Related Party Fund.
Geographic Allocation of Portfolio as at 31 March 2017 % of Net AssetsLuxembourg 55.23Ireland 40.76Total Investments 95.99Cash and Other Assets/(Liabilities) 4.01
Total 100.00
Geographic Allocation of Portfolio as at 30 September 2016(Unaudited)
% of Net Assets
Luxembourg 61.29Ireland 33.19Germany 1.56Total Investments 96.04Cash and Other Assets/(Liabilities) 3.96
Total 100.00
29
Private Bank Funds I - Access Capital Preservation Fund (EUR)Schedule of InvestmentsAs at 31 March 2017
Investments Currency
Quantity/Nominal
Value
MarketValue
EUR
%of
NetAssets Investments Currency
Quantity/Nominal
Value
MarketValue
EUR
%of
NetAssets

Private Bank Funds I - Access Capital Preservation Fund (EUR)
Schedule of Investments (continued)
As at 31 March 2017
Forward Currency Exchange Contracts
CurrencyPurchased
AmountPurchased Currency Sold Amount Sold
MaturityDate Counterparty
UnrealisedGain/(Loss)
EUR
%of
NetAssets
EUR 84,428,270 USD 90,400,000 01/06/2017 Societe Generale 587,641 0.11
Total Unrealised Gain on Forward Currency Exchange Contracts 587,641 0.11
EUR 14,382,428 JPY 1,760,000,000 01/06/2017 State Street (355,779) (0.06)GBP 5,368,909 EUR 6,238,174 11/04/2017 ANZ (40,564) (0.01)GBP 28,438 EUR 33,353 11/04/2017 RBC (526) -
Total Unrealised Loss on Forward Currency Exchange Contracts (396,869) (0.07)
Net Unrealised Gain on Forward Currency Exchange Contracts 190,772 0.04
30

Units of authorised UCITS or other collective investment undertakings
Collective Investment Schemes - UCITS
IrelandBlackRock Europe Equity 1 Fund - Class JEUR EUR 32,064 3,996,226 1.29BlackRock Japan Equity 1 Fund - Class JJPY JPY 48,477 5,368,273 1.73FundLogic MS PSAM Global Event UCITSFund - Share Class I USD USD 2,954 3,524,995 1.13GAM Star Global Rates Fund - ClassOrdinary USD Accumulation USD 608,156 7,354,002 2.37Man GLG Japan CoreAlpha Equity Fund -Class I JPY Shares JPY 15,055 2,683,139 0.86Man Numeric Market Neutral AlternativeFund - Class INU USD Shares USD 35,463 3,559,421 1.15Marshall Wace TOPS UCITS Fund - Class FUSD Shares USD 60,644 8,301,257 2.67Muzinich Enhancedyield Short-Term Fund- Hedged USD Accumulation A Units USD 40,795 6,827,523 2.20Muzinich ShortDurationHighYield Fund -Hedged USD Accumulation S Units USD 42,996 4,748,091 1.53Nomura Japan Strategic Value Fund -Class I JPY JPY 9,344 1,562,311 0.50PIMCO Global Investment Grade CreditFund - Institutional USD Accumulation USD 1,375,989 24,864,116 8.01Vanguard Global Bond Index Fund -Institutional Plus USD Hedged Shares USD 410,170 42,767,301 13.77Vanguard Pacific ex-Japan Stock IndexFund - Institutional Plus “U.S. Dollar”Shares USD 29,499 3,269,097 1.05
118,825,752 38.26
LuxembourgAlken European Opportunities Fund -Class R Accumulation EUR EUR 7,218 1,710,485 0.55BBH Core Select Fund - Class R[i] USD 184,028 3,202,823 1.03BlackRock US Dollar High Yield BondFund - Class I2 USD USD 1,164,253 14,972,288 4.82DB Platinum IV Systematic Alpha Fund -Class I5C-U USD 79,125 8,214,757 2.65Edgewood US Select Growth Fund - ClassI USD Z USD 27,383 4,611,552 1.49Henderson UNITED KINGDOM ABSOLUTERETURN FUND - Class G$ Acc (hedged) USD 592,698 3,419,393 1.10JPMorgan Aggregate Bond Fund - JPMAggregate Bond X (acc) - USD† USD 426,665 48,750,705 15.70JPMorgan Europe Select Equity Fund -JPM Europe Select Equity X (acc) - EUR† EUR 16,602 3,540,478 1.14JPMorgan Global Corporate Bond Fund -JPM Global Corporate Bond X (acc) -USD† USD 232,638 25,262,159 8.14JPMorgan Global High Yield Bond Fund -JPM Global High Yield Bond X (acc) -USD† USD 78,614 11,874,605 3.82JPMorgan Systematic Alpha Fund - JPMSystematic Alpha X (acc) - USD (hedged)† USD 29,106 4,336,273 1.40JPMorgan US Select Equity Plus Fund -JPM US Select Equity Plus X (acc) - USD† USD 254,467 5,781,483 1.86Merrill Lynch AQR Global Relative ValueUCITS Fund - USD A (acc) USD 20,239 2,542,626 0.82Nordea US Total Return Bond Fund -BI-USD Share Class USD 61,562 6,776,099 2.18Pictet Global Emerging Debt Fund - J USD USD 16,800 6,615,388 2.13Robeco BP US Large Cap Equities Fund - IUSD USD 23,428 5,136,360 1.65
156,747,474 50.48
Total Collective Investment Schemes - UCITS 275,573,226 88.74
Exchange Traded Funds
IrelandiShares Core S&P 500 UCITS Fund USD 85,268 19,123,055 6.16iShares Edge MSCI USA Value FactorUCITS Fund USD 570,964 3,250,926 1.05
22,373,981 7.21
Total Exchange Traded Funds 22,373,981 7.21
Total Units of authorised UCITS or other collective investmentundertakings
297,947,207 95.95
Total Investments 297,947,207 95.95
Cash 5,312,070 1.71
Other Assets/(Liabilities) 7,276,248 2.34
Total Net Assets 310,535,525 100.00
† Related Party Fund.
Geographic Allocation of Portfolio as at 31 March 2017 % of Net AssetsLuxembourg 50.48Ireland 45.47Total Investments 95.95Cash and Other Assets/(Liabilities) 4.05
Total 100.00
Geographic Allocation of Portfolio as at 30 September 2016(Unaudited)
% of Net Assets
Luxembourg 62.65Ireland 32.34Germany 1.40Total Investments 96.39Cash and Other Assets/(Liabilities) 3.61
Total 100.00
31
Private Bank Funds I - Access Capital Preservation Fund (USD)Schedule of InvestmentsAs at 31 March 2017
Investments Currency
Quantity/Nominal
Value
MarketValue
USD
%of
NetAssets Investments Currency
Quantity/Nominal
Value
MarketValue
USD
%of
NetAssets

Units of authorised UCITS or other collective investment undertakings
Collective Investment Schemes - UCITS
IrelandBlackRock Europe Equity 1 Fund - Class JEUR EUR 35,068 4,370,732 8.24BlackRock Japan Equity 1 Fund - Class JJPY JPY 19,148 2,120,480 4.00MAJEDIE ASSET MANAGEMENT UK EQUITYFUND (GBP) - Class Z Acc GBP 481,430 729,281 1.37Man GLG Japan CoreAlpha Equity Fund -Class I JPY Shares JPY 5,677 1,011,819 1.91Marshall Wace TOPS UCITS Fund - Class FUSD Shares USD 6,155 842,525 1.59Muzinich Enhancedyield Short-Term Fund- Hedged USD Accumulation A Units USD 5,286 884,640 1.67Nomura Japan Strategic Value Fund -Class I JPY JPY 5,112 854,694 1.61Vanguard Pacific ex-Japan Stock IndexFund - Institutional Plus “U.S. Dollar”Shares USD 14,774 1,637,223 3.09
12,451,394 23.48
LuxembourgAlken European Opportunities Fund -Class R Accumulation EUR EUR 3,669 869,463 1.64BBH Core Select Fund - Class R[i] USD 68,725 1,196,090 2.26BlackRock US Dollar High Yield Bond Fund- Class I2 USD USD 155,759 2,003,061 3.78DB Platinum IV Systematic Alpha Fund -Class I5C-U USD 8,291 860,772 1.62Edgewood US Select Growth Fund - Class IUSD Z USD 8,823 1,485,863 2.80Henderson CONTINENTAL EUROPEANFUND - Class G¤ Acc EUR 101,948 1,293,539 2.44Henderson UNITED KINGDOM ABSOLUTERETURN FUND - Class G$ Acc (hedged) USD 122,938 709,255 1.34JPMorgan Aggregate Bond Fund - JPMAggregate Bond X (dist) - USD† USD 31,964 3,409,558 6.43JPMorgan Europe Select Equity Fund -JPM Europe Select Equity X (dist) - EUR† EUR 11,943 1,543,188 2.91JPMorgan US Select Equity Plus Fund -JPM US Select Equity Plus X (dist) - USD† USD 11,238 2,012,082 3.80Merrill Lynch AQR Global Relative ValueUCITS Fund - USD A (acc) USD 4,515 567,219 1.07Pictet Global Emerging Debt Fund - J USD USD 2,817 1,109,230 2.09Robeco BP US Large Cap Equities Fund - IUSD USD 7,890 1,729,911 3.26
18,789,231 35.44
Total Collective Investment Schemes - UCITS 31,240,625 58.92
Exchange Traded Funds
IrelandiShares Core S&P 500 UCITS Fund USD 37,457 8,400,482 15.84iShares Edge MSCI USA Value FactorUCITS Fund USD 189,808 1,080,719 2.04iShares MSCI USA Small Cap UCITS Fund USD 3,070 856,146 1.62Source S&P 500 UCITS Fund USD 20,707 8,493,701 16.02
18,831,048 35.52
Total Exchange Traded Funds 18,831,048 35.52
Total Units of authorised UCITS or other collective investmentundertakings
50,071,673 94.44
Total Investments 50,071,673 94.44
Cash 2,786,699 5.26
Other Assets/(Liabilities) 159,442 0.30
Total Net Assets 53,017,814 100.00
† Related Party Fund.
Geographic Allocation of Portfolio as at 31 March 2017 % of Net AssetsIreland 59.00Luxembourg 35.44Total Investments 94.44Cash and Other Assets/(Liabilities) 5.56
Total 100.00
Geographic Allocation of Portfolio as at 30 September 2016(Unaudited)
% of Net Assets
Ireland 56.20Luxembourg 35.22Germany 4.26Total Investments 95.68Cash and Other Assets/(Liabilities) 4.32
Total 100.00
32
Private Bank Funds I - Access Growth Fund (USD)Schedule of InvestmentsAs at 31 March 2017
Investments Currency
Quantity/Nominal
Value
MarketValue
USD
%of
NetAssets Investments Currency
Quantity/Nominal
Value
MarketValue
USD
%of
NetAssets

Units of authorised UCITS or other collective investment undertakings
Collective Investment Schemes - UCITS
IrelandBlackRock Institutional Euro Ultra ShortBond Fund - Class Premier AccumulatingEUR EUR 267,728 26,747,661 3.02First State Global Listed InfrastructureFund - Class VI (Accumulation) EUR(Share Class) EUR 1,446,532 18,052,724 2.04GAM Star Global Rates Fund - ClassOrdinary EUR Accumulation EUR 2,372,523 27,805,737 3.13GAM Star Keynes Quantitative StrategiesFund - Class W EUR Accumulation EUR 1,902,845 17,429,867 1.96Magna New Frontiers Fund - G ClassShares EUR 1,333,601 18,184,983 2.05Man GLG Global Emerging Markets DebtTotal Return Fund - Class IMF H EURShares EUR 170,088 17,675,514 1.99Man GLG Japan CoreAlpha Equity Fund -Class I JPY Shares JPY 159,376 26,422,791 2.98Man Numeric Market Neutral AlternativeFund - Class INU H EUR Shares EUR 178,020 17,798,472 2.01Muzinich Enhancedyield Short-Term Fund- Hedged Euro Accumulation A Units EUR 279,505 44,539,067 5.02Muzinich ShortDurationHighYield Fund -Hedged Euro Accumulation S Units EUR 496,488 53,799,422 6.06PIMCO Capital Securities Fund -Institutional EUR (Hedged) Accumulation EUR 2,744,363 35,484,619 4.00PineBridge India Equity Fund - Unit ClassR1 EUR 1,814,462 26,980,324 3.04Polar Capital Global Insurance Fund -Class I US Dollar Accumulation Shares USD 5,265,173 35,772,811 4.03Vulcan Value Equity Fund - USD IIAccumulating Class Shares USD 138,658 18,012,771 2.03Wellington Strategic European EquityFund - EUR Class S AccumulatingUnhedged EUR 1,210,856 27,643,845 3.12
412,350,608 46.48
LuxembourgAQR Managed Futures UCITS Fund - ClassE EUR EUR 187,813 17,787,800 2.01Ashmore Emerging Markets ShortDuration Fund - Z2 EUR Cap EUR 283,921 35,862,068 4.04BlackRock Asian Dragon Fund - ClassI4RF USD USD 2,804,135 27,389,226 3.09BNP PARIBAS US MORTGAGE Fund - Class“IH EUR Capitalisation” EUR 269,782 27,037,545 3.05BOUSSARD & GAVAUDAN ABSOLUTERETURN Fund - Z-CLASS EUR EUR 16,028 17,660,966 1.99Edgewood US Select Growth Fund - ClassA USD R USD 312,566 35,856,379 4.04Henderson UNITED KINGDOM ABSOLUTERETURN FUND - Class G¤ Acc (hedged) EUR 4,739,166 26,922,253 3.03Melchior European Enhanced AbsoluteReturn Fund - J1 ¤ EUR 285,913 23,299,541 2.63Nordea US Total Return Bond Fund -HBI-EUR Share Class EUR 530,660 44,819,519 5.05RWC Global Convertibles Fund - Class BEUR EUR 1 1,538 0.00
256,636,835 28.93
Total Collective Investment Schemes - UCITS 668,987,443 75.41
Exchange Traded Funds
IrelandiShares USD TIPS UCITS Fund USD 334,185 62,784,813 7.08
62,784,813 7.08
JerseyETFS Physical Gold Fund EUR 404,222 45,289,033 5.10
45,289,033 5.10
Luxembourgdb x-trackers EURO STOXX 50 UCITS Fund EUR 392,371 18,400,238 2.07
18,400,238 2.07
Total Exchange Traded Funds 126,474,084 14.25
Total Units of authorised UCITS or other collective investmentundertakings
795,461,527 89.66
Total Investments 795,461,527 89.66
Cash 63,393,718 7.15
Other Assets/(Liabilities) 28,325,904 3.19
Total Net Assets 887,181,149 100.00
Geographic Allocation of Portfolio as at 31 March 2017 % of Net AssetsIreland 53.56Luxembourg 31.00Jersey 5.10Total Investments 89.66Cash and Other Assets/(Liabilities) 10.34
Total 100.00
Geographic Allocation of Portfolio as at 30 September 2016(Unaudited)
% of Net Assets
Ireland 50.84Luxembourg 44.68Total Investments 95.52Cash and Other Assets/(Liabilities) 4.48
Total 100.00
33
Private Bank Funds I - Dynamic Multi-Asset Fund (EUR)Schedule of InvestmentsAs at 31 March 2017
Investments Currency
Quantity/Nominal
Value
MarketValue
EUR
%of
NetAssets Investments Currency
Quantity/Nominal
Value
MarketValue
EUR
%of
NetAssets

Private Bank Funds I - Dynamic Multi-Asset Fund (EUR)
Schedule of Investments (continued)
As at 31 March 2017
Forward Currency Exchange Contracts
CurrencyPurchased
AmountPurchased Currency Sold Amount Sold
MaturityDate Counterparty
UnrealisedGain/(Loss)
EUR
%of
NetAssets
EUR 8,820,536 USD 9,502,090 25/05/2017 National Australia Bank 4,895 -EUR 26,478,708 USD 27,929,079 25/05/2017 RBC 567,278 0.06EUR 119,470,406 USD 126,434,026 25/05/2017 Standard Chartered 2,170,213 0.25
Total Unrealised Gain on Forward Currency Exchange Contracts 2,742,386 0.31
EUR 28,281,145 JPY 3,390,029,744 25/05/2017 BNP Paribas (108,174) (0.01)
Total Unrealised Loss on Forward Currency Exchange Contracts (108,174) (0.01)
Net Unrealised Gain on Forward Currency Exchange Contracts 2,634,212 0.30
Financial Futures Contracts
Security DescriptionNumber ofContracts Currency
GlobalExposure
EUR
UnrealisedGain/(Loss)
EUR
%of
NetAssets
S&P 500 Emini Index, 16/06/2017 (79) USD (8,660,605) (20,577) -
Total Unrealised Loss on Financial Futures Contracts (20,577) -
Net Unrealised Loss on Financial Futures Contracts (20,577) -
34
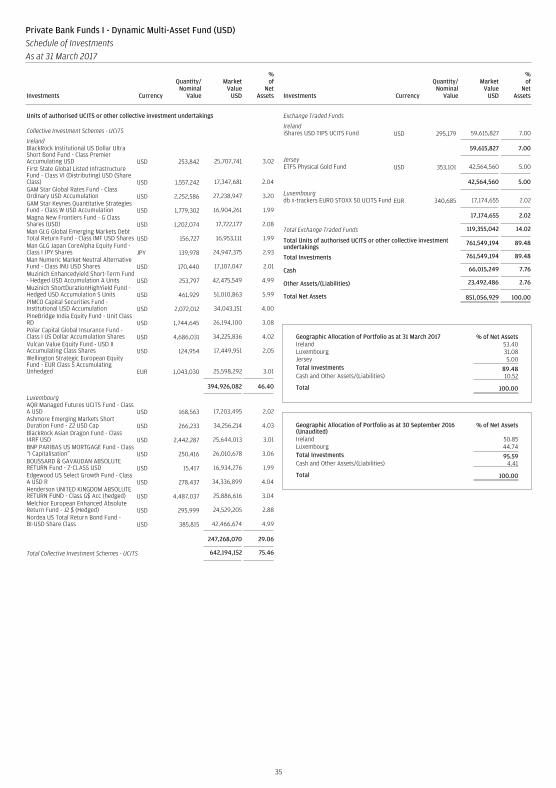
Units of authorised UCITS or other collective investment undertakings
Collective Investment Schemes - UCITS
IrelandBlackRock Institutional US Dollar UltraShort Bond Fund - Class PremierAccumulating USD USD 253,842 25,707,741 3.02First State Global Listed InfrastructureFund - Class VI (Distributing) USD (ShareClass) USD 1,557,242 17,347,681 2.04GAM Star Global Rates Fund - ClassOrdinary USD Accumulation USD 2,252,586 27,238,947 3.20GAM Star Keynes Quantitative StrategiesFund - Class W USD Accumulation USD 1,779,302 16,904,261 1.99Magna New Frontiers Fund - G ClassShares (USD) USD 1,202,074 17,722,177 2.08Man GLG Global Emerging Markets DebtTotal Return Fund - Class IMF USD Shares USD 156,727 16,953,111 1.99Man GLG Japan CoreAlpha Equity Fund -Class I JPY Shares JPY 139,978 24,947,375 2.93Man Numeric Market Neutral AlternativeFund - Class INU USD Shares USD 170,440 17,107,047 2.01Muzinich Enhancedyield Short-Term Fund- Hedged USD Accumulation A Units USD 253,797 42,475,549 4.99Muzinich ShortDurationHighYield Fund -Hedged USD Accumulation S Units USD 461,929 51,010,863 5.99PIMCO Capital Securities Fund -Institutional USD Accumulation USD 2,072,012 34,043,151 4.00PineBridge India Equity Fund - Unit ClassRD USD 1,744,645 26,194,100 3.08Polar Capital Global Insurance Fund -Class I US Dollar Accumulation Shares USD 4,686,031 34,225,836 4.02Vulcan Value Equity Fund - USD IIAccumulating Class Shares USD 124,954 17,449,951 2.05Wellington Strategic European EquityFund - EUR Class S AccumulatingUnhedged EUR 1,043,030 25,598,292 3.01
394,926,082 46.40
LuxembourgAQR Managed Futures UCITS Fund - ClassA USD USD 168,563 17,203,495 2.02Ashmore Emerging Markets ShortDuration Fund - Z2 USD Cap USD 266,233 34,256,214 4.03BlackRock Asian Dragon Fund - ClassI4RF USD USD 2,442,287 25,644,013 3.01BNP PARIBAS US MORTGAGE Fund - Class“I Capitalisation” USD 250,416 26,010,678 3.06BOUSSARD & GAVAUDAN ABSOLUTERETURN Fund - Z-CLASS USD USD 15,417 16,934,276 1.99Edgewood US Select Growth Fund - ClassA USD R USD 278,437 34,336,899 4.04Henderson UNITED KINGDOM ABSOLUTERETURN FUND - Class G$ Acc (hedged) USD 4,487,037 25,886,616 3.04Melchior European Enhanced AbsoluteReturn Fund - J2 $ (Hedged) USD 295,999 24,529,205 2.88Nordea US Total Return Bond Fund -BI-USD Share Class USD 385,815 42,466,674 4.99
247,268,070 29.06
Total Collective Investment Schemes - UCITS 642,194,152 75.46
Exchange Traded Funds
IrelandiShares USD TIPS UCITS Fund USD 295,179 59,615,827 7.00
59,615,827 7.00
JerseyETFS Physical Gold Fund USD 353,101 42,564,560 5.00
42,564,560 5.00
Luxembourgdb x-trackers EURO STOXX 50 UCITS Fund EUR 340,685 17,174,655 2.02
17,174,655 2.02
Total Exchange Traded Funds 119,355,042 14.02
Total Units of authorised UCITS or other collective investmentundertakings
761,549,194 89.48
Total Investments 761,549,194 89.48
Cash 66,015,249 7.76
Other Assets/(Liabilities) 23,492,486 2.76
Total Net Assets 851,056,929 100.00
Geographic Allocation of Portfolio as at 31 March 2017 % of Net AssetsIreland 53.40Luxembourg 31.08Jersey 5.00Total Investments 89.48Cash and Other Assets/(Liabilities) 10.52
Total 100.00
Geographic Allocation of Portfolio as at 30 September 2016(Unaudited)
% of Net Assets
Ireland 50.85Luxembourg 44.74Total Investments 95.59Cash and Other Assets/(Liabilities) 4.41
Total 100.00
35
Private Bank Funds I - Dynamic Multi-Asset Fund (USD)Schedule of InvestmentsAs at 31 March 2017
Investments Currency
Quantity/Nominal
Value
MarketValue
USD
%of
NetAssets Investments Currency
Quantity/Nominal
Value
MarketValue
USD
%of
NetAssets

Private Bank Funds I - Dynamic Multi-Asset Fund (USD)
Schedule of Investments (continued)
As at 31 March 2017
Forward Currency Exchange Contracts
CurrencyPurchased
AmountPurchased Currency Sold Amount Sold
MaturityDate Counterparty
UnrealisedGain/(Loss)
USD
%of
NetAssets
AUD 500,000 USD 379,911 11/04/2017 Barclays 2,996 -AUD 5,790 USD 4,415 11/04/2017 RBC 19 -GBP 1,125 USD 1,396 04/04/2017 Societe Generale 1 -GBP 454,000 USD 551,964 11/04/2017 Barclays 11,773 -GBP 2,497,936 USD 3,083,292 11/04/2017 HSBC 18,426 -GBP 6,323,846 USD 7,742,499 11/04/2017 Societe Generale 109,897 0.02SGD 2,533,021 USD 1,791,255 11/04/2017 ANZ 24,348 -SGD 14,161 USD 10,117 11/04/2017 Citibank 34 -
Total Unrealised Gain on Forward Currency Exchange Contracts 167,494 0.02
AUD 260,129 USD 199,524 11/04/2017 State Street (313) -USD 1,075 AUD 1,415 11/04/2017 RBC (9) -USD 1,105 AUD 1,464 11/04/2017 State Street (15) -USD 63,203,031 EUR 59,720,659 25/05/2017 RBC (1,167,926) (0.14)USD 620,272 GBP 500,000 03/04/2017 HSBC (428) -USD 1,397 GBP 1,125 11/04/2017 Societe Generale (1) -USD 27,875,113 JPY 3,157,054,444 25/05/2017 HSBC (621,872) (0.07)
Total Unrealised Loss on Forward Currency Exchange Contracts (1,790,564) (0.21)
Net Unrealised Loss on Forward Currency Exchange Contracts (1,623,070) (0.19)
Financial Futures Contracts
Security DescriptionNumber ofContracts Currency
GlobalExposure
USD
UnrealisedGain/(Loss)
USD
%of
NetAssets
S&P 500 Emini Index, 16/06/2017 (71) USD (8,367,350) (19,880) -
Total Unrealised Loss on Financial Futures Contracts (19,880) -
Net Unrealised Loss on Financial Futures Contracts (19,880) -
36

Units of authorised UCITS or other collective investment undertakings
Collective Investment Schemes - UCITS
IrelandBlackRock Institutional US Dollar UltraShort Bond Fund - Class PremierAccumulating USD USD 60,126 6,089,237 2.99First State Global Listed InfrastructureFund - Class VI (Distributing) USD (ShareClass) USD 368,291 4,102,761 2.02GAM Star Global Rates Fund - ClassOrdinary USD Accumulation USD 526,142 6,362,270 3.13GAM Star Keynes Quantitative StrategiesFund - Class W USD Accumulation USD 422,763 4,016,460 1.97Magna New Frontiers Fund - G ClassShares (USD) USD 284,903 4,200,325 2.06Man GLG Global Emerging Markets DebtTotal Return Fund - Class IMF USD Shares USD 37,467 4,052,783 1.99Man GLG Japan CoreAlpha Equity Fund -Class I JPY Shares JPY 34,073 6,072,521 2.98Man Numeric Market Neutral AlternativeFund - Class INU USD Shares USD 40,023 4,017,104 1.97Muzinich Enhancedyield Short-Term Fund- Hedged USD Accumulation A Units USD 60,255 10,084,277 4.96Muzinich ShortDurationHighYield Fund -Hedged USD Accumulation S Units USD 110,051 12,152,897 5.97PIMCO Capital Securities Fund -Institutional USD Accumulation USD 495,331 8,138,281 4.00PineBridge India Equity Fund - Unit ClassRD USD 412,597 6,194,727 3.04Polar Capital Global Insurance Fund -Class I US Dollar Accumulation Shares USD 1,116,376 8,153,789 4.01Vulcan Value Equity Fund - USD IIAccumulating Class Shares USD 29,516 4,121,939 2.03Wellington Strategic European EquityFund - EUR Class S AccumulatingUnhedged EUR 249,339 6,119,351 3.01
93,878,722 46.13
LuxembourgAQR Managed Futures UCITS Fund - ClassA USD USD 39,370 4,018,102 1.97Ashmore Emerging Markets ShortDuration Fund - Z2 USD Cap USD 62,817 8,082,675 3.97BlackRock Asian Dragon Fund - ClassI4RF USD USD 583,835 6,130,269 3.01BNP PARIBAS US MORTGAGE Fund - Class“I Capitalisation” USD 58,869 6,114,673 3.01BOUSSARD & GAVAUDAN ABSOLUTERETURN Fund - Z-CLASS USD USD 3,685 4,048,272 1.99Edgewood US Select Growth Fund - ClassA USD R USD 66,580 8,210,648 4.04Henderson UNITED KINGDOM ABSOLUTERETURN FUND - Class G$ Acc (hedged) USD 1,047,689 6,044,325 2.97Melchior European Enhanced AbsoluteReturn Fund - J2 $ (Hedged) USD 70,510 5,843,104 2.87Nordea US Total Return Bond Fund -BI-USD Share Class USD 92,521 10,183,745 5.00
58,675,813 28.83
Total Collective Investment Schemes - UCITS 152,554,535 74.96
Exchange Traded Funds
IrelandiShares USD TIPS UCITS Fund USD 71,061 14,351,835 7.05
14,351,835 7.05
JerseyETFS Physical Gold Fund USD 84,410 10,175,203 5.00
10,175,203 5.00
Luxembourgdb x-trackers EURO STOXX 50 UCITS Fund EUR 85,144 4,292,290 2.11
4,292,290 2.11
Total Exchange Traded Funds 28,819,328 14.16
Total Units of authorised UCITS or other collective investmentundertakings
181,373,863 89.12
Total Investments 181,373,863 89.12
Cash 16,533,434 8.12
Other Assets/(Liabilities) 5,607,294 2.76
Total Net Assets 203,514,591 100.00
Geographic Allocation of Portfolio as at 31 March 2017 % of Net AssetsIreland 53.18Luxembourg 30.94Jersey 5.00Total Investments 89.12Cash and Other Assets/(Liabilities) 10.88
Total 100.00
Geographic Allocation of Portfolio as at 30 September 2016(Unaudited)
% of Net Assets
Ireland 51.19Luxembourg 45.37Total Investments 96.56Cash and Other Assets/(Liabilities) 3.44
Total 100.00
37
Private Bank Funds I - Montes Excelsis FundSchedule of InvestmentsAs at 31 March 2017
Investments Currency
Quantity/Nominal
Value
MarketValue
USD
%of
NetAssets Investments Currency
Quantity/Nominal
Value
MarketValue
USD
%of
NetAssets
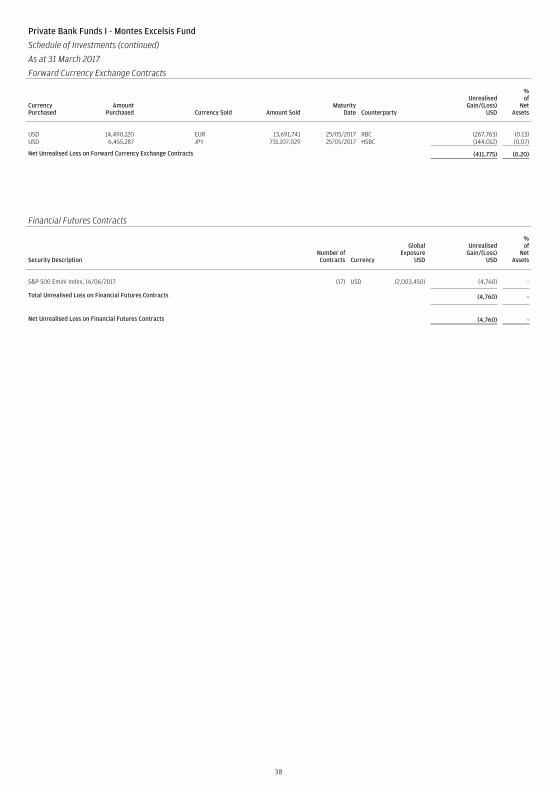
Private Bank Funds I - Montes Excelsis Fund
Schedule of Investments (continued)
As at 31 March 2017
Forward Currency Exchange Contracts
CurrencyPurchased
AmountPurchased Currency Sold Amount Sold
MaturityDate Counterparty
UnrealisedGain/(Loss)
USD
%of
NetAssets
USD 14,490,120 EUR 13,691,741 25/05/2017 RBC (267,763) (0.13)USD 6,455,287 JPY 731,107,029 25/05/2017 HSBC (144,012) (0.07)
Net Unrealised Loss on Forward Currency Exchange Contracts (411,775) (0.20)
Financial Futures Contracts
Security DescriptionNumber ofContracts Currency
GlobalExposure
USD
UnrealisedGain/(Loss)
USD
%of
NetAssets
S&P 500 Emini Index, 16/06/2017 (17) USD (2,003,450) (4,760) -
Total Unrealised Loss on Financial Futures Contracts (4,760) -
Net Unrealised Loss on Financial Futures Contracts (4,760) -
38

For theyear
ended31 March
2017+
For theyear
ended31 March2017 (a)
For theyear
ended31 March
2016+
For theyear
ended31 March
2015+
CappedExpense
Ratio31 March
2017+
InceptionDate
Private Bank Funds I - Access Balanced Fund (EUR)†Access Balanced Fund (EUR) A (acc) 1.70% 1.70% 1.70% 1.70% - 17-Nov-09Access Balanced Fund (EUR) A (inc) 1.70% 1.70% 1.70% - - 16-Sep-15Access Balanced Fund (EUR) B (acc) 1.40% 1.40% 1.40% 1.40% - 02-Feb-10Access Balanced Fund (EUR) C (acc) 0.98% 0.98% 0.97% 0.98% 1.05% 08-Dec-09Access Balanced Fund (EUR) D (acc) 1.20% 1.20% 1.20% 1.20% - 14-Aug-13Access Balanced Fund (EUR) Inst (acc) 0.87% 0.87% 0.87% 0.88% 0.95% 16-Jan-13
Private Bank Funds I - Access Balanced Fund (GBP)†Access Balanced Fund (GBP) A (acc) 1.70% 1.70% 1.70% 1.70% - 25-May-11Access Balanced Fund (GBP) A (inc) 1.70% 1.70% 1.70% 1.70% - 25-May-11Access Balanced Fund (GBP) B (acc)* 1.40% 1.40% 1.40% 1.40% - 14-Dec-11Access Balanced Fund (GBP) B (inc) 1.40% 1.40% 1.40% 1.40% - 29-Jun-11Access Balanced Fund (GBP) C (acc) 1.04% 1.04% 1.01% 0.70% 1.05% 19-Jun-13Access Balanced Fund (GBP) C (inc) 1.05% 1.05% 1.04% 0.69% 1.05% 08-Feb-12Access Balanced Fund (GBP) D (acc) 1.20% 1.20% 1.20% 1.20% - 10-Jul-13Access Balanced Fund (GBP) D (inc) 1.20% 1.20% 1.20% 1.20% - 06-Feb-13Access Balanced Fund (GBP) Inst (acc) 0.92% 0.92% 0.89% 0.61% 0.95% 01-Jun-11Access Balanced Fund (GBP) Inst (inc) 0.90% 0.90% 0.88% 0.62% 0.95% 13-Nov-13
Private Bank Funds I - Access Balanced Fund (USD)†Access Balanced Fund (USD) A (acc) 1.70% 1.70% 1.70% 1.70% - 20-Oct-10Access Balanced Fund (USD) B (acc) 1.40% 1.40% 1.40% 1.40% - 20-Oct-10Access Balanced Fund (USD) C (acc) 0.99% 0.99% 0.97% 0.98% 1.05% 20-Oct-10Access Balanced Fund (USD) D (acc) 1.20% 1.20% 1.20% 1.20% - 06-Feb-13Access Balanced Fund (USD) Inst (acc) 0.88% 0.88% 0.87% 0.87% 0.95% 26-Sep-12
Private Bank Funds I - Access Capital Preservation Fund (EUR)† (1)Access Capital Preservation Fund (EUR) A (acc) 1.15% 1.15% 1.15% 1.15% - 08-Dec-10Access Capital Preservation Fund (EUR) B (acc) 1.00% 1.00% 1.00% 1.00% - 08-Dec-10Access Capital Preservation Fund (EUR) C (acc) 0.73% 0.73% 0.71% 0.73% 0.80% 08-Dec-10Access Capital Preservation Fund (EUR) C (inc) 0.78% 0.78% 0.75% 0.75% 0.80% 04-Dec-13Access Capital Preservation Fund (EUR) D (acc) 0.65% 0.65% 0.65% 0.65% - 06-Feb-13Access Capital Preservation Fund (EUR) Inst (acc) 0.68% 0.68% 0.67% 0.67% 0.75% 13-Nov-13Access Capital Preservation Fund (EUR) Inst (inc) 0.71% 0.71% 0.66% 0.73% 0.75% 29-Oct-14Access Capital Preservation Fund (EUR) Inst (inc) - GBP (hedged) 0.75% 0.75% - - 0.75% 09-Nov-16
Private Bank Funds I - Access Capital Preservation Fund (USD)† (2)Access Capital Preservation Fund (USD) A (acc) 1.15% 1.15% 1.15% 1.15% - 23-May-12Access Capital Preservation Fund (USD) B (acc) 1.00% 1.00% 1.00% 1.00% - 22-Jan-14Access Capital Preservation Fund (USD) C (acc) 0.73% 0.73% 0.72% 0.74% 0.80% 23-May-12Access Capital Preservation Fund (USD) Inst (acc) 0.75% 0.75% 0.54% 0.75% 0.75% 13-Nov-13Access Capital Preservation Fund (USD) Inst (inc)* - - 0.70% 0.75% 0.75% 10-Dec-14
Private Bank Funds I - Access Conservative Fund (GBP)† (3)Access Conservative Fund (GBP) B (inc) 1.00% 1.00% 1.00% 1.00% - 28-Jan-15Access Conservative Fund (GBP) C (inc) 0.80% 0.80% 0.72% - 0.80% 30-Sep-15Access Conservative Fund (GBP) D (acc) 0.65% 0.65% 0.65% - - 10-Jun-15Access Conservative Fund (GBP) Inst (inc) 0.75% 0.75% 0.75% 0.75% 0.75% 05-Nov-14
Private Bank Funds I - Access Growth Fund (GBP)† (3)Access Growth Fund (GBP) Inst (inc) 0.95% 0.95% 0.95% 0.95% 0.95% 05-Nov-14
Private Bank Funds I - Access Growth Fund (USD)†Access Growth Fund (USD) A (acc) 1.70% 1.70% 1.70% 1.70% - 16-Oct-13Access Growth Fund (USD) C (acc) 1.05% 1.05% 1.05% - 1.05% 30-Oct-13Access Growth Fund (USD) D (inc) 1.20% 1.20% 1.20% 1.20% - 16-Oct-13Access Growth Fund (USD) Inst (acc) 0.95% 0.95% 0.95% 0.95% 0.95% 13-Nov-13Access Growth Fund (USD) Inst (inc) 0.95% 0.95% 0.95% 0.93% 0.95% 13-Nov-13
Private Bank Funds I - Blue and Green Fund (4)Blue and Green Fund A (acc) - EUR 0.85% 0.85% 0.85% - - 09-Nov-15
Private Bank Funds I - Discretionary Fixed Income Government Fund (5)Discretionary Fixed Income Government Fund A (acc) 0.90% 0.89% 0.90% 0.90% - 11-Dec-06Discretionary Fixed Income Government Fund A (acc) - USD (hedged) 0.90% 0.88% 0.90% 0.90% - 30-Jan-15Discretionary Fixed Income Government Fund A (inc) - - 0.90% 0.90% - 15-Jul-09Discretionary Fixed Income Government Fund B (acc) 0.65% 0.63% 0.65% 0.65% - 12-Nov-07Discretionary Fixed Income Government Fund C (acc) 0.35% 0.34% 0.34% 0.34% 0.35% 06-Nov-07Discretionary Fixed Income Government Fund C (acc) - USD (hedged) 0.35% 0.34% 0.34% 0.35% 0.35% 30-Jan-15Discretionary Fixed Income Government Fund C (inc) 0.31% 0.30% 0.35% 0.33% 0.35% 09-Oct-13Discretionary Fixed Income Government Fund C (inc) - GBP (hedged) - - 0.35% 0.34% 0.35% 30-Jan-15Discretionary Fixed Income Government Fund C (inc) - USD (hedged) - - 0.35% 0.35% 0.35% 30-Jan-15
(1) This Sub-Fund was renamed from Private Bank Funds I - Access Conservative Fund (EUR) to Private Bank Funds I - Access Capital Preservation Fund (EUR) on 1 July 2016.(2) This Sub-Fund was renamed from Private Bank Funds I - Access Conservative Fund (USD) to Private Bank Funds I - Access Capital Preservation Fund (USD) on 1 July 2016.(3) This Sub-Fund was liquidated on 16 November 2016.(4) This Sub-Fund was liquidated on 25 October 2016.(5) This Sub-Fund was liquidated on 29 April 2016.
39
Private Bank Funds IAppendix - Unaudited Additional Disclosures
1. Total Expense Ratios

For theyear
ended31 March
2017+
For theyear
ended31 March2017 (a)
For theyear
ended31 March
2016+
For theyear
ended31 March
2015+
CappedExpense
Ratio31 March
2017+
InceptionDate
Private Bank Funds I - Dynamic Multi-Asset Fund (EUR)†Dynamic Multi-Asset Fund (EUR) C (acc) 0.74% 0.74% 0.80% - 0.80% 14-Oct-15Dynamic Multi-Asset Fund (EUR) C (inc) 0.78% 0.78% 0.80% - 0.80% 13-Jan-16Dynamic Multi-Asset Fund (EUR) Inst (acc) 0.75% 0.75% - - 0.75% 22-Jun-16Dynamic Multi-Asset Fund (EUR) Inst (inc) 0.72% 0.72% - - 0.75% 22-Jun-16
Private Bank Funds I - Dynamic Multi-Asset Fund (USD)†Dynamic Multi-Asset Fund (USD) C (acc) 0.75% 0.75% 0.80% - 0.80% 14-Oct-15Dynamic Multi-Asset Fund (USD) C (acc) - AUD (hedged) 0.80% 0.80% - - 0.80% 01-Mar-17Dynamic Multi-Asset Fund (USD) C (acc) - SGD (hedged) 0.80% 0.80% - - 0.80% 27-Jul-16Dynamic Multi-Asset Fund (USD) C (inc) 0.78% 0.78% 0.80% - 0.80% 14-Oct-15Dynamic Multi-Asset Fund (USD) C (inc) - GBP (hedged) 0.80% 0.80% - - 0.80% 27-Jul-16Dynamic Multi-Asset Fund (USD) Inst (acc) 0.75% 0.75% - - 0.75% 22-Jun-16Dynamic Multi-Asset Fund (USD) Inst (inc) 0.72% 0.72% - - 0.75% 22-Jun-16
Private Bank Funds I - Islamic Global Dynamic Equity Fund (6)Islamic Global Dynamic Equity Fund (USD) A (acc) 1.90% 1.90% 1.90% 1.90% - 05-Feb-07Islamic Global Dynamic Equity Fund (USD) B (acc) 1.50% 1.50% 1.50% 1.50% - 05-Feb-07Islamic Global Dynamic Equity Fund (USD) C (acc) 1.00% 1.00% 1.00% 1.00% 1.00% 16-Mar-07Islamic Global Dynamic Equity Fund (USD) Inst (acc) 0.80% 0.80% 0.80% 0.80% 0.80% 26-Feb-07
Private Bank Funds I - Montes Excelsis Fund†Montes Excelsis Fund C (acc) - USD 0.61% 0.51% 0.59% 0.60% 0.65% 06-Apr-11
(6) This Sub-Fund was liquidated on 13 February 2017.
+ Expense ratios are calculated in accordance with the guidelines dated 16 May 2008 issued by the Swiss Funds & Asset Management Association. The Total Expense Ratio (“TER”) represents the totaloperating costs as a percentage of the Fund’s average daily net assets. The total operating cost comprises investment management and advisory fees, custodian/depositary fees, taxe d’abonnementand other expenses, as summarised in the Combined Statement of Operations and Changes in Net Assets. Overdraft interest and Performance Fees are excluded from the calculation.The capped expense ratios and total expense ratios for some share classes may have changed over the previous two years. All details concerning these changes have been disclosed in previous years’Financial Statements.
† As the Sub-Fund invests a significant portion of its NAV in target funds which do not publish a TER, a TER is not calculated and published in accordance with the applicable SFAMA (Swiss Funds & AssetManagement Association) guidelines.
(a) These figures include Fee Waivers on Management and Advisory Fees or Operating and Administrative expenses, where applicable.
* Share Class inactive as at the end of the year.
40
Private Bank Funds IAppendix - Unaudited Additional Disclosures (continued)
1. Total Expense Ratios (continued)

Private Bank Funds I - Access Balanced Fund (EUR)
Seeks to achieve a total level of return in EUR in excess of global equity and debt markets by investing primarily in a diversified portfolio of UCITS and otherUCIs and using financial derivative instruments where appropriate.
Private Bank Funds I - Access Balanced Fund (GBP)
Seeks to achieve a total level of return in GBP in excess of global equity and debt markets by investing primarily in a diversified portfolio of UCITS and otherUCIs and using financial derivative instruments where appropriate.
Private Bank Funds I - Access Balanced Fund (USD)
Seeks to achieve a total level of return in USD in excess of global equity and debt markets by investing primarily in a diversified portfolio of UCITS and otherUCIs and using financial derivative instruments where appropriate.
Private Bank Funds I - Access Capital Preservation Fund (EUR)
Seeks to achieve a total level of return in EUR in excess of global debt and equity markets by investing primarily in a diversified portfolio of UCITS and otherUCIs and using financial derivative instruments where appropriate while seeking to preserve capital over the long term.
Private Bank Funds I - Access Capital Preservation Fund (USD)
Seeks to achieve a total level of return in USD in excess of global debt and equity markets by investing primarily in a diversified portfolio of UCITS and otherUCIs and using financial derivative instruments where appropriate while seeking to preserve capital over the long term.
Private Bank Funds I - Access Growth Fund (USD)
Seeks to achieve long term capital growth by investing primarily in a diversified portfolio of UCITS and other UCIs and using financial derivative instrumentswhere appropriate.
Private Bank Funds I - Dynamic Multi-Asset Fund (EUR)
Seeks to achieve a return in EUR, through a combination of income and capital appreciation, in excess of its cash benchmark over a full market cycle.This willbe achieved by investing in a diversified multi-asset portfolio of UCITS, UCIs, structured products and financial derivative instruments where appropriate.
Private Bank Funds I - Dynamic Multi-Asset Fund (USD)
Seeks to achieve a return in USD, through a combination of income and capital appreciation, in excess of its cash benchmark over a full market cycle.This willbe achieved by investing in a diversified multi-asset portfolio of UCITS, UCIs, structured products and financial derivative instruments where appropriate.
Private Bank Funds I - Montes Excelsis Fund
Seeks to achieve a return in USD, through a combination of income and capital appreciation, in excess of its cash benchmark over a full market cycle. This willbe achieved by investing in a diversified multi-asset portfolio of UCITS, UCIs, structured products and financial derivative instruments where appropriate.
41
Private Bank Funds IAppendix - Unaudited Additional Disclosures (continued)
2. Summary of Investment Objectives of the Sub-Funds

PerformanceReturns for periods greater than one year are annualised. SICAV performance includes reinvestment of income and is net of all expenses. Past performanceis no indication of current or future performance.The performance data does not take into account the commissions and costs incurred on the issue and redemption of units.VolatilityThe standard deviation (D) of the price is calculated on a daily basis throughout each SICAV’s financial year.The details below relate to the year ended 31 March 2017.
If D is equal to or less than 0.1 then volatility will be Low.If D is greater than 0.1 but less or equal to 1.0 then volatility will be Medium.If D is greater than 1.0 but less than or equal to 2.4 then volatility will be High.If D is greater than 2.4 then volatility will be Very High.
Share Class 3 Months 6 Months 9 Months 1 Year 2 Years 3 Years Volatility
Private Bank Funds I - Access Balanced Fund (EUR)Access Balanced Fund (EUR) A (acc) 2.11% 5.03% 9.13% 7.96% 0.62% 3.90% MediumAccess Balanced Fund (EUR) A (inc) 2.11% 5.01% 9.10% 7.85% - - MediumAccess Balanced Fund (EUR) B (acc) 2.19% 5.20% 9.38% 8.28% 0.93% 4.24% MediumAccess Balanced Fund (EUR) C (acc) 2.29% 5.40% 9.71% 8.72% 1.37% 4.72% MediumAccess Balanced Fund (EUR) D (acc) 2.23% 5.29% 9.53% 8.48% 1.13% 4.46% MediumAccess Balanced Fund (EUR) Inst (acc) 2.32% 5.48% 9.82% 8.86% 1.48% 4.84% Medium
Private Bank Funds I - Access Balanced Fund (GBP)Access Balanced Fund (GBP) A (acc) 2.49% 5.56% 10.19% 9.53% 1.76% 3.77% MediumAccess Balanced Fund (GBP) A (inc) 2.48% 5.56% 10.19% 9.52% 1.74% 3.74% MediumAccess Balanced Fund (GBP) B (acc)* - - - - - - MediumAccess Balanced Fund (GBP) B (inc) 2.56% 5.71% 10.43% 9.82% 2.03% 4.09% MediumAccess Balanced Fund (GBP) C (acc) 2.65% 5.89% 10.72% 10.26% 2.44% 0.60% MediumAccess Balanced Fund (GBP) C (inc) 2.65% 5.89% 10.71% 9.97% 2.29% 4.31% MediumAccess Balanced Fund (GBP) D (acc) 2.61% 5.82% 10.59% 10.08% 2.29% 4.33% MediumAccess Balanced Fund (GBP) D (inc) 2.61% 5.81% 10.59% 10.01% 2.23% 4.27% MediumAccess Balanced Fund (GBP) Inst (acc) 2.67% 5.95% 10.81% 10.38% 2.60% 4.71% MediumAccess Balanced Fund (GBP) Inst (inc) 2.69% 5.97% 10.85% 10.29% 2.51% 4.64% Medium
Private Bank Funds I - Access Balanced Fund (USD)Access Balanced Fund (USD) A (acc) 3.40% 4.75% 9.10% 8.14% 1.70% 2.06% MediumAccess Balanced Fund (USD) B (acc) 3.48% 4.91% 9.35% 8.47% 2.02% 2.38% MediumAccess Balanced Fund (USD) C (acc) 3.58% 5.12% 9.68% 8.91% 2.47% 2.84% MediumAccess Balanced Fund (USD) D (acc) 3.53% 5.01% 9.51% 8.69% 2.22% 2.59% MediumAccess Balanced Fund (USD) Inst (acc) 3.61% 5.17% 9.78% 9.03% 2.58% 2.95% Medium
Private Bank Funds I - Access Capital Preservation Fund (EUR) (1)Access Capital Preservation Fund (EUR) A (acc) 1.10% 1.11% 3.37% 3.61% -0.19% 1.48% MediumAccess Capital Preservation Fund (EUR) B (acc) 1.13% 1.19% 3.48% 3.76% -0.04% 1.63% MediumAccess Capital Preservation Fund (EUR) C (acc) 1.20% 1.31% 3.69% 4.04% 0.25% 1.91% MediumAccess Capital Preservation Fund (EUR) C (inc) 1.19% 1.29% 3.63% 3.92% 0.17% 1.85% MediumAccess Capital Preservation Fund (EUR) D (acc) 1.22% 1.36% 3.75% 4.13% 0.32% 1.95% MediumAccess Capital Preservation Fund (EUR) Inst (acc) 1.21% 1.34% 3.72% 4.10% 0.29% 1.97% MediumAccess Capital Preservation Fund (EUR) Inst (inc) 1.20% 1.31% 3.68% 3.98% 0.25% - MediumAccess Capital Preservation Fund (EUR) Inst (inc) - GBP (hedged) 1.43% - - - - - Medium
Private Bank Funds I - Access Capital Preservation Fund (USD) (2)Access Capital Preservation Fund (USD) A (acc) 1.87% 1.41% 3.87% 4.20% 0.81% 1.03% MediumAccess Capital Preservation Fund (USD) B (acc) 1.91% 1.48% 3.99% 4.36% 0.96% 1.17% MediumAccess Capital Preservation Fund (USD) C (acc) 1.97% 1.61% 4.19% 4.63% 1.25% 1.45% MediumAccess Capital Preservation Fund (USD) Inst (acc) 1.98% 1.59% 4.13% 4.59% 1.31% 1.46% Medium
Private Bank Funds I - Access Conservative Fund (GBP) (3)Access Conservative Fund (GBP) B (inc) - - - - - - MediumAccess Conservative Fund (GBP) C (inc) - -0.92% 2.30% 2.49% - - MediumAccess Conservative Fund (GBP) D (acc) - -0.90% 2.36% 2.57% - - MediumAccess Conservative Fund (GBP) Inst (inc) - -0.92% 2.32% 2.49% 0.00% - Medium
Private Bank Funds I - Access Growth Fund (GBP) (3)Access Growth Fund (GBP) Inst (inc) - 0.84% 6.33% 5.25% -0.63% - Medium
Private Bank Funds I - Access Growth Fund (USD)Access Growth Fund (USD) A (acc) 4.28% 6.53% 11.82% 9.94% 2.07% 2.42% MediumAccess Growth Fund (USD) C (acc) 4.45% 6.89% 12.34% 10.65% - - MediumAccess Growth Fund (USD) D (inc) 4.40% 6.80% 12.23% 10.46% 2.58% 2.95% MediumAccess Growth Fund (USD) Inst (acc) 4.48% 6.94% 12.45% 10.76% 2.86% 3.23% MediumAccess Growth Fund (USD) Inst (inc) 4.47% 6.94% 12.44% 10.73% 2.84% 3.21% Medium
Private Bank Funds I - Blue and Green Fund (4)Blue and Green Fund A (acc) - EUR - -1.15% -2.44% -1.43% - - Medium
(1) This Sub-Fund was renamed from Private Bank Funds I - Access Conservative Fund (EUR) to Private Bank Funds I - Access Capital Preservation Fund (EUR) on 1 July 2016.(2) This Sub-Fund was renamed from Private Bank Funds I - Access Conservative Fund (USD) to Private Bank Funds I - Access Capital Preservation Fund (USD) on 1 July 2016.(3) This Sub-Fund was liquidated on 16 November 2016. Performance has been calculated with the last available NAV date.(4) This Sub-Fund was liquidated on 25 October 2016. Performance has been calculated with the last available NAV date.
42
Private Bank Funds IAppendix - Unaudited Additional Disclosures (continued)
3. Performance and Volatility

Share Class 3 Months 6 Months 9 Months 1 Year 2 Years 3 Years Volatility
Private Bank Funds I - Discretionary Fixed Income Government Fund (5)Discretionary Fixed Income Government Fund A (acc) - - - -0.36% 1.49% 1.48% MediumDiscretionary Fixed Income Government Fund A (acc) - USD (hedged) - - - -0.27% 1.90% - MediumDiscretionary Fixed Income Government Fund B (acc) - - - -0.34% 1.63% 1.66% MediumDiscretionary Fixed Income Government Fund C (acc) - - - -0.32% 1.90% 1.95% MediumDiscretionary Fixed Income Government Fund C (acc) - USD (hedged) - - - -0.24% 2.16% - MediumDiscretionary Fixed Income Government Fund C (inc) - - - -0.32% 1.74% 1.83% Medium
Private Bank Funds I - Dynamic Multi-Asset Fund (EUR)Dynamic Multi-Asset Fund (EUR) C (acc) 2.36% 1.95% 4.08% 3.98% - - MediumDynamic Multi-Asset Fund (EUR) C (inc) 2.35% 1.94% 4.06% 3.95% - - MediumDynamic Multi-Asset Fund (EUR) Inst (acc) 2.35% 1.94% 4.08% - - - MediumDynamic Multi-Asset Fund (EUR) Inst (inc) 2.36% 1.96% 4.10% - - - Medium
Private Bank Funds I - Dynamic Multi-Asset Fund (USD)Dynamic Multi-Asset Fund (USD) C (acc) 3.15% 2.27% 4.87% 4.92% - - MediumDynamic Multi-Asset Fund (USD) C (acc) - AUD (hedged)** - - - - - - MediumDynamic Multi-Asset Fund (USD) C (acc) - SGD (hedged) 3.10% 2.08% - - - - MediumDynamic Multi-Asset Fund (USD) C (inc) 3.15% 2.27% 4.85% 4.90% - - MediumDynamic Multi-Asset Fund (USD) C (inc) - GBP (hedged) 2.91% 1.78% - - - - MediumDynamic Multi-Asset Fund (USD) Inst (acc) 3.15% 2.27% 4.87% - - - MediumDynamic Multi-Asset Fund (USD) Inst (inc) 3.16% 2.30% 4.91% - - - Medium
Private Bank Funds I - Islamic Global Dynamic Equity Fund (6)Islamic Global Dynamic Equity Fund (USD) A (acc) 4.54% 3.21% 9.03% 7.84% 1.95% 2.68% MediumIslamic Global Dynamic Equity Fund (USD) B (acc) - - - - - - MediumIslamic Global Dynamic Equity Fund (USD) C (acc) 4.65% 3.56% 9.65% 8.69% 2.83% 3.62% MediumIslamic Global Dynamic Equity Fund (USD) Inst (acc) 4.68% 3.63% 9.78% 8.87% 3.02% 3.83% Medium
Private Bank Funds I - Montes Excelsis FundMontes Excelsis Fund C (acc) - USD 3.20% 2.39% 5.19% 5.28% 1.71% 1.97% Medium
(5) This Sub-Fund was liquidated on 29 April 2016. Performance has been calculated with the last available NAV date.(6) This Sub-Fund was liquidated on 13 February 2017. Performance has been calculated with the last available NAV date.
* Share Class inactive as at the end of the year.** No data is applicable for these Share Classes as they were launched or reactivated less than 3 months before the year end.
4. Interest Rate Received/(Charged) on Bank AccountsBasis for Bank Interest RatesThe rates are based on the JPMorgan Chase Treasury rates and consequently may change on a daily basis. The bank interest amount is posted to each of theSICAV’s bank accounts on a monthly basis on the first business day of the subsequent month based on the bank balances from the prior month.
5. Sub-Fund Share Classes Subject to Taxe d’Abonnement Rate of 0.01%A reduced tax rate of 0.01% per annum of the net assets will be applicable to Share Classes which are only sold to and held by Institutional Investors. All ShareClasses (except X Share Classes) are charged at a rate of 0.05%.
43
Private Bank Funds IAppendix - Unaudited Additional Disclosures (continued)
3. Performance and Volatility (continued)

The Portfolio Turnover Ratio is an indicator of the relevance of the additional costs incurred by a fund when buying and selling investments according to itsinvestment policy. The Portfolio Turnover Ratio is calculated in accordance with the CSSF Circular 03/122 as outlined below:
(Total securities’ purchases and sales - total subscriptions and redemptions of Sub-Fund shares)
Average net Sub-Fund assets in Sub-Fund currency
The Portfolio Turnover Ratio is expressed as a percentage and in the case the outcome of the calculation is negative, a zero value has been published.
Sub-Fund Portfolio Turnover Ratio (%)Private Bank Funds I - Access Balanced Fund (EUR) 66.00
Private Bank Funds I - Access Balanced Fund (GBP) 72.39
Private Bank Funds I - Access Balanced Fund (USD) 77.03
Private Bank Funds I - Access Capital Preservation Fund (EUR) (1) 59.02
Private Bank Funds I - Access Capital Preservation Fund (USD) (2) 64.77
Private Bank Funds I - Access Conservative Fund (GBP) (3) 205.92
Private Bank Funds I - Access Growth Fund (GBP) (3) 192.12
Private Bank Funds I - Access Growth Fund (USD) 85.85
Private Bank Funds I - Blue and Green Fund (4) 216.39
Private Bank Funds I - Discretionary Fixed Income Government Fund (5) 86.86
Private Bank Funds I - Dynamic Multi-Asset Fund (EUR) 135.24
Private Bank Funds I - Dynamic Multi-Asset Fund (USD) 125.71
Private Bank Funds I - Islamic Global Dynamic Equity Fund (6) 109.19
Private Bank Funds I - Montes Excelsis Fund 202.03
(1) This Sub-Fund was renamed from Private Bank Funds I - Access Conservative Fund (EUR) to Private Bank Funds I - Access Capital Preservation Fund (EUR) on 1 July 2016.(2) This Sub-Fund was renamed from Private Bank Funds I - Access Conservative Fund (USD) to Private Bank Funds I - Access Capital Preservation Fund (USD) on 1 July 2016.(3) This Sub-Fund was liquidated on 16 November 2016.(4) This Sub-Fund was liquidated on 25 October 2016.(5) This Sub-Fund was liquidated on 29 April 2016.(6) This Sub-Fund was liquidated on 13 February 2017.
44
Private Bank Funds IAppendix - Unaudited Additional Disclosures (continued)
6. Portfolio Turnover Ratio

Private Bank Funds IAppendix - Unaudited Additional Disclosures (continued)
7. Calculation Method of the Risk ExposureGlobal Exposure using the VaR Approach
Sub-Fund NameMarketRisk Limit
MaximumUsage of
Reg Limit*
MinimumUsage of
Reg Limit*
AverageUsage of
Reg Limit*ReferencePortfolio Model
ConfidenceInterval
HoldingPeriod
EffectiveObservation
Period Leverage**
Private Bank Funds I -Access Balanced Fund(EUR)
Relative 200% 45% 30% 36% MSCI World Index Local Currency (TotalReturn Net) (55%) / Bloomberg BarclaysGlobal Aggregate Index Hedged to EUR(30%) / Bloomberg Barclays Euro TreasuryBills 0-3 Months Index (5%) / HFRX GlobalHedge Fund USD Index Hedged to EUR (10%)
Historical 99% 20 days 250 days 49%
Private Bank Funds I -Access Balanced Fund(GBP)
Relative 200% 59% 39% 47% MSCI World Index Local Currency (TotalReturn Net) (55%) / Bloomberg BarclaysGlobal Aggregate Index Hedged to GBP(30%) / Bloomberg Barclays SterlingTreasury Bills 0-3 Month (5%) / HFRX GlobalHedge Fund USD Index Hedged to GBP (10%)
Historical 99% 20 days 250 days 74%
Private Bank Funds I -Access Balanced Fund(USD)
Relative 200% 58% 29% 40% MSCI World Index (Total Return Net) (55%) /Bloomberg Barclays Global Aggregate IndexHedged to USD (30%) / Bloomberg BarclaysU.S. Treasury Bills 1-3 Months (5%) / HFRXGlobal Hedge Fund USD Index (10%)
Historical 99% 20 days 250 days 7%
Private Bank Funds I -Access CapitalPreservation Fund (EUR)
Relative 200% 49% 27% 37% Bloomberg Barclays Global Aggregate IndexHedged to EUR (65%) / MSCI World IndexLocal Currency (Total Return Net) (20%) /Bloomberg Barclays Euro Treasury Bills 0-3Months Index (5%) / HFRX Global HedgeFund USD Index Hedged to EUR (10%)
Historical 99% 20 days 250 days 21%
Private Bank Funds I -Access CapitalPreservation Fund (USD)
Relative 200% 49% 29% 38% Bloomberg Barclays Global Aggregate IndexHedged to USD (65%) / MSCI World Index(Total Return Net) (20%) / BloombergBarclays U.S. Treasury Bills 1-3 Months (5%) /HFRX Global Hedge Fund USD Index (10%)
Historical 99% 20 days 250 days 4%
Private Bank Funds I -Access Growth Fund(USD)
Relative 200% 51% 27% 39% MSCI World Index (Total Return Net) (75%) /Bloomberg Barclays Global Aggregate IndexHedged to USD (10%) / Bloomberg BarclaysU.S. Treasury Bills 1-3 Months (5%) / HFRXGlobal Hedge Fund USD Index (10%)
Historical 99% 20 days 250 days 9%
Private Bank Funds I –Dynamic Multi-AssetFund (EUR)
Absolute 20% 20% 8% 14% n/a Historical 99% 20 days 250 days 18%
Private Bank Funds I –Dynamic Multi-AssetFund (USD)
Absolute 20% 16% 7% 12% n/a Historical 99% 20 days 250 days 12%
Private Bank Funds I -Montes Excelsis Fund
Absolute 20% 16% 7% 13% n/a Historical 99% 20 days 250 days 14%
* over the last 12 months up to 31/03/2017 versus regulatory limit** Average leverage over the last 12 months up to 31/03/2017 - leverage is defined as sum of absolute of notional of all derivatives in the SICAV.NOTE: The VaR calculation is based on Monte Carlo VaR until 29 February 2016. VaR calculation switched to historical VaR with effect from 1 March 2016.
45

Private Bank Funds IAppendix - Unaudited Additional Disclosures (continued)
8. Securities Financing TransactionsThe SICAV does not engage in Securities Financing Transactions (as defined in Article 3 of Regulation (EU) 2015/2365, securities financing transactionsinclude repurchase transactions, securities or commodities lending and securities or commodities borrowing, buy-sell back transactions or sell-buy backtransactions and margin lending transactions). Accordingly, disclosures required by Article 13 of the Regulation are not applicable for the year ended31 March 2017.
9. UCITS Remuneration DisclosuresJPMorgan Asset Management (Europe) S.à.r.l is the authorised manager of Private Bank Funds I and is part of the J.P. Morgan Chase & Co. group ofcompanies. In this section, the terms “J.P. Morgan” or “Firm” refer to that group, and each of the entities in that group globally, unless otherwise specified.
This section of the annual report has been prepared in accordance with Part I of the Luxembourg law of 17 December 2010 relating to collective investmentundertakings as amended from time to time and the ‘Guidelines on sound remuneration policies’ issued by the European Securities and Markets Authorityunder the Undertaking for Collective Investments in Transferable Securities (the “UCITS”) Directive.
Remuneration PolicyThe current remuneration policy for the Management Company (the “Remuneration Policy”) can be found at:http://www.jpmorganassetmanagement.lu/en/showpage.aspx?pageID=651.
This policy includes details of how remuneration and benefits are calculated, including the financial and non-financial criteria used to evaluate performance,the responsibilities and composition of the Firm’s Compensation and Management Development Committee, and the measures adopted to avoid or manageconflicts of interest. A copy of this policy can be requested free of charge from the Management Company.
The Remuneration Policy applies to all employees of the Management Company, including individuals whose professional activities may have a materialimpact on the risk profile of the Management Company or the funds it manages (“Identified Staff”). The Identified Staff include members of the Board of theManagement Company, senior management, the heads of relevant Control Functions, and holders of other key functions. Individuals are notified of theiridentification and the implications of this status on at least an annual basis.
The Board of the Management Company reviews and adopts the Remuneration Policy on an annual basis, and oversees its implementation, including theclassification of Identified Staff. As at 31 March 2017, the Board of the Management Company last reviewed and adopted the Remuneration Policy in October2016 with no material changes and was satisfied with its implementation.
The Remuneration Policy, and its implementation, is designed to foster proper governance and regulatory compliance. The remuneration structure asdescribed in the Remuneration Policy is designed to contribute to the achievement of short-term and long-term strategic and operational objectives, whileavoiding excessive risk-taking inconsistent with the risk management strategy. This is intended to be accomplished, in part, through a balanced totalcompensation program comprised of a mix of fixed remuneration (including base salary), and variable remuneration in the form of cash incentives andlong-term, equity based or fund-tracking incentives that vest over time. A balanced assessment of employees’ performance is undertaken taking account ofbusiness and financial results, risk and control outcomes, client/customer goals, and other priorities including people and leadership objectives asappropriate. The compensation governance practices contain a number of measures to avoid conflicts of interest, including independent oversight andcontrol of the remuneration policy, and the assessment of employees in Control Functions against independent objectives linked to their functions.
Quantitative DisclosuresThe table below provides an overview of the aggregate 2016 total remuneration paid to staff of the Management Company and the number of beneficiaries.
Due to the Firm’s operational structure, the information needed to provide a further breakdown of remuneration attributable to the SICAV is not readilyavailable and would not be relevant or reliable. However, for context, the Management Company manages four AIFs (with 11 sub-funds) and six UCITS (with162 sub-funds), with a combined AUM as at December 2016 of USD 2,498m and USD 289,300m respectively
Fixed remuneration Variable remuneration Total remuneration(1) Number of beneficiaries
All staff ($’000s) 33,021 17,255 50,276 289
The UCITS V remuneration regime applies only in respect of remuneration for the first full performance period after the UCITS V Directive came into force inMarch 2016. Accordingly, the SICAV makes no quantitative remuneration disclosures in this annual report in respect of Identified Staff as the informationwould not be relevant or reliable.
For the purposes of the above disclosures, where portfolio management activities have been formally delegated to another entity, the remuneration for therelevant employees has been excluded.
(1) No carried interest or performance fees were paid to any staff by the SICAV in the year.
46

Shares Outstandingat the Beginning
of the Year
SharesSubscribed
SharesRedeemed
Shares Outstandingat the End
of the Year
For the Year Ended 31 March 2016 (continued)
Private Bank Funds I - Access Balanced Fund (EUR)#Access Balanced Fund (EUR) A (acc) 3,182,498.313 489,231.432 1,033,104.200 2,638,625.545Access Balanced Fund (EUR) A (inc) - 21,010.289 - 21,010.289Access Balanced Fund (EUR) B (acc) 1,043,485.200 192,201.977 407,590.939 828,096.238Access Balanced Fund (EUR) C (acc) 2,122,148.531 552,814.129 986,113.628 1,688,849.032Access Balanced Fund (EUR) D (acc) 16,690.349 955.857 4,104.924 13,541.282Access Balanced Fund (EUR) Inst (acc) 1,455,884.932 280,992.897 482,177.464 1,254,700.365
Private Bank Funds I - Access Balanced Fund (GBP)#Access Balanced Fund (GBP) A (acc) 65,063.417 11,919.761 16,869.503 60,113.675Access Balanced Fund (GBP) A (inc) 36,454.698 2,237.592 12,510.369 26,181.921Access Balanced Fund (GBP) B (acc) 37,578.511 5,564.267 14,688.000 28,454.778Access Balanced Fund (GBP) B (inc) 50,275.416 19,496.363 30,590.382 39,181.397Access Balanced Fund (GBP) C (acc) 109,850.000 962.772 - 110,812.772Access Balanced Fund (GBP) C (inc) 22,977.372 48,819.183 19,192.330 52,604.225Access Balanced Fund (GBP) D (acc) 36,396.675 5,729.314 - 42,125.989Access Balanced Fund (GBP) D (inc) 44,880.713 17,276.522 3,205.597 58,951.638Access Balanced Fund (GBP) Inst (acc) 258,308.566 45,467.589 86,113.750 217,662.405Access Balanced Fund (GBP) Inst (inc) 1,569,997.007 224,413.199 565,427.381 1,228,982.825
Private Bank Funds I - Access Balanced Fund (USD)#Access Balanced Fund (USD) A (acc) 5,798,499.559 960,183.606 1,817,118.949 4,941,564.216Access Balanced Fund (USD) B (acc) 1,005,085.037 221,644.879 181,386.064 1,045,343.852Access Balanced Fund (USD) C (acc) 1,348,750.147 250,461.150 754,713.340 844,497.957Access Balanced Fund (USD) D (acc) 396,135.630 - 322,524.120 73,611.510Access Balanced Fund (USD) Inst (acc) 1,965,080.976 84,962.870 319,184.359 1,730,859.487
Private Bank Funds I - Access Conservative Fund (EUR)#Access Conservative Fund (EUR) A (acc) 2,633,945.961 522,518.206 1,050,537.722 2,105,926.445Access Conservative Fund (EUR) B (acc) 1,080,757.033 268,070.031 889,438.264 459,388.800Access Conservative Fund (EUR) C (acc) 2,428,138.434 1,179,817.235 1,578,491.307 2,029,464.362Access Conservative Fund (EUR) C (inc) 137,244.766 7,520.211 41,371.158 103,393.819Access Conservative Fund (EUR) D (acc) 10,774.907 8,970.326 4,220.183 15,525.050Access Conservative Fund (EUR) Inst (acc) 788,767.158 441,273.480 501,490.182 728,550.456Access Conservative Fund (EUR) Inst (inc) 667,085.743 - 557,408.716 109,677.027
Private Bank Funds I - Access Conservative Fund (GBP)#Access Conservative Fund (GBP) B (inc) 10,903.281 5,268.293 3,286.979 12,884.595Access Conservative Fund (GBP) C (inc) - 10.000 - 10.000Access Conservative Fund (GBP) D (acc) - 5,027.110 - 5,027.110Access Conservative Fund (GBP) Inst (inc) 100,501.323 95,067.219 60,194.623 135,373.919
Private Bank Funds I - Access Conservative Fund (USD)#Access Conservative Fund (USD) A (acc) 2,030,458.595 650,746.979 508,139.564 2,173,066.010Access Conservative Fund (USD) A (inc)* - 29,000.000 29,000.000 -Access Conservative Fund (USD) B (acc) 573,718.270 96,955.807 207,799.748 462,874.329Access Conservative Fund (USD) C (acc) 1,528,869.128 223,591.314 698,252.553 1,054,207.889Access Conservative Fund (USD) Inst (acc) 169,452.990 7,795.216 76,193.938 101,054.268Access Conservative Fund (USD) Inst (inc)* 101,601.410 - 101,601.410 -
Private Bank Funds I - Access Growth Fund (GBP)#Access Growth Fund (GBP) Inst (inc) 47,653.069 54,688.365 10,152.305 92,189.129
Private Bank Funds I - Access Growth Fund (USD)#Access Growth Fund (USD) A (acc) 495,959.663 33,462.574 194,552.724 334,869.513Access Growth Fund (USD) C (acc)** - 1,528.168 - 1,528.168Access Growth Fund (USD) D (inc) 36,409.545 1,375.768 7,492.906 30,292.407Access Growth Fund (USD) Inst (acc) 30,064.324 135.449 10,212.885 19,986.888Access Growth Fund (USD) Inst (inc) 188,383.452 175,097.991 89,701.639 273,779.804
Private Bank Funds I - Blue and Green Fund (1)Blue and Green Fund A (acc) - EUR - 3,393.749 - 3,393.749
Private Bank Funds I - Discretionary Fixed Income Government Fund#Discretionary Fixed Income Government Fund A (acc) 18,466.215 2,719.135 16,530.639 4,654.711Discretionary Fixed Income Government Fund A (acc) - USD (hedged) 35,583.743 - 16,162.719 19,421.024Discretionary Fixed Income Government Fund A (inc)* 9.971 - 9.971 -Discretionary Fixed Income Government Fund B (acc) 26,549.034 - 17,397.371 9,151.663Discretionary Fixed Income Government Fund C (acc) 2,335,255.999 218,989.733 2,535,655.733 18,589.999Discretionary Fixed Income Government Fund C (acc) - USD (hedged) 1,990,477.939 154,966.609 2,134,989.382 10,455.166Discretionary Fixed Income Government Fund C (inc) 15,940.429 5,840.597 21,746.666 34.360Discretionary Fixed Income Government Fund C (inc) - GBP (hedged)* 114,606.108 903.196 115,509.304 -Discretionary Fixed Income Government Fund C (inc) - USD (hedged)* 104,117.907 3,545.487 107,663.394 -
Private Bank Funds I - Dynamic Multi-Asset Fund (EUR) (2)Dynamic Multi-Asset Fund (EUR) C (acc) - 3,582,154.033 60,218.092 3,521,935.941Dynamic Multi-Asset Fund (EUR) C (inc) - 90,757.852 - 90,757.852
(1) This Sub-Fund was launched on 9 November 2015.(2) This Sub-Fund was launched on 14 October 2015.
47
Private Bank Funds IAppendix - Unaudited Additional Disclosures (continued)
10. Historical Statement of Changes in the Number of Shares (continued)

Shares Outstandingat the Beginning
of the Year
SharesSubscribed
SharesRedeemed
Shares Outstandingat the End
of the Year
For the Year Ended 31 March 2016 (continued)
Private Bank Funds I - Dynamic Multi-Asset Fund (USD) (2)Dynamic Multi-Asset Fund (USD) C (acc) - 2,410,760.611 25,000.000 2,385,760.611Dynamic Multi-Asset Fund (USD) C (inc) - 234,948.101 25,000.000 209,948.101
Private Bank Funds I - Islamic Global Dynamic Equity Fund#Islamic Global Dynamic Equity Fund (USD) A (acc) 129,510.997 198.815 120,648.755 9,061.057Islamic Global Dynamic Equity Fund (USD) B (acc) 74,322.854 - 28,087.347 46,235.507Islamic Global Dynamic Equity Fund (USD) C (acc) 444,591.072 8,200.131 343,818.094 108,973.109Islamic Global Dynamic Equity Fund (USD) Inst (acc) 68,379.962 6,666.667 9,210.468 65,836.161
Private Bank Funds I - Montes Excelsis Fund#Montes Excelsis Fund C (acc) - USD 1,738,705.748 - - 1,738,705.748
# JPMorgan Private Bank Funds I was renamed Private Bank Funds I on 1 August 2015. As a result of this change, Sub-Fund and Share Class names were also changed.(2) This Sub-Fund was launched on 14 October 2015.
* Share Class inactive as at the end of the year.** Share Class reactivated during the year.
48
Private Bank Funds IAppendix - Unaudited Additional Disclosures (continued)
10. Historical Statement of Changes in the Number of Shares (continued)

Shares Outstandingat the Beginning
of the Year
SharesSubscribed
SharesRedeemed
Shares Outstandingat the End
of the Year
For the Year Ended 31 March 2015 (continued)
JPMorgan Private Bank Funds I - Access Balanced Fund (EUR)JPM Access Balanced Fund (EUR) A (acc) 3,308,564.921 794,538.516 920,605.124 3,182,498.313JPM Access Balanced Fund (EUR) B (acc) 1,256,461.468 337,988.323 550,964.591 1,043,485.200JPM Access Balanced Fund (EUR) C (acc) 1,785,608.442 1,074,025.578 737,485.489 2,122,148.531JPM Access Balanced Fund (EUR) D (acc) 25,581.177 12,585.425 21,476.253 16,690.349JPM Access Balanced Fund (EUR) Inst (acc) 1,244,724.698 597,480.142 386,319.908 1,455,884.932
JPMorgan Private Bank Funds I - Access Balanced Fund (GBP)JPM Access Balanced Fund (GBP) A (acc) 68,157.729 12,011.787 15,106.099 65,063.417JPM Access Balanced Fund (GBP) A (inc) 29,905.631 12,091.187 5,542.120 36,454.698JPM Access Balanced Fund (GBP) B (acc) 45,881.235 14,120.441 22,423.165 37,578.511JPM Access Balanced Fund (GBP) B (inc) 78,511.796 4,568.865 32,805.245 50,275.416JPM Access Balanced Fund (GBP) C (acc)** 8,649.069 109,850.000 8,649.069 109,850.000JPM Access Balanced Fund (GBP) C (inc) 116,380.087 9,265.682 102,668.397 22,977.372JPM Access Balanced Fund (GBP) D (acc) 34,854.908 3,807.972 2,266.205 36,396.675JPM Access Balanced Fund (GBP) D (inc) 50,392.183 35,882.103 41,393.573 44,880.713JPM Access Balanced Fund (GBP) Inst (acc) 224,630.229 99,618.293 65,939.956 258,308.566JPM Access Balanced Fund (GBP) Inst (inc) 947,308.681 743,172.505 120,484.179 1,569,997.007
JPMorgan Private Bank Funds I - Access Balanced Fund (USD)JPM Access Balanced Fund (USD) A (acc) 5,733,503.691 1,931,277.418 1,866,281.550 5,798,499.559JPM Access Balanced Fund (USD) B (acc) 1,183,856.641 341,884.925 520,656.529 1,005,085.037JPM Access Balanced Fund (USD) C (acc) 862,998.745 804,436.440 318,685.038 1,348,750.147JPM Access Balanced Fund (USD) D (acc) 328,748.148 94,786.840 27,399.358 396,135.630JPM Access Balanced Fund (USD) Inst (acc) 2,014,806.257 351,258.639 400,983.920 1,965,080.976
JPMorgan Private Bank Funds I - Access Conservative Fund (EUR)JPM Access Conservative Fund (EUR) A (acc) 2,573,880.066 1,035,218.266 975,152.371 2,633,945.961JPM Access Conservative Fund (EUR) B (acc) 910,010.332 513,704.215 342,957.514 1,080,757.033JPM Access Conservative Fund (EUR) C (acc) 2,259,920.234 1,567,385.059 1,399,166.859 2,428,138.434JPM Access Conservative Fund (EUR) C (inc) 75,000.000 62,244.766 - 137,244.766JPM Access Conservative Fund (EUR) D (acc) 15,269.831 28,663.795 33,158.719 10,774.907JPM Access Conservative Fund (EUR) Inst (acc) 833,051.500 707,145.331 751,429.673 788,767.158JPM Access Conservative Fund (EUR) Inst (inc) - 667,085.743 - 667,085.743
JPMorgan Private Bank Funds I - Access Conservative Fund (GBP) (1)JPM Access Conservative Fund (GBP) B (inc) - 10,903.281 - 10,903.281JPM Access Conservative Fund (GBP) Inst (inc) - 100,512.986 11.663 100,501.323
JPMorgan Private Bank Funds I - Access Conservative Fund (USD)JPM Access Conservative Fund (USD) A (acc) 1,551,230.992 1,373,959.583 894,731.980 2,030,458.595JPM Access Conservative Fund (USD) B (acc) 245,648.764 339,687.325 11,617.819 573,718.270JPM Access Conservative Fund (USD) C (acc) 1,120,175.706 913,357.929 504,664.507 1,528,869.128JPM Access Conservative Fund (USD) Inst (acc) 38,499.295 396,459.286 265,505.591 169,452.990JPM Access Conservative Fund (USD) Inst (inc) - 101,601.410 - 101,601.410
JPMorgan Private Bank Funds I - Access Growth Fund (GBP) (1)JPM Access Growth Fund (GBP) Inst (inc) - 47,653.069 - 47,653.069
JPMorgan Private Bank Funds I - Access Growth Fund (USD)JPM Access Growth Fund (USD) A (acc) 456,596.877 229,200.411 189,837.625 495,959.663JPM Access Growth Fund (USD) D (inc) 23,952.724 18,943.594 6,486.773 36,409.545JPM Access Growth Fund (USD) Inst (acc) 15,274.296 17,466.987 2,676.959 30,064.324JPM Access Growth Fund (USD) Inst (inc) 105,334.088 147,896.725 64,847.361 188,383.452
JPMorgan Private Bank Funds I - Discretionary Fixed Income Government Fund (2)JPM Discretionary Fixed Income Government Fund A (acc) 54,035.288 14,528.522 50,097.595 18,466.215JPM Discretionary Fixed Income Government Fund A (acc) - USD (hedged) - 43,909.262 8,325.519 35,583.743JPM Discretionary Fixed Income Government Fund A (inc) 9.971 - - 9.971JPM Discretionary Fixed Income Government Fund B (acc) 28,503.026 4,742.001 6,695.993 26,549.034JPM Discretionary Fixed Income Government Fund B (acc) - USD (hedged)* - 4,774.510 4,774.510 -JPM Discretionary Fixed Income Government Fund C (acc) 2,396,534.981 1,409,644.258 1,470,923.240 2,335,255.999JPM Discretionary Fixed Income Government Fund C (acc) - USD (hedged) - 2,295,347.484 304,869.545 1,990,477.939JPM Discretionary Fixed Income Government Fund C (inc) 11,326.421 100,628.957 96,014.949 15,940.429JPM Discretionary Fixed Income Government Fund C (inc) - GBP (hedged) - 184,464.853 69,858.745 114,606.108JPM Discretionary Fixed Income Government Fund C (inc) - USD (hedged) - 132,125.913 28,008.006 104,117.907
JPMorgan Private Bank Funds I - Diversified Fixed Income Fund (GBP) (3)JPM Diversified Fixed Income Fund (GBP) A (inc) 5.988 - 5.988 -JPM Diversified Fixed Income Fund (GBP) C (acc) 6,180 - 6,180 -JPM Diversified Fixed Income Fund (GBP) C (inc) 169,987.085 74,438.550 244,425.635 -
(1) This Sub-Fund was launched on 5 November 2014.(2) This Sub-Fund was renamed from Diversified Fixed Income Fund (EUR) on 30 January 2015.(3) This Sub-Fund merged into Discretionary Fixed Income Government Fund on 30 January 2015.
49
Private Bank Funds IAppendix - Unaudited Additional Disclosures (continued)
10. Historical Statement of Changes in the Number of Shares (continued)

Shares Outstandingat the Beginning
of the Year
SharesSubscribed
SharesRedeemed
Shares Outstandingat the End
of the Year
For the Year Ended 31 March 2015 (continued)
JPMorgan Private Bank Funds I - Diversified Fixed Income Fund (USD) (3)JPM Diversified Fixed Income Fund (USD) A (acc) 78,656.008 9,037.554 87,693.562 -JPM Diversified Fixed Income Fund (USD) A (inc) 7,027.336 - 7,027.336 -JPM Diversified Fixed Income Fund (USD) B (acc) 74,896.797 - 74,896.797 -JPM Diversified Fixed Income Fund (USD) C (acc) 2,129,247.518 535,711.287 2,664,958.805 -JPM Diversified Fixed Income Fund (USD) C (inc) 187,286.843 25,517.232 212,804.075 -
JPMorgan Private Bank Funds I - Global Currency and Income Fund (ex-G4) (4)JPM Global Currency and Income Fund (ex-G4) A (acc) - EUR 197,545.039 25.000 197,570.039 -JPM Global Currency and Income Fund (ex-G4) A (acc) - USD 28,889.975 - 28,889.975 -JPM Global Currency and Income Fund (ex-G4) A (inc) - EUR 10.736 - 10.736 -JPM Global Currency and Income Fund (ex-G4) A (inc) - USD 7.594 - 7.594 -JPM Global Currency and Income Fund (ex-G4) C (acc) - EUR 182,536.948 - 182,536.948 -JPM Global Currency and Income Fund (ex-G4) C (acc) - USD 15,270.673 - 15,270.673 -JPM Global Currency and Income Fund (ex-G4) C (inc) - EUR 11.130 - 11.130 -JPM Global Currency and Income Fund (ex-G4) C (inc) - GBP 11.616 - 11.616 -JPM Global Currency and Income Fund (ex-G4) Inst (acc) - EUR 114,999.655 9,459.086 124,458.741 -JPM Global Currency and Income Fund (ex-G4) Inst (acc) - USD 4,506.938 - 4,506.938 -JPM Global Currency and Income Fund (ex-G4) Inst (inc) - EUR 15,818.784 270.169 16,088.953 -JPM Global Currency and Income Fund (ex-G4) Inst (inc) - USD 7.404 - 7.404 -
JPMorgan Private Bank Funds I - International Currency Fixed Income Fund (5)JPM International Currency Fixed Income A (acc) - USD 78,482.004 - 78,482.004 -JPM International Currency Fixed Income A (inc) - USD 3,874.303 - 3,874.303 -JPM International Currency Fixed Income C (acc) - USD 56,414.919 299.339 56,714.258 -JPM International Currency Fixed Income C (inc) - USD 661.644 - 661.644 -
JPMorgan Private Bank Funds I - Islamic Global Dynamic Equity FundJPM Islamic Global Dynamic Equity Fund (USD) A (acc) 138,354.678 11,083.052 19,926.733 129,510.997JPM Islamic Global Dynamic Equity Fund (USD) B (acc) 50,000.000 29,886.167 5,563.313 74,322.854JPM Islamic Global Dynamic Equity Fund (USD) C (acc) 493,935.435 206,223.181 255,567.544 444,591.072JPM Islamic Global Dynamic Equity Fund (USD) Inst (acc) 68,379.962 - - 68,379.962
JPMorgan Private Bank Funds I - Montes Excelsis FundJPM Montes Excelsis Fund C (acc) - USD 1,738,705.748 - - 1,738,705.748
(3) This Sub-Fund merged into Discretionary Fixed Income Government Fund on 30 January 2015.(4) This Sub-Fund was liquidated on 21 January 2015.(5) This Sub-Fund was liquidated on 28 November 2014.
* Share Class inactive as at the end of the year.** Share Class reactivated during the year.
50
Private Bank Funds IAppendix - Unaudited Additional Disclosures (continued)
10. Historical Statement of Changes in the Number of Shares (continued)

The management fees below are for Undertakings managed by investment managers which are not members of JPMorgan Chase & Co. group and held by theSICAV on 31 March 2017.Sub-Fund and Share Class Management Fee*
Private Bank Funds I - Access Balanced Fund (EUR)Alken European Opportunities Fund - Class R Accumulation EUR 1.50%BBH Core Select Fund - Class R[i] 1.00%BlackRock Europe Equity 1 Fund - Class J EUR 0.20%BlackRock Japan Equity 1 Fund - Class J JPY 0.20%BlackRock US Dollar High Yield Bond Fund - Class I2 EUR Hedged 0.65%DB Platinum IV Systematic Alpha Fund - Class I5C-E 1.44%Edgewood US Select Growth Fund - Class I USD Z 1.00%FundLogic MS PSAM Global Event UCITS Fund - Share Class I EUR 1.50%GAM Star Global Rates Fund - Class Ordinary EUR Accumulation 0.00%Henderson CONTINENTAL EUROPEAN FUND - Class G¤ Acc 0.65%MAJEDIE ASSET MANAGEMENT UK EQUITY FUND (GBP) - Class Z Acc 0.75%Man GLG Japan CoreAlpha Equity Fund - Class I JPY Shares 0.75%Marshall Wace TOPS UCITS Fund - Class F EUR Shares 0.00%Merrill Lynch AQR Global Relative Value UCITS Fund – EUR A (acc) 1.00%Nomura Japan Strategic Value Fund - Class I JPY 0.85%Nordea US Total Return Bond Fund - HBI-EUR Share Class 0.55%Pictet Global Emerging Debt Fund - HJ EUR 0.55%PIMCO Global Investment Grade Credit Fund - Institutional EUR (Hedged) Accumulation 0.49%Robeco BP US Large Cap Equities Fund - I USD 0.65%T. Rowe Price US Smaller Companies Equity Fund - Class I 0.95%Vanguard Pacific ex-Japan Stock Index Fund - Institutional Plus “Euro” Shares 0.20%
Private Bank Funds I - Access Balanced Fund (GBP)Alken European Opportunities Fund - Class U Distribution EUR 1.50%BBH Core Select Fund - Class R[i] 1.00%BlackRock Europe Equity 1 Fund - Class J EUR 0.20%BlackRock Japan Equity 1 Fund - Class J JPY 0.20%BlackRock US Dollar High Yield Bond Fund - Class I4RF GBP Hedged 0.65%DB Platinum IV Systematic Alpha Fund - Class I5C-G 1.44%Edgewood US Select Growth Fund - Class I USD Z 1.00%FundLogic MS PSAM Global Event UCITS Fund - Share Class I GBP 1.50%GAM Star Global Rates Fund - Class Ordinary GBP Income Distribution 0.00%Henderson CONTINENTAL EUROPEAN FUND - Class G¤ Acc 0.65%MAJEDIE UK EQUITY FUND (GBP) - Class X Acc 0.75%Man GLG Japan CoreAlpha Equity Fund - Class I JPY Shares 0.75%Marshall Wace TOPS UCITS Fund - Class F GBP Shares 0.00%Merrill Lynch AQR Global Relative Value UCITS Fund – GBP A (acc) 1.00%Nomura Japan Strategic Value Fund - Class I JPY 0.85%Nordea US Total Return Bond Fund - HAI-GBP Share Class 0.55%Pictet Global Emerging Debt Fund - HJ dy GBP 0.55%PIMCO Global Investment Grade Credit Fund - Institutional GBP (Hedged) Income 0.49%Robeco BP US Large Cap Equities Fund - IE GBP 0.65%T. Rowe Price US Smaller Companies Equity Fund - Class I 0.95%Vanguard Pacific ex-Japan Stock Index Fund - Institutional Plus GBP Accumulation Shares 0.20%
Private Bank Funds I - Access Balanced Fund (USD)Alken European Opportunities Fund - Class R Accumulation EUR 1.50%BBH Core Select Fund - Class R[i] 1.00%BlackRock Europe Equity 1 Fund - Class J EUR 0.20%BlackRock Japan Equity 1 Fund - Class J JPY 0.20%BlackRock US Dollar High Yield Bond Fund - Class I2 USD 0.65%DB Platinum IV Systematic Alpha Fund - Class I5C-U 1.44%Edgewood US Select Growth Fund - Class I USD Z 1.00%FundLogic MS PSAM Global Event UCITS Fund - Share Class I USD 1.50%GAM Star Global Rates Fund - Class Ordinary USD Accumulation 0.00%Henderson CONTINENTAL EUROPEAN FUND - Class G¤ Acc 0.65%MAJEDIE ASSET MANAGEMENT UK EQUITY FUND (GBP) - Class Z Acc 0.75%Man GLG Japan CoreAlpha Equity Fund - Class I JPY Shares 0.75%Marshall Wace TOPS UCITS Fund - Class F USD Shares 0.00%Merrill Lynch AQR Global Relative Value UCITS Fund – USD A (acc) 1.00%Nomura Japan Strategic Value Fund - Class I JPY 0.85%Nordea US Total Return Bond Fund - BI-USD Share Class 0.55%Pictet Global Emerging Debt Fund - J USD 0.55%PIMCO Global Investment Grade Credit Fund - Institutional USD Accumulation 0.49%Robeco BP US Large Cap Equities Fund - I USD 0.65%T. Rowe Price US Smaller Companies Equity Fund - Class I 0.95%Vanguard Pacific ex-Japan Stock Index Fund - Institutional Plus “U.S. Dollar” Shares 0.20%
51
Private Bank Funds IAppendix - Unaudited Additional Disclosures (continued)
11. Management Fees of Undertakings Managed by Investment Managers which are not Members of JPMorgan Chase & Co. group

Sub-Fund and Share Class Management Fee*
Private Bank Funds I - Access Capital Preservation Fund (EUR) (1)Alken European Opportunities Fund - Class R Accumulation EUR 1.50%BBH Core Select Fund - Class R[i] 1.00%BlackRock Europe Equity 1 Fund - Class J EUR 0.20%BlackRock Japan Equity 1 Fund - Class J JPY 0.20%BlackRock US Dollar High Yield Bond Fund - Class I2 EUR Hedged 0.65%DB Platinum IV Systematic Alpha Fund - Class I5C-E 1.44%Edgewood US Select Growth Fund - Class I USD Z 1.00%FundLogic MS PSAM Global Event UCITS Fund - Share Class I EUR 1.50%GAM Star Global Rates Fund - Class Ordinary EUR Accumulation 0.00%Henderson UNITED KINGDOM ABSOLUTE RETURN FUND - Class G¤ Acc (hedged) 0.75%Man GLG Japan CoreAlpha Equity Fund - Class I JPY Shares 0.75%Man Numeric Market Neutral Alternative Fund - Class INU H EUR Shares 1.25%Marshall Wace TOPS UCITS Fund - Class F EUR Shares 0.00%Merrill Lynch AQR Global Relative Value UCITS Fund – EUR A (acc) 1.00%Muzinich Enhancedyield Short-Term Fund - Hedged Euro Accumulation A Units 0.45%Nomura Japan Strategic Value Fund - Class I JPY 0.85%Nordea US Total Return Bond Fund - HBI-EUR Share Class 0.55%Pictet Global Emerging Debt Fund - HJ EUR 0.55%PIMCO Global Investment Grade Credit Fund - Institutional EUR (Hedged) Accumulation 0.49%Robeco BP US Large Cap Equities Fund - I USD 0.65%Vanguard Global Bond Index Fund - Institutional Plus “Euro” Hedged Shares 0.10%Vanguard Pacific ex-Japan Stock Index Fund - Institutional Plus “Euro” Shares 0.20%
Private Bank Funds I - Access Capital Preservation Fund (USD) (2)Alken European Opportunities Fund - Class R Accumulation EUR 1.50%BBH Core Select Fund - Class R[i] 1.00%BlackRock Europe Equity 1 Fund - Class J EUR 0.20%BlackRock Japan Equity 1 Fund - Class J JPY 0.20%BlackRock US Dollar High Yield Bond Fund - Class I2 USD 0.65%DB Platinum IV Systematic Alpha Fund - Class I5C-U 1.44%Edgewood US Select Growth Fund - Class I USD Z 1.00%FundLogic MS PSAM Global Event UCITS Fund - Share Class I USD 1.50%GAM Star Global Rates Fund - Class Ordinary USD Accumulation 0.00%Henderson UNITED KINGDOM ABSOLUTE RETURN FUND - Class G$ Acc (hedged) 0.75%Man GLG Japan CoreAlpha Equity Fund - Class I JPY Shares 0.75%Man Numeric Market Neutral Alternative Fund - Class INU USD Shares 1.25%Marshall Wace TOPS UCITS Fund - Class F USD Shares 0.00%Merrill Lynch AQR Global Relative Value UCITS Fund – USD A (acc) 1.00%Muzinich Enhancedyield Short-Term Fund - Hedged USD Accumulation A Units 0.45%Muzinich ShortDurationHighYield Fund - Hedged USD Accumulation S Units 0.50%Nomura Japan Strategic Value Fund - Class I JPY 0.85%Nordea US Total Return Bond Fund - BI-USD Share Class 0.55%Pictet Global Emerging Debt Fund - J USD 0.55%PIMCO Global Investment Grade Credit Fund - Institutional USD Accumulation 0.49%Robeco BP US Large Cap Equities Fund - I USD 0.65%Vanguard Global Bond Index Fund - Institutional Plus USD Hedged Shares 0.10%Vanguard Pacific ex-Japan Stock Index Fund - Institutional Plus “U.S. Dollar” Shares 0.20%
Private Bank Funds I - Access Growth Fund (USD)Alken European Opportunities Fund - Class R Accumulation EUR 1.50%BBH Core Select Fund - Class R[i] 1.00%BlackRock Europe Equity 1 Fund - Class J EUR 0.20%BlackRock Japan Equity 1 Fund - Class J JPY 0.20%BlackRock US Dollar High Yield Bond Fund - Class I2 USD 0.65%DB Platinum IV Systematic Alpha Fund - Class I5C-U 1.44%Edgewood US Select Growth Fund - Class I USD Z 1.00%Henderson CONTINENTAL EUROPEAN FUND - Class G¤ Acc 0.65%Henderson UNITED KINGDOM ABSOLUTE RETURN FUND - Class G$ Acc (hedged) 0.75%MAJEDIE ASSET MANAGEMENT UK EQUITY FUND (GBP) - Class Z Acc 0.75%Man GLG Japan CoreAlpha Equity Fund - Class I JPY Shares 0.75%Marshall Wace TOPS UCITS Fund - Class F USD Shares 0.00%Merrill Lynch AQR Global Relative Value UCITS Fund – USD A (acc) 1.00%Muzinich Enhancedyield Short-Term Fund - Hedged USD Accumulation A Units 0.45%Nomura Japan Strategic Value Fund - Class I JPY 0.85%Pictet Global Emerging Debt Fund - J USD 0.55%Robeco BP US Large Cap Equities Fund - I USD 0.65%Vanguard Pacific ex-Japan Stock Index Fund - Institutional Plus “U.S. Dollar” Shares 0.20%
(1) This Sub-Fund was renamed from Private Bank Funds I - Access Conservative Fund (EUR) to Private Bank Funds I - Access Capital Preservation Fund (EUR) on 1 July 2016.(2) This Sub-Fund was renamed from Private Bank Funds I - Access Conservative Fund (USD) to Private Bank Funds I - Access Capital Preservation Fund (USD) on 1 July 2016.
52
Private Bank Funds IAppendix - Unaudited Additional Disclosures (continued)
11. Management Fees of Undertakings Managedby Investment Managers which arenot Members of JPMorgan Chase& Co. group (continued)

Sub-Fund and Share Class Management Fee*
Private Bank Funds I - Dynamic Multi-Asset Fund (EUR)AQR Managed Futures UCITS Fund - Class E EUR 0.50%Ashmore Emerging Markets Short Duration Fund - Z2 EUR Cap 0.75%BlackRock Asian Dragon Fund - Class I4RF USD 0.75%BlackRock Institutional Euro Ultra Short Bond Fund - Class Premier Accumulating EUR 0.10%BNP PARIBAS US MORTGAGE Fund - Class “IH EUR Capitalisation” 0.30%BOUSSARD & GAVAUDAN ABSOLUTE RETURN Fund - Z-CLASS EUR 1.00%Edgewood US Select Growth Fund - Class A USD R 0.90%First State Global Listed Infrastructure Fund - Class VI (Accumulation) EUR (Share Class) 0.75%GAM Star Global Rates Fund - Class Ordinary EUR Accumulation 0.00%GAM Star Keynes Quantitative Strategies Fund - Class W EUR Accumulation 0.20%Henderson UNITED KINGDOM ABSOLUTE RETURN FUND - Class G¤ Acc (hedged) 0.75%Magna New Frontiers Fund - G Class Shares 1.00%Man GLG Global Emerging Markets Debt Total Return Fund - Class IMF H EUR Shares 0.50%Man GLG Japan CoreAlpha Equity Fund - Class I JPY Shares 0.75%Man Numeric Market Neutral Alternative Fund - Class INU H EUR Shares 1.25%Melchior European Enhanced Absolute Return Fund - J1 ¤ 2.00%Muzinich Enhancedyield Short-Term Fund - Hedged Euro Accumulation A Units 0.45%Muzinich ShortDurationHighYield Fund - Hedged Euro Accumulation S Units 0.50%Nordea US Total Return Bond Fund - HBI-EUR Share Class 0.55%PIMCO Capital Securities Fund - Institutional EUR (Hedged) Accumulation 0.79%PineBridge India Equity Fund - Unit Class R1 0.75%Polar Capital Global Insurance Fund - Class I US Dollar Accumulation Shares 0.75%RWC Global Convertibles Fund - Class B EUR 0.80%Vulcan Value Equity Fund - USD II Accumulating Class Shares 0.75%Wellington Strategic European Equity Fund - EUR Class S Accumulating Unhedged 0.70%
Private Bank Funds I - Dynamic Multi-Asset Fund (USD)AQR Managed Futures UCITS Fund - Class A USD 0.60%Ashmore Emerging Markets Short Duration Fund - Z2 USD Cap 0.75%BlackRock Asian Dragon Fund - Class I4RF USD 0.75%BlackRock Institutional US Dollar Ultra Short Bond Fund - Class Premier Accumulating USD 0.10%BNP PARIBAS US MORTGAGE Fund - Class “I Capitalisation” 0.30%BOUSSARD & GAVAUDAN ABSOLUTE RETURN Fund - Z-CLASS USD 1.00%Edgewood US Select Growth Fund - Class A USD R 0.90%First State Global Listed Infrastructure Fund - Class VI (Distributing) USD (Share Class) 0.75%GAM Star Global Rates Fund - Class Ordinary USD Accumulation 0.00%GAM Star Keynes Quantitative Strategies Fund - Class W USD Accumulation 0.20%Henderson UNITED KINGDOM ABSOLUTE RETURN FUND - Class G$ Acc (hedged) 0.75%Magna New Frontiers Fund - G Class Shares (USD) 1.00%Man GLG Global Emerging Markets Debt Total Return Fund - Class IMF USD Shares 0.50%Man GLG Japan CoreAlpha Equity Fund - Class I JPY Shares 0.75%Man Numeric Market Neutral Alternative Fund - Class INU USD Shares 1.25%Melchior European Enhanced Absolute Return Fund - J2 $ (Hedged) 2.00%Muzinich Enhancedyield Short-Term Fund - Hedged USD Accumulation A Units 0.45%Muzinich ShortDurationHighYield Fund - Hedged USD Accumulation S Units 0.50%Nordea US Total Return Bond Fund - BI-USD Share Class 0.55%PIMCO Capital Securities Fund - Institutional USD Accumulation 0.79%PineBridge India Equity Fund - Unit Class RD 0.75%Polar Capital Global Insurance Fund - Class I US Dollar Accumulation Shares 0.75%Vulcan Value Equity Fund - USD II Accumulating Class Shares 0.75%Wellington Strategic European Equity Fund - EUR Class S Accumulating Unhedged 0.70%
Private Bank Funds I - Montes Excelsis FundAQR Managed Futures UCITS Fund - Class A USD 0.60%Ashmore Emerging Markets Short Duration Fund - Z2 USD Cap 0.75%BlackRock Asian Dragon Fund - Class I4RF USD 0.75%BlackRock Institutional US Dollar Ultra Short Bond Fund - Class Premier Accumulating USD 0.10%BNP PARIBAS US MORTGAGE Fund - Class “I Capitalisation” 0.30%BOUSSARD & GAVAUDAN ABSOLUTE RETURN Fund - Z-CLASS USD 1.00%Edgewood US Select Growth Fund - Class A USD R 0.90%First State Global Listed Infrastructure Fund - Class VI (Distributing) USD (Share Class) 0.75%GAM Star Global Rates Fund - Class Ordinary USD Accumulation 0.00%GAM Star Keynes Quantitative Strategies Fund - Class W USD Accumulation 0.20%Henderson UNITED KINGDOM ABSOLUTE RETURN FUND - Class G$ Acc (hedged) 0.75%Magna New Frontiers Fund - G Class Shares (USD) 1.00%Man GLG Global Emerging Markets Debt Total Return Fund - Class IMF USD Shares 0.50%Man GLG Japan CoreAlpha Equity Fund - Class I JPY Shares 0.75%Man Numeric Market Neutral Alternative Fund - Class INU USD Shares 1.25%Melchior European Enhanced Absolute Return Fund - J2 $ (Hedged) 2.00%Muzinich Enhancedyield Short-Term Fund - Hedged USD Accumulation A Units 0.45%Muzinich ShortDurationHighYield Fund - Hedged USD Accumulation S Units 0.50%Nordea US Total Return Bond Fund - BI-USD Share Class 0.55%PIMCO Capital Securities Fund - Institutional USD Accumulation 0.79%PineBridge India Equity Fund - Unit Class RD 0.75%Polar Capital Global Insurance Fund - Class I US Dollar Accumulation Shares 0.75%Vulcan Value Equity Fund - USD II Accumulating Class Shares 0.75%Wellington Strategic European Equity Fund - EUR Class S Accumulating Unhedged 0.70%
* Data sources from latest publicly available information (e.g. prospectus and electronic data sources like Bloomberg).
53
Private Bank Funds IAppendix - Unaudited Additional Disclosures (continued)
11. Management Fees of Undertakings Managedby Investment Managers which arenot Members of JPMorgan Chase& Co. group (continued)

Language Disclaimer Annual


H747 07/17
JPMorgan Asset Management (Europe) S.à r.l.Postal Address: L-2633 LuxembourgTel No: (352) 34 101 Fax No: (352) 3410 8000E-mail: [email protected]
For further information concerning Private Bank Funds I, please contact the Global Distributor:
GB


