T. ROWE PRICE October 31, 2021 ANNUAL REPORT TRAOX Asia Opportunities Fund PAAOX Asia Opportunities Fund– Advisor Class TRASX Asia Opportunities Fund– I Class For more insights from T. Rowe Price investment professionals, go to troweprice.com.
Transcript
T. ROWE PRICE
October 31, 2021ANNUAL REPORT
TRAOX Asia Opportunities Fund
PAAOX Asia Opportunities Fund– Advisor Class
TRASX Asia Opportunities Fund– I Class
For more insights from T. Rowe Price investment professionals, go to troweprice.com.
araof_1021_P4Proof #
araof_1021_P4Proof #
Log in to your account at troweprice.com for more information.
* Certain mutual fund accounts that are assessed an annual account service fee can also save money by switching to e-delivery.
It’s fast—receive your statements and confirmations faster than U.S. mail.
It’s convenient—access your important account documents whenever you need them.
It’s secure—we protect your online accounts using “True Identity” to confirm new accounts and make verification faster and more secure.
It can save you money—where applicable, T. Rowe Price passes on the cost savings to fund holders.*
TO ENROLL:If you invest directly with T. Rowe Price, go to troweprice.com/paperless.
If you invest through an investment advisor, a bank, or a brokerage firm, please contact that organization and ask if it can provide electronic documentation.
Go PaperlessSign up for e-delivery of your statements, confirmations, and prospectuses or shareholder reports.
T. ROWE PRICE AsIA OPPORTunITIEs Fund
HIGHLIGHTS
n The Asia Opportunities Fund returned 12.66% for the 12 months ended October 31, 2021, slightly underperforming the MSCI All Country Asia ex Japan Index Net.
n Stock selection in consumer staples hampered relative performance in an environment where investors favored economically sensitive sectors. Conversely, our communication services holdings, particularly in companies less exposed to regulatory risks in China, added value.
n We used weakness in China’s market to initiate positions in fundamentally attractive companies or add to our existing positions whose valuations fell to more compelling levels.
n While the focus in the near term has been on the regulatory clampdown in China, we believe we are nearing the end of this regulatory cycle. In our view, the government has no intention of derailing the future growth of various sectors but is seeking to reduce wealth inequality and ensure social stability.
araof_1021_P4Proof #
1
T. ROWE PRICE AsIA OPPORTunITIEs Fund
CIO Market Commentary
Global stock markets produced strong returns during your fund’s fiscal year, the 12-month period ended October 31, 2021. The rollout of coronavirus vaccines helped drive extraordinary gains in the first half of the reporting period, and while the equity rally slowed in recent months, some benchmarks continued to grind out new record highs as the period came to an end.
In the U.S., the S&P 500 Index was up 43% (including dividends) for the 12-month period, and most developed market benchmarks advanced more than 30%. Emerging markets produced solid results for the full year but faced increased volatility in the second half of the period. According to MSCI, value stocks narrowly outperformed their growth counterparts over the 12 months. At the sector level, energy stocks delivered very strong returns as oil prices reached multiyear highs, and banks also performed well, supported by higher longer-term interest rates and improved lending margins.
Fixed income markets faced headwinds as Treasury yields rose rapidly in the first quarter of 2021 from the historically low levels seen last year, although high yield bonds performed well. Meanwhile, the U.S. dollar was mixed against foreign currencies over the full year.
Strong corporate earnings growth supported stocks and corporate bonds throughout the period, but investors faced new worries as the period progressed. The spread of the delta variant of the coronavirus dashed hopes that vaccines would bring about a quick end to the pandemic, and economic growth, while still positive, began to slow. U.S. gross domestic product decelerated from a 6.7% annual pace in the second quarter to 2.0% in the third quarter (according to the initial estimate) amid weaker consumer spending. Some Purchasing Managers’ Indexes showed evidence of slowing economic activity globally.
Investors also worried about how developments in China would impact the global economy. The Chinese government announced more stringent business regulations during the period, particularly on the technology sector, and the precarious debt load of a large property developer added to market concerns.
Meanwhile, inflation surged as the release of pent-up demand and supply chain disruptions contributed to higher prices around the globe. Inflation measures in the U.S., UK, and eurozone all reached their highest levels in more than a decade and far exceeded central bank targets, although most policymakers argued that elevated inflation was a transitory phenomenon caused by the reopening of economies.
araof_1021_P4Proof #
2
T. ROWE PRICE AsIA OPPORTunITIEs Fund
The fiscal and monetary stimulus that global governments and central banks enacted in response to the pandemic continued to be supportive for markets but appears to have peaked. Just after our reporting period ended, the Federal Reserve announced it would begin trimming its purchases of Treasury bonds and mortgage-backed securities in November and would likely wrap up its asset purchases by next summer. The Fed’s latest projections indicated that a rate hike isn’t likely until the second half of next year at the earliest, but other central banks have begun telegraphing that rate hikes could come soon.
How markets respond to the normalization of monetary policy is an open question. While fading stimulus might pose some challenges for investors, I believe it could contribute to a return of price sensitivity in global markets, which bodes well for selective investors focused on fundamentals.
While I do not expect robust overall equity returns in the near term given the market’s elevated valuations, I am mindful that investors have not yet enjoyed all the potential fruits of the recovery. Many companies have yet to see business return to pre-pandemic levels, and identifying which ones are either regaining their footing or disrupting markets through innovation will be key. I’m confident our portfolio managers and global research organization will serve our investors well in this environment.
Thank you for your continued confidence in T. Rowe Price.
Sincerely,
Robert SharpsGroup Chief Investment Officer
araof_1021_P4Proof #
3
T. ROWE PRICE AsIA OPPORTunITIEs Fund
Management’s discussion of Fund Performance
INVESTMENT OBJECTIVE
The fund seeks long-term growth of capital.
FUND COMMENTARY
How did the fund perform in the past 12 months?
The Asia Opportunities Fund returned 12.66% in the 12 months ended October 31, 2021, slightly underperforming the MSCI All Country Asia ex Japan Index Net, which returned 12.82%. (Returns for the Advisor and
I Class shares will vary due to their different fees. Past performance cannot guarantee future results.)
What factors influenced the fund’s performance?
Stock selection in consumer staples detracted significantly from relative performance in an environment where investors favored economically sensitive sectors, such as materials
and energy. Philippine Seven, the operator of 7-Eleven convenience stores in the archipelago, declined on concerns about the impact of a prolonged lockdown on sales. The Philippines has one of Southeast Asia’s longest-running lockdowns, and restrictions in metropolitan Manila only started to ease in October. (Please refer to the portfolio of investments for a complete list of holdings and the amount each represents in the portfolio.)
An overweight allocation to consumer discretionary, the worst-performing sector largely due to China’s regulatory crackdown on e-commerce and education companies, hurt relative returns and outweighed favorable stock selection. Our lack of exposure to energy, which outperformed the benchmark as oil prices surged to multiyear highs, further weighed on relative performance.
Communication services stocks contributed the most to the fund’s relative returns. China’s regulatory crackdown on the internet industry hurt certain segments of the communication services sector. However, we benefited from owning Singapore-based Sea, a Southeast Asian platform company that did well amid the pandemic-induced acceleration of e-commerce, online gaming,
Total ReturnPeriods Ended 10/31/21 6 Months 12 Months
Asia Opportunities Fund -7.65% 12.66%
Asia Opportunities Fund–Advisor Class -7.69 12.56
Asia Opportunities Fund– I Class -7.47 13.05
MsCI All Country Asia ex Japan Index net -7.09 12.82
PERFORMANCE COMPARISON
araof_1021_P4Proof #
4
T. ROWE PRICE AsIA OPPORTunITIEs Fund
and digital payments in emerging markets. In addition to being less exposed to regulatory risk, Sea’s e-commerce business Shopee gained market share and its digital entertainment business experienced strong revenue growth fueled by the mobile game “Free Fire.”
Real estate holdings such as China Overseas Property Holdings, one of the country’s top property management companies, lifted relative returns. Concerns about a default for cash-strapped developer China Evergrande, policy tightening, and a slowing property market in China weighed on the sector. However, China Overseas Property Holdings shares rose after the company issued a bullish five-year forecast and investors deemed it less vulnerable to policy risks than developers.
The information technology sector contributed to relative performance, helped by strength in the semiconductor-related holdings. ASML Holding, which sells semiconductor manufacturing equipment to chipmakers in Asia, was a top contributor as it benefited from the global chip shortage. ASML is the sole supplier of the extreme ultraviolet lithography, a technology that chipmakers use to print the most advanced computer circuits.
How is the fund positioned?
The fund seeks to invest in quality, cash-generative companies in Asia that are run by experienced management teams and that can reliably compound earnings across the economic cycle. We have positioned the fund to take advantage of the post-pandemic recovery. Our country and sector allocations are driven by bottom-up stock selection based on our fundamental research into individual companies produced by our Asia-based equity analysts.
China remains our biggest country position. We leaned into the market’s weakness during the period and added to our core position in Tencent Holdings after its valuation fell to more attractive levels. Concerns over heightened regulations and a shift in investor sentiment from pandemic winners toward more cyclical companies weighed on China’s e-commerce sector. We took advantage of this weakness to invest in e-commerce platforms Meituan, JD.com, and Pinduoduo.
In South Korea, we purchased shares in Coupang, the country’s largest e-commerce site. We like its management, which has built a strong moat that allowed Coupang to disrupt offline commerce. We sold shares in memory chipmakers Samsung Electronics and SK Hynix as we believe that global
araof_1021_P4Proof #
5
T. ROWE PRICE AsIA OPPORTunITIEs Fund
chip prices are near peak levels as consumer electronics demand eases with the receding pandemic. We also eliminated POSCO, the country’s largest steelmaker, from our portfolio as our investment thesis came to fruition and we saw limited potential upside with steel prices peaking.
From a sector perspective, the largest shifts occurred in real estate and in communication services, where we increased our allocations. We invested in China Overseas Land & Investment (COLI), one of the country’s biggest residential developers, which we think will continue to take market share even after the government recently imposed tighter financing rules on the property sector. COLI has one of the strongest balance sheets in the sector and has not crossed any of the so-called red lines, a series of government imposed-financial thresholds for property companies aimed at curbing excessive leverage.
Within communication services, we bought shares in South Korean mobile network operator LG Uplus, which we believe has the potential to take market share as competition heats up. We expect its free cash flow will improve as it moves past the peak of its capital expenditure cycle.
Our positioning reflects our view that domestic consumption in Asia will continue to grow strongly over the long term and offer many secular growth opportunities. Consumer discretionary was the biggest sector allocation at period-end, but our exposure declined after selling Macau casino operator Galaxy Entertainment amid uncertainties during its concession renewal process. Macau gaming revenue has suffered following tougher travel restrictions imposed by China, the city’s biggest source of tourists, as well as concerns of tighter government oversight of the industry.
Percent of net Assets
10/31/21
Consumer discretionary 23.6%
Information Technology 18.6
Financials 17.5
Communication services 13.2
Consumer staples 7.9
Real Estate 7.9
Industrials and Business services 7.1
Health Care 1.2
utilities 0.7
Materials 0.6
Energy 0.0
Other and Reserves 1.7
Total 100.0%
Historical weightings reflect current industry/sector classifications.
SECTOR DIVERSIFICATION
araof_1021_P4Proof #
6
T. ROWE PRICE AsIA OPPORTunITIEs Fund
What is portfolio management’s outlook?
We remain constructive on the medium- to long-term outlook for Asia ex-Japan equities. We believe that most Asian economies are on a steady path to more normalized economic activity with manageable fiscal and current account balances compared with the rest of the world. In terms of valuations, while there are pockets of excessive optimism in some sectors, we believe that the valuations of quality growth businesses in Asia ex-Japan remain in line with historical levels.
We believe that domestic demand in Asia ex-Japan is holding up relatively well despite the uneven recovery of its economies. While China’s regulatory clampdown has lately dominated headlines, we believe that we are nearing the end of the current regulatory cycle. We think the government has no intention to derail the future growth of various sectors but seeks to create a more level playing field and ensure long-term social stability. Amid the risk, we continue to focus on the long-term fundamentals of individual companies and identify names that in our view are well positioned to withstand increased government scrutiny or that may benefit from the opportunities created by the policy changes. In our view, China’s drive for “common prosperity” does not translate to less focus on long-term growth as it entails expanding the proportion of middle-income groups and raising incomes of low-wage workers, among other measures. As a result, this campaign will likely be positive for domestic consumption and may benefit certain sectors.
Apart from the regulatory shifts in China, we are cognizant of other key risks for the region, including the possibility of a new coronavirus variant and elevated tensions between the U.S. and China.
We are confident that, with the support of our experienced Asia-based equity analysts and global fundamental research platform, we can continue to identify fundamentally strong companies with strong balance sheets and solid management teams who care about shareholder returns.
The views expressed reflect the opinions of T. Rowe Price as of the date of this report and are subject to change based on changes in market, economic, or other conditions. These views are not intended to be a forecast of future events and are no guarantee of future results.
araof_1021_P4Proof #
7
T. ROWE PRICE AsIA OPPORTunITIEs Fund
PRINCIPAL RISKS
International investing. Investing in the securities of non-U.S. issuers involves special risks not typically associated with investing in U.S. issuers. Non-U.S. securities tend to be more volatile and have lower overall liquidity than investments in U.S. securities and may lose value because of adverse local, political, social, or economic developments overseas, or due to changes in the exchange rates between foreign currencies and the U.S. dollar. In addition, investments outside the U.S. are subject to settlement practices and regulatory and financial reporting standards that differ from those of the U.S. The risks of investing outside the U.S. are heightened for any investments in emerging markets, which are susceptible to greater volatility than investments in developed markets.
Investing in Asia. Many Asian economies have at various times been negatively affected by inflation, currency devaluations, an over-reliance on international trade and exports, political and social instability, and less developed financial systems and securities trading markets. Trade restrictions, unexpected decreases in exports, changes in government policies, or natural disasters could have a significant impact on companies doing business in Asia. The Asian region may be significantly affected by political unrest, military conflict, economic sanctions, and less demand for Asian products and services.
Emerging markets. Investments in emerging market countries are subject to greater risk and overall volatility than investments in the U.S. and developed markets. Emerging market countries tend to have economic structures that are less diverse and mature, and political systems that are less stable, than those of developed countries. In addition to the risks associated with investing outside the U.S., emerging markets are more susceptible to governmental interference, political and economic uncertainty, local taxes and restrictions on the fund’s investments, less efficient trading markets with lower overall liquidity, and more volatile currency exchange rates.
BENCHMARK INFORMATION
Note: MSCI makes no express or implied warranties or representations and shall have no liability whatsoever with respect to any MSCI data contained herein. The MSCI data may not be further redistributed or used as a basis for other indices or any securities or financial products. This report is not approved, reviewed, or produced by MSCI.
araof_1021_P4Proof #
8
T. ROWE PRICE AsIA OPPORTunITIEs Fund
TWENTY-FIVE LARGEST ISSUERS
Percent ofnet Assets
10/31/21
Taiwan semiconductor Manufacturing, Taiwan 10.0 %Tencent Holdings, China 6.5 Zhongsheng Group Holdings, China 3.8 Alibaba Group Holding, China 3.7 samsung Electronics, south Korea 3.3
Yum China Holdings, China 3.2 AIA Group, Hong Kong 3.1 Jollibee Foods, Philippines 3.1 Hysan development, Hong Kong 3.0 Kotak Mahindra Bank, India 2.6
Chailease Holding, Taiwan 2.6 China Overseas Land & Investment, China 2.5 Meituan, China 2.2 LG uplus, south Korea 2.1 Hongfa Technology, China 2.0
songcheng Performance development, China 1.9 dairy Farm International Holdings, Hong Kong 1.9 Housing development Finance, India 1.9 AsML Holding, netherlands 1.8 Gree Electric Appliances Inc. of Zhuhai, China 1.8
sea, singapore 1.8 ComfortdelGro, singapore 1.7 China Overseas Property Holdings, China 1.7 Ping An Insurance, China 1.6 HKT Trust & HKT Limited, Hong Kong 1.4
Total 71.2 %
Note: The information shown does not reflect any exchange-traded funds (ETFs), cash reserves, or collateral for securities lending that may be held in the portfolio.
PORTFOLIO HIGHLIGHTS
araof_1021_P4Proof #
9
T. ROWE PRICE AsIA OPPORTunITIEs Fund
This chart shows the value of a hypothetical $10,000 investment in the fund over the past 10 fiscal year periods or since inception (for funds lacking 10-year records). The result is compared with benchmarks, which include a broad-based market index and may also include a peer group average or index. Market indexes do not include expenses, which are deducted from fund returns as well as mutual fund averages and indexes.
GROWTH OF $10,000
As of 10/31/21
$21,558
17,034
Asia Opportunities Fund
MSCI All Country Asia ex Japan Index Net
10/2110/2010/1910/1810/1710/1610/1510/145/21/14
10,000
13,500
17,000
20,500
24,000
$27,500
Note: Performance for the Advisor and I Class shares will vary due to their differing fee structures. See the Average Annual Compound Total Return table.
AVERAGE ANNUAL COMPOUND TOTAL RETURN
Periods Ended 10/31/21 One Year Five Yearssince
InceptionInception
date
Asia Opportunities Fund 12.66% 13.49% 10.87% 5/21/14
Asia Opportunities Fund–Advisor Class 12.56 13.34 10.71 5/21/14
Asia Opportunities Fund–I Class 13.05 – 14.34 3/6/17
This table shows how the fund would have performed each year if its actual (or cumulative) returns for the periods shown had been earned at a constant rate. Returns do not reflect taxes that the shareholder may pay on fund distributions or the redemption of fund shares. Past performance cannot guarantee future results.
ASIA OPPORTUNITIES FUND
araof_1021_P4Proof #
10
T. ROWE PRICE AsIA OPPORTunITIEs Fund
EXPENSE RATIO
Asia Opportunities Fund 1.21%
Asia Opportunities Fund–Advisor Class 1.51
Asia Opportunities Fund–I Class 1.00
The expense ratio shown is as of the fund’s most recent prospectus. This number may vary from the expense ratio shown elsewhere in this report because it is based on a different time period and, if applicable, includes acquired fund fees and expenses but does not include fee or expense waivers.
FUND EXPENSE EXAMPLE
As a mutual fund shareholder, you may incur two types of costs: (1) transaction costs, such as redemption fees or sales loads, and (2) ongoing costs, including management fees, distribution and service (12b-1) fees, and other fund expenses. The following example is intended to help you understand your ongoing costs (in dollars) of investing in the fund and to compare these costs with the ongoing costs of investing in other mutual funds. The example is based on an investment of $1,000 invested at the beginning of the most recent six-month period and held for the entire period.
Please note that the fund has three share classes: The original share class (Investor Class) charges no distribution and service (12b-1) fee, the Advisor Class shares are offered only through unaffiliated brokers and other financial intermediaries and charge a 0.25% 12b-1 fee, and I Class shares are available to institutionally oriented clients and impose no 12b-1 or administrative fee payment. Each share class is presented separately in the table.
Actual ExpensesThe first line of the following table (Actual) provides information about actual account values and expenses based on the fund’s actual returns. You may use the information on this line, together with your account balance, to estimate the expenses that you paid over the period. Simply divide your account value by $1,000 (for example, an $8,600 account value divided by $1,000 = 8.6), then multiply the result by the number on the first line under the heading “Expenses Paid During Period” to estimate the expenses you paid on your account during this period.
Hypothetical Example for Comparison PurposesThe information on the second line of the table (Hypothetical) is based on hypothetical account values and expenses derived from the fund’s actual expense ratio and an assumed 5% per year rate of return before expenses (not the fund’s actual return). You may compare the ongoing costs of investing in the fund with other funds by contrasting this 5% hypothetical example and the 5% hypothetical examples that appear in the shareholder reports of the other funds. The hypothetical account values and expenses may not be used to estimate the actual ending account balance or expenses you paid for the period.
araof_1021_P4Proof #
11
T. ROWE PRICE AsIA OPPORTunITIEs Fund
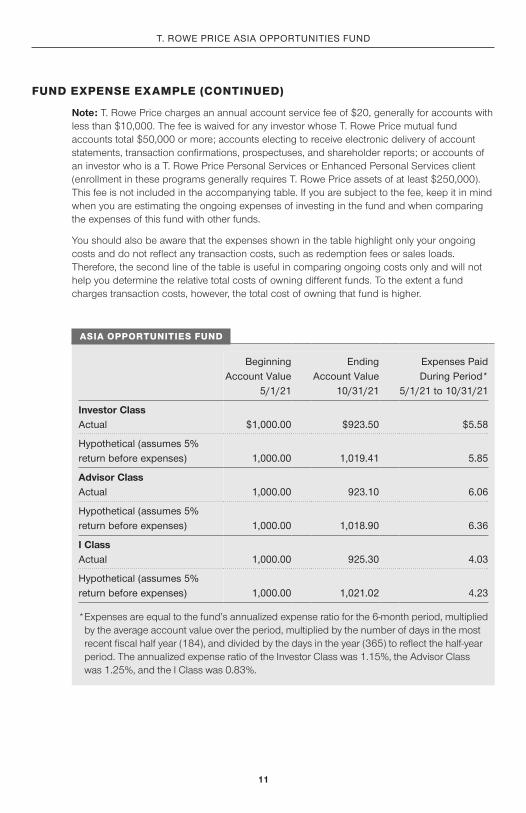
FUND EXPENSE EXAMPLE (CONTINUED)
Note: T. Rowe Price charges an annual account service fee of $20, generally for accounts with less than $10,000. The fee is waived for any investor whose T. Rowe Price mutual fund accounts total $50,000 or more; accounts electing to receive electronic delivery of account statements, transaction confirmations, prospectuses, and shareholder reports; or accounts of an investor who is a T. Rowe Price Personal Services or Enhanced Personal Services client (enrollment in these programs generally requires T. Rowe Price assets of at least $250,000). This fee is not included in the accompanying table. If you are subject to the fee, keep it in mind when you are estimating the ongoing expenses of investing in the fund and when comparing the expenses of this fund with other funds.
You should also be aware that the expenses shown in the table highlight only your ongoing costs and do not reflect any transaction costs, such as redemption fees or sales loads. Therefore, the second line of the table is useful in comparing ongoing costs only and will not help you determine the relative total costs of owning different funds. To the extent a fund charges transaction costs, however, the total cost of owning that fund is higher.
Beginning Account Value
5/1/21
Ending Account Value
10/31/21
Expenses Paid during Period*
5/1/21 to 10/31/21
Investor ClassActual $1,000.00 $923.50 $5.58
Hypothetical (assumes 5% return before expenses) 1,000.00 1,019.41 5.85
Advisor ClassActual 1,000.00 923.10 6.06
Hypothetical (assumes 5% return before expenses) 1,000.00 1,018.90 6.36
I ClassActual 1,000.00 925.30 4.03
Hypothetical (assumes 5% return before expenses) 1,000.00 1,021.02 4.23
* Expenses are equal to the fund’s annualized expense ratio for the 6-month period, multiplied by the average account value over the period, multiplied by the number of days in the most recent fiscal half year (184), and divided by the days in the year (365) to reflect the half-year period. The annualized expense ratio of the Investor Class was 1.15%, the Advisor Class was 1.25%, and the I Class was 0.83%.
ASIA OPPORTUNITIES FUND
araof_1021_P4Proof #
12
T. ROWE PRICE AsIA OPPORTunITIEs Fund
QUARTER-END RETURNS
Periods Ended 9/30/21 One Year Five Yearssince
InceptionInception
date
Asia Opportunities Fund 12.65% 12.14% 10.48% 5/21/14
Asia Opportunities Fund–Advisor Class 12.49 11.99 10.33 5/21/14
Asia Opportunities Fund–I Class 12.99 – 13.75 3/6/17
The fund’s performance information represents only past performance and is not necessarily an indication of future results. Current performance may be lower or higher than the perfor-mance data cited. Share price, principal value, and return will vary, and you may have a gain or loss when you sell your shares. For the most recent month-end performance, please visit our website (troweprice.com) or contact a T. Rowe Price representative at 1-800-225-5132 or, for Advisor and I Class shares, 1-800-638-8790.
This table provides returns through the most recent calendar quarter-end rather than through the end of the fund’s fiscal period. It shows how the fund would have performed each year if its actual (or cumulative) returns for the periods shown had been earned at a constant rate. Average annual total return figures include changes in principal value, reinvested dividends, and capital gain distributions. Returns do not reflect taxes that the shareholder may pay on fund distributions or the redemption of fund shares. When assessing performance, investors should consider both short- and long-term returns.
araof_1021_P4Proof #
13
T. ROWE PRICE AsIA OPPORTunITIEs Fund
FINANCIAL HIGHLIGHTS
For a share outstanding throughout each period
Investor Class
Year Ended 10/31/21 10/31/20 10/31/19 10/31/18 10/31/17
NET ASSET VALUE Beginning of period $ 18.16 $ 15.33 $ 12.57 $ 14.52 $ 11.27
Investment activities Net investment income (1)(2) 0.09 0.04 0.10 0.09 0.05 Net realized and unrealized gain/loss 2.21 2.89 2.75 (2.02 ) 3.41 Total from investment activities 2.30 2.93 2.85 (1.93 ) 3.46
Distributions Net investment income (0.02 ) (0.10 ) (0.09 ) (0.02 ) (0.14 ) Net realized gain (0.27 ) — — (0.02 ) (0.08 ) Total distributions (0.29 ) (0.10 ) (0.09 ) (0.04 ) (0.22 )
Redemption fees added to paid-in capital (1)(3) — — — (4) 0.02 0.01
NET ASSET VALUE End of period $ 20.17 $ 18.16 $ 15.33 $ 12.57 $ 14.52
araof_1021_P4Proof #
14
The accompanying notes are an integral part of these financial statements.
T. ROWE PRICE AsIA OPPORTunITIEs Fund
FINANCIAL HIGHLIGHTS
For a share outstanding throughout each period
Investor Class
Year Ended 10/31/21 10/31/20 10/31/19 10/31/18 10/31/17
Ratios to average net assets: (2) Gross expenses before waivers/payments by Price Associates 1.15 % 1.21 % 1.30 % 1.32 % 1.72 % Net expenses after waivers/payments by Price Associates 1.15 % 1.15 % 1.15 % 1.15 % 1.16 % Net investment income 0.42 % 0.28 % 0.68 % 0.58 % 0.43 %
Portfolio turnover rate 31.5 % 92.6 % 73.0 % 78.7 % 52.0 % Net assets, end of period (in thousands) $150,929 $120,942 $92,167 $71,497 $75,186
(1) Per share amounts calculated using average shares outstanding method. (2) See Note 6 for details of expense-related arrangements with Price Associates. (3) The fund charged redemption fees through March 31, 2019. (4) Amounts round to less than $0.01 per share. (5) Total return refl ects the rate that an investor would have earned on an investment in the fund
during each period, assuming reinvestment of all distributions, and payment of no redemption or account fees, if applicable.
araof_1021_P4Proof #
15
T. ROWE PRICE AsIA OPPORTunITIEs Fund
FINANCIAL HIGHLIGHTS
For a share outstanding throughout each period
Advisor Class
Year Ended 10/31/21 10/31/20 10/31/19 10/31/18 10/31/17
NET ASSET VALUE Beginning of period $ 18.06 $ 15.26 $ 12.51 $ 14.47 $ 11.25
Investment activities Net investment income (1)(2) 0.06 0.04 0.06 0.07 0.04 Net realized and unrealized gain/loss 2.21 2.86 2.77 (2.02 ) 3.40 Total from investment activities 2.27 2.90 2.83 (1.95 ) 3.44
Distributions Net investment income — (0.10 ) (0.08 ) — (0.14 ) Net realized gain (0.27 ) — — (0.02 ) (0.08 ) Total distributions (0.27 ) (0.10 ) (0.08 ) (0.02 ) (0.22 )
Redemption fees added to paid-in capital (1)(3) — — — (4) 0.01 — (4)
NET ASSET VALUE End of period $ 20.06 $ 18.06 $ 15.26 $ 12.51 $ 14.47
araof_1021_P4Proof #
16
The accompanying notes are an integral part of these financial statements.
T. ROWE PRICE AsIA OPPORTunITIEs Fund
FINANCIAL HIGHLIGHTS
For a share outstanding throughout each period
Advisor Class
Year Ended 10/31/21 10/31/20 10/31/19 10/31/18 10/31/17
Ratios to average net assets: (2) Gross expenses before waivers/payments by Price Associates 1.50 % 1.51 % 1.64 % 1.61 % 2.22 % Net expenses after waivers/payments by Price Associates 1.25 % 1.25 % 1.25 % 1.25 % 1.26 % Net investment income 0.27 % 0.28 % 0.44 % 0.48 % 0.34 %
Portfolio turnover rate 31.5 % 92.6 % 73.0 % 78.7 % 52.0 % Net assets, end of period (in thousands) $390 $436 $484 $491 $470
(1) Per share amounts calculated using average shares outstanding method. (2) See Note 6 for details of expense-related arrangements with Price Associates. (3) The fund charged redemption fees through March 31, 2019. (4) Amounts round to less than $0.01 per share. (5) Total return refl ects the rate that an investor would have earned on an investment in the fund
during each period, assuming reinvestment of all distributions, and payment of no redemption or account fees, if applicable.
araof_1021_P4Proof #
17
T. ROWE PRICE AsIA OPPORTunITIEs Fund
FINANCIAL HIGHLIGHTS
For a share outstanding throughout each period
I Class
Year Ended
3/6/17 (1) Through 10/31/17 10/31/21 10/31/20 10/31/19 10/31/18
NET ASSET VALUE Beginning of period $ 18.24 $ 15.36 $ 12.60 $ 14.54 $ 11.28
Investment activities Net investment income (2)(3) 0.17 0.10 0.15 0.18 0.05 Net realized and unrealized gain/loss 2.21 2.89 2.75 (2.07 ) 3.21 Total from investment activities 2.38 2.99 2.90 (1.89 ) 3.26
Distributions Net investment income (0.04 ) (0.11 ) (0.14 ) (0.03 ) — Net realized gain (0.27 ) — — (0.02 ) — Total distributions (0.31 ) (0.11 ) (0.14 ) (0.05 ) —
NET ASSET VALUE End of period $ 20.31 $ 18.24 $ 15.36 $ 12.60 $ 14.54
araof_1021_P4Proof #
18
The accompanying notes are an integral part of these financial statements.
T. ROWE PRICE AsIA OPPORTunITIEs Fund
FINANCIAL HIGHLIGHTS
For a share outstanding throughout each period
I Class
Year Ended
3/6/17 (1) Through 10/31/17 10/31/21 10/31/20 10/31/19 10/31/18
Ratios to average net assets: (3) Gross expenses before waivers/payments by Price Associates 0.92 % 1.00 % 1.07 % 1.10 % 1.35 % (5) Net expenses after waivers/payments by Price Associates 0.83 % 0.84 % 0.84 % 0.84 % 0.85 % (5) Net investment income 0.80 % 0.62 % 1.02 % 1.27 % 0.65 % (5)
Portfolio turnover rate 31.5 % 92.6 % 73.0 % 78.7 % 52.0 % Net assets, end of period (in thousands) $95,533 $56,039 $36,723 $18,385 $4,451
(1) Inception date (2) Per share amounts calculated using average shares outstanding method. (3) See Note 6 for details of expense-related arrangements with Price Associates. (4) Total return refl ects the rate that an investor would have earned on an investment in the fund
during each period, assuming reinvestment of all distributions, and payment of no redemption or account fees, if applicable. Total return is not annualized for periods less than one year.
(5) Annualized
araof_1021_P4Proof #
19
T. ROWE PRICE AsIA OPPORTunITIEs Fund
October 31, 2021
PORTFOLIO OF INVESTMENTS‡ Shares
$ Value
( Cost and value in $000s) ‡
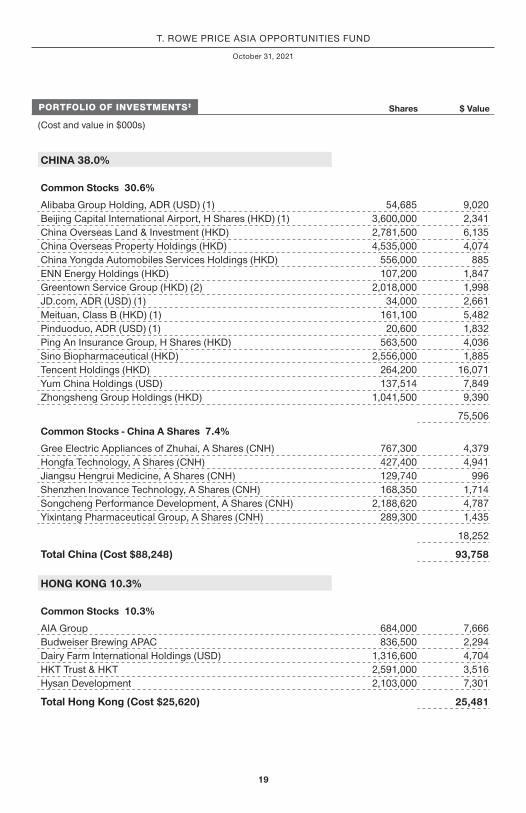
CHINA 38.0%
Common Stocks 30.6%
Alibaba Group Holding, ADR (USD) (1) 54,685 9,020 Beijing Capital International Airport, H Shares (HKD) (1) 3,600,000 2,341 China Overseas Land & Investment (HKD) 2,781,500 6,135 China Overseas Property Holdings (HKD) 4,535,000 4,074 China Yongda Automobiles Services Holdings (HKD) 556,000 885 ENN Energy Holdings (HKD) 107,200 1,847 Greentown Service Group (HKD) (2) 2,018,000 1,998 JD.com, ADR (USD) (1) 34,000 2,661 Meituan, Class B (HKD) (1) 161,100 5,482 Pinduoduo, ADR (USD) (1) 20,600 1,832 Ping An Insurance Group, H Shares (HKD) 563,500 4,036 Sino Biopharmaceutical (HKD) 2,556,000 1,885 Tencent Holdings (HKD) 264,200 16,071 Yum China Holdings (USD) 137,514 7,849 Zhongsheng Group Holdings (HKD) 1,041,500 9,390
75,506 Common Stocks - China A Shares 7.4%
Gree Electric Appliances of Zhuhai, A Shares (CNH) 767,300 4,379 Hongfa Technology, A Shares (CNH) 427,400 4,941 Jiangsu Hengrui Medicine, A Shares (CNH) 129,740 996 Shenzhen Inovance Technology, A Shares (CNH) 168,350 1,714 Songcheng Performance Development, A Shares (CNH) 2,188,620 4,787 Yixintang Pharmaceutical Group, A Shares (CNH) 289,300 1,435
18,252
Total China (Cost $88,248 ) 93,758
HONG KONG 10.3%
Common Stocks 10.3%
AIA Group 684,000 7,666 Budweiser Brewing APAC 836,500 2,294 Dairy Farm International Holdings (USD) 1,316,600 4,704 HKT Trust & HKT 2,591,000 3,516 Hysan Development 2,103,000 7,301
Total Hong Kong (Cost $25,620 ) 25,481
araof_1021_P4Proof #
20
T. ROWE PRICE AsIA OPPORTunITIEs Fund
Shares
$ Value
( Cost and value in $000s)
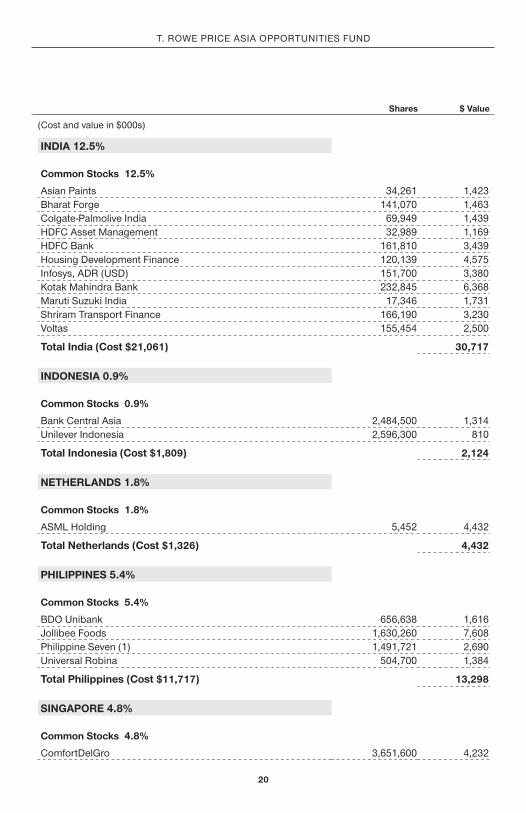
INDIA 12.5%
Common Stocks 12.5%
Asian Paints 34,261 1,423 Bharat Forge 141,070 1,463 Colgate-Palmolive India 69,949 1,439 HDFC Asset Management 32,989 1,169 HDFC Bank 161,810 3,439 Housing Development Finance 120,139 4,575 Infosys, ADR (USD) 151,700 3,380 Kotak Mahindra Bank 232,845 6,368 Maruti Suzuki India 17,346 1,731 Shriram Transport Finance 166,190 3,230 Voltas 155,454 2,500
Total India (Cost $21,061 ) 30,717
INDONESIA 0.9%
Common Stocks 0.9%
Bank Central Asia 2,484,500 1,314 Unilever Indonesia 2,596,300 810
T. Rowe Price Government Reserve Fund, 0.06% (3)(4) 3,788,886 3,789
Total Short-Term Investments (Cost $3,789) 3,789
araof_1021_P4Proof #
22
T. ROWE PRICE AsIA OPPORTunITIEs Fund
Shares
$ Value
( Cost and value in $000s)
SECURITIES LENDING COLLATERAL 0.0%
INVESTMENTS IN A POOLED ACCOUNT THROUGH SECURITIES LENDING PROGRAM WITH JPMORGAN CHASE BANK 0.0%
Short-Term Funds 0.0%
T. Rowe Price Short-Term Fund, 0.07% (3)(4) 71 1
Total Investments in a Pooled Account through Securities Lending Program with JPMorgan Chase Bank 1
Total Securities Lending Collateral (Cost $1) 1
Total Investments in Securities
99.8% of Net Assets (Cost $203,154) $ 246,382
‡ Country classifi cations are generally based on MSCI categories or another unaffi liated third party data provider; Shares are denominated in the currency of the country presented unless otherwise noted.
(1) Non-income producing (2) See Note 3 . All or a portion of this security is on loan at October 31, 2021. (3) Seven-day yield (4) Affi liated Companies
ADR American Depositary Receipts CNH Off shore China Renminbi HKD Hong Kong Dollar USD U.S. Dollar
araof_1021_P4Proof #
23
T. ROWE PRICE AsIA OPPORTunITIEs Fund
The accompanying notes are an integral part of these financial statements.
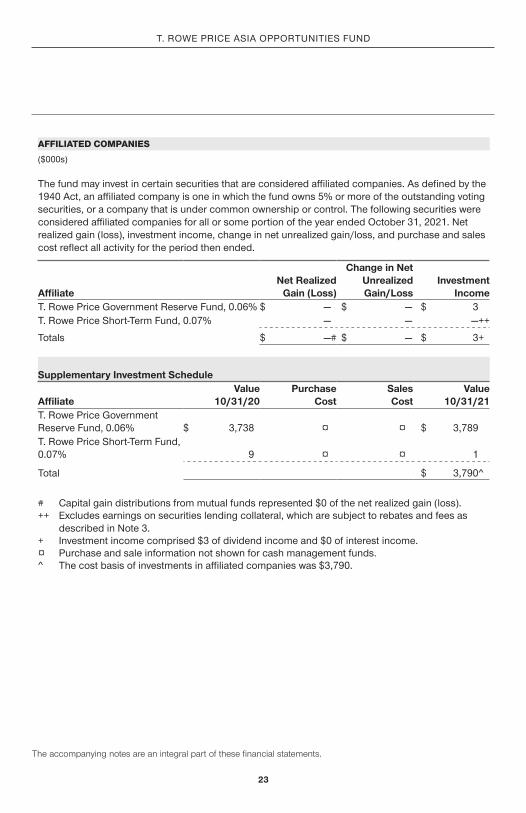
AFFILIATED COMPANIES ($000s) The fund may invest in certain securities that are considered affi liated companies. As defi ned by the 1940 Act, an affi liated company is one in which the fund owns 5% or more of the outstanding voting securities, or a company that is under common ownership or control. The following securities were considered affi liated companies for all or some portion of the year ended October 31, 2021. Net realized gain (loss), investment income, change in net unrealized gain/loss, and purchase and sales cost refl ect all activity for the period then ended.
Affi liate Net Realized
Gain (Loss)
Change in Net Unrealized Gain/Loss
Investment Income
T. Rowe Price Government Reserve Fund, 0.06% $ — $ — $ 3 T. Rowe Price Short-Term Fund, 0.07% — — — ++
Totals $ — # $ — $ 3 +
Supplementary Investment Schedule
Affi liate Value
10/31/20 Purchase
Cost Sales Cost
Value 10/31/21
T. Rowe Price Government Reserve Fund, 0.06% $ 3,738 ¤ ¤ $ 3,789 T. Rowe Price Short-Term Fund, 0.07% 9 ¤ ¤ 1
Total $ 3,790 ̂
# Capital gain distributions from mutual funds represented $0 of the net realized gain (loss). ++ Excludes earnings on securities lending collateral, which are subject to rebates and fees as
described in Note 3 . + Investment income comprised $3 of dividend income and $0 of interest income. ¤ Purchase and sale information not shown for cash management funds. ̂ The cost basis of investments in affi liated companies was $3,790.
araof_1021_P4Proof #
24
T. ROWE PRICE AsIA OPPORTunITIEs Fund
October 31, 2021
STATEMENT OF ASSETS AND LIABILITIES
($000s, except shares and per share amounts)
Assets Investments in securities, at value (cost $203,154) $ 246,382 Receivable for investment securities sold 1,365 Receivable for shares sold 114 Foreign currency (cost $69) 69 Dividends receivable 60 Other assets 28 Total assets 248,018
Liabilities Payable for shares redeemed 222 Investment management fees payable 163 Due to affi liates 20 Obligation to return securities lending collateral 1 Other liabilities 760 Total liabilities 1,166
NET ASSETS $ 246,852
araof_1021_P4Proof #
25
T. ROWE PRICE AsIA OPPORTunITIEs Fund
October 31, 2021
The accompanying notes are an integral part of these financial statements.
STATEMENT OF ASSETS AND LIABILITIES
($000s, except shares and per share amounts)
Net Assets Consist of: Total distributable earnings (loss) $ 56,408 Paid-in capital applicable to 12,206,235 shares of $0.01 par value capital stock outstanding; 18,000,000,000 shares of the Corporation authorized 190,444
NET ASSETS $ 246,852
NET ASSET VALUE PER SHARE
Investor Class ($150,929,363 / 7,481,900 shares outstanding) $ 20.17 Advisor Class ($389,639 / 19,423 shares outstanding) $ 20.06 I Class ($95,533,345 / 4,704,912 shares outstanding) $ 20.31
araof_1021_P4Proof #
26
T. ROWE PRICE AsIA OPPORTunITIEs Fund
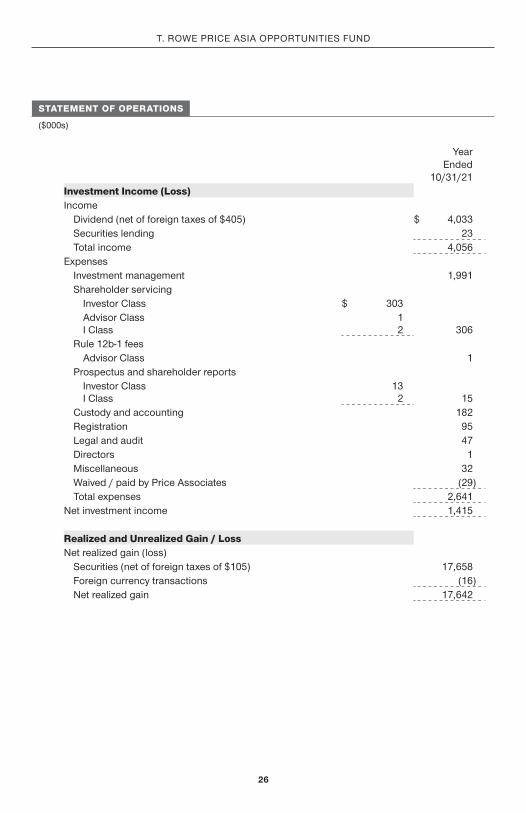
STATEMENT OF OPERATIONS
($000s)
Year Ended
10/31/21 Investment Income (Loss) Income
Dividend (net of foreign taxes of $405) $ 4,033 Securities lending 23 Total income 4,056
Investor Class $ 303 Advisor Class 1 I Class 2 306
Rule 12b-1 fees Advisor Class 1
Prospectus and shareholder reports Investor Class 13 I Class 2 15
Custody and accounting 182 Registration 95 Legal and audit 47 Directors 1 Miscellaneous 32 Waived / paid by Price Associates ( 29 ) Total expenses 2,641
Net investment income 1,415
Realized and Unrealized Gain / Loss Net realized gain (loss)
Securities (net of foreign taxes of $105) 17,658 Foreign currency transactions ( 16 ) Net realized gain 17,642
araof_1021_P4Proof #
27
T. ROWE PRICE AsIA OPPORTunITIEs Fund
The accompanying notes are an integral part of these financial statements.
STATEMENT OF OPERATIONS
($000s)
Year Ended
10/31/21 Change in net unrealized gain / loss
Securities (net of increase in deferred foreign taxes of $757) 537 Other assets and liabilities denominated in foreign currencies ( 4 ) Change in net unrealized gain / loss 533
Net realized and unrealized gain / loss 18,175
INCREASE IN NET ASSETS FROM OPERATIONS $ 19,590
araof_1021_P4Proof #
28
T. ROWE PRICE AsIA OPPORTunITIEs Fund
STATEMENT OF CHANGES IN NET ASSETS
($000s)
Year Ended
10/31/21 10/31/20 Increase (Decrease) in Net Assets Operations
Net investment income $ 1,415 $ 569 Net realized gain 17,642 2,837 Change in net unrealized gain / loss 533 23,937 Increase in net assets from operations 19,590 27,343
Distributions to shareholders Net earnings
Investor Class ( 2,084 ) ( 617 ) Advisor Class ( 7 ) ( 3 ) I Class ( 1,078 ) ( 286 )
Decrease in net assets from distributions ( 3,169 ) ( 906 )
Capital share transactions * Shares sold
Investor Class 74,968 50,921 Advisor Class 136 468 I Class 49,006 14,865
Distributions reinvested Investor Class 2,052 604 Advisor Class 5 1 I Class 1,002 260
Shares redeemed Investor Class ( 59,401 ) ( 40,412 ) Advisor Class ( 234 ) ( 605 ) I Class ( 14,520 ) ( 4,496 )
Increase in net assets from capital share transactions 53,014 21,606
araof_1021_P4Proof #
29
T. ROWE PRICE AsIA OPPORTunITIEs Fund
The accompanying notes are an integral part of these financial statements.
STATEMENT OF CHANGES IN NET ASSETS
($000s)
Year Ended
10/31/21 10/31/20 Net Assets Increase during period 69,435 48,043 Beginning of period 177,417 129,374 End of period $ 246,852 $ 177,417
*Share information Shares sold
Investor Class 3,565 3,197 Advisor Class 7 28 I Class 2,288 975
Distributions reinvested Investor Class 102 37 I Class 49 16
Shares redeemed Investor Class ( 2,845 ) ( 2,584 ) Advisor Class ( 12 ) ( 36 ) I Class ( 705 ) ( 309 )
Increase in shares outstanding 2,449 1,324
araof_1021_P4Proof #
30
T. ROWE PRICE AsIA OPPORTunITIEs Fund
NOTES TO FINANCIAL STATEMENTS
T. Rowe Price International Funds, Inc. (the corporation) is registered under the Investment Company Act of 1940 (the 1940 Act). The Asia Opportunities Fund (the fund) is a nondiversified , open-end management investment company established by the corporation. The fund seeks long-term growth of capital. The fund has three classes of shares: the Asia Opportunities Fund (Investor Class), the Asia Opportunities Fund–Advisor Class (Advisor Class) and the Asia Opportunities Fund–I Class (I Class). Advisor Class shares are sold only through various brokers and other financial intermediaries. I Class shares require a $1 million initial investment minimum, although the minimum generally is waived for retirement plans, financial intermediaries, and certain other accounts. The Advisor Class operates under a Board-approved Rule 12b-1 plan pursuant to which the class compensates financial intermediaries for distribution, shareholder servicing, and/or certain administrative services; the Investor and I Classes do not pay Rule 12b-1 fees. Each class has exclusive voting rights on matters related solely to that class; separate voting rights on matters that relate to all classes; and, in all other respects, the same rights and obligations as the other classes.
NOTE 1 - SIGNIFICANT ACCOUNTING POLICIES
Basis of Preparation The fund is an investment company and follows accounting and reporting guidance in the Financial Accounting Standards Board (FASB) Accounting Standards Codification Topic 946 (ASC 946). The accompanying financial statements were prepared in accordance with accounting principles generally accepted in the United States of America (GAAP), including, but not limited to, ASC 946. GAAP requires the use of estimates made by management. Management believes that estimates and valuations are appropriate; however, actual results may differ from those estimates, and the valuations reflected in the accompanying financial statements may differ from the value ultimately realized upon sale or maturity.
Investment Transactions, Investment Income, and Distributions Investment transactions are accounted for on the trade date basis. Income and expenses are recorded on the accrual basis. Realized gains and losses are reported on the identified cost basis. Income tax-related interest and penalties, if incurred, are recorded as income tax expense. Dividends received from mutual fund investments are reflected as dividend income; capital gain distributions are reflected as realized gain/loss. Dividend income and capital gain distributions are recorded on the ex-dividend date. Non-cash dividends, if any, are recorded at the fair market value of the asset received. Distributions to
araof_1021_P4Proof #
31
T. ROWE PRICE AsIA OPPORTunITIEs Fund
shareholders are recorded on the ex-dividend date. Income distributions, if any, are declared and paid by each class annually. A capital gain distribution may also be declared and paid by the fund annually.
Currency Translation Assets, including investments, and liabilities denominated in foreign currencies are translated into U.S. dollar values each day at the prevailing exchange rate, using the mean of the bid and asked prices of such currencies against U.S. dollars as provided by an outside pricing service. Purchases and sales of securities, income, and expenses are translated into U.S. dollars at the prevailing exchange rate on the respective date of such transaction. The effect of changes in foreign currency exchange rates on realized and unrealized security gains and losses is not bifurcated from the portion attributable to changes in market prices.
Class Accounting Shareholder servicing, prospectus, and shareholder report expenses incurred by each class are charged directly to the class to which they relate. Expenses common to all classes, investment income, and realized and unrealized gains and losses are allocated to the classes based upon the relative daily net assets of each class. The Advisor Class pays Rule 12b-1 fees, in an amount not exceeding 0.25% of the class’s average daily net assets.
Capital Transactions Each investor’s interest in the net assets of the fund is represented by fund shares. The fund’s net asset value (NAV) per share is computed at the close of the New York Stock Exchange (NYSE), normally 4 p.m. ET, each day the NYSE is open for business. However, the NAV per share may be calculated at a time other than the normal close of the NYSE if trading on the NYSE is restricted, if the NYSE closes earlier, or as may be permitted by the SEC. Purchases and redemptions of fund shares are transacted at the next-computed NAV per share, after receipt of the transaction order by T. Rowe Price Associates, Inc., or its agents.
Indemnification In the normal course of business, the fund may provide indemnification in connection with its officers and directors, service providers, and/or private company investments. The fund’s maximum exposure under these arrangements is unknown; however, the risk of material loss is currently considered to be remote.
NOTE 2 - VALUATION
Fair Value The fund’s financial instruments are valued at the close of the NYSE and are reported at fair value, which GAAP defines as the price that would be received to sell an asset or paid to transfer a liability in an orderly transaction between market participants at the measurement date. The T. Rowe Price Valuation Committee (the Valuation Committee) is an internal committee that has been delegated certain responsibilities
araof_1021_P4Proof #
32
T. ROWE PRICE AsIA OPPORTunITIEs Fund
by the fund’s Board of Directors (the Board) to ensure that financial instruments are appropriately priced at fair value in accordance with GAAP and the 1940 Act. Subject to oversight by the Board, the Valuation Committee develops and oversees pricing-related policies and procedures and approves all fair value determinations. Specifically, the Valuation Committee establishes policies and procedures used in valuing financial instruments, including those which cannot be valued in accordance with normal procedures or using pricing vendors; determines pricing techniques, sources, and persons eligible to effect fair value pricing actions; evaluates the services and performance of the pricing vendors; oversees the pricing process to ensure policies and procedures are being followed; and provides guidance on internal controls and valuation-related matters. The Valuation Committee provides periodic reporting to the Board on valuation matters.
Various valuation techniques and inputs are used to determine the fair value of financial instruments. GAAP establishes the following fair value hierarchy that categorizes the inputs used to measure fair value:
Level 1 – quoted prices (unadjusted) in active markets for identical financial instruments that the fund can access at the reporting date
Level 2 – inputs other than Level 1 quoted prices that are observable, either directly or indirectly (including, but not limited to, quoted prices for similar financial instruments in active markets, quoted prices for identical or similar financial instruments in inactive markets, interest rates and yield curves, implied volatilities, and credit spreads)
Level 3 – unobservable inputs (including the fund’s own assumptions in determining fair value)
Observable inputs are developed using market data, such as publicly available information about actual events or transactions, and reflect the assumptions that market participants would use to price the financial instrument. Unobservable inputs are those for which market data are not available and are developed using the best information available about the assumptions that market participants would use to price the financial instrument. GAAP requires valuation techniques to maximize the use of relevant observable inputs and minimize the use of unobservable inputs. When multiple inputs are used to derive fair value, the financial instrument is assigned to the level within the fair value hierarchy based on the lowest-level input that is significant to the fair value of the financial instrument. Input levels are not necessarily an indication of the risk or liquidity associated with financial instruments at that level but rather the degree of judgment used in determining those values.
araof_1021_P4Proof #
33
T. ROWE PRICE AsIA OPPORTunITIEs Fund
Valuation Techniques Equity securities, including exchange-traded funds, listed or regularly traded on a securities exchange or in the over-the-counter (OTC) market are valued at the last quoted sale price or, for certain markets, the official closing price at the time the valuations are made. OTC Bulletin Board securities are valued at the mean of the closing bid and asked prices. A security that is listed or traded on more than one exchange is valued at the quotation on the exchange determined to be the primary market for such security. Listed securities not traded on a particular day are valued at the mean of the closing bid and asked prices for domestic securities and the last quoted sale or closing price for international securities.
The last quoted prices of non-U.S. equity securities may be adjusted to reflect the fair value of such securities at the close of the NYSE, if the fund determines that developments between the close of a foreign market and the close of the NYSE will affect the value of some or all of its portfolio securities. Each business day, the fund uses information from outside pricing services to evaluate and, if appropriate, decide whether it is necessary to adjust quoted prices to reflect fair value by reviewing a variety of factors, including developments in foreign markets, the performance of U.S. securities markets, and the performance of instruments trading in U.S. markets that represent foreign securities and baskets of foreign securities. The fund uses outside pricing services to provide it with quoted prices and information to evaluate or adjust those prices. The fund cannot predict how often it will use quoted prices and how often it will determine it necessary to adjust those prices to reflect fair value.
Investments in mutual funds are valued at the mutual fund’s closing NAV per share on the day of valuation. Assets and liabilities other than financial instruments, including short-term receivables and payables, are carried at cost, or estimated realizable value, if less, which approximates fair value.
Investments for which market quotations or market-based valuations are not readily available or deemed unreliable are valued at fair value as determined in good faith by the Valuation Committee, in accordance with fair valuation policies and procedures. The objective of any fair value pricing determination is to arrive at a price that could reasonably be expected from a current sale. Financial instruments fair valued by the Valuation Committee are primarily private placements, restricted securities, warrants, rights, and other securities that are not publicly traded. Factors used in determining fair value vary by type of investment and may include market or investment specific considerations. The Valuation Committee typically will afford greatest weight to actual prices in arm’s length transactions, to the extent they represent orderly transactions between market participants, transaction information can be reliably obtained, and prices are deemed representative of fair value. However, the Valuation Committee may also consider other valuation methods such as market-based valuation multiples;
araof_1021_P4Proof #
34
T. ROWE PRICE AsIA OPPORTunITIEs Fund
a discount or premium from market value of a similar, freely traded security of the same issuer; discounted cash flows; yield to maturity; or some combination. Fair value determinations are reviewed on a regular basis and updated as information becomes available, including actual purchase and sale transactions of the investment. Because any fair value determination involves a significant amount of judgment, there is a degree of subjectivity inherent in such pricing decisions, and fair value prices determined by the Valuation Committee could differ from those of other market participants.
Valuation Inputs The following table summarizes the fund’s financial instruments, based on the inputs used to determine their fair values on October 31, 2021 (for further detail by category, please refer to the accompanying Portfolio of Investments):
($000s) Level 1 Level 2 Level 3 Total Value
Assets
Common Stocks $ 54,821 $ 187,771 $ — $ 242,592
Short-Term Investments 3,789 — — 3,789
Securities Lending Collateral 1 — — 1
Total $ 58,611 $ 187,771 $ — $ 246,382
NOTE 3 - OTHER INVESTMENT TRANSACTIONS
Consistent with its investment objective, the fund engages in the following practices to manage exposure to certain risks and/or to enhance performance. The investment objective, policies, program, and risk factors of the fund are described more fully in the fund’s prospectus and Statement of Additional Information.
Emerging and Frontier Markets The fund invests, either directly or through investments in other T. Rowe Price funds, in securities of companies located in, issued by governments of, or denominated in or linked to the currencies of emerging and frontier market countries. Emerging markets, and to a greater extent frontier markets, generally have economic structures that are less diverse and mature, and political systems that are less stable, than developed countries. These markets may be subject to greater political, economic, and social uncertainty and differing regulatory environments that may potentially impact the fund’s ability to buy or sell certain securities or repatriate proceeds to U.S. dollars. Such securities are often subject to greater price
araof_1021_P4Proof #
35
T. ROWE PRICE AsIA OPPORTunITIEs Fund
volatility, less liquidity, and higher rates of inflation than U.S. securities. Investing in frontier markets is significantly riskier than investing in other countries, including emerging markets.
Securities Lending The fund may lend its securities to approved borrowers to earn additional income. Its securities lending activities are administered by a lending agent in accordance with a securities lending agreement. Security loans generally do not have stated maturity dates, and the fund may recall a security at any time. The fund receives collateral in the form of cash or U.S. government securities. Collateral is maintained over the life of the loan in an amount not less than the value of loaned securities; any additional collateral required due to changes in security values is delivered to the fund the next business day. Cash collateral is invested in accordance with investment guidelines approved by fund management. Additionally, the lending agent indemnifies the fund against losses resulting from borrower default. Although risk is mitigated by the collateral and indemnification, the fund could experience a delay in recovering its securities and a possible loss of income or value if the borrower fails to return the securities, collateral investments decline in value, and the lending agent fails to perform. Securities lending revenue consists of earnings on invested collateral and borrowing fees, net of any rebates to the borrower, compensation to the lending agent, and other administrative costs. In accordance with GAAP, investments made with cash collateral are reflected in the accompanying financial statements, but collateral received in the form of securities is not. At October 31, 2021, the value of loaned securities was $1,000; the value of cash collateral and related investments was $1,000.
Other Purchases and sales of portfolio securities other than short-term securities aggregated $126,952,000 and $76,925,000, respectively, for the year ended October 31, 2021.
NOTE 4 - FEDERAL INCOME TAXES
Generally, no provision for federal income taxes is required since the fund intends to continue to qualify as a regulated investment company under Subchapter M of the Internal Revenue Code and distribute to shareholders all of its taxable income and gains. Distributions determined in accordance with federal income tax regulations may differ in amount or character from net investment income and realized gains for financial reporting purposes.
The fund files U.S. federal, state, and local tax returns as required. The fund’s tax returns are subject to examination by the relevant tax authorities until expiration of the applicable statute of limitations, which is generally three years after the filing of the tax
araof_1021_P4Proof #
36
T. ROWE PRICE AsIA OPPORTunITIEs Fund
return but which can be extended to six years in certain circumstances. Tax returns for open years have incorporated no uncertain tax positions that require a provision for income taxes.
Financial reporting records are adjusted for permanent book/tax differences to reflect tax character but are not adjusted for temporary differences. The permanent book/tax adjustments have no impact on results of operations or net assets and relate primarily to a tax practice that treats a portion of the proceeds from each redemption of capital shares as a distribution of taxable net investment income or realized capital gain and the character of foreign capital gains taxes. For the year ended October 31, 2021, the following reclassification was recorded:
($000s)
Total distributable earnings (loss) $ (2,366)
Paid-in capital 2,366
Distributions during the years ended October 31, 2021 and October 31, 2020, were characterized for tax purposes as follows:
($000s)
October 31, 2021
October 31, 2020
Ordinary income $ 283 $ 906
Long-term capital gain 2,886 —
Total distributions $ 3,169 $ 906
At October 31, 2021, the tax-basis cost of investments and components of net assets were as follows:
($000s)
Cost of investments $ 205,128
Unrealized appreciation $ 56,998
Unrealized depreciation (16,549)
Net unrealized appreciation (depreciation) 40,449
Undistributed ordinary income 6,703
Undistributed long-term capital gain 9,256
Paid-in capital 190,444
Net assets $ 246,852
araof_1021_P4Proof #
37
T. ROWE PRICE AsIA OPPORTunITIEs Fund
The difference between book-basis and tax-basis net unrealized appreciation (depreciation) is attributable to the deferral of losses from wash sales for tax purposes.
NOTE 5 - FOREIGN TAXES
The fund is subject to foreign income taxes imposed by certain countries in which it invests. Additionally, capital gains realized upon disposition of securities issued in or by certain foreign countries are subject to capital gains tax imposed by those countries. All taxes are computed in accordance with the applicable foreign tax law, and, to the extent permitted, capital losses are used to offset capital gains. Taxes attributable to income are accrued by the fund as a reduction of income. Current and deferred tax expense attributable to capital gains is reflected as a component of realized or change in unrealized gain/loss on securities in the accompanying financial statements. To the extent that the fund has country specific capital loss carryforwards, such carryforwards are applied against net unrealized gains when determining the deferred tax liability. Any deferred tax liability incurred by the fund is included in either Other liabilities or Deferred tax liability on the accompanying Statement of Assets and Liabilities.
NOTE 6 - RELATED PARTY TRANSACTIONS
The fund is managed by T. Rowe Price Associates, Inc. (Price Associates), a wholly owned subsidiary of T. Rowe Price Group, Inc. (Price Group). Price Associates has entered into a sub-advisory agreement(s) with one or more of its wholly owned subsidiaries, to provide investment advisory services to the fund. The investment management agreement between the fund and Price Associates provides for an annual investment management fee, which is computed daily and paid monthly. The fee consists of an individual fund fee, equal to 0.50% of the fund’s average daily net assets, and a group fee. The group fee rate is calculated based on the combined net assets of certain mutual funds sponsored by Price Associates (the group) applied to a graduated fee schedule, with rates ranging from 0.48% for the first $1 billion of assets to 0.260% for assets in excess of $845 billion. The fund’s group fee is determined by applying the group fee rate to the fund’s average daily net assets. The fee is computed daily and paid monthly. At October 31, 2021, the effective annual group fee rate was 0.28%.
The Investor Class and Advisor Class are each subject to a contractual expense limitation through the expense limitation date indicated in the table below. During the limitation period, Price Associates is required to waive its management fee or pay any expenses (excluding interest; expenses related to borrowings, taxes, and brokerage; and other non-recurring expenses permitted by the investment management agreement)
araof_1021_P4Proof #
38
T. ROWE PRICE AsIA OPPORTunITIEs Fund
that would otherwise cause the class’s ratio of annualized total expenses to average net assets (net expense ratio) to exceed its expense limitation. Each class is required to repay Price Associates for expenses previously waived/paid to the extent the class’s net assets grow or expenses decline sufficiently to allow repayment without causing the class’s net expense ratio (after the repayment is taken into account) to exceed the lesser of: (1) the expense limitation in place at the time such amounts were waived; or (2) the class’s current expense limitation. However, no repayment will be made more than three years after the date of a payment or waiver.
The I Class is also subject to an operating expense limitation (I Class Limit) pursuant to which Price Associates is contractually required to pay all operating expenses of the I Class, excluding management fees; interest; expenses related to borrowings, taxes, and brokerage; and other non-recurring expenses permitted by the investment management agreement, to the extent such operating expenses, on an annualized basis, exceed the I Class Limit. This agreement will continue through the expense limitation date indicated in the table below, and may be renewed, revised, or revoked only with approval of the fund’s Board. The I Class is required to repay Price Associates for expenses previously paid to the extent the class’s net assets grow or expenses decline sufficiently to allow repayment without causing the class’s operating expenses (after the repayment is taken into account) to exceed the lesser of: (1) the I Class Limit in place at the time such amounts were paid; or (2) the current I Class Limit. However, no repayment will be made more than three years after the date of a payment or waiver.
Pursuant to these agreements, expenses were waived/paid by and/or repaid to Price Associates during the year ended October 31, 2021 as indicated in the table below. Including these amounts, expenses previously waived/paid by Price Associates in the amount of $187,000 remain subject to repayment by the fund at October 31, 2021. Any repayment of expenses previously waived/paid by Price Associates during the period would be included in the net investment income and expense ratios presented on the accompanying Financial Highlights.
Investor Class Advisor Class I Class
Expense limitation/I Class Limit 1.15% 1.25% 0.05%
Expense limitation date 02/28/23 02/28/23 02/28/23
(Waived)/repaid during the period ($000s) $57 $(1) $(85)
In addition, the fund has entered into service agreements with Price Associates and two wholly owned subsidiaries of Price Associates, each an affiliate of the fund (collectively, Price). Price Associates provides certain accounting and administrative services to the
araof_1021_P4Proof #
39
T. ROWE PRICE AsIA OPPORTunITIEs Fund
fund. T. Rowe Price Services, Inc. provides shareholder and administrative services in its capacity as the fund’s transfer and dividend-disbursing agent. T. Rowe Price Retirement Plan Services, Inc. provides subaccounting and recordkeeping services for certain retirement accounts invested in the Investor Class and Advisor Class. For the year ended October 31, 2021, expenses incurred pursuant to these service agreements were $73,000 for Price Associates; $177,000 for T. Rowe Price Services, Inc.; and $1,000 for T. Rowe Price Retirement Plan Services, Inc. All amounts due to and due from Price, exclusive of investment management fees payable, are presented net on the accompanying Statement of Assets and Liabilities.
The fund may invest its cash reserves in certain open-end management investment companies managed by Price Associates and considered affiliates of the fund: the T. Rowe Price Government Reserve Fund or the T. Rowe Price Treasury Reserve Fund, organized as money market funds, or the T. Rowe Price Short-Term Fund, a short-term bond fund (collectively, the Price Reserve Funds). The Price Reserve Funds are offered as short-term investment options to mutual funds, trusts, and other accounts managed by Price Associates or its affiliates and are not available for direct purchase by members of the public. Cash collateral from securities lending, if any, is invested in the T. Rowe Price Short-Term Fund. The Price Reserve Funds pay no investment management fees.
As of October 31, 2021, T. Rowe Price Group, Inc., or its wholly owned subsidiaries, owned 7,680 shares of the Advisor Class, representing 40% of the Advisor Class's net assets, and 394,754 shares of the I Class, representing 8% of the I Class’s net assets.
The fund may participate in securities purchase and sale transactions with other funds or accounts advised by Price Associates (cross trades), in accordance with procedures adopted by the fund’s Board and Securities and Exchange Commission rules, which require, among other things, that such purchase and sale cross trades be effected at the independent current market price of the security. During the year ended October 31, 2021, the fund had no purchases or sales cross trades with other funds or accounts advised by Price Associates.
NOTE 7 - OTHER MATTERS
Unpredictable events such as environmental or natural disasters, war, terrorism, pandemics, outbreaks of infectious diseases, and similar public health threats may significantly affect the economy and the markets and issuers in which a fund invests. Certain events may cause instability across global markets, including reduced liquidity and disruptions in trading markets, while some events may affect certain geographic regions, countries, sectors, and industries more significantly than others, and exacerbate other pre-existing political, social, and economic risks. The fund’s performance could
araof_1021_P4Proof #
40
T. ROWE PRICE AsIA OPPORTunITIEs Fund
be negatively impacted if the value of a portfolio holding were harmed by such events. Since 2020, a novel strain of coronavirus (COVID-19) has resulted in disruptions to global business activity and caused significant volatility and declines in global financial markets. The duration of this outbreak or others and their effects cannot be determined with certainty.
araof_1021_P4Proof #
41
T. ROWE PRICE AsIA OPPORTunITIEs Fund
REPORT OF INDEPENDENT REGISTERED PUBLIC ACCOUNTING FIRM
To the Board of Directors of T. Rowe Price International Funds, Inc. and Shareholders of T. Rowe Price Asia Opportunities Fund
Opinion on the Financial StatementsWe have audited the accompanying statement of assets and liabilities, including the portfolio of investments, of T. Rowe Price Asia Opportunities Fund (one of the funds constituting T. Rowe Price International Funds, Inc., referred to hereafter as the “Fund”) as of October 31, 2021, the related statement of operations for the year ended October 31, 2021, the statement of changes in net assets for each of the two years in the period ended October 31, 2021, including the related notes, and the financial highlights for each of the periods indicated therein (collectively referred to as the “financial statements”). In our opinion, the financial statements present fairly, in all material respects, the financial position of the Fund as of October 31, 2021, the results of its operations for the year then ended, the changes in its net assets for each of the two years in the period ended October 31, 2021 and the financial highlights for each of the periods indicated therein, in conformity with accounting principles generally accepted in the United States of America.
Basis for OpinionThese financial statements are the responsibility of the Fund’s management. Our responsibility is to express an opinion on the Fund’s financial statements based on our audits. We are a public accounting firm registered with the Public Company Accounting Oversight Board (United States) (PCAOB) and are required to be independent with respect to the Fund in accordance with the U.S. federal securities laws and the applicable rules and regulations of the Securities and Exchange Commission and the PCAOB.
We conducted our audits of these financial statements in accordance with the standards of the PCAOB. Those standards require that we plan and perform the audit to obtain reasonable assurance about whether the financial statements are free of material misstatement, whether due to error or fraud.
Our audits included performing procedures to assess the risks of material misstatement of the financial statements, whether due to error or fraud, and performing procedures that respond to those risks. Such procedures included examining, on a test basis, evidence regarding the amounts and disclosures in the financial statements. Our audits also included evaluating the accounting principles used and significant estimates made
araof_1021_P4Proof #
42
T. ROWE PRICE AsIA OPPORTunITIEs Fund
REPORT OF INDEPENDENT REGISTERED PUBLIC ACCOUNTING FIRM (CONTINUED)
by management, as well as evaluating the overall presentation of the financial statements. Our procedures included confirmation of securities owned as of October 31, 2021 by correspondence with the custodian, transfer agent and brokers; when replies were not received from brokers, we performed other auditing procedures. We believe that our audits provide a reasonable basis for our opinion.
PricewaterhouseCoopers LLP Baltimore, Maryland December 17, 2021
We have served as the auditor of one or more investment companies in the T. Rowe Price group of investment companies since 1973.
araof_1021_P4Proof #
43
T. ROWE PRICE AsIA OPPORTunITIEs Fund
TAX INFORMATION (UNAUDITED) FOR THE TAX YEAR ENDED 10/31/21
We are providing this information as required by the Internal Revenue Code. The amounts shown may differ from those elsewhere in this report because of differences between tax and financial reporting requirements.
The fund’s distributions to shareholders included:
■ $592,000 from short-term capital gains
■ $4,661,000 from long-term capital gains, subject to a long-term capital gains tax rate of not greater than 20%
For taxable non-corporate shareholders, $2,177,000 of the fund's income represents qualified dividend income subject to a long-term capital gains tax rate of not greater than 20%.
For corporate shareholders, $93,000 of the fund's income qualifies for the dividends-received deduction.
The fund will pass through foreign source income of $3,515,000 and foreign taxes paid of $405,000.
araof_1021_P4Proof #
44
T. ROWE PRICE AsIA OPPORTunITIEs Fund
INFORMATION ON PROXY VOTING POLICIES, PROCEDURES, AND RECORDS
A description of the policies and procedures used by T. Rowe Price funds to determine how to vote proxies relating to portfolio securities is available in each fund’s Statement of Additional Information. You may request this document by calling 1-800-225-5132 or by accessing the SEC’s website, sec.gov.
The description of our proxy voting policies and procedures is also available on our corporate website. To access it, please visit the following Web page:
Scroll down to the section near the bottom of the page that says, “Proxy Voting Policies.” Click on the Proxy Voting Policies link in the shaded box.
Each fund’s most recent annual proxy voting record is available on our website and through the SEC’s website. To access it through T. Rowe Price, visit the website location shown above, and scroll down to the section near the bottom of the page that says, “Proxy Voting Records.” Click on the Proxy Voting Records link in the shaded box.
HOW TO OBTAIN QUARTERLY PORTFOLIO HOLDINGS
The fund files a complete schedule of portfolio holdings with the Securities and Exchange Commission (SEC) for the first and third quarters of each fiscal year as an exhibit to its reports on Form N-PORT. The fund’s reports on Form N-PORT are available electronically on the SEC’s website (sec.gov). In addition, most T. Rowe Price funds disclose their first and third fiscal quarter-end holdings on troweprice.com.
araof_1021_P4Proof #
45
T. ROWE PRICE AsIA OPPORTunITIEs Fund
LIQUIDITY RISK MANAGEMENT PROGRAM
In accordance with Rule 22e-4 (Liquidity Rule) under the Investment Company Act of 1940, as amended, the fund has established a liquidity risk management program (Liquidity Program) reasonably designed to assess and manage the fund’s liquidity risk, which generally represents the risk that the fund would not be able to meet redemption requests without significant dilution of remaining investors’ interests in the fund. The fund’s Board of Directors (Board) has appointed the fund’s investment advisor, T. Rowe Price Associates, Inc. (Price Associates), as the administrator of the Liquidity Program. As administrator, Price Associates is responsible for overseeing the day-to-day operations of the Liquidity Program and, among other things, is responsible for assessing, managing, and reviewing with the Board at least annually the liquidity risk of each T. Rowe Price fund. Price Associates has delegated oversight of the Liquidity Program to a Liquidity Risk Committee (LRC), which is a cross-functional committee composed of personnel from multiple departments within Price Associates.
The Liquidity Program’s principal objectives include supporting the T. Rowe Price funds’ compliance with limits on investments in illiquid assets and mitigating the risk that the fund will be unable to timely meet its redemption obligations. The Liquidity Program also includes a number of elements that support the management and assessment of liquidity risk, including an annual assessment of factors that influence the fund’s liquidity and the periodic classification and reclassification of a fund’s investments into categories that reflect the LRC’s assessment of their relative liquidity under current market conditions. Under the Liquidity Program, every investment held by the fund is classified at least monthly into one of four liquidity categories based on estimations of the investment’s ability to be sold during designated time frames in current market conditions without significantly changing the investment’s market value.
As required by the Liquidity Rule, at a meeting held on July 27, 2021, the Board was presented with an annual assessment prepared by the LRC, on behalf of Price Associates, that addressed the operation of the Liquidity Program and assessed its adequacy and effectiveness of implementation, including any material changes to the Liquidity Program and the determination of each fund’s Highly Liquid Investment Minimum (HLIM). The annual assessment included consideration of the following factors, as applicable: the fund’s investment strategy and liquidity of portfolio investments during normal and reasonably foreseeable stressed conditions, including whether the investment strategy is appropriate for an open-end fund, the extent to which the strategy involves a relatively concentrated portfolio or large positions in particular issuers, and the use of borrowings for investment purposes and derivatives; short-term and long-term cash flow projections covering both normal and reasonably foreseeable stressed conditions; and holdings of cash and cash equivalents, as well as available borrowing arrangements.
araof_1021_P4Proof #
46
T. ROWE PRICE AsIA OPPORTunITIEs Fund
For the fund and other T. Rowe Price funds, the annual assessment incorporated a report related to a fund’s holdings, shareholder and portfolio concentration, any borrowings during the period, cash flow projections, and other relevant data for the period of April 1, 2020, through March 31, 2021. The report described the methodology for classifying a fund’s investments (including derivative transactions) into one of four liquidity categories, as well as the percentage of a fund’s investments assigned to each category. It also explained the methodology for establishing a fund’s HLIM and noted that the LRC reviews the HLIM assigned to each fund no less frequently than annually.
During the period covered by the annual assessment, the LRC has concluded, and reported to the Board, that the Liquidity Program continues to operate adequately and effectively and is reasonably designed to assess and manage the fund’s liquidity risk.
LIQUIDITY RISK MANAGEMENT PROGRAM (CONTINUED)
araof_1021_P4Proof #
47
T. ROWE PRICE AsIA OPPORTunITIEs Fund
ABOUT THE FUND’S DIRECTORS AND OFFICERS
Your fund is overseen by a Board of directors (Board) that meets regularly to review a wide variety of matters affecting or potentially affecting the fund, including performance, investment programs, compliance matters, advisory fees and expenses, service providers, and business and regulatory affairs. The Board elects the fund’s officers, who are listed in the final table. At least 75% of the Board’s members are considered to be independent, i.e., not “interested persons” as defined in section 2(a)(19) of the 1940 Act, of the Boards of T. Rowe Price Associates, Inc. (T. Rowe Price), and its affiliates; “interested” directors and officers are employees of T. Rowe Price. The business address of each director and officer is 100 East Pratt street, Baltimore, Maryland 21202. The statement of Additional Information includes additional information about the fund directors and is available without charge by calling a T. Rowe Price representative at 1-800-638-5660.
INDEPENDENT DIRECTORS(a)
Name(Year of Birth)Year Elected[Number of T. Rowe PricePortfolios Overseen]
Principal Occupation(s) and Directorships of Public Companies and Other Investment Companies During the Past Five Years
Teresa Bryce Bazemore(1959)2018[204]
President and Chief Executive Officer, Federal Home Loan Bank of san Francisco (2021 to present); President, Radian Guaranty (2008 to 2017); Chief Executive Officer, Bazemore Consulting LLC (2018 to 2021); director, Chimera Investment Corporation (2017 to 2021); director, First Industrial Realty Trust (2020 to present); director, Federal Home Loan Bank of Pittsburgh (2017 to 2019)
Ronald J. daniels(1959)2018[204]
President, The Johns Hopkins university(b) and Professor, Political science department, The Johns Hopkins university (2009 to present); director, Lyndhurst Holdings (2015 to present); director, BridgeBio Pharma, Inc. (2020 to present)
Bruce W. duncan(1951)2013[204]
President, Chief Executive Officer, and director, CyrusOne, Inc. (2020 to 2021); Chief Executive Officer and director (2009 to 2016), Chair of the Board (2016 to 2020), and President (2009 to 2016), First Industrial Realty Trust, owner and operator of industrial properties; Chair of the Board (2005 to 2016) and director (1999 to 2016), starwood Hotels & Resorts, a hotel and leisure company; Member, Investment Company Institute Board of Governors (2017 to 2019); Member, Independent directors Council Governing Board (2017 to 2019); senior Advisor, KKR (2018 to present); director, Boston Properties (2016 to present); director, Marriott International, Inc. (2016 to 2020)
Robert J. Gerrard, Jr.(1952)2012[204]
Advisory Board Member, Pipeline Crisis/Winning strategies, a collaborative working to improve opportunities for young African Americans (1997 to 2016); Chair of the Board, all funds (July 2018 to present)
araof_1021_P4Proof #
48
T. ROWE PRICE AsIA OPPORTunITIEs Fund
Name(Year of Birth)Year Elected[Number of T. Rowe PricePortfolios Overseen]
Principal Occupation(s) and Directorships of Public Companies and Other Investment Companies During the Past Five Years
Paul F. McBride(1956)2013[204]
Advisory Board Member, Vizzia Technologies (2015 to present); Board Member, dunbar Armored (2012 to 2018)
Cecilia E. Rouse, Ph.d.(c)
(1963)2013[0]
dean, Princeton school of Public and International Affairs (2012 to present); Professor and Researcher, Princeton university (1992 to present); director of Education studies Committee, MdRC, a nonprofit education and social policy research organization (2011 to 2020); Member, national Academy of Education (2010 to present); Board Member, national Bureau of Economic Research (2011 to present); Board Member of the Council on Foreign Relations (2018 to present); Board Member, The Pennington school (2017 to present); Board Member, the university of Rhode Island (2020 to present); Chair of Committee on the status of Minority Groups in the Economic Profession of the American Economic Association (2012 to 2018); Vice President (2015 to 2016) and Board Member (2018 to present), American Economic Association
John G. schreiber(1946)2001[204]
Owner/President, Centaur Capital Partners, Inc., a real estate investment company (1991 to present); Cofounder, Partner, and Cochair of the Investment Committee, Blackstone Real Estate Advisors, L.P. (1992 to 2015); director, Blackstone Mortgage Trust, a real estate finance company (2012 to 2016); director and Chair of the Board, Brixmor Property Group, Inc. (2013 to present); director, Hilton Worldwide (2007 to present); director, Hudson Pacific Properties (2014 to 2016); director, Invitation Homes (2014 to 2017); director, JMB Realty Corporation (1980 to present)
(a) All information about the independent directors was current as of December 31, 2020, unless otherwise indicated, except for the number of portfolios overseen, which is current as of the date of this report.
(b) William J. Stromberg, chair of the Board, director, and chief executive officer of T. Rowe Price Group, Inc., the parent company of the Price Funds’ investment advisor, has served on the Board of Trustees of Johns Hopkins University since 2014.
(c) Effective March 4, 2021, Dr. Rouse resigned from her role as independent director of the Price Funds.
INDEPENDENT DIRECTORS(a) (CONTINUED)
araof_1021_P4Proof #
49
T. ROWE PRICE AsIA OPPORTunITIEs Fund
Name(Year of Birth)Year Elected[Number of T. Rowe Price Portfolios Overseen]
Principal Occupation(s) and Directorships of Public Companies and Other Investment Companies During the Past Five Years
david Oestreicher(1967)2018[204]
General Counsel, Vice President, and secretary, T. Rowe Price Group, Inc.; Chair of the Board, Chief Executive Officer, President, and secretary, T. Rowe Price Trust Company; director, Vice President, and secretary, T. Rowe Price, T. Rowe Price Investment services, Inc., T. Rowe Price Retirement Plan services, Inc., and T. Rowe Price services, Inc.; director and secretary, T. Rowe Price Investment Management, Inc.; Vice President and secretary, T. Rowe Price International (Price International); Vice President, T. Rowe Price Hong Kong (Price Hong Kong), T. Rowe Price Japan (Price Japan), and T. Rowe Price singapore (Price singapore); Principal Executive Officer and Executive Vice President, all funds
Robert W. sharps, CFA, CPA(1971)2017[204]
director and Vice President, T. Rowe Price; President, T. Rowe Price Group, Inc.; director, T. Rowe Price Investment Management, Inc.; Vice President, T. Rowe Price Trust Company; Vice President, International Funds
(a) All information about the interested directors was current as of December 31, 2020, unless otherwise indicated, except for the number of portfolios overseen, which is current as of the date of this report.
OFFICERS
Name (Year of Birth)Position Held With International Funds Principal Occupation(s)
Mariel Abreu (1981)Vice President
Vice President, T. Rowe Price and T. Rowe Price Group, Inc.
Jason R. Adams (1979)Executive Vice President
Vice President T. Rowe Price and T. Rowe Price Group, Inc.
ulle Adamson, CFA (1979)Executive Vice President
Vice President, T. Rowe Price Group, Inc., and Price International
Roy H. Adkins (1970)Vice President
Vice President, T. Rowe Price Group, Inc., and Price International
syed H. Ali (1970)Vice President
Vice President, Price Hong Kong, Price singapore, and T. Rowe Price Group, Inc.
Unless otherwise noted, officers have been employees of T. Rowe Price or Price International for at least 5 years.
INTERESTED DIRECTORS(a)
araof_1021_P4Proof #
50
T. ROWE PRICE AsIA OPPORTunITIEs Fund
Name (Year of Birth)Position Held With International Funds Principal Occupation(s)
Kennard W. Allen (1977)Vice President
Vice President, T. Rowe Price and T. Rowe Price Group, Inc.
Paulina Amieva (1981)Vice President
Vice President, T. Rowe Price and T. Rowe Price Group, Inc.
Malik s. Asif (1981)Executive Vice President
Vice President, T. Rowe Price Group, Inc., and Price International
Ziad Bakri, M.d., CFA (1980)Vice President
Vice President, T. Rowe Price and T. Rowe Price Group, Inc.
Harishankar Balkrishna (1983)Executive Vice President
Vice President, T. Rowe Price Group, Inc., and Price International
sheena L. Barbosa (1983)Vice President
Vice President, Price Hong Kong and T. Rowe Price Group, Inc.
Peter J. Bates, CFA (1974)Executive Vice President
Vice President, T. Rowe Price and T. Rowe Price Group, Inc.
Jason A. Bauer (1979)Vice President
Vice President, T. Rowe Price and T. Rowe Price Group, Inc.
Luis M. Baylac (1982)Vice President
Vice President, T. Rowe Price Group, Inc., and Price International
R. scott Berg, CFA (1972)Executive Vice President
Vice President, T. Rowe Price, T. Rowe Price Group, Inc., and T. Rowe Price Trust Company
steven E. Boothe, CFA (1977)Vice President
Vice President, T. Rowe Price and T. Rowe Price Group, Inc.
Peter I. Botoucharov (1965)Vice President
Vice President, T. Rowe Price Group, Inc., and Price International
Tala Boulos (1984)Vice President
Vice President, T. Rowe Price Group, Inc., and Price International
Christopher P. Brown, Jr., CFA (1977)Vice President
Vice President, T. Rowe Price and T. Rowe Price Group, Inc.
Andrew Chang (1983)Vice President
Vice President, Price singapore and T. Rowe Price Group, Inc.
Carolyn Hoi Che Chu (1974)Vice President
Vice President, Price Hong Kong and T. Rowe Price Group, Inc.
Unless otherwise noted, officers have been employees of T. Rowe Price or Price International for at least 5 years.
OFFICERS (CONTINUED)
araof_1021_P4Proof #
51
T. ROWE PRICE AsIA OPPORTunITIEs Fund
Name (Year of Birth)Position Held With International Funds Principal Occupation(s)
Vincent Chung (1988)Vice President
Vice President, T. Rowe Price Group, Inc., and Price International; formerly, Investment Analyst/Trader, Observatory Capital Management LLP (to 2019)
Archibald Ciganer, CFA (1976)Executive Vice President
director and Vice President, Price Japan; Vice President, T. Rowe Price Group, Inc.
Richard n. Clattenburg, CFA (1979)Executive Vice President
Vice President, Price singapore, T. Rowe Price, T. Rowe Price Group, Inc., Price International, and T. Rowe Price Trust Company
Michael J. Conelius, CFA (1964)Vice President
Vice President, T. Rowe Price, T. Rowe Price Group, Inc., Price International, and T. Rowe Price Trust Company
Michael F. Connelly, CFA (1977)Vice President
Vice President, T. Rowe Price and T. Rowe Price Group, Inc.
Andrew s. davis (1978)Vice President
Vice President, T. Rowe Price and T. Rowe Price Group, Inc.
Richard de los Reyes (1975)Vice President
Vice President, T. Rowe Price, T. Rowe Price Group, Inc., and T. Rowe Price Trust Company
Michael della Vedova (1969)Executive Vice President
Vice President, T. Rowe Price Group, Inc., and T. Rowe Price International
Iona dent, CFA (1991)Vice President
Vice President, Price International; formerly, Associate, Equity Research, deutsche Bank (to 2018)
Maria Elena drew (1973)Vice President
Vice President, T. Rowe Price Group, Inc., and Price International; formerly, Executive director, Goldman sachs Asset Management (to 2017)
shawn T. driscoll (1975)Vice President
Vice President, T. Rowe Price, T. Rowe Price Group, Inc., and T. Rowe Price Trust Company
Alan s. dupski, CPA (1982)Principal Financial Officer, Vice President, and Treasurer
Vice President, T. Rowe Price, T. Rowe Price Group, Inc., and T. Rowe Price Trust Company
Bridget A. Ebner (1970)Vice President
Vice President, T. Rowe Price and T. Rowe Price Group, Inc.
david J. Eiswert, CFA (1972)Executive Vice President
Vice President, T. Rowe Price and T. Rowe Price Group, Inc.
Unless otherwise noted, officers have been employees of T. Rowe Price or Price International for at least 5 years.
OFFICERS (CONTINUED)
araof_1021_P4Proof #
52
T. ROWE PRICE AsIA OPPORTunITIEs Fund
Name (Year of Birth)Position Held With International Funds Principal Occupation(s)
dawei Feng (1979)Vice President
Vice President, Price Hong Kong and T. Rowe Price Group, Inc.; formerly, Head of China Consumer in Equity Research, Credit Lyonnais Asia-Pacific (to 2018)
Ryan W. Ferro (1985)Vice President
Vice President, T. Rowe Price and T. Rowe Price Group, Inc.
Mark s. Finn, CFA, CPA (1963)Vice President
Vice President, T. Rowe Price, T. Rowe Price Group, Inc., and T. Rowe Price Trust Company
Quentin s. Fitzsimmons (1968)Vice President
Vice President, T. Rowe Price Group, Inc., and Price International
Melissa C. Gallagher (1974)Vice President
Vice President, T. Rowe Price Group, Inc., and Price International
Justin T. Gerbereux, CFA (1975)Vice President
Vice President, T. Rowe Price, T. Rowe Price Group, Inc., and T. Rowe Price Trust Company
Aaron Gifford, CFA (1987)Vice President
Vice President, T. Rowe Price and T. Rowe Price Group, Inc.; formerly, strategist, Morgan stanley & Co. LLC (to 2017)
John R. Gilner (1961)Chief Compliance Officer
Chief Compliance Officer and Vice President, T. Rowe Price; Vice President, T. Rowe Price Group, Inc., and T. Rowe Price Investment services, Inc.
Vishnu V. Gopal (1979)Vice President
Vice President, Price Hong Kong and T. Rowe Price Group, Inc.
Joel Grant (1978)Vice President
Vice President, T. Rowe Price and T. Rowe Price Group, Inc.
Gary J. Greb (1961)Vice President
Vice President, T. Rowe Price, Price International, and T. Rowe Price Trust Company
Paul d. Greene II (1978)Vice President
Vice President, T. Rowe Price and T. Rowe Price Group, Inc.
Benjamin Griffiths, CFA (1977)Executive Vice President
Vice President, T. Rowe Price Group, Inc., and Price International
Gianluca Guicciardi (1983)Vice President
Vice President, T. Rowe Price Group, Inc., and T. Rowe Price International
Unless otherwise noted, officers have been employees of T. Rowe Price or Price International for at least 5 years.
OFFICERS (CONTINUED)
araof_1021_P4Proof #
53
T. ROWE PRICE AsIA OPPORTunITIEs Fund
Name (Year of Birth)Position Held With International Funds Principal Occupation(s)
shaoyu Guo (1992)Vice President
Vice President, Price Hong Kong; formerly, Economist, J.P. Morgan (to 2020); Research Analyst, International Monetary Fund (to 2017)
Richard L. Hall (1979)Vice President
Vice President, T. Rowe Price and T. Rowe Price Group, Inc.
nabil Hanano, CFA (1984)Vice President
Vice President, T. Rowe Price Group, Inc., and Price International
Jeffrey Holford, Ph.d., ACA (1972)Vice President
Vice President, T. Rowe Price and T. Rowe Price Group, Inc.; formerly, Managing director, Jeffries Financial Group (to 2018)
stefan Hubrich, Ph.d., CFA (1974)Vice President
Vice President, T. Rowe Price and T. Rowe Price Group, Inc.
Arif Husain, CFA (1972)Executive Vice President
Vice President, T. Rowe Price Group, Inc., and Price International
Tetsuji Inoue (1971)Vice President
Vice President, Price Hong Kong, T. Rowe Price Group, Inc., and Price International
Michael d. Jacobs (1971)Vice President
Vice President, Price Japan, T. Rowe Price Group, Inc., and Price International
Randal s. Jenneke (1971)Vice President
Vice President, T. Rowe Price Group, Inc.
Prashant G. Jeyaganesh (1983)Vice President
Vice President, T. Rowe Price and T. Rowe Price Group, Inc.
nina P. Jones, CPA (1980)Vice President
Vice President, T. Rowe Price and T. Rowe Price Group, Inc.
Yoichiro Kai (1973)Vice President
Vice President, Price singapore, T. Rowe Price Group, Inc., and Price International
Jacob H. Kann, CFA (1987)Vice President
Vice President, T. Rowe Price and T. Rowe Price Group, Inc.
Jai Kapadia (1982)Vice President
Vice President, Price Hong Kong and T. Rowe Price Group, Inc.
Andrew J. Keirle (1974)Executive Vice President
Vice President, T. Rowe Price Group, Inc., and Price International
Takanori Kobayashi (1981)Vice President
Vice President, Price Japan, T. Rowe Price Group, Inc., and Price International; formerly, Research Analyst, Allianz Global Investors (to 2017)
Unless otherwise noted, officers have been employees of T. Rowe Price or Price International for at least 5 years.
OFFICERS (CONTINUED)
araof_1021_P4Proof #
54
T. ROWE PRICE AsIA OPPORTunITIEs Fund
Name (Year of Birth)Position Held With International Funds Principal Occupation(s)
Paul J. Krug, CPA (1964)Vice President
Vice President, T. Rowe Price, T. Rowe Price Group, Inc., and T. Rowe Price Trust Company
Christopher J. Kushlis, CFA (1976)Vice President
Vice President, T. Rowe Price Group, Inc., and T. Rowe Price International
shengrong Lau (1982)Vice President
Vice President, Price singapore and T. Rowe Price Group, Inc.
Lu Liu (1979)Vice President
Vice President, Price Hong Kong and T. Rowe Price Group, Inc.
Johannes Loefstrand (1988) Vice President
Vice President, T. Rowe Price Group, Inc., and Price International
Anh Lu (1968)Executive Vice President
Vice President, Price Hong Kong and T. Rowe Price Group, Inc.
sebastien Mallet (1974)Vice President
Vice President, T. Rowe Price Group, Inc., and Price International
Jennifer Martin (1972)Vice President
Vice President, T. Rowe Price and T. Rowe Price Group, Inc.
Ryan Martyn (1979)Vice President
Vice President, T. Rowe Price Group, Inc., and Price International
Colin McQueen (1967)Executive Vice President
Vice President, T. Rowe Price Group, Inc., and Price International; formerly, senior Investment Manager, Global Equities, sanlam FOuR Investments uK Limited (to 2019)
Raymond A. Mills, Ph.d., CFA (1960)Executive Vice President
Vice President, T. Rowe Price, T. Rowe Price Group, Inc., Price International, and T. Rowe Price Trust Company
Jihong Min (1979)Vice President
Vice President, Price singapore and T. Rowe Price Group, Inc.
Eric C. Moffett (1974)Executive Vice President
Vice President, Price singapore and T. Rowe Price Group, Inc.
Ivan Morozov, CFA (1987)Vice President
Vice President, T. Rowe Price Group, Inc., and Price International
samy B. Muaddi, CFA (1984)Executive Vice President
Vice President, T. Rowe Price, T. Rowe Price Group, Inc., and T. Rowe Price Trust Company
Unless otherwise noted, officers have been employees of T. Rowe Price or Price International for at least 5 years.
OFFICERS (CONTINUED)
araof_1021_P4Proof #
55
T. ROWE PRICE AsIA OPPORTunITIEs Fund
Name (Year of Birth)Position Held With International Funds Principal Occupation(s)
Tobias F. Mueller, CFA (1980)Executive Vice President
Vice President, T. Rowe Price Group, Inc., and Price International
Razan nasser (1985)Vice President
Vice President, T. Rowe Price Group, Inc., and Price International; formerly, senior Economist, HsBC Bank Middle East Ltd (to 2019)
Joshua nelson (1977)Executive Vice President
Vice President, T. Rowe Price, T. Rowe Price Group, Inc., Price International, and T. Rowe Price Trust Company
Philip A. nestico (1976)Vice President
Vice President, T. Rowe Price and T. Rowe Price Group, Inc.
sridhar nishtala (1975)Vice President
director and Vice President, Price singapore; Vice President, T. Rowe Price Group, Inc.
Jason nogueira, CFA (1974)Executive Vice President
Vice President, T. Rowe Price and T. Rowe Price Group, Inc.
Kenneth A. Orchard (1975)Executive Vice President
Vice President, T. Rowe Price Group, Inc., and Price International
Oluwaseun Oyegunle, CFA (1984)Executive Vice President
Vice President, T. Rowe Price Group, Inc., and Price International
Gonzalo Pángaro, CFA (1968)Executive Vice President
Vice President, T. Rowe Price Group, Inc., and Price International
Fran M. Pollack-Matz (1961)Vice President and secretary
Vice President, T. Rowe Price, T. Rowe Price Group, Inc., T. Rowe Price Investment services, Inc., and T. Rowe Price services, Inc.
shannon H. Rauser (1987)Assistant secretary
Assistant Vice President, T. Rowe Price
Todd Reese (1990)Vice President
Vice President, T. Rowe Price
Melanie A. Rizzo (1982)Vice President
Vice President, T. Rowe Price and T. Rowe Price Group, Inc.
david L. Rowlett, CFA (1975)Vice President
Vice President, T. Rowe Price and T. Rowe Price Group, Inc.
Federico santilli, CFA (1974)Executive Vice President
Vice President, T. Rowe Price Group, Inc., and Price International
nikolaj schmidt (1975)Vice President
Vice President, T. Rowe Price Group, Inc., and T. Rowe Price International
Unless otherwise noted, officers have been employees of T. Rowe Price or Price International for at least 5 years.
OFFICERS (CONTINUED)
araof_1021_P4Proof #
56
T. ROWE PRICE AsIA OPPORTunITIEs Fund
Name (Year of Birth)Position Held With International Funds Principal Occupation(s)
sebastian schrott (1977)Vice President
Vice President, T. Rowe Price Group, Inc., and Price International
Bin shen, CFA (1987)Vice President
Vice President, T. Rowe Price Group, Inc., and T. Rowe Price International
John C.A. sherman (1969)Vice President
Vice President, T. Rowe Price and T. Rowe Price Group, Inc.
Gabriel solomon (1977)Vice President
Vice President, T. Rowe Price and T. Rowe Price Group, Inc.
scott d. solomon, CFA (1981)Vice President
Vice President, T. Rowe Price and T. Rowe Price Group, Inc.
Joshua K. spencer, CFA (1973)Vice President
Vice President, T. Rowe Price, T. Rowe Price Group, Inc., and T. Rowe Price Trust Company
david stanley (1963)Vice President
Vice President, T. Rowe Price Group, Inc., and Price International
saurabh sud, CFA (1985)Executive Vice President
Vice President, T. Rowe Price and T. Rowe Price Group, Inc.; formerly, senior Vice President, PIMCO (to 2018)
Taymour R. Tamaddon, CFA (1976)Vice President
Vice President, T. Rowe Price, T. Rowe Price Group, Inc., and T. Rowe Price Trust Company
Ju Yen Tan (1972)Vice President
Vice President, T. Rowe Price Group, Inc., and Price International
sin dee Tan, CFA (1979)Vice President
Vice President, T. Rowe Price Group, Inc., and Price International
siby Thomas (1979)Executive Vice President
Vice President, T. Rowe Price and T. Rowe Price Group, Inc.
Justin Thomson (1968)President
director, Price Hong Kong; Vice President, T. Rowe Price Group, Inc.; director and Vice President, Price International
Mark J. Vaselkiv (1958)Executive Vice President
Vice President, T. Rowe Price, T. Rowe Price Group, Inc., and T. Rowe Price Trust Company
Rupinder Vig (1979)Vice President
Vice President, T. Rowe Price Group, Inc., and Price International
Unless otherwise noted, officers have been employees of T. Rowe Price or Price International for at least 5 years.
OFFICERS (CONTINUED)
araof_1021_P4Proof #
57
T. ROWE PRICE AsIA OPPORTunITIEs Fund
Name (Year of Birth)Position Held With International Funds Principal Occupation(s)
Willem Visser (1979)Vice President
Vice President, T. Rowe Price Group, Inc., and T. Rowe Price International; formerly, Investment Analyst, nn Investment Partners (to 2017)
Chris Vost (1989)Vice President
Vice President, T. Rowe Price Group, Inc., and Price International
Zenon Voyiatzis (1971)Vice President
Vice President, T. Rowe Price Group, Inc., and Price International
Verena E. Wachnitz, CFA (1978)Executive Vice President
Vice President, T. Rowe Price Group, Inc., and Price International
david J. Wallack (1960)Vice President
Vice President, T. Rowe Price, T. Rowe Price Group, Inc., and T. Rowe Price Trust Company
dai Wang (1989)Vice President
Vice President, Price Hong Kong and T. Rowe Price Group, Inc.
Megan Warren (1968)Vice President
Vice President, T. Rowe Price, T. Rowe Price Group, Inc., T. Rowe Price Retirement Plan services, Inc., T. Rowe Price services, Inc., and T. Rowe Price Trust Company; formerly, Executive director, JPMorgan Chase (to 2017)
Hiroshi Watanabe, CFA (1975)Vice President
director and Vice President, Price Japan; Vice President, T. Rowe Price Group, Inc.
J. Howard Woodward, CFA (1974)Vice President
Vice President, T. Rowe Price Group, Inc., and Price International
Marta Yago (1977)Vice President
Vice President, T. Rowe Price Group, Inc., and Price International
Benjamin T. Yeagle (1978)Vice President
Vice President, T. Rowe Price and T. Rowe Price Group, Inc.
Ernest C. Yeung, CFA (1979)Executive Vice President
director and Vice President, Price Hong Kong; Vice President, T. Rowe Price Group, Inc.
Eric Yuan (1984)Vice President
Vice President, Price Hong Kong and T. Rowe Price Group, Inc.
Wenli Zheng (1979)Executive Vice President
Vice President, Price Hong Kong and T. Rowe Price Group, Inc.
Unless otherwise noted, officers have been employees of T. Rowe Price or Price International for at least 5 years.
OFFICERS (CONTINUED)
araof_1021_P4Proof #
This page intentionally left blank.
araof_1021_P4Proof #
This page intentionally left blank.
araof_1021_P4Proof #
This page intentionally left blank.
araof_1021_P4Proof #
This page intentionally left blank.
araof_1021_P4Proof #
202112-1877148F104-050 12/21
You have manyinvestment goals.
Explore products and services that can help you achieve them.Whether you want to put away more money for retirement, for a child’s education, or for other priorities, we have solutions for you. See how we can help you accomplish the investment goals that are important to you.
RETIREMENTn IRAs: Traditional, Roth,
Rollover/Transfer, or Brokerage
n Small Business Plans help minimize taxes, maximize savings
n T. Rowe Price® ActivePlus Portfolios1 for online investing powered by experts
GENERAL INVESTINGn Individual or Joint
Tenantn Brokerage2 offers
access to stocks, ETFs, bonds, and more
n Gifts and transfers to a child (UGMA/UTMAs)
n Trustn Transfer on Death
COLLEGE SAVINGSn T. Rowe Price-managed
529 plans offer tax-advantaged solutions for families saving money for college tuition and education-related expenses
Visit troweprice.com/broadrange
Call 1-800-225-5132 to request a prospectus or summary prospectus; each includes investment objectives, risks, fees, expenses, and other information that you should read and consider carefully before investing.
All mutual funds are subject to market risk, including possible loss of principal. Investing internationally involves special risks including economic and political uncertainty and currency fluctuation.
1 The T. Rowe Price® ActivePlus Portfolios is a discretionary investment management program provided by T. Rowe Price Advisory Services, Inc., a registered investment adviser under the Investment Advisers Act of 1940. Brokerage services are provided by T. Rowe Price Investment Services, Inc., member FINRA/SIPC. Brokerage accounts are carried by Pershing LLC, a BNY Mellon Company, member NYSE/FINRA/SIPC. T. Rowe Price Advisory Services, Inc., and T. Rowe Price Investment Services, Inc., are affiliated companies.
2 Brokerage services are provided by T. Rowe Price Investment Services, Inc., member FINRA/SIPC. Brokerage accounts are carried by Pershing LLC, a BNY Mellon Company, member NYSE/FINRA/SIPC.
T. Rowe Price Investment Services, Inc. | 100 East Pratt Street | Baltimore, MD 21202-1009