A Self-instructional Course for Laboratory Professionals. Basic Applications in Clinical Laboratory Quality Control P.A.C.E. Approved Workbook Challenge or refresh knowledge and understanding of quality control practices. Written by Sten Westgard MS Skill Level: Basic P.A.C.E. Approved Contact Hours: 3
Transcript
1
BASIC APPLICATIONS IN CLINICAL LABORATORY QUALITY CONTROLBASIC APPLICATIONS IN CLINICAL LABORATORY QUALITY CONTROL
INTRODUCTION
A Self-instructional Course for Laboratory Professionals.
Basic Applications in ClinicalLaboratory Quality ControlP.A.C.E. Approved Workbook
Challenge or refresh knowledge and understanding of quality control practices.
Written by Sten Westgard MS
Skill Level: Basic
P.A.C.E. ApprovedContact Hours: 3
Dear Reader,
This is a digital document. For ease of navigation links are provided from the contents
page. To return to the content page from anywhere in the document, simply click on a page
BASIC APPLICATIONS IN CLINICAL LABORATORY QUALITY CONTROLBASIC APPLICATIONS IN CLINICAL LABORATORY QUALITY CONTROL
INTRODUCTION
Introduction
Congratulations! You’ve been selected, or
volunteered, or been volunteered, or been ordered
to learn about Quality Control (QC). Maybe you’re
having problems sleeping at night and think this
will cure your insomnia. Maybe you’ve lost a bet
on how much time you can spend reading about
statistical quality control.
Regardless, you’re here now. And we’re happy to
have you.
The good news is that we don’t intend to be
boring. And we don’t intend to teach you the same
old lessons you learned about Quality Control in
the past.
Quality Control is the very lifeblood of the
laboratory – the daily signs that tell us our results
are safe. Perhaps you haven’t felt this way about
Quality Control in the past. It’s often viewed as a
drudgery, a hassle, and, at worst, a frustration.
For many medical technologists, QC is a daily
struggle – they know they have to do QC, but
they don’t know why, or the reasons behind the
practices that are in place. QC is often done by
rote, by tradition, by a set series of habits that
have been in place for decades.
The purpose of this book is to CHANGE how
you do QC so you can do it more efficiently in
your laboratory, do it more easily for your staff
and colleagues, and do it more effectively to
ensure patients are safer from the possibility of
erroneous results.
So, let’s begin, shall we?
5
BASIC APPLICATIONS IN CLINICAL LABORATORY QUALITY CONTROLBASIC APPLICATIONS IN CLINICAL LABORATORY QUALITY CONTROL
INTRODUCTION
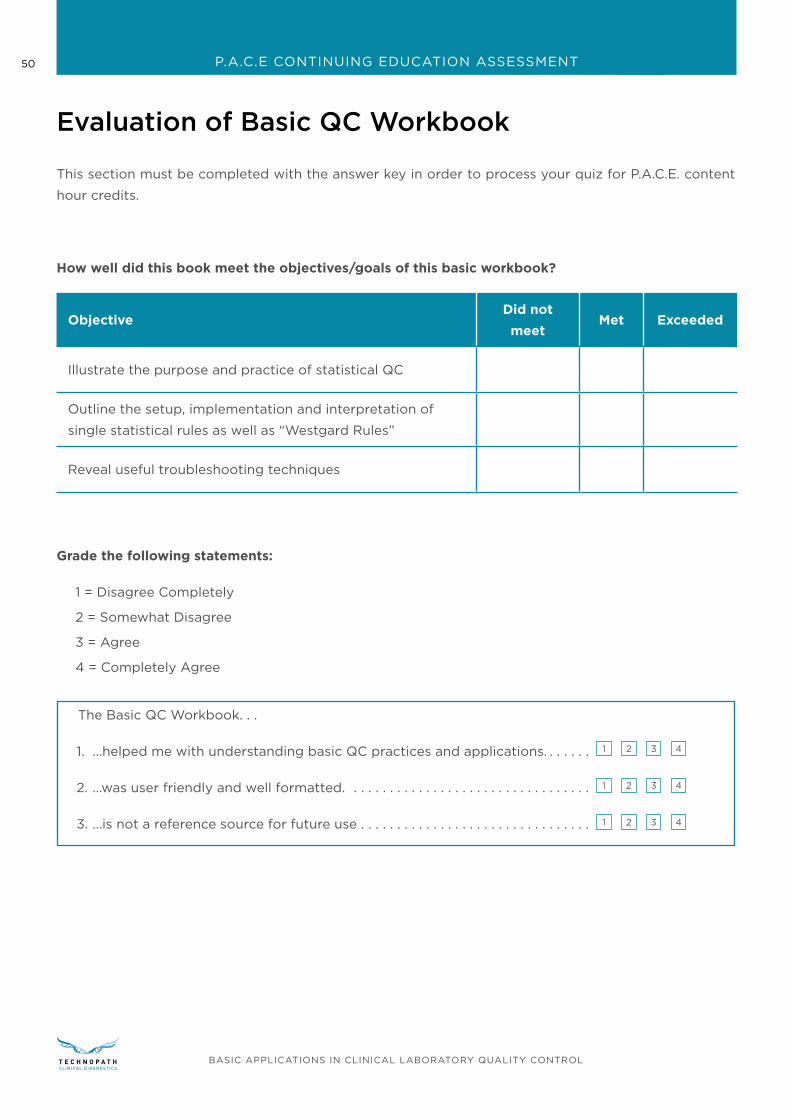
Goals for this workbook
• Illustrate the purpose and practice of statistical
QC
• Outline the setup, implementation and
interpretation of single statistical rules as well
as “Westgard Rules”
• List useful troubleshooting techniques
Explain the fundamental aspects of control
materials that are critical to the success of quality
control
Throughout the book, we will provide you with
self-assessment quizzes along with the answers
to verify your understanding. At the end of
this process, you can take a final exam to get
continuing education / contact hours.
Also, throughout this book we will be quoting from
various references, standards, and regulations.
These may be the hardest to read; seemingly
the aim of such documents is to be as scientific,
precise, and boring as possible. We will provide
a “real world” definition along with an official
definition to help you keep your sanity.
For example, here’s the official definition of
Quality, according to ISO 9000:
“Quality is the degree to which a set of
inherent characteristics fulfills requirements”
That’s exactly what you were thinking, right?
It’s safe to say, the official definitions of these
concepts are not how the average laboratorian
will describe these terms if you walk up to them
and ask.
The Regulations and Requirements:
CLIA (Clinical Laboratory Improvement Amendments), passed in 1988, provides the US regulatory framework. Updates are added to the Federal Register regularly. Washington, DC.
CLSI (Clinical Laboratory Standards Institute) These guidelines provide recommendations on best practices and detailed protocols for processes that aren’t explicitly defined in the CLIA regulations.
ISO: International Standards Organization, Geneva Switzerland. These are international guidelines for quality, basically the global standard for quality. Each standard has a different number. ISO 9000 is the general quality standard. ISO 15189 is the specific quality guideline for the laboratory. Other important guidelines include ISO 17593 and ISO 22869.
At the end of this document you can find more specific references.
6
BASIC APPLICATIONS IN CLINICAL LABORATORY QUALITY CONTROLBASIC APPLICATIONS IN CLINICAL LABORATORY QUALITY CONTROL
INTRODUCTION
ISO/TR 22869 has a more detailed definition of
Quality:
“A set of well-defined and well-executed
processes that create a system for the
collection, examination, and reporting of
human samples that supports diagnosis,
preventions, and management of disease
states, generates information having clinical
utility and optimal impact on health outcomes,
meets predetermined targets for accuracy,
reproducibility, and traceability; strives to
minimize error, is timely, safe efficient, cost
effective, and focuses on client satisfaction
and continual improvement.”
This definition has the virtue of being far less
abstract than the first definition, but the weakness
of being so multi-faceted as to remain completely
amorphous.
This is why labs frequently hire consultants to help
them comply with regulations – the consultant
explains in normal language how to meet these
arcanely-written goals and requirements.
If you can’t afford a consultant, you may end up
reading a workbook instead.
7
BASIC APPLICATIONS IN CLINICAL LABORATORY QUALITY CONTROLBASIC APPLICATIONS IN CLINICAL LABORATORY QUALITY CONTROL
QUALITY CONTROL
Quality Control
Definitions
Let’s start with what Quality Control is and what
it means for the clinical laboratory.
“Quality Control” often refers to many activities in
the normal world.
From ISO we can get a general definition:
“operational techniques and activities that
are used to fulfill requirements for quality.”
Again, so high level as to cause altitude sickness.
But in the lab, “QC” often means something
much more specific – it means running controls,
examining data plotted on Levey-Jennings charts,
and interpreting control rules to decide whether
a run is “in” or “out”, troubleshooting, cursing,
etc. A more specific term is frequently invoked:
“Internal Quality Control” or IQC, referring to
an activity that a laboratory performs by itself,
looking at their own tests’ performance.
Here’s the comprehensive definition of quality
control according to CLSI:
“Quality Control: (internal) the set of
procedures undertaken in a laboratory for
the continual assessment of work carried
out within the laboratory and evaluation of
the results of tests to decide whether the
latter are reliable enough for release to the
requesting clinician.
NOTE: The procedures should include
tests on procedural control material and
statistical analysis of patient data. The main
object is to ensure day-to-day consistency
of measurement or observation that is,
if possible, in agreement with an agreed
reference, such as control material with
assigned values.”
Quality Control Notes
NOTE 1: This includes the operational techniques
and activities used to fulfill requirements for
quality;
NOTE 2: In health care testing, the set of
procedures designed to monitor the test method
8
BASIC APPLICATIONS IN CLINICAL LABORATORY QUALITY CONTROLBASIC APPLICATIONS IN CLINICAL LABORATORY QUALITY CONTROL
QUALITY CONTROL
and the results to ensure appropriate test system
performance;
NOTE 3: Quality control includes testing quality
control materials, charting the results and
analyzing them to identify sources of error, and
evaluating and documenting any action taken as
a result of this analysis;
NOTE 4: Quality control includes testing of normal
and abnormal control materials, recording the
results, identifying sources of error, and evaluating
and documenting any corrective action taken;
NOTE 5: In clinical laboratory testing, quality
control includes the procedures intended to
monitor the performance of a test procedure to
ensure reliable results;
NOTE 6: The set of procedures undertaken in a
laboratory for the continuous assessment of work
carried out in the laboratory and evaluation of
tests to decide whether these are reliable enough
for release of results to the requesting health care
provider. The procedures should include tests on
control material, results of which may be plotted
on a quantitative control chart showing upper and
lower standard deviation-based ranges, and may
also include statistical analysis of patient data
(e.g., moving averages). The main objective is to
ensure day-to-day consistency of measurements
or observations, if possible, in agreement with an
indicator of truth, such as a control material with
end-user assigned values;
NOTE 7: Quality control is also described as
operational techniques and activities that are
used to fulfill requirements for quality;
NOTE 8: The purpose of quality control is to
ensure that all quality requirements are being
met;
NOTE 9: The set of mechanisms, processes, and
procedures designed to monitor the measuring
system to ensure the results are reliable for the
intended clinical use;
NOTE 10: More specifically, it is the set of
procedures undertaken in a laboratory for the
continuous assessment of work carried out in
the laboratory and evaluation of tests to decide
whether these are reliable enough for release of
results to the requesting health care provider;
NOTE 11: In health care testing, the set of
procedures based on measurement of a stable
material that is similar to the intended patient
specimen, to monitor the ongoing performance
of a measurement procedure and detect change
in that performance relative to stable baseline
analytical performance;
NOTE 12: A system for ensuring maintenance of
proper standards by periodic inspection of the
results and the operational techniques that are
used to ensure accuracy and reproducibility;
NOTE 13: In medical laboratory testing, quality
control includes the procedures intended to
monitor the performance of a test system to
ensure reliable results.”
That’s a symphony of Notes! They’ve taken a very
simple definition and added quite the chorus.
We’ll address all these notes in turn, in a more
gradual approach. So, don’t panic that you need
to learn all these notes at once.
Let’s distill all of those possible differences into a
practical definition of QC:
“Set of procedures used in a laboratory for
continually assessing laboratory work and
the patient results achieved. This includes
9
BASIC APPLICATIONS IN CLINICAL LABORATORY QUALITY CONTROLBASIC APPLICATIONS IN CLINICAL LABORATORY QUALITY CONTROL
QUALITY CONTROL
day-to-day monitoring of assay, operator and
equipment performance.”
Typically, every test in the laboratory requires
some form of quality control. It’s best practice to
have QC on every test in your lab, even the ones
where “traditional quality control” is not an easy
fit.
In summary, quality control should include a set
of procedures utilized in your laboratory that are
suited to continually assess each test system’s
performance as well as the staff’s processing, as
it could impact the patient results. It is critical
that the quality control processes used in the
laboratory monitor any pre-analytical, analytical
and post-analytical effects to the laboratory
outcomes. However, the laboratory should also
rely on feedback not only from their QC data
management program but also their patient
results and any communication from the clinicians
on results.
Sources of feedback on
test system performancePurposes
QC Data Management
Program
Monitors test system bias and imprecision on a run-to-run basis via
the use of quality control products and possibly quality assurance
processes. Allows raw data analysis and/or charts
Patient samples
By tracking patient averages over time, the lab can use this as
an internal check between QC sample events for test system
performance
Clinician Feedback
How many times do you get calls from your doctors questioning
why all their patient results are recovering in the abnormal range?
While no one likes to get these types of calls; these are good
checks on your test system.
In this workbook, we will use the terms
analyte, assay, method, and test. They will be used interchangeably.
10
BASIC APPLICATIONS IN CLINICAL LABORATORY QUALITY CONTROLBASIC APPLICATIONS IN CLINICAL LABORATORY QUALITY CONTROL
QUALITY CONTROL
NotesSelf-assessment Quiz
Question 1
1. What is Quality Control?
a. Testing control materials
b. Using control charts
c. Ensuring that all quality requirements are met
d. All of the above
Answer Key: page 42
11
BASIC APPLICATIONS IN CLINICAL LABORATORY QUALITY CONTROLBASIC APPLICATIONS IN CLINICAL LABORATORY QUALITY CONTROL
WHAT KINDS OF LAB TESTING ARE THERE?
What kinds of lab testing are there?
Before we even start talking about Quality Control,
we need to talk about the type of tests we run in
the laboratory, because the Quality Control you
run will depend on the kind of test.
Quantitative Tests: these are tests that give
results expressing a numerical amount or level
(concentration) of an analyte in a specimen. In
other words, it measures a quantity and reports
it as a numerical value. The Quality Control
techniques described in this workbook will most
directly apply to this type of testing.
Qualitative Tests: these are tests that give
results that are descriptive, not numerical. For
example, “positive” or “negative”, “present” or
“absent”, etc. The quality control requirements
for qualitative testing are minimal because it’s not
possible to calculate things like mean, standard
deviation (SD), coefficient of variation (CV), bias,
etc. In qualitative testing, QC is usually reduced to
truth tables.
Semi-Quantitative Tests: (wait, there’s another
kind of testing?) These are tests that have
"a dose-response gradient that may be
included in the reported result, but for which
no authoritative calibration scale exists to
determine inaccuracy and imprecision; tests
that yield results in an approximate range of
values (e.g., trace, moderate).”
[ISO and CLSI].
Many serology, infectious disease tests are of
this type, having signal-to-cutoff ratios (S/CO)
that then are used to determine qualifications of
“positive”, “negative” and even “low positive” and
“indeterminate” categorizations.
If you simply run qualitative tests, you can skip all
the sections that involve math in this workbook.
Congratulations!
If you run tests that are semi-quantitative or
quantitative, sorry, there are no shortcuts. You
must do QC including the math, the charting, the
rules, the interpretation, and the troubleshooting.
But we’ll try to eliminate the frustration, the
heightened blood pressure, and the temptation
to retire early. But before we can get to the
“EXCITING” part of Quality Control, we need to
build up the foundation of testing, that involves
things like calibrators, standards, linearity kits,
etc. These are things that we need to have in
place, processes we must run, BEFORE we can
even contemplate running QC. In other words,
before we try to drive and keep our car within the
correct lane, we need to make sure the engine is
on and the tires are full of air.
12
BASIC APPLICATIONS IN CLINICAL LABORATORY QUALITY CONTROLBASIC APPLICATIONS IN CLINICAL LABORATORY QUALITY CONTROL
PREPARING YOUR METHOD FOR ROUTINE TESTING
Preparing your method for routine testing: Calibration and Linearity / Reportable Range .
Calibration and Calibrators
Have you ever looked at your watch, or even
scarier, your scale? You know they measure
quantities, but sometimes they’re wrong – very,
very wrong. A watch that runs late, a scale that
reads too heavy, can ruin your day. So, before
you use these items, you’d like them to be set
correctly.
The same is true with laboratory instruments.
Before we use them, we need to set them up
correctly, so they read the “right” numbers. This
process of adjusting the set-up of the test is
called Calibration.
Here’s a more formal definition of Calibration
from CLSI and ISO:
“operation that, under specified conditions,
in a first step, establishes a relation between
the quantity values with measurement
uncertainties provided by measurement
standards and corresponding indications
with associated measurement uncertainties
and, in a second step, uses this information
to establish a relation for obtaining a
measurement result from an indication”
If you find that confusing, congratulations,
you’re not alone. We’ll leave the “measurement
uncertainty” to a later portion of this workbook.
Here’s a better definition from the US Federal
Register (the US regulations that govern medical
laboratories):
“a process of testing and adjusting an
instrument or test system to establish a
correlation between the measurement
response and the concentration or amount
of the substance that is being measured by
the test procedure.”
13
BASIC APPLICATIONS IN CLINICAL LABORATORY QUALITY CONTROLBASIC APPLICATIONS IN CLINICAL LABORATORY QUALITY CONTROL
PREPARING YOUR METHOD FOR ROUTINE TESTING
Calibration is the process to provide the best
measurement possible for the test, trying to get
you as close to the “true answer” as possible.
Calibrators or calibration materials are solutions
or devices
“of known quantitative/qualitative character-
istics (e.g. concentration, activity, intensity,
reactivity) used to calibrate, graduate, or ad-
just a measurement procedure or to compare
the response obtained with the response of a
test specimen/sample.”
[ISO definition]
Here’s a more down to earth explanation of
Calibration: Calibration is the procedure that
determines the relationship between the signal
generated by an analytical methodology and
the test results that are reported. “Multi-point
calibration” is used for methods that do not
generate a linear response (e.g. immunoassay
methods) and usually involves analyzing three to
five (or even more) calibrator solutions and utilizing
a curve-fitting routine to establish the calibration
function. In many commercial automated systems
that use multi-point calibration, the “master”
calibration of each reagent lot may be performed
by the manufacturer using as many as 11 calibrators
to establish the curve. This “master” calibration
is transferred to the laboratory instrument using
a two-point local calibration that adapts the
“master” curve to the local instrument.
Linearity
For methods that do have a linear relationship
between signal and concentration, “two-point
calibration” is commonly used. Typically, one
calibrator provides a “zero-point” and the other
a “set-point. The assumption is that a linear
calibration function can be drawn between
the zero-point and the set-point and that the
linear range extends beyond the set-point. The
manufacturer’s claimed analytical or reportable
range indicates the full range of concentration
over which the assay performance has been
documented. Verifying the reportable range,
demonstrates that you can achieve that claimed
performance.
In addition to the standard, scheduled calibration
that the manufacturer recommends, certain
accrediting agencies require labs to perform
a reportable range study when the method
is first installed in the laboratory, and as well
as periodically check, update, and verify that
calibration every six months or more. That process
is called Calibration Verification.
When labs are not performing those regulatory-
mandated checks on calibration, they should follow
the manufacturer’s schedule since they typically
define when to use calibrators and how often to
perform calibration. Sometimes calibration is once
a day, sometimes it’s not for many months. When
issues arise with performance, a common trouble-
shooting step is to perform a new calibration.
Whatever the manufacturer recommends, you
must follow that calibration frequency. For
example, CLIA and US regulations may require
that you verify the calibration of the tests semi-
annually, if you don’t already perform calibration
more frequently than that. Each laboratory must
review their accreditation organization’s unique
requirements on this point.
Notice that calibrators are supposed to bring the
test close to the truth but not necessarily reach
the absolute truth. It’s particularly challenging to
move a test to the absolute truth.
For some tests where a truth is knowable, the test
14
BASIC APPLICATIONS IN CLINICAL LABORATORY QUALITY CONTROLBASIC APPLICATIONS IN CLINICAL LABORATORY QUALITY CONTROL
PREPARING YOUR METHOD FOR ROUTINE TESTING
gets adjusted to meet a standard or what is often
referred to as a reference material.
Here’s the official ISO definition of standard:
“(measurement) realization of the definition
of a given quantity, with stated quantity value
and associated measurement uncertainty,
used as a reference”
[JCGM 200:2012]
Again, measurement uncertainty is rearing its
ugly head – ignore it for now. An easier definition
of standard can be found here:
“(measurement) material measure, measuring
instrument, reference material or measuring
system intended to define, realize, conserve
or reproduce a unit or one or more values of
a quantity to serve as a reference”
[from CLSI]
The gist here is that if you calibrate your method
using standards, you are synchronizing your assay
very closely to the truth. If your calibrators are
not standards, but just calibrators, you’re trying
to adjust closely to a truth, but not as close as the
scenario in which the standards and calibrators
are the same material.
Once we have made that synchronization, we’re
still not quite ready to run tests yet. We need to
make sure the test is linear, that we’ve established
the working range over which the test results are
valid. We will discuss linearity a bit later in this
workbook
Once calibration is performed, and we’ve
established the appropriate reportable range (or
working range, or, in some cases, the linearity),
we’re one step closer to running QC.
15
BASIC APPLICATIONS IN CLINICAL LABORATORY QUALITY CONTROLBASIC APPLICATIONS IN CLINICAL LABORATORY QUALITY CONTROL
PREPARING YOUR METHOD FOR ROUTINE TESTING
Self-assessment Quiz
Questions 2-5
2. If your test only produces positive and negative results?
a. QC is not necessary
b. Statistical QC is not possible
c. Testing is not practical
3. When do you NOT use statistical QC?
a. Quantitative testing.
b. Semi-quantitative testing
c. Qualitative testing
d. Never
4. When should you calibrate your method?
a. Before you purchase the instrument
b. Before you turn on the instrument
c. Before you run controls and patients
d. Never
5. How often should you calibrate?
a. As often as your money allows
b. As often as the manufacturer requires
c. As often as the manufacturer requires, as often as the regulations require, and whenever an out-of-control situation requires it.
Answer Key: page 42
Notes
16
BASIC APPLICATIONS IN CLINICAL LABORATORY QUALITY CONTROLBASIC APPLICATIONS IN CLINICAL LABORATORY QUALITY CONTROL
CONTROL MATERIALS
Finally, now we’re ready to discuss controls. So,
what’s a control? Not to be silly, but do we all
agree on what a control is?
Again, the official definition of a control material is
rather dry, dull, and overpopulated with commas:
“A device, solution, lyophilized preparation,
or panel of collected human or animal
specimens, or artificially derived materials,
intended for use in the quality control
process”
[CLSI]
Here’s a different definition from a different ISO
standard:
“Substance, material, or article intended by
the manufacturer to be used to verify the
performance characteristics of an in vitro
diagnostic medical device”
[ISO 17593]
The key here is that the control material is
something we use to verify that the medical
device (test) is working correctly. Both definitions
note that there are many forms that a control can
take.
Types of Control Material
There are some controls that are internal to
the workings of the instrument, particularly
highlighted at the point of care. If it’s a control
that essentially doesn’t test anything like a patient
sample or even a surrogate patient sample, but
instead uses some electronic check, this is called
Electronic QC. These are useful internal checks,
much like your “check engine” light on your car.
It’s important to make sure all these checks are
working, but they don’t tell you anything about
the operator (driver), so they aren’t sufficient to
provide a full check of the testing process. You
can’t just rely on Electronic QC to ensure your
testing quality.
In just the last few years, some devices have
received CMS approval to use what is being
called Embedded QC. If the control materials
Control Materials
17
BASIC APPLICATIONS IN CLINICAL LABORATORY QUALITY CONTROLBASIC APPLICATIONS IN CLINICAL LABORATORY QUALITY CONTROL
CONTROL MATERIALS
are contained in on-board ampules or cartridges,
provided they have similar matrices to patient
specimens and follow all steps of the analytical
process, those control materials may be used as a
substitute for traditional quality control materials
(each individual laboratory must develop an
Individualized Quality Control Plan (IQCP) in
order to document this step).
Despite these alternative approaches to Quality
Control, the gold standard, "best practice
for quality controls", is to use a third party,
independent quality control that involves
the operator using the control material like a
patient sample. This tests the instrument and
the operator, covering most of the steps of the
total testing process. Even with devices that have
Electronic QC or Embedded QC, the traditional
steps of running QC should be performed at least
periodically.
Formats of Quality Control Material
You can get control materials in a variety of
formats:
Lyophilized: this is freeze-dried, perhaps more
convenient for transport as it doesn’t have to
maintain a cold chain (continuous logistical
chain of refrigeration), particularly attractive to
laboratories operating in remote areas, desert
or hot climates, and/or areas where logistics
of delivery are not as reliable. In order to use
these controls, operators must reconstitute the
controls by adding a precise amount of liquid
(using a pipette and a well-trained operator).
Liquid: this is easier to understand. These are
controls that are ready to go, no reconstitution
step required. They must be properly
refrigerated during transport and storage. Since
a reconstitution step is avoided, this variable in
the troubleshooting process is eliminated.
Liquid Frozen: certain controls can be kept
frozen for a long period of time. Be aware of
the thawing time – you will need to follow those
directions carefully to bring these materials to
the right temperature before running on your
instruments.
It’s clear that liquid controls are preferable to
lyophilized, but practicalities will dictate what you
choose.
Commutability
One last aspect we need to address: commutability,
matrix, and matrix effects.
Commutability is when the control material
closely mimics a patient sample and is the goal
of any type of control. This attribute provides
confidence that when the device produces a
control value out of range - thus indicating that
the test system has a problem, you can be certain
that the patient sample results would be incorrect
as well.
Commutability also has its own official definition
established by the meteorologists of ISO:
“ability of a material to yield the same
numerical relationships between results of
measurements by a given set of measurement
procedures, purporting to measure the same
quantity, as those between the expectations
18
BASIC APPLICATIONS IN CLINICAL LABORATORY QUALITY CONTROLBASIC APPLICATIONS IN CLINICAL LABORATORY QUALITY CONTROL
CONTROL MATERIALS
of the relationships obtained when the same
procedures are applied to other relevant
types of material.”
In other words, commutability is good: it’s what
we want in control materials.
Matrix Effect
The opposite of commutability is often referred
to as a Matrix Effect (no, this is not the Matrix
that Keanu Reeves found himself inside 20 years
ago, this is the really uncool Matrix). The matrix of
a control is all the extra stabilizers, preservatives,
and other ingredients that are present that are
wholly unrelated to a patient sample. These
additives may help keep the control material
stable, or have a longer shelf life, but they do not
make the control behave similarly to a patient
sample. In the worst case, the matrix of a control
material will make the control behave differently
than a real patient sample. This means a control
may be “out”, but the patients are completely
fine and unaffected by whatever is causing the
control to be out. This defeats the very purpose
of a control – it becomes an unreliable signal of
whether patient results are going to be reliable.
As much as possible, labs want to avoid controls
with heavily artificial matrices and want to have
controls that are as commutable as possible.
Inevitably, as labs desire controls with long shelf
lives and greater stability, the control materials
must be modified with a matrix that will make
it less like a real patient sample. Between our
financial constraints and our quest for best quality,
we must strike a balance.
In summary, commutability is a good thing, matrix
effect is a bad thing.
In the Advanced QC workbook, we will discuss
even more aspects that are important to selecting
control materials.
What are the key attributes to What are the key attributes to consider with your perfect QC product?consider with your perfect QC product?
• Stable over a long period: Most labs want a long shelf life to minimize the necessary cost of cross-over testing between lots of QC.
• Appropriate fill size in bottle or box of control: The fill volume (amount of product in the bottle) should be enough that you consume the contents prior to the vial’s open-vial stability limit. However, it is also ideal that the volume in each vial is large enough to avoid using a large number of vials. Refrigerator and freezer storage are typically at a premier in any lab. Using more vials will require more boxes of QC material, requiring more storage space or more frequent shipments.
• Matrix of the control must be mimic patient samples.
• Yield results at each test’s clinically relevant range.
• The different numerical values of the multi-level QC product should not be too close in range. The lab should monitor the assay’s performance along the assay’s range.
• Consideration of liquid vs. lyophilized should be assessed. By using a liquid control, it eliminates some troubleshooting steps (water source, proper reconstitution, etc.). However, some labs choose lyophilized due to storage and shipping requirements.
• Try to find a control that is independent from the test system’s supplied product, i.e. control material that is different from the calibrators in the test system. By using a control from an independent source, you are truly assessing the test system’s performance.
• Verify with the control vendor that they have made great efforts to ensure that their controls are as commutable with the patient samples as possible. This will help your lab minimize the chance of shift in the QC data when new components are implemented into the routine testing process.
19
BASIC APPLICATIONS IN CLINICAL LABORATORY QUALITY CONTROLBASIC APPLICATIONS IN CLINICAL LABORATORY QUALITY CONTROL
CONTROL MATERIALS
Self-assessment Quiz
Questions 6-8
6. Which is better, according to CMS?
a. Embedded QC
b. Electronic QC
c. Simulated QC
d. Measurement Uncertainty
7. Which type of controls is freeze-dried?
a. Lyophilized
b. Liquid
c. Electronic
8. Which control materials will have results closer to patient values?
a. Control with high commutability
b. Control with high matrix effects
c. Controls placed on high shelves
So, you selected your control
materials, now what?
Notes
Answer Key: page 42
20
BASIC APPLICATIONS IN CLINICAL LABORATORY QUALITY CONTROLBASIC APPLICATIONS IN CLINICAL LABORATORY QUALITY CONTROL
STATISTICS
Do you really have to do math in order to perform
QC? Today’s laboratorians have it easier than ever:
the data is typically handled by the instrument,
middleware, Laboratory Information System (LIS)
or some other informatics or software, and the
math gets done by a computer program with the
results displayed on Levey-Jennings charts. So,
a lot of the heavy lifting is done for you – what
you need to do is understand where the math is
coming from and what the results mean when
they deviate from expected performance.
Mean
Mean: no, this is not about how your boss treats
you, this is the mean that also means Average.
This is one of the most fundamental calculations
for quality control. It gives you the best estimate
of a specific level of the control material.
Simply put, take the sum of all the control values
for that level, then divide by the number of
measurements.
Calculating the Mean [x̄]
∑ Xn/n
Where:
∑ = sum
Xn = each value in data set
n = the number of values in data set
If you have an assayed control, you can compare
your calculation to that assayed (the target value
or expected value) mean. When you are starting
out with a control material, this can be a useful
comparison – if your observed mean is wildly
Time to do math: The statistics of Quality Control
21
BASIC APPLICATIONS IN CLINICAL LABORATORY QUALITY CONTROLBASIC APPLICATIONS IN CLINICAL LABORATORY QUALITY CONTROL
STATISTICS
different than the expected mean, that’s a sign
that something is wrong with the control, your
instrument, or your lab.
The good news about the mean is that most
software programs will automatically calculate
and provide this statistic to you.
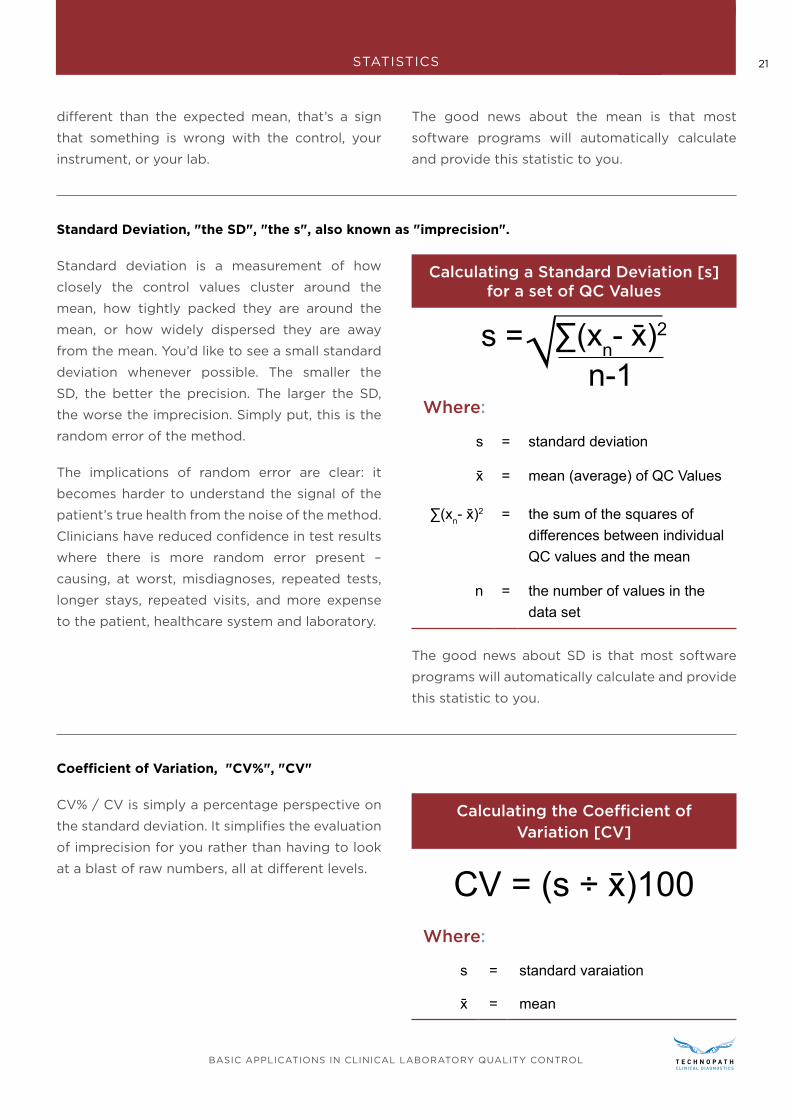
Standard Deviation, "the SD", "the s", also known as "imprecision".
Standard deviation is a measurement of how
closely the control values cluster around the
mean, how tightly packed they are around the
mean, or how widely dispersed they are away
from the mean. You’d like to see a small standard
deviation whenever possible. The smaller the
SD, the better the precision. The larger the SD,
the worse the imprecision. Simply put, this is the
random error of the method.
The implications of random error are clear: it
becomes harder to understand the signal of the
patient’s true health from the noise of the method.
Clinicians have reduced confidence in test results
where there is more random error present –
causing, at worst, misdiagnoses, repeated tests,
longer stays, repeated visits, and more expense
to the patient, healthcare system and laboratory.
Calculating a Standard Deviation [s] for a set of QC Values
n-1∑(xn- x̄)2s =
Where:
s = standard deviation
x̄ = mean (average) of QC Values
∑(xn- x̄)2 = the sum of the squares of differences between individual QC values and the mean
n = the number of values in the data set
The good news about SD is that most software
programs will automatically calculate and provide
this statistic to you.
Coefficient of Variation, "CV%", "CV"
CV% / CV is simply a percentage perspective on
the standard deviation. It simplifies the evaluation
of imprecision for you rather than having to look
at a blast of raw numbers, all at different levels.
Calculating the Coefficient of Variation [CV]
CV = (s ÷ x̄)100Where:
s = standard varaiation
x̄ = mean
22
BASIC APPLICATIONS IN CLINICAL LABORATORY QUALITY CONTROLBASIC APPLICATIONS IN CLINICAL LABORATORY QUALITY CONTROL
STATISTICS
The CV allows you to look at imprecision across
multiple control levels, even compare imprecision
between methods and instruments, and compare
them against the manufacturer’s expectations.
Many accrediting organizations have requirements
that the CV must be monitored monthly for all
quantitative assays. It is imperative that you
review and follow your accrediting organizations
regulations.
The lower the CV, the lower the test system’s
imprecision.
The imprecision is also an essential factor in
calculating the analytical Sigma-metric and
optimizing your QC rules and number of controls.
(The analytical Sigma-metric will be discussed
much more in the Advanced QC workbook)
Self-assessment Quiz
Questions 9-11
9. What’s the benefit of an assayed control?
a. Comes with an expected mean
b. Comes with expected kindness
c. Comes with an absolute mean and range that you can’t deviate from
10. Given a low control with a mean of 105 and an SD of 17, and a high control with a mean of 205 and an SD of 20, which control has the greater CV?
a. Low control
b. High control
c. Both controls have the same CV
11. Given the values in mg/dL 101, 109, 81, 83, 84, 95, 97, 110, 104, 100, 102, 99, 95, 100, what is the mean, SD, and CV?
a. 97.14 mg/dl mean, 8.93 mg/dl standard deviation, 9.2% CV
b. 8.93 mg/dl mean, 97.14 mg/dl standard deviation, 9.2% CV
c. 9.2% mean, 97.14 mg/dl standard deviation, 8.93 mg/dl CV
Notes
Answer Key: page 42
23
BASIC APPLICATIONS IN CLINICAL LABORATORY QUALITY CONTROLBASIC APPLICATIONS IN CLINICAL LABORATORY QUALITY CONTROL
STATISTICS
Beyond the internal statistics that a single laboratory can calculate, there are some comparative statistics
that can be calculated to give additional perspective and analysis.
Coefficient of Variation Ratio (CVR)
Calculating the Coefficient of Variation Ratio [CVR]
CVR =Peer Group CV
Within Laboratory CV
To understand whether the CV that your
laboratory is experiencing is acceptable, you can
compare it to the CV that is measure of the entire
peer group of laboratories. This is only available
if you can access the data of a peer group of
similar instruments, similar methods, similar
reagent lots, and/or similar control lots [that’s a
lot of similarities, which is why this is called a peer
group – this is a group of laboratories very close
in set-up and performance to your lab].
The CVR will tell you whether you are greater
than or less than the peer group CV. If you find
your CVR is less than 1.0, that means your CV is
less than the peer group CV. If your CVR is greater
than 1, your individual CV is larger than the CV
of the peer group. Given that a large number
of labs will have more variation than any single
laboratory, it’s a bad sign if the CVR is larger than
one. That means the laboratory has a higher than
expected amount of imprecision.
However, note that having a CVR less than 1.0 is not
a guarantee that your imprecision is acceptable.
Most labs will start troubleshooting a CVR result
in their monthly peer group program when the
result is >1.5. They may monitor the precision of
the assay once the result is >1.0 but less than 1.5
by noting “watch” on the report. However, if they
see the monthly CVR is >1.0 for more than two or
three months, they may choose to troubleshoot
the test system.
Standard Deviation Index (SDI)
Calculating the Standard Deviation Index [SDI]
SDI =(x̄Lab- x̄Group)
SGroup
This is a measurement of the difference between
the laboratory’s mean from the peer group
mean as measured by the peer group standard
deviation. While it’s a discussion of accuracy and
trueness (bias), it’s expressed in units of standard
deviation or imprecision (random error). The ideal
SDI is 0.0, which means your laboratory mean is
the exact same as the peer group mean. If your
SDI is 1.0, the difference between your laboratory
Two more common, but not essential, QC statistics
24
BASIC APPLICATIONS IN CLINICAL LABORATORY QUALITY CONTROLBASIC APPLICATIONS IN CLINICAL LABORATORY QUALITY CONTROL
STATISTICS
mean is and the peer group mean is the size of
the peer group SD. Acceptable SDI values are
not standardized, but typically SDI of 1.5 to 2.0
or higher indicates that your laboratory mean is
significantly biased away from the peer group
mean.
Please note that an SDI of less than 1.5 to 0.0 does
not necessarily mean that your bias is acceptable.
Since the peer group SD may be quite large, an
SDI of 1.0 might still indicate a very large bias.
Simply put, SDI and CVR are comparative statistics
that can be used with peer group data, that can
indicate when there are significant problems
with laboratory performance. However, having an
acceptable SDI and CVR is not a guarantee that
your laboratory is performing well.
Many proficiency testing programs use the SDI
for judging the test’s bias. If your lab “fails” the
SDI for the same test in two of three different PT
events, the lab is considered to have failed PT, and
the lab is now considered out of compliance. The
biggest consequence, the lab could be shut down
for that test.
25
BASIC APPLICATIONS IN CLINICAL LABORATORY QUALITY CONTROLBASIC APPLICATIONS IN CLINICAL LABORATORY QUALITY CONTROL
STATISTICS
Self-assessment Quiz
Questions 12-14
12. Which is more important to monitor day-to-day?
a. CV
b. CVR
c. SDI
13. If your CVR < 1, and your SDI is 1, does this indicate that you have a perfect method?
a. Yes
b. No
14. Given your lab’s mean of 4.1, and lab’s standard deviation of 0.3, and a peer group mean of 4.3, and a peer group standard deviation of 0.4, what is the CVR?
a. 1.33
b. 0.75
c. 1.0
d. 0
Notes
Answer Key: page 42
26
BASIC APPLICATIONS IN CLINICAL LABORATORY QUALITY CONTROLBASIC APPLICATIONS IN CLINICAL LABORATORY QUALITY CONTROL
GRAPHICAL TOOLS FOR QC
The Graphic Tools of QC –
learning to grasp QC at a glance
As much as statisticians love to look at numbers all day, perhaps you in the lab would prefer something
much simpler and faster to analyze. Luckily, there are tools that can summarize and depict all the
important details of QC in a graphic way.
The Histogram
When traditional statistics are analyzed, it is quite
common to review the Histogram, which displays
the stacked values of a data set. It should ideally
form a Normal curve or distribution, taking the
Bell shape.
When this shape of a curve is met, the data
conforms to a normal distribution, and thus
the standard tools of statistics can be applied.
Approximate 95% of the values can be expected
to fall within 2 SD, approximately 99.7% of the
values can be expected to fall within 3 SD. Thus,
when values are seen outside 2 or 3 SD, these are
uncommon and indicative of a potential problem.
Your lab will not usually look at a histogram,
however, as that is only useful when looking at
large sets of historical data. When you are running
a few controls a day, you need a different visual
tool.
27
BASIC APPLICATIONS IN CLINICAL LABORATORY QUALITY CONTROLBASIC APPLICATIONS IN CLINICAL LABORATORY QUALITY CONTROL
GRAPHICAL TOOLS FOR QC
The Levey-Jennings Chart
Levey and Jennings introduced statistical process
control to medical laboratories in 1950, an
adaptation of the original statistical control chart
introduced by Walter Shewhart. While Shewhart’s
original recommendation called for making a
group of measurements, calculating the average
and range (maximum difference), then plotting
the mean and range on two different control
charts, Levey and Jennings proposed making
duplicate measurements on a patient specimen.
Because the actual level of the measured
constituent varied from specimen to specimen,
this was a challenging application. Henry and
Seaglove developed an alternative procedure in
which a stable reference sample was analyzed
repeatedly, and individual measurements were
plotted directly on a control chart. This type of
control chart on which individual values or single
values are plotted directly is commonly known
today as a Levey-Jennings chart.
These charts are typically prepared with horizontal
limit lines at each standard deviation: 1, 2, 3, and
sometimes even 4 standard deviations. Levey-
Jennings charts can be prepared for the specific
mean and SD levels, or they can be prepared with
z-values that simply show a mean, and +/- 1, 2, 3
SD along the y-axis.
Once you have Levey-Jennings charts, you can
begin plotting data, run by run, level by level,
and deciding what points constitute acceptable,
“in-control” behavior, and what points represent
unacceptable, “out-of-control” behavior.
28
BASIC APPLICATIONS IN CLINICAL LABORATORY QUALITY CONTROLBASIC APPLICATIONS IN CLINICAL LABORATORY QUALITY CONTROL
WESTGARD RULES
Westgard Rules - The List of Rules
(Single rules, Westgard Rules and otherwise)
12s
12s
refers to the control rule used with a Levey-
Jennings chart with control limits set at the mean
± 2s. In the earlier era of laboratory medicine,
this rule was used as a rejection rule. Anything
outside 2 SD meant you stopped the run and had
to repeat patient samples. However, it was also
well known that this single rule generated a large
number of false rejections. As the number of tests
and test volume increased, the false rejections
began to overwhelm the laboratory. This was one
of the motivations behind the formulation of a
better approach, the multi-rule QC approach that
is now commonly called the “Westgard Rules.”
(More about that later.)
In the original “Westgard Rules", the 1:2s rule is
demoted from rejection rule to just a warning
rule. This means that the “violation” of this
warning only triggers careful inspection of the
control data by other rejection rules. By making
this modification to the 1:2s interpretation, labs
can significantly lower their false rejection rates.
29
BASIC APPLICATIONS IN CLINICAL LABORATORY QUALITY CONTROLBASIC APPLICATIONS IN CLINICAL LABORATORY QUALITY CONTROL
WESTGARD RULES
13s
13s
refers to a control rule used with a Levey-
Jennings chart with control limits set at the mean
+3s and the mean –3s. A run is rejected when a
single control measurement exceeds the mean
+3s or the mean –3s control limit.
22s
2:2s refers to the control rule used with a Levey-
Jennings chart with limits are set at the mean ±2s.
In this case, however, the run is rejected when two
consecutive control measurements exceed the
same mean +2s or the same mean –2s.
Notice that there are two ways to interpret this
rule. You can use the same control level, looking
at the current run and the previous run (looking
across runs), OR, if you are running two levels of
control, you can look at both of them within a
single run (looking across levels).
2:2s within level, across run
30
BASIC APPLICATIONS IN CLINICAL LABORATORY QUALITY CONTROLBASIC APPLICATIONS IN CLINICAL LABORATORY QUALITY CONTROL
WESTGARD RULES
R4s
Control Rule
R:4s refers to a control rule where a reject occurs
when one control measurement in a group exceeds
the mean +2s and another exceeds the mean –2s.
Note there is a special, limited application of this
rule: it can only be interpreted within a single run.
Don’t look across runs to interpret this rule.
R4s: across level, within 1 run
LEVEL 1
LEVEL 2
31
BASIC APPLICATIONS IN CLINICAL LABORATORY QUALITY CONTROLBASIC APPLICATIONS IN CLINICAL LABORATORY QUALITY CONTROL
WESTGARD RULES
41s
4:1s reject occurs when four consecutive control
measurements exceed the same mean +1s or the
same mean –1s control limit. Again, this rule can
be interpreted two ways. Within both control
levels, across a single run, OR you can interpret
this rule within a single control level, looking at
the current run and the previous three runs.
4:1s within a single level, across 3 runs
32
BASIC APPLICATIONS IN CLINICAL LABORATORY QUALITY CONTROLBASIC APPLICATIONS IN CLINICAL LABORATORY QUALITY CONTROL
WESTGARD RULES
10:x within a single level, across 10 runs
10x
10:x reject occurs when 10 consecutive control
measurements fall on one side of the mean. Again,
this rule can be interpreted two ways. Within both
control levels, across a total of five runs, OR you
can interpret this rule within a single control level,
looking at the current run and the previous nine
runs.
There are versions of this “mean rule” that work
for 6:x, 8:x, 9:x, and 12:x.
You may have noticed that most of these rules
are good for situations when you are running two
levels of control. What do you do when you have
three levels of control, which is true for some
tests? Three levels of control are frequently used
to gain more coverage of decision levels.
10:x across level, across five runs
33
BASIC APPLICATIONS IN CLINICAL LABORATORY QUALITY CONTROLBASIC APPLICATIONS IN CLINICAL LABORATORY QUALITY CONTROL
WESTGARD RULES
2 of 32s
2 of 3:2s reject occurs when two out of three
control measurements exceed the same mean
+2s or mean –2s control limit.
This is best interpreted across three levels of
control, within a single run. This replaces the 2:2s
rule.
31s
31s reject occurs when three consecutive control
measurements exceed the same mean +1s or
mean –1s control limit.
This can be interpreted within a single run, across
all three control levels, OR it can be interpreted in
a single control level, looking at the current run
and two previous runs.
At this point, you may feel a bit overwhelmed by
all the possible rules you could implement. Do
you have to use all of these? The good news is no.
In fact, there’s even better news for labs today – a
technique that allows you to reduce the number
of rules and controls you need.
3:1s, within single run, across three runs
3:1s, across levels, within single run
34
BASIC APPLICATIONS IN CLINICAL LABORATORY QUALITY CONTROLBASIC APPLICATIONS IN CLINICAL LABORATORY QUALITY CONTROL
WESTGARD RULES
Self-assessment QuizQuestions 15-21
15. Why don’t we typically look at histograms to assess day-to-day QC status and instead we examine Levey-Jennings charts?
a. Histograms make us hysterical.
b. Levey-Jennings charts give us better run to run analysis
c. Histograms require a short term, smaller set of data
d. Levey-Jennings charts require a longer term, larger set of data.
16. If the mean is 10 and the standard deviation is 1.5, where are the 2 and 3 SD limits set?
a. 10 and 20; 30 and 40
b. 7 and 13; 5.5 and 14.5
c. 7 and 13; 4 and 16
d. 8.5 and 11.5; 7 and 13
17. The notation for 1:3s as a control rule means…
a. 3 controls of +/- 1 standard deviation, on either side
b. 3 controls of +/- 1 standard deviation, all must be on one side
c. 1 control of +/- 3 standard deviations, on either side
d. 3 controls of +/- 3 standard deviations, on either side
18. The notation for R:4s as a control rule means…
a. Random error rule
b. 1 control of +/- 4 standard deviations
c. Within-run rule
d. 2 controls with one control + 2 standard deviations and one control – 2 standard deviations
19. The notation of 10:x as a control rule means…
a. X controls that are 10 standard deviations from the mean
b. 10 controls that are on both sides of the mean
c. 10 values that are x standard deviations from the mean
d. 10 controls that are all on the same side of the mean
20. Given 2 controls, implementing a 10:x rule, if 3 values on the high control are above the mean, while 7 values on the low control are above the mean, this violates the 10:x rule? Yes or No?
a. Yes
b. No
c. Not clear
21. In what order should you interpret the “Westgard Rules” or any multi-rule QC procedure?
a. All at once
b. Interpret the biggest rules (i.e. 10:x) first
c. In sequence as the flowchart shows
d. In reverse order
Answer Key: page 42
35
BASIC APPLICATIONS IN CLINICAL LABORATORY QUALITY CONTROLBASIC APPLICATIONS IN CLINICAL LABORATORY QUALITY CONTROL
HOW MANY RULES SHOULD I USE?
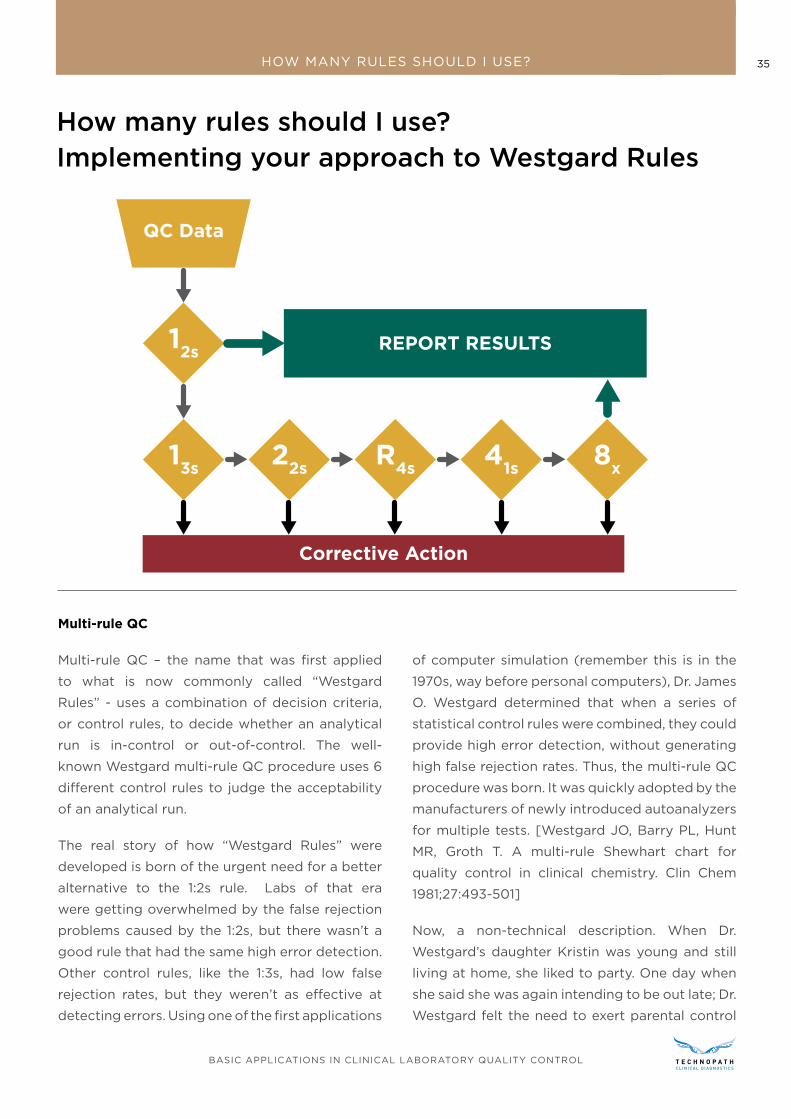
How many rules should I use? Implementing your approach to Westgard Rules
Multi-rule QC
Multi-rule QC – the name that was first applied
to what is now commonly called “Westgard
Rules” - uses a combination of decision criteria,
or control rules, to decide whether an analytical
run is in-control or out-of-control. The well-
known Westgard multi-rule QC procedure uses 6
different control rules to judge the acceptability
of an analytical run.
The real story of how “Westgard Rules” were
developed is born of the urgent need for a better
alternative to the 1:2s rule. Labs of that era
were getting overwhelmed by the false rejection
problems caused by the 1:2s, but there wasn’t a
good rule that had the same high error detection.
Other control rules, like the 1:3s, had low false
rejection rates, but they weren’t as effective at
detecting errors. Using one of the first applications
of computer simulation (remember this is in the
1970s, way before personal computers), Dr. James
O. Westgard determined that when a series of
statistical control rules were combined, they could
provide high error detection, without generating
high false rejection rates. Thus, the multi-rule QC
procedure was born. It was quickly adopted by the
manufacturers of newly introduced autoanalyzers
for multiple tests. [Westgard JO, Barry PL, Hunt
MR, Groth T. A multi-rule Shewhart chart for
quality control in clinical chemistry. Clin Chem
1981;27:493-501]
Now, a non-technical description. When Dr.
Westgard’s daughter Kristin was young and still
living at home, she liked to party. One day when
she said she was again intending to be out late; Dr.
Westgard felt the need to exert parental control
36
BASIC APPLICATIONS IN CLINICAL LABORATORY QUALITY CONTROLBASIC APPLICATIONS IN CLINICAL LABORATORY QUALITY CONTROL
HOW MANY RULES SHOULD I USE?
over her hours. So, Dr. Westgard told her that if
she was out once after three, twice after two, or
four times after one, she was in big trouble. That’s
the essence of multi-rule control.
Dr. Westgard’s daughter hates this version of the
story, and while it isn’t entirely true, it’s still a good
story and makes multi-rule QC understandable to
everyone. (By the way, she turned out fine; she
graduated first in her class at law school and
has reached the pinnacle of her corporate law
practice.)
One thing to realize is that there are additional
benefits to using the Westgard Rules. Not only do
they reduce the false rejection, but they aid in the
troubleshooting of the error by noting which rule
has been violated.
Error Condition High Pfr
High Ped
No Errors 12s
Random Error 13S
, R4S
Systematic Error2
2S, 4
1S, 2of3
2S, 3
1S
6X, 8
X, 9
X, 10
X, 12
X
Error Condition High Pfr
High Ped
When 1:3s and R:4s rules are violated, this points
toward random error as being the likely source of
the error.
When 2:2s, 3:1s, 4:1s, and 6:x or 8:x or 10:x, etc. are
violated, that points toward systematic error as
the likely source of the error.
What to do when you’re out-of-control
After all the controls are run, the points are
plotted, the rules are interpreted, what do you do
once an alarm actually goes off?
The best practice is to stop testing. Investigate
and find the source of the error, fix it, and then
resume testing. Any patient samples that were
impacted during the out-of-control period should
be retested.
Troubleshooting is the name we give to the hunt
for the source of the error. Troubleshooting is a
very individual activity – it’s impossible to create
a universal prescription on how to troubleshoot
all methods, all instruments, and all labs. Your
lab has a unique set of environmental factors,
instrument factors, even operator factors. You
will need to use all your professional judgment to
create the best troubleshooting protocol for each
of your tests.
There are, however, some general sources of
errors that all labs will face in one form or another.
Systematic Error Troubleshooting
Systematic errors are most worrisome because
when they occur, they impact larger numbers of
patients. They generally fall into two categories:
shifts and trends
Trends are gradual changes in the QC values due
to slow degradation of the test system or test
system components. In the worst-case scenario,
the errors are so slow in accumulating, you don’t
notice them. A few common examples of gradual
changes in a system include the following:
37
BASIC APPLICATIONS IN CLINICAL LABORATORY QUALITY CONTROLBASIC APPLICATIONS IN CLINICAL LABORATORY QUALITY CONTROL
HOW MANY RULES SHOULD I USE?
• Deterioration of a photometric light source,
lamp or bulb
• Deterioration of reagent
• Deterioration of control materials
• Deterioration of temperature sensitive
components
• Deterioration of electrodes
• Deterioration of filters
• Debris accumulation
You can see the general fashion in how trends
manifest themselves – components wear out,
corrode, etc.
Shifts are more abrupt and are caused by a
distinct and, in some cases, dramatic change in a
component of the test system.
If the components listed above don’t degrade
or deteriorate, but suddenly fail outright, this
could be the source of the shift. Typical examples
include the following:
• Changes in reagents, calibrators, controls
• Instrument maintenance
• Changes in temperature or humidity in the
laboratory
• Failed calibrations
• Inadequate storage of reagents or calibrators,
and, thus, degradation of the materials
• Change in sample or reagent volumes due to
pipettor maladjustments or misalignment,
• Change in temperature of incubators and
reaction blocks,
• Change in procedure from one operator to
another
This list is not meant to be exhaustive but is merely
meant to stimulate your thinking about what
could go wrong in your methods and instruments.
Random Error Troubleshooting
Problems resulting in increased random error are
much more difficult to identify and resolve, mostly
due to the nature of the error which cannot be
predicted or quantified as can systematic error.
Here are a few of the possible sources of random
error:
• bubbles in reagents and reagent lines,
• inadequately mixed reagents,
• unstable temperature and incubation,
• unstable electrical supply
• individual operator variation in pipetting,
timing, etc.
• occasional air bubbles in sample cups or
syringes
• defective unit-test devices (if you are testing
with POC devices, or cartridges, etc.)
Here’s another list that can be helpful to make
sure that everything is correctly set up in your
system:
Quality Control
• Correct material, lot number, level?
• Correctly prepared?
• Levels interchanged?
• Within stated expiration date?
• Analyzed within known stability period after
preparation?
• Correctly stored?
38
BASIC APPLICATIONS IN CLINICAL LABORATORY QUALITY CONTROLBASIC APPLICATIONS IN CLINICAL LABORATORY QUALITY CONTROL
HOW MANY RULES SHOULD I USE?
Reagents
• Correct material, lot number?
• Correctly prepared?
• Correctly loaded and used?
• Within stated expiration date?
• Correctly stored?
Calibrator
• Correct materials, lot number?
• Correctly prepared and used?
• Correct number and order?
• Correct calculations and settings?
• Within stated expiration date?
Analyzer
• Adequate periodic maintenance?
• Any recent changes?
• Materials within stated on-board stability?
• Visual inspection for problems?
Environment
• Proper water system?
• Waste disposable functioning properly?
• Temperature and humidity at proper levels?
Documenting Your Flags and Corrective Actions
Every laboratory should have a log for QC,
electronic or paper, but something where all
events and actions are recorded. This is particularly
important for errors that are observed and
troubleshot. If the same error can be fixed with a
particular corrective action, this log will help you
speed through the troubleshooting process. Also,
if multiple errors of the same type are occurring,
this log is helpful in identifying the long-term
trends and issues with performance. Finally, of
course, it is both a regulatory mandate and best
practice to maintain a history of the instrument
behavior.
39
BASIC APPLICATIONS IN CLINICAL LABORATORY QUALITY CONTROLBASIC APPLICATIONS IN CLINICAL LABORATORY QUALITY CONTROL
HOW MANY RULES SHOULD I USE?
Self-assessment QuizQuestions 22-25
22. If a 2:2s control rule is violated, what type of error is likely to have occurred?
a. Random error
b. Systematic error
c. Total error
d. Measurement uncertainty
23. If trouble-shooting a suspected systematic error, what should you check?
a. Deterioration of reagent
b. Deterioration of control materials
c. Deterioration of filters
d. All of the above and more
24. If trouble-shooting a suspected random error, what should you check?
a. Bubbles in reagents or reagent lines
b. Unstable electrical supply
c. Individual operator variation in pipetting, timing, etc.
d. All of the above and more
25. What possible events could cause a shift in control values?
a. Instrument maintenance
b. Inadequate storage of reagent or calibrators
c. Change in the temperature of the laboratory
d. All of the above and more
Notes
Answer Key: page 42
40
BASIC APPLICATIONS IN CLINICAL LABORATORY QUALITY CONTROLBASIC APPLICATIONS IN CLINICAL LABORATORY QUALITY CONTROL
A TEASER FOR THE SEQUEL
While it’s beyond the scope of this lesson, there
is an even better way to run QC: a technique that
adjusts the frequency of QC measurements to the
quality required by the observed performance of
the method. This technique is called analytical
Sigma-metrics, it’s a specific application of the
widely known Six Sigma management approach.
There’s a specific adaption of Six Sigma for
laboratory testing, and the simplest embodiment
of this is called the “Westgard Sigma Rules”
If you can determine the Sigma-metric of your
test, you can also determine how many “Westgard
Rules” are necessary to properly monitor the test.
For a Six-Sigma test, you don’t truly need multiple
rules. You can sufficiently monitor your test with
just the 1:3s rule and two controls. As your Sigma-
metric is decreased, you need more Westgard
Rules, until at 3 Sigma, you need all the Westgard
Rules and need to increase the frequency of
control runs.
What does this mean? Labs with excellent
performance can reduce the number of rules and
controls they use, which will reduce the number
of out-of-control events they must troubleshoot.
This can reduce both outright expense and staff
time spent.
A teaser for the sequel, the Advanced QC Workbook: What if you could utilize fewer rules?
Westgard Sigma Rules for 2 levels of controls. Note Sigma-scale at the bottom of the diagram. To
apply, determine Sigma-metric, locate on the Sigma Scale, identify rules above and to the left, find N
and R above the Sigma Value.
REPORT RESULTS
QC Data
12s
13s
22s
R4s
41s
8x
No
Yes
N=2R=1
N=2R=1
N=4R=1
N=2R=2
N=8R=1
N=4R=2
Yes Yes Yes Yes
No No No
6σ 5σ
Take Corrective Action
Sigma Scale = (%TEa - %Bias) / %CV
4σ 3σ
WESTGARD SIGMA RULES2 Levels of Controls
41
BASIC APPLICATIONS IN CLINICAL LABORATORY QUALITY CONTROLBASIC APPLICATIONS IN CLINICAL LABORATORY QUALITY CONTROL
GLOSSARY
Glossary
Calibrators or Calibration Materials: solutions
or devices of known quantitative/qualitative
characteristics (e.g. concentration, activity,
intensity, reactivity) used to calibrate, graduate, or
adjust a measurement procedure or to compare
the response obtained with the response of a test
specimen/sample.
Coefficient of Variation (CV): a calculation that
allows you to monitor the imprecision across
multiple control levels, even compare imprecision
between methods and instruments, and compare
them against the manufacturer’s expectations.
The lower the CV, the lower the test system’s
imprecision.
Coefficient of Variation Ratio (CVR): This
calculation will allow you to assess if the CV of
your test system is comparable to other systems
exactly like yours. This is usually provided with
QC and QA peer group programs.
Commutability is the goal of any type of control
– that the control material is as close as possible
to a real patient sample. This attribute provides
confidence that when the device produces a
control value out of range - thus indicating that
the test system has a problem, you can be certain
that the patient sample results would be incorrect
as well.
Embedded Quality Control: control materials
contained in on-board ampules or cartridges,
provided they have similar matrices to patient
specimens and follow all steps of the analytical
process, those control materials.
Frozen: certain controls can be kept frozen for a
long period of time
Liquid: These are controls that are ready to go, no
reconstitution step required.
Lyophilized: this is freeze-dried
Matrix Effect: The matrix of a control is all the extra
stabilizers, preservatives, and other ingredients
that are present that are wholly unrelated to a
patient sample. These additives may help keep
the control material stable, or have a longer shelf
life, but they do not make the control behave
similarly to a patient sample
Mean: Also referred to as the average.
Qualitative Tests: tests that give results that are
descriptive, not numerical. For example, “positive”
or “negative”, “present” or “absent”, etc.
Quality Control material: a substance, material,
or article intended by the manufacturer to be
used to verify the performance characteristics of
an in vitro diagnostic medical device (ISO 17593).
Quantitative Tests: these are tests that give
results expressing a numerical amount or level
(concentration) of an analyte in a specimen.
Random Errors: these errors are much more
difficult to identify and resolve, mostly due to the
nature of the error which cannot be predicted or
quantified as can systematic error. Some describe
these as “flukes”.
Semi-Quantitative tests: these are tests that
have “a dose-response gradient that may be
included in the reported result, but for which no
authoritative calibration scale exists to determine
inaccuracy and imprecision; tests that yield
results in an approximate range of values (e.g.,
trace, moderate)” [ISO and CLSI].
42
BASIC APPLICATIONS IN CLINICAL LABORATORY QUALITY CONTROLBASIC APPLICATIONS IN CLINICAL LABORATORY QUALITY CONTROL
GLOSSARY
Shift: This is an abrupt change in the QC results
and are caused by a distinct and, in some cases,
dramatic change in a component of the test
system. This is a systematic error.
Standard: measurement material measure,
measuring instrument, reference material or
measuring system intended to define, realize,
conserve or reproduce a unit or one or more
values of a quantity to serve as a reference.
Standard Deviation: a measurement of how
closely the control values cluster around the
mean, how tightly packed they are around the
mean, or how widely dispersed they are away
from the mean.
Standard Deviation Index (SDI): This is a
measurement of the difference between the
laboratory’s mean from the peer group mean as
measured by the peer group standard deviation.
While it’s a discussion of accuracy and trueness
(bias), it’s expressed in units of standard deviation
or imprecision (random error).
Systematic Errors: See trends and shift definitions.
Trend: This is usually observed with the QC
values gradually increase or decrease over time
on the Levey-Jennings chart. This is indicative of
a systematic error.
Self-assessment Quiz - Answer Key1. What is Quality Control? [Correct Response: d]
2. If your test only produces positive and negative results? [Correct Response: b]
3. When do you NOT use statistical QC? [Correct Response: c]
4. When should you calibrate your method? [Correct Response: c]
5. How often should you calibrate? [Correct Response: c]
6. Which is better, according to CMS? [Correct Response: a]
7. Which type of controls is freeze-dried? [Correct Response: a]
8. Which control materials will have results closer to patient values? [Correct Response: a]
9. What’s the benefit of an assayed control? [Correct Response: a]
10. Given a low control with a mean of 105 and an SD of 17, and a high control with a mean of 205 and an SD of 20, which control has the greater CV? [Correct Response: a]
11. Given the values in mg/dL 101, 109, 81, 83, 84, 95, 97, 110, 104, 100, 102, 99, 95, 100, what is the mean, SD, and CV? [Correct Response: a]
12. Which is more important to monitor day-to-day? [Correct Response: a]
13. If your CVR < 1, and your SDI is 1, does this indicate that you have a perfect method? [Correct Response: b]
14. Given your lab’s mean of 4.1, and lab’s standard deviation of 0.3, and a peer group mean of 4.3,
and a peer group standard deviation of 0.4, what is the CVR? [Correct Response: b]
15. Why don’t we typically look at histograms to assess day-to-day QC status and instead we examine Levey-Jennings charts? [Correct Response: b]
16. If the mean is 10 and the standard deviation is 1.5, where are the 2 and 3 SD limits set? [Correct Response: b]
17. The notation for 1:3s as a control rule means… [Correct Response: c]
18. The notation for R:4s as a control rule means… [Correct Response: d]
19. The notation of 10:x as a control rule means… [Correct Response: d]
20. Given 2 controls, implementing a 10:x rule, if 3 values on the high control are above the mean, while 7 values on the low control are above the mean, this violates the 10:x rule? Yes or No? [Correct Response: b]
21. In what order should you interpret the “Westgard Rules” or any multi-rule QC procedure? [Correct Response: c]
22. If a 2:2s control rule is violated, what type of error is likely to have occurred? [Correct Response: b]
23. If trouble-shooting a suspected systematic error, what should you check? [Correct Response: d]
24. If trouble-shooting a suspected random error, what should you check? [Correct Response: d]
25. What possible events could cause a shift in control values? [Correct Response: d]
43
BASIC APPLICATIONS IN CLINICAL LABORATORY QUALITY CONTROLBASIC APPLICATIONS IN CLINICAL LABORATORY QUALITY CONTROL