INTERNATIONAL JOURNAL OF CLIMATOLOGY Int. J. Climatol. 28: 1889–1901 (2008) Published online 28 March 2008 in Wiley InterScience (www.interscience.wiley.com) DOI: 10.1002/joc.1679 Pacific and Indian Ocean climate signals in a tree-ring record of Java monsoon drought Rosanne D’Arrigo, a * Rob Allan, b Rob Wilson, c Jonathan Palmer, d John Sakulich, g Jason E. Smerdon, a Satria Bijaksana e and La Ode Ngkoimani f a Lamont-Doherty Earth Observatory, Palisades, NY, USA b Hadley Centre for Climate Change, UK Met Office, Exeter, United Kingdom, UK c University of St. Andrews, St. Andrews, UK d Gondwana Tree-Ring Laboratory, PO Box 14, Little River, Canterbury 7546, New Zealand e Bandung Technical University, Bandung, Indonesia f Jurusan Fisika FMIPA, Universitas Haluoleo, Sulawesi, Indonesia g University of Tennessee, Knoxville, Tennessee ABSTRACT: Extreme climate conditions have dramatic socio-economic impacts on human populations across the tropics. In Indonesia, severe drought and floods have been associated with El Ni˜ no-Southern Oscillation (ENSO) events that originate in the tropical Indo-Pacific region. Recently, an Indian Ocean dipole mode (IOD) in sea surface temperature (SST) has been proposed as another potential cause of drought and flood extremes in western Indonesia and elsewhere around the Indian Ocean rim. The nature of such variability and its degree of independence from the ENSO system are topics of recent debate, but understanding is hampered by the scarcity of long instrumental records for the tropics. Here, we describe a tree-ring reconstruction of the Palmer Drought Severity Index (PDSI) for Java, Indonesia, that preserves a history of ENSO and IOD-related extremes over the past 217 years. Extreme Javan droughts correspond well to known ENSO and IOD events in recent decades, and most extreme droughts before this recent period can be explained by known ENSO episodes. Coral proxies from regions near or within the two poles of the IOD show good agreement with Javan PDSI extremes over the past ∼150 years. The El Ni˜ no of 1877, in conjunction with a positive IOD, was one of the most intense and widespread episodes of the past two centuries, based on instrumental and proxy data from across the tropical Indo-Pacific and Asian monsoon regions. Although Java droughts typically show the expected association with El Ni˜ no-like conditions and failed Indian monsoons, others (mainly linked to positive IOD conditions) co-occur with a strengthened Indian monsoon, suggesting linkages between the Indian monsoon, Indonesian drought and Indian Ocean climatic variability. The close associations between the Java PDSI, ENSO and Indian Ocean climate are consistent with the hypothesis that interannual ENSO to decadal ENSO-like modes interact to generate dipole-like Indian Ocean variability. Copyright 2008 Royal Meteorological Society KEY WORDS Indian Ocean; tree rings; PDSI; drought; monsoon; dipole; ENSO; Indonesia Received 4 June 2007; Revised 6 December 2007; Accepted 8 December 2007 1. Introduction The core physical ocean–atmosphere interactions underlying the El Ni˜ no-Southern Oscillation (ENSO) phenomenon are centered on the Indo-Pacific region, but its climatic impacts can be of global extent (Allan et al., 2003). The dominant influence of ENSO on the Indian Ocean does not preclude, however, the possible existence of more independent modes of Indian Ocean variability. It has been proposed that an Indian Ocean dipole mode (IOD) exists that is largely distinct from ENSO and contributes significantly to climate around the Indian Ocean rim (Saji et al., 1999; Webster et al., 1999; Behera et al., 2006) and the globe (Saji and Yam- agata, 2003). The Dipole Mode Index (DMI) is defined * Correspondence to: Rosanne D’Arrigo, Tree-Ring Laboratory, Lamont-Doherty Earth Observatory, 61 Route 9W, Palisades, NY 10964, USA. E-mail: [email protected]as the sea surface temperature (SST) difference between the western (50 ° –70 ° E, 10 ° S–10 ° N, off Kenya) and eastern (90 ° –110 ° E, 0 ° –10 ° S, off Java/Sumatra) Indian Ocean. During what have been described as positive IOD events, a cold SST anomaly forms in the east- ern Indian Ocean during the boreal summer and fall, contributing to drought conditions over western Indone- sia. These cold SSTs are linked, via various positive feedbacks, to intensified southeasterly trade winds, shal- lowing of the thermocline and other physical changes in the eastern Indian Ocean (Saji et al., 1999). Mean- while, warm SST anomalies occur in the western Indian Ocean, intensifying rainfall in eastern Africa. Opposite patterns are typically observed during negative IODs, although anomalies are not typically as strong as those during the positive IOD mode. Over Java/Sumatra, pos- itive (negative) IODs tend to result in intense drought (wet) extremes, with anomalies of the same sign as those Copyright 2008 Royal Meteorological Society
Transcript
INTERNATIONAL JOURNAL OF CLIMATOLOGYInt. J. Climatol. 28: 1889–1901 (2008)Published online 28 March 2008 in Wiley InterScience(www.interscience.wiley.com) DOI: 10.1002/joc.1679
Pacific and Indian Ocean climate signals in a tree-ringrecord of Java monsoon drought
Rosanne D’Arrigo,a* Rob Allan,b Rob Wilson,c Jonathan Palmer,d John Sakulich,g
Jason E. Smerdon,a Satria Bijaksanae and La Ode Ngkoimanifa Lamont-Doherty Earth Observatory, Palisades, NY, USA
b Hadley Centre for Climate Change, UK Met Office, Exeter, United Kingdom, UKc University of St. Andrews, St. Andrews, UK
d Gondwana Tree-Ring Laboratory, PO Box 14, Little River, Canterbury 7546, New Zealande Bandung Technical University, Bandung, Indonesia
f Jurusan Fisika FMIPA, Universitas Haluoleo, Sulawesi, Indonesiag University of Tennessee, Knoxville, Tennessee
ABSTRACT: Extreme climate conditions have dramatic socio-economic impacts on human populations across the tropics.In Indonesia, severe drought and floods have been associated with El Nino-Southern Oscillation (ENSO) events thatoriginate in the tropical Indo-Pacific region. Recently, an Indian Ocean dipole mode (IOD) in sea surface temperature(SST) has been proposed as another potential cause of drought and flood extremes in western Indonesia and elsewherearound the Indian Ocean rim. The nature of such variability and its degree of independence from the ENSO system aretopics of recent debate, but understanding is hampered by the scarcity of long instrumental records for the tropics. Here,we describe a tree-ring reconstruction of the Palmer Drought Severity Index (PDSI) for Java, Indonesia, that preserves ahistory of ENSO and IOD-related extremes over the past 217 years. Extreme Javan droughts correspond well to knownENSO and IOD events in recent decades, and most extreme droughts before this recent period can be explained byknown ENSO episodes. Coral proxies from regions near or within the two poles of the IOD show good agreement withJavan PDSI extremes over the past ∼150 years. The El Nino of 1877, in conjunction with a positive IOD, was one ofthe most intense and widespread episodes of the past two centuries, based on instrumental and proxy data from acrossthe tropical Indo-Pacific and Asian monsoon regions. Although Java droughts typically show the expected associationwith El Nino-like conditions and failed Indian monsoons, others (mainly linked to positive IOD conditions) co-occurwith a strengthened Indian monsoon, suggesting linkages between the Indian monsoon, Indonesian drought and IndianOcean climatic variability. The close associations between the Java PDSI, ENSO and Indian Ocean climate are consistentwith the hypothesis that interannual ENSO to decadal ENSO-like modes interact to generate dipole-like Indian Oceanvariability. Copyright 2008 Royal Meteorological Society
KEY WORDS Indian Ocean; tree rings; PDSI; drought; monsoon; dipole; ENSO; Indonesia
Received 4 June 2007; Revised 6 December 2007; Accepted 8 December 2007
1. Introduction
The core physical ocean–atmosphere interactionsunderlying the El Nino-Southern Oscillation (ENSO)phenomenon are centered on the Indo-Pacific region,but its climatic impacts can be of global extent (Allanet al., 2003). The dominant influence of ENSO on theIndian Ocean does not preclude, however, the possibleexistence of more independent modes of Indian Oceanvariability. It has been proposed that an Indian Oceandipole mode (IOD) exists that is largely distinct fromENSO and contributes significantly to climate aroundthe Indian Ocean rim (Saji et al., 1999; Webster et al.,1999; Behera et al., 2006) and the globe (Saji and Yam-agata, 2003). The Dipole Mode Index (DMI) is defined
* Correspondence to: Rosanne D’Arrigo, Tree-Ring Laboratory,Lamont-Doherty Earth Observatory, 61 Route 9W, Palisades, NY10964, USA. E-mail: [email protected]
as the sea surface temperature (SST) difference betweenthe western (50° –70 °E, 10 °S–10°N, off Kenya) andeastern (90° –110 °E, 0° –10 °S, off Java/Sumatra) IndianOcean. During what have been described as positiveIOD events, a cold SST anomaly forms in the east-ern Indian Ocean during the boreal summer and fall,contributing to drought conditions over western Indone-sia. These cold SSTs are linked, via various positivefeedbacks, to intensified southeasterly trade winds, shal-lowing of the thermocline and other physical changesin the eastern Indian Ocean (Saji et al., 1999). Mean-while, warm SST anomalies occur in the western IndianOcean, intensifying rainfall in eastern Africa. Oppositepatterns are typically observed during negative IODs,although anomalies are not typically as strong as thoseduring the positive IOD mode. Over Java/Sumatra, pos-itive (negative) IODs tend to result in intense drought(wet) extremes, with anomalies of the same sign as those
Copyright 2008 Royal Meteorological Society
1890 R. D’ARRIGO ET AL.
that occur during El Nino (La Nina) episodes. EquatorialIndian Ocean zonal wind anomalies (EQWIN) are anotherclosely related atmospheric component of Indian Oceanvariability linked to the IOD and the Indian monsoon(Gadgil et al., 2004; Ihara et al., 2007), and are closelylinked to ENSO variability (Wright et al., 1985).
Other researchers have argued that the IOD in itsevolution, frequency spectrum, SST pattern and pro-posed near-global influence is simply another phaseof the ocean–atmosphere interactions underlying Indo-Pacific ENSO variability, that results from the interactionof quasi-biennial, ‘classical’ ENSO and quasi-decadalENSO-like signals in SST and sea level pressure (SLP)(Allan et al., 2001; Baquero-Bernal et al., 2002; Dom-menget and Latif, 2002; Allan et al., 2003). These modescan combine and interact to produce protracted ENSOconditions, with negative or positive phasing, over theIndian Ocean sector (Allan and D’Arrigo, 1999; Allan,2000; Allan et al., 2003). Allan et al. (2003) have indi-cated that the bulk of IOD events of either sign occurin conjunction with some type of El Nino or La Ninaevent or episode. In this view, there are a range of dif-ferent types of ENSO events and episodes which canbe strong to weak in magnitude, short to ‘protracted’ intemporal extent, or even of abortive nature. Addition-ally, Allan et al. (2001, 2003) stress that the interpretationof Indian Ocean domain-only empirical orthogonal func-tion (EOF) analysis in IOD studies fails to recognizethat, though orthogonal at zero lag, the first two EOFmodes are confounded and have considerable shared vari-ance, being significantly correlated at leads and lags ofaround nine months. Thus, the second EOF mode (theIOD) is simply representative of another phase of thefirst EOF mode (ENSO). Similar restricted domain EOFand singular value decomposition (SVD) analyses in thePacific Ocean by Trenberth and Stepaniak (2001) andKumar et al. (2006) have encountered a similar situationto the Indian Ocean, but report that their first and secondEOF/SVD modes are simply different ‘flavours’ of theENSO response in that ocean basin. Alternatively, ENSOmay be only one of several potential triggers for dipole-type conditions in the Indian Ocean (Fischer et al., 2005).
A better understanding of the complex interactionsbetween ENSO and Indian Ocean climate requires longertime series for analysis than those presently availablefrom instrumental data. High-resolution tropical proxyrecords, mainly derived from tree rings, corals and icecores, yield valuable information on past climate, butsuch records are relatively rare for the Indian Oceanand surrounding land areas. Among such proxies, coralrecords of SST for the western Indian Ocean (Figure 1)have been published for Malindi, Kenya (Cole et al.,2000; Kayanne et al., 2006) and for the Seychelles(Charles et al., 1997; Pfeiffer and Dullo, 2006). Bothsites lie within or near the western pole of the IOD andhave been used in these studies to demonstrate annual todecadal-scale impacts of ENSO on Indian Ocean climate.A combined Seychelles coral record (Charles et al., 1997;Pfeiffer and Dullo, 2006) produced seasonal correlations
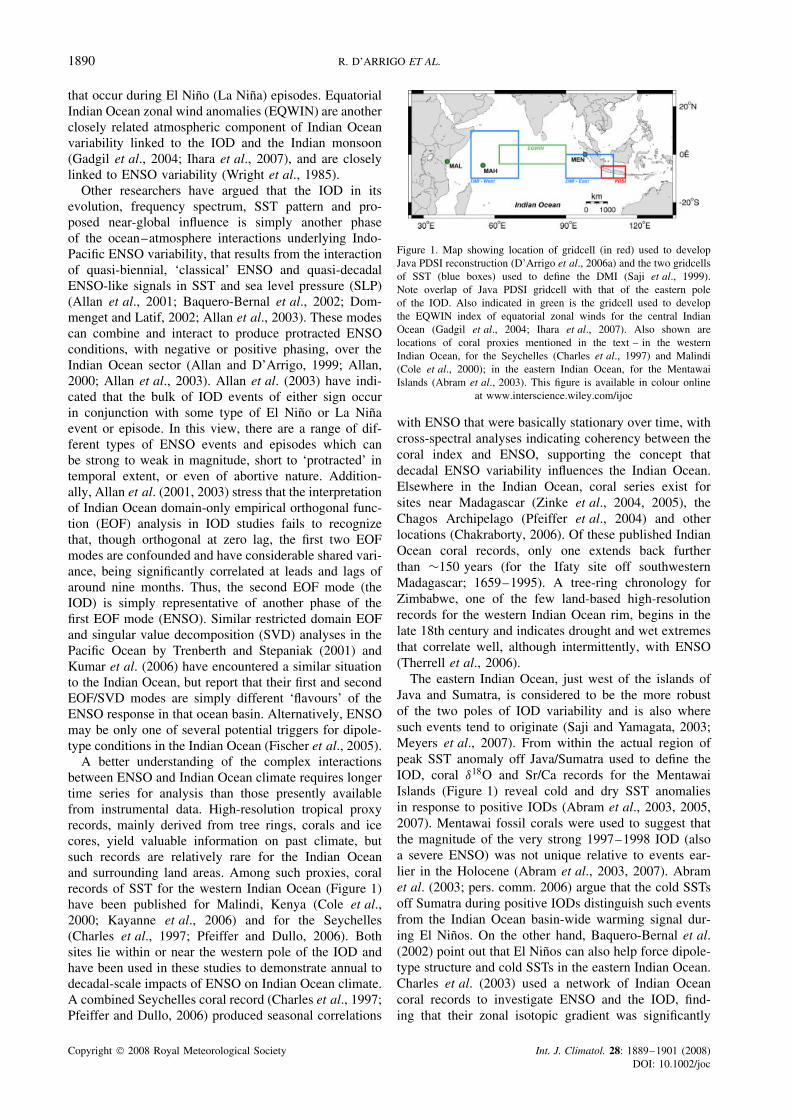
Figure 1. Map showing location of gridcell (in red) used to developJava PDSI reconstruction (D’Arrigo et al., 2006a) and the two gridcellsof SST (blue boxes) used to define the DMI (Saji et al., 1999).Note overlap of Java PDSI gridcell with that of the eastern poleof the IOD. Also indicated in green is the gridcell used to developthe EQWIN index of equatorial zonal winds for the central IndianOcean (Gadgil et al., 2004; Ihara et al., 2007). Also shown arelocations of coral proxies mentioned in the text – in the westernIndian Ocean, for the Seychelles (Charles et al., 1997) and Malindi(Cole et al., 2000); in the eastern Indian Ocean, for the MentawaiIslands (Abram et al., 2003). This figure is available in colour online
at www.interscience.wiley.com/ijoc
with ENSO that were basically stationary over time, withcross-spectral analyses indicating coherency between thecoral index and ENSO, supporting the concept thatdecadal ENSO variability influences the Indian Ocean.Elsewhere in the Indian Ocean, coral series exist forsites near Madagascar (Zinke et al., 2004, 2005), theChagos Archipelago (Pfeiffer et al., 2004) and otherlocations (Chakraborty, 2006). Of these published IndianOcean coral records, only one extends back furtherthan ∼150 years (for the Ifaty site off southwesternMadagascar; 1659–1995). A tree-ring chronology forZimbabwe, one of the few land-based high-resolutionrecords for the western Indian Ocean rim, begins in thelate 18th century and indicates drought and wet extremesthat correlate well, although intermittently, with ENSO(Therrell et al., 2006).
The eastern Indian Ocean, just west of the islands ofJava and Sumatra, is considered to be the more robustof the two poles of IOD variability and is also wheresuch events tend to originate (Saji and Yamagata, 2003;Meyers et al., 2007). From within the actual region ofpeak SST anomaly off Java/Sumatra used to define theIOD, coral δ18O and Sr/Ca records for the MentawaiIslands (Figure 1) reveal cold and dry SST anomaliesin response to positive IODs (Abram et al., 2003, 2005,2007). Mentawai fossil corals were used to suggest thatthe magnitude of the very strong 1997–1998 IOD (alsoa severe ENSO) was not unique relative to events ear-lier in the Holocene (Abram et al., 2003, 2007). Abramet al. (2003; pers. comm. 2006) argue that the cold SSTsoff Sumatra during positive IODs distinguish such eventsfrom the Indian Ocean basin-wide warming signal dur-ing El Ninos. On the other hand, Baquero-Bernal et al.(2002) point out that El Ninos can also help force dipole-type structure and cold SSTs in the eastern Indian Ocean.Charles et al. (2003) used a network of Indian Oceancoral records to investigate ENSO and the IOD, find-ing that their zonal isotopic gradient was significantly
Copyright 2008 Royal Meteorological Society Int. J. Climatol. 28: 1889–1901 (2008)DOI: 10.1002/joc
INDIAN OCEAN CLIMATE AND JAVA TREE RINGS 1891
correlated with central Pacific SSTs, and that this coraldipole resulted from strong ENSO-like teleconnections inthe Indian Ocean, as opposed to being the result of uniqueIndian Ocean or monsoonal dynamics. More importantly,Allan et al. (2001, 2003) and Reason et al. (2000) haveshown that the austral spring Indian Ocean SST pattern ofthe IOD is identical to that of ENSO events in that seasonand ocean basin, and that the basin-wide SST responseacross the Indian Ocean reported above is only seen atthe peak ENSO phase in the austral summer.
Here we use a tree-ring-based reconstruction of theboreal fall (Oct–Nov) Palmer Drought Severity Index(PDSI) for Java, Indonesia (D’Arrigo et al., 2006a) toinvestigate drought and wetness extremes, and theirrelation to Indian Ocean and ENSO variability over thepast two centuries. Positive (negative) PDSI indicates wet(dry) conditions. Because Indonesia is uniquely situatedbetween the Pacific and Indian Oceans, its rainfall isimpacted by SST variability in both basins (Aldrianand Susanto, 2003). Java, along with the island ofSumatra and the adjacent smaller islands, experiencesthe greatest Indian Ocean-related climate impacts in allof Indonesia (Saji and Yamagata, 2003). Indonesian tree-ring and coral records were used previously to reconstructwestern Pacific warm pool SSTs in relation to ENSO(D’Arrigo et al., 2006b). We demonstrate that the JavaPDSI reconstruction, derived from a land area thatoverlaps the eastern pole of the IOD (Figure 1), alsocaptures features of Indian Ocean climate. At 217 yearsin length, it is one of the longest continuous, high-resolution records available for investigating rainfallvariability in the tropical Indo-Pacific. We also comparethe PDSI reconstruction to other high-resolution proxiesfrom the Indian Ocean to assess spatial variations in IODand ENSO-related impacts over the past two centuries.The conceptual framework of the paper is, therefore, toassess the interrelationships between ENSO, the IOD, andthe Indian monsoon, using both instrumental and high-resolution proxy climate records for the tropical Indo-Pacific region.
2. Data and methods
2.1. Instrumental data:
We use the monthly DMI of Saji et al. (1999; http://www.jamstec.go.jp/frsgc/research/d1/iod/), defined in theIntroduction, which begins in 1958. The two SST boxesused to define the DMI are indicated in Figure 1. Decadalperiodicities (longer than 7 years) were removed by Sajiet al. (1999) in calculating their index. We also use theglobal SST dataset of Kaplan et al. (1998), as well as anextended DMI (1869–2002) based on these data (fromthe IOD website cited above). The extended record, how-ever, includes early periods of relatively sparse datacoverage (with possibly spurious values) for which datawas interpolated (Kaplan et al., 1998). For compari-son, a version of the DMI was also created from theHADSST2 dataset (Rayner et al., 2006). A monthly index
of zonal surface wind anomalies for EQWIN is used fromICOADS data for averaged anomalies over 62° –90 °E,4°N–4 °S, for 1881–1997 (Worley et al., 2005). Rain-fall data were obtained from the Global PrecipitationClimatology Centre (GPCC) Variability Analysis of Sur-face Climate Observations (version Vasclim-0 0.5, Becket al., 2005) precipitation dataset from 1951 to 2000.Also used in this study are standard ENSO indices(http://www.cpc.noaa.gov), including Nino-3.4 SSTs; theJakarta rain days record (Konnen et al., 1998), the all-India monsoon index (http://www.tropmet.res.in/) and theIndian monsoon index of Sontakke et al. (1993), Son-takke and Singh (1996). An index of the Southern Oscil-lation (SOI) was developed from the gridcells represent-ing Tahiti and Darwin from the HADSLP2 dataset (Allanand Ansell, 2006).
2.2. Proxy data
The boreal fall PDSI reconstruction, described in detailin D’Arrigo et al. (2006a), spans the interval from 1787to 2003 (instrumental values were spliced onto the PDSIreconstruction after 1988 following adjustment for meanand variance). The PDSI incorporates parameters of bothrainfall and temperature and is a proxy for soil moistureand streamflow (Dai et al., 2004; see D’Arrigo et al.,2006a for further details). Based on nine Javan tree-ring records of teak (Tectona grandis) and one coralseries, the reconstruction is reasonably well validated andis used herein to evaluate Indian Ocean-related PDSIvariability for the eastern pole of the IOD (Figure 1),complementing the eastern Indian Ocean coral data(Abram et al., 2003, time series not available). ThisJava reconstruction is most sensitive to adverse climaticevents such as drought (rather than more favorablewetter conditions), as has been found for other tree-ring series (Fritts, 1976). For the western Indian Ocean,we compare the PDSI reconstruction to the Seychellescoral δ18O record (Charles et al., 1997; 1846–1994;detrended for the boreal fall season), which is availableat monthly resolution, unlike the Malindi, Kenya series.Note, however, that the Seychelles and Mentawai recordsdate back only a few decades prior to the extendedDMI. We also evaluate the proxy data in relation toother Indian Ocean, Indian monsoon and ENSO-relatedindices (Table I, Figure 1). See Table II for a listing ofacronyms and data used in this study. Instrumental data-based listings of IODs and ENSO events in Saji andYamagata (2003), and the consensus ENSO listings oftwo sources:
1. J. Null (2004; http://ggweather.com/enso/years.htm);El Nino and La Nina Years: A consensus listing,using events that appear on 3/4 of the following 4widely used lists: Western Region Climate Center, Cli-mate Diagnostics Center, Climate Prediction Center,Multivariate ENSO Index from Climate DiagnosticsCenter; and
2. D. O’Sullivan (1994): http://www.longpaddock.qld.gov.au/Help/ElNinoSouthernOscillation/
Copyright 2008 Royal Meteorological Society Int. J. Climatol. 28: 1889–1901 (2008)DOI: 10.1002/joc
1892 R. D’ARRIGO ET AL.
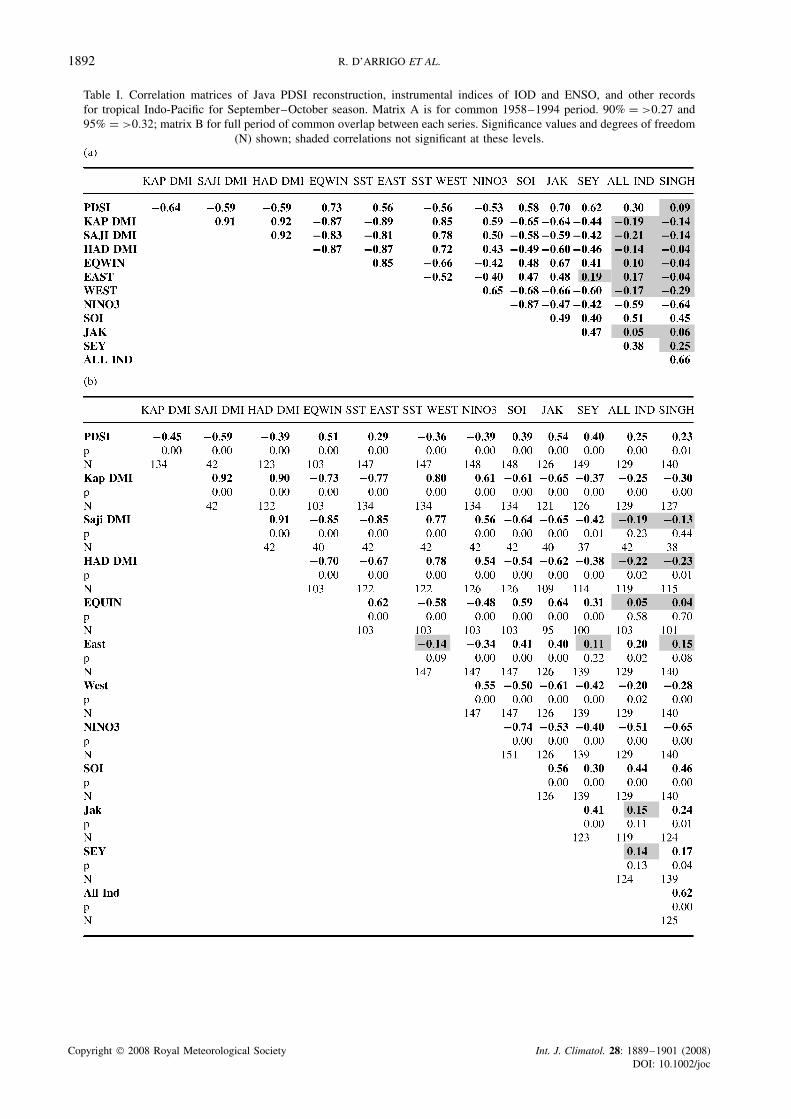
Table I. Correlation matrices of Java PDSI reconstruction, instrumental indices of IOD and ENSO, and other recordsfor tropical Indo-Pacific for September–October season. Matrix A is for common 1958–1994 period. 90% = >0.27 and95% = >0.32; matrix B for full period of common overlap between each series. Significance values and degrees of freedom
(N) shown; shaded correlations not significant at these levels.
Copyright 2008 Royal Meteorological Society Int. J. Climatol. 28: 1889–1901 (2008)DOI: 10.1002/joc
INDIAN OCEAN CLIMATE AND JAVA TREE RINGS 1893
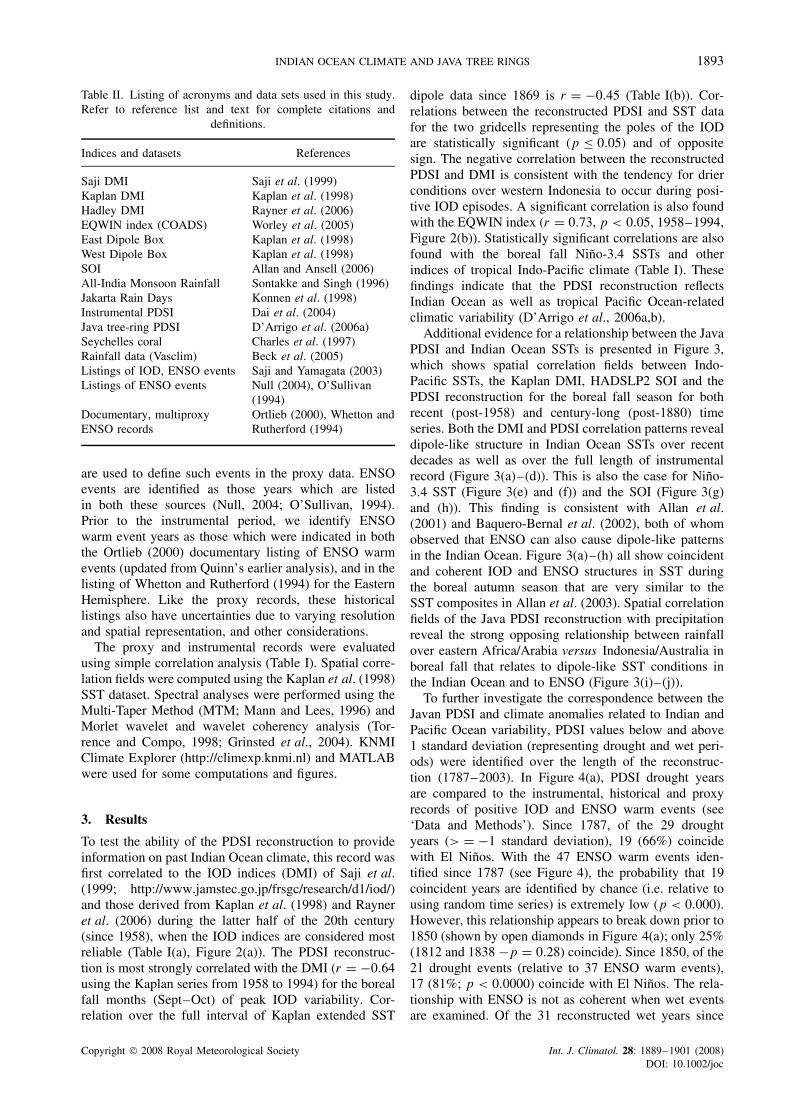
Table II. Listing of acronyms and data sets used in this study.Refer to reference list and text for complete citations and
definitions.
Indices and datasets References
Saji DMI Saji et al. (1999)Kaplan DMI Kaplan et al. (1998)Hadley DMI Rayner et al. (2006)EQWIN index (COADS) Worley et al. (2005)East Dipole Box Kaplan et al. (1998)West Dipole Box Kaplan et al. (1998)SOI Allan and Ansell (2006)All-India Monsoon Rainfall Sontakke and Singh (1996)Jakarta Rain Days Konnen et al. (1998)Instrumental PDSI Dai et al. (2004)Java tree-ring PDSI D’Arrigo et al. (2006a)Seychelles coral Charles et al. (1997)Rainfall data (Vasclim) Beck et al. (2005)Listings of IOD, ENSO events Saji and Yamagata (2003)Listings of ENSO events Null (2004), O’Sullivan
(1994)Documentary, multiproxyENSO records
Ortlieb (2000), Whetton andRutherford (1994)
are used to define such events in the proxy data. ENSOevents are identified as those years which are listedin both these sources (Null, 2004; O’Sullivan, 1994).Prior to the instrumental period, we identify ENSOwarm event years as those which were indicated in boththe Ortlieb (2000) documentary listing of ENSO warmevents (updated from Quinn’s earlier analysis), and in thelisting of Whetton and Rutherford (1994) for the EasternHemisphere. Like the proxy records, these historicallistings also have uncertainties due to varying resolutionand spatial representation, and other considerations.
The proxy and instrumental records were evaluatedusing simple correlation analysis (Table I). Spatial corre-lation fields were computed using the Kaplan et al. (1998)SST dataset. Spectral analyses were performed using theMulti-Taper Method (MTM; Mann and Lees, 1996) andMorlet wavelet and wavelet coherency analysis (Tor-rence and Compo, 1998; Grinsted et al., 2004). KNMIClimate Explorer (http://climexp.knmi.nl) and MATLABwere used for some computations and figures.
3. Results
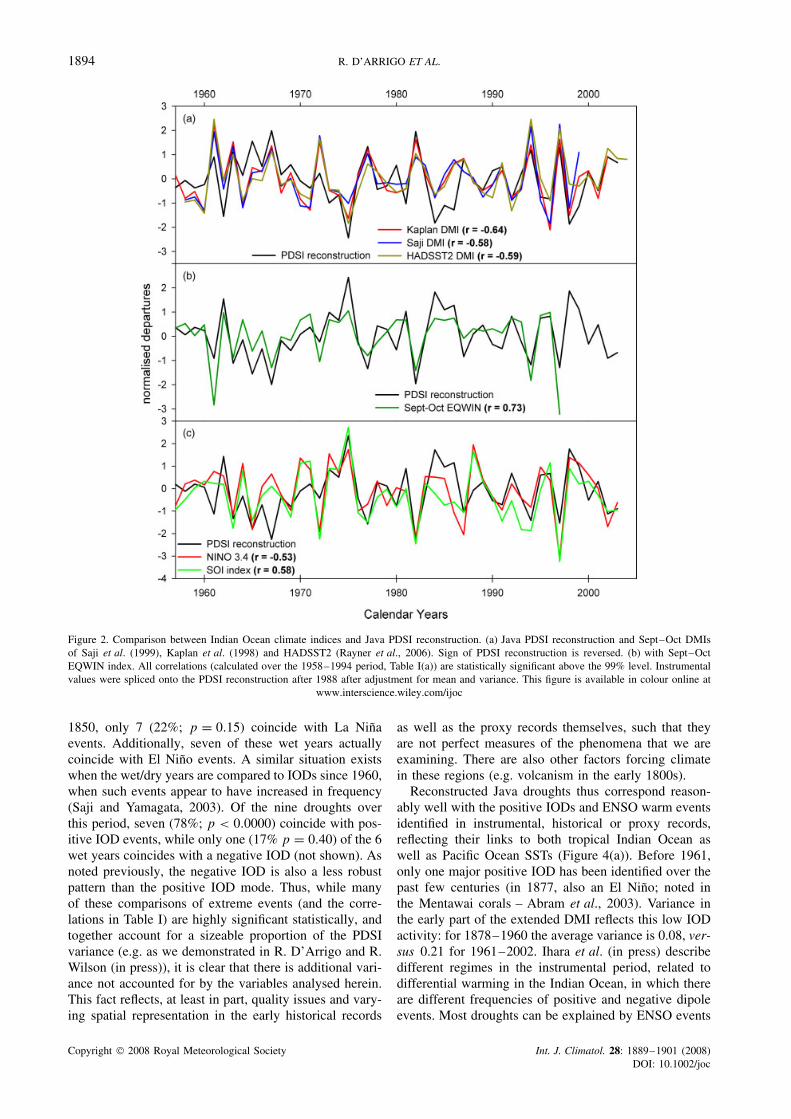
To test the ability of the PDSI reconstruction to provideinformation on past Indian Ocean climate, this record wasfirst correlated to the IOD indices (DMI) of Saji et al.(1999; http://www.jamstec.go.jp/frsgc/research/d1/iod/)and those derived from Kaplan et al. (1998) and Rayneret al. (2006) during the latter half of the 20th century(since 1958), when the IOD indices are considered mostreliable (Table I(a), Figure 2(a)). The PDSI reconstruc-tion is most strongly correlated with the DMI (r = −0.64using the Kaplan series from 1958 to 1994) for the borealfall months (Sept–Oct) of peak IOD variability. Cor-relation over the full interval of Kaplan extended SST
dipole data since 1869 is r = −0.45 (Table I(b)). Cor-relations between the reconstructed PDSI and SST datafor the two gridcells representing the poles of the IODare statistically significant (p ≤ 0.05) and of oppositesign. The negative correlation between the reconstructedPDSI and DMI is consistent with the tendency for drierconditions over western Indonesia to occur during posi-tive IOD episodes. A significant correlation is also foundwith the EQWIN index (r = 0.73, p < 0.05, 1958–1994,Figure 2(b)). Statistically significant correlations are alsofound with the boreal fall Nino-3.4 SSTs and otherindices of tropical Indo-Pacific climate (Table I). Thesefindings indicate that the PDSI reconstruction reflectsIndian Ocean as well as tropical Pacific Ocean-relatedclimatic variability (D’Arrigo et al., 2006a,b).
Additional evidence for a relationship between the JavaPDSI and Indian Ocean SSTs is presented in Figure 3,which shows spatial correlation fields between Indo-Pacific SSTs, the Kaplan DMI, HADSLP2 SOI and thePDSI reconstruction for the boreal fall season for bothrecent (post-1958) and century-long (post-1880) timeseries. Both the DMI and PDSI correlation patterns revealdipole-like structure in Indian Ocean SSTs over recentdecades as well as over the full length of instrumentalrecord (Figure 3(a)–(d)). This is also the case for Nino-3.4 SST (Figure 3(e) and (f)) and the SOI (Figure 3(g)and (h)). This finding is consistent with Allan et al.(2001) and Baquero-Bernal et al. (2002), both of whomobserved that ENSO can also cause dipole-like patternsin the Indian Ocean. Figure 3(a)–(h) all show coincidentand coherent IOD and ENSO structures in SST duringthe boreal autumn season that are very similar to theSST composites in Allan et al. (2003). Spatial correlationfields of the Java PDSI reconstruction with precipitationreveal the strong opposing relationship between rainfallover eastern Africa/Arabia versus Indonesia/Australia inboreal fall that relates to dipole-like SST conditions inthe Indian Ocean and to ENSO (Figure 3(i)–(j)).
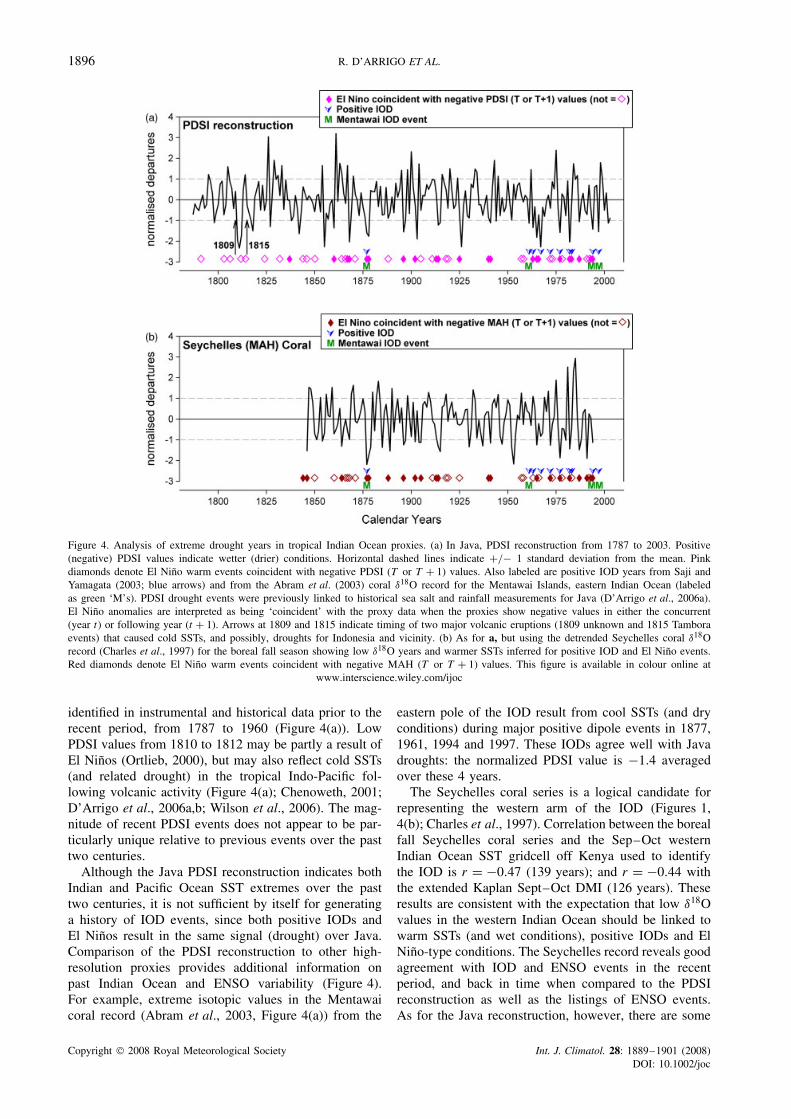
To further investigate the correspondence between theJavan PDSI and climate anomalies related to Indian andPacific Ocean variability, PDSI values below and above1 standard deviation (representing drought and wet peri-ods) were identified over the length of the reconstruc-tion (1787–2003). In Figure 4(a), PDSI drought yearsare compared to the instrumental, historical and proxyrecords of positive IOD and ENSO warm events (see‘Data and Methods’). Since 1787, of the 29 droughtyears (> = −1 standard deviation), 19 (66%) coincidewith El Ninos. With the 47 ENSO warm events iden-tified since 1787 (see Figure 4), the probability that 19coincident years are identified by chance (i.e. relative tousing random time series) is extremely low (p < 0.000).However, this relationship appears to break down prior to1850 (shown by open diamonds in Figure 4(a); only 25%(1812 and 1838 −p = 0.28) coincide). Since 1850, of the21 drought events (relative to 37 ENSO warm events),17 (81%; p < 0.0000) coincide with El Ninos. The rela-tionship with ENSO is not as coherent when wet eventsare examined. Of the 31 reconstructed wet years since
Copyright 2008 Royal Meteorological Society Int. J. Climatol. 28: 1889–1901 (2008)DOI: 10.1002/joc
1894 R. D’ARRIGO ET AL.
Figure 2. Comparison between Indian Ocean climate indices and Java PDSI reconstruction. (a) Java PDSI reconstruction and Sept–Oct DMIsof Saji et al. (1999), Kaplan et al. (1998) and HADSST2 (Rayner et al., 2006). Sign of PDSI reconstruction is reversed. (b) with Sept–OctEQWIN index. All correlations (calculated over the 1958–1994 period, Table I(a)) are statistically significant above the 99% level. Instrumentalvalues were spliced onto the PDSI reconstruction after 1988 after adjustment for mean and variance. This figure is available in colour online at
www.interscience.wiley.com/ijoc
1850, only 7 (22%; p = 0.15) coincide with La Ninaevents. Additionally, seven of these wet years actuallycoincide with El Nino events. A similar situation existswhen the wet/dry years are compared to IODs since 1960,when such events appear to have increased in frequency(Saji and Yamagata, 2003). Of the nine droughts overthis period, seven (78%; p < 0.0000) coincide with pos-itive IOD events, while only one (17% p = 0.40) of the 6wet years coincides with a negative IOD (not shown). Asnoted previously, the negative IOD is also a less robustpattern than the positive IOD mode. Thus, while manyof these comparisons of extreme events (and the corre-lations in Table I) are highly significant statistically, andtogether account for a sizeable proportion of the PDSIvariance (e.g. as we demonstrated in R. D’Arrigo and R.Wilson (in press)), it is clear that there is additional vari-ance not accounted for by the variables analysed herein.This fact reflects, at least in part, quality issues and vary-ing spatial representation in the early historical records
as well as the proxy records themselves, such that theyare not perfect measures of the phenomena that we areexamining. There are also other factors forcing climatein these regions (e.g. volcanism in the early 1800s).
Reconstructed Java droughts thus correspond reason-ably well with the positive IODs and ENSO warm eventsidentified in instrumental, historical or proxy records,reflecting their links to both tropical Indian Ocean aswell as Pacific Ocean SSTs (Figure 4(a)). Before 1961,only one major positive IOD has been identified over thepast few centuries (in 1877, also an El Nino; noted inthe Mentawai corals – Abram et al., 2003). Variance inthe early part of the extended DMI reflects this low IODactivity: for 1878–1960 the average variance is 0.08, ver-sus 0.21 for 1961–2002. Ihara et al. (in press) describedifferent regimes in the instrumental period, related todifferential warming in the Indian Ocean, in which thereare different frequencies of positive and negative dipoleevents. Most droughts can be explained by ENSO events
Copyright 2008 Royal Meteorological Society Int. J. Climatol. 28: 1889–1901 (2008)DOI: 10.1002/joc
INDIAN OCEAN CLIMATE AND JAVA TREE RINGS 1895
Figure 3. Spatial correlation fields computed for the recent period since 1958 (left panels) and since the late 19th century (right panels), comparingthe Kaplan dipole index (a), (b), Java PDSI reconstruction (c), (d), Nino 3.4 SST (e), (f), and HADSLP2 SOI (Allan and Ansell, 2006; (g),(h)) with global SSTs from the Kaplan et al. (1998) dataset for the boreal fall (Sept–Oct). Note that all SST fields show dipole structure in theIndian Ocean as well as ENSO signatures in the Pacific Ocean. Figure 3(i)–(j) shows spatial correlations of the Java PDSI reconstruction withboreal fall precipitation data ((i): Sept–Oct and (j): Oct–Nov) for 1951–2000, illustrating the strong opposing relationship of rainfall betweeneastern Africa/Arabia versus Australasia, as well as linkages between Indian and Indonesian drought. This figure is available in colour online at
www.interscience.wiley.com/ijoc
Copyright 2008 Royal Meteorological Society Int. J. Climatol. 28: 1889–1901 (2008)DOI: 10.1002/joc
1896 R. D’ARRIGO ET AL.
Figure 4. Analysis of extreme drought years in tropical Indian Ocean proxies. (a) In Java, PDSI reconstruction from 1787 to 2003. Positive(negative) PDSI values indicate wetter (drier) conditions. Horizontal dashed lines indicate +/− 1 standard deviation from the mean. Pinkdiamonds denote El Nino warm events coincident with negative PDSI (T or T + 1) values. Also labeled are positive IOD years from Saji andYamagata (2003; blue arrows) and from the Abram et al. (2003) coral δ18O record for the Mentawai Islands, eastern Indian Ocean (labeledas green ‘M’s). PDSI drought events were previously linked to historical sea salt and rainfall measurements for Java (D’Arrigo et al., 2006a).El Nino anomalies are interpreted as being ‘coincident’ with the proxy data when the proxies show negative values in either the concurrent(year t) or following year (t + 1). Arrows at 1809 and 1815 indicate timing of two major volcanic eruptions (1809 unknown and 1815 Tamboraevents) that caused cold SSTs, and possibly, droughts for Indonesia and vicinity. (b) As for a, but using the detrended Seychelles coral δ18Orecord (Charles et al., 1997) for the boreal fall season showing low δ18O years and warmer SSTs inferred for positive IOD and El Nino events.Red diamonds denote El Nino warm events coincident with negative MAH (T or T + 1) values. This figure is available in colour online at
www.interscience.wiley.com/ijoc
identified in instrumental and historical data prior to therecent period, from 1787 to 1960 (Figure 4(a)). LowPDSI values from 1810 to 1812 may be partly a result ofEl Ninos (Ortlieb, 2000), but may also reflect cold SSTs(and related drought) in the tropical Indo-Pacific fol-lowing volcanic activity (Figure 4(a); Chenoweth, 2001;D’Arrigo et al., 2006a,b; Wilson et al., 2006). The mag-nitude of recent PDSI events does not appear to be par-ticularly unique relative to previous events over the pasttwo centuries.
Although the Java PDSI reconstruction indicates bothIndian and Pacific Ocean SST extremes over the pasttwo centuries, it is not sufficient by itself for generatinga history of IOD events, since both positive IODs andEl Ninos result in the same signal (drought) over Java.Comparison of the PDSI reconstruction to other high-resolution proxies provides additional information onpast Indian Ocean and ENSO variability (Figure 4).For example, extreme isotopic values in the Mentawaicoral record (Abram et al., 2003, Figure 4(a)) from the
eastern pole of the IOD result from cool SSTs (and dryconditions) during major positive dipole events in 1877,1961, 1994 and 1997. These IODs agree well with Javadroughts: the normalized PDSI value is −1.4 averagedover these 4 years.
The Seychelles coral series is a logical candidate forrepresenting the western arm of the IOD (Figures 1,4(b); Charles et al., 1997). Correlation between the borealfall Seychelles coral series and the Sep–Oct westernIndian Ocean SST gridcell off Kenya used to identifythe IOD is r = −0.47 (139 years); and r = −0.44 withthe extended Kaplan Sept–Oct DMI (126 years). Theseresults are consistent with the expectation that low δ18Ovalues in the western Indian Ocean should be linked towarm SSTs (and wet conditions), positive IODs and ElNino-type conditions. The Seychelles record reveals goodagreement with IOD and ENSO events in the recentperiod, and back in time when compared to the PDSIreconstruction as well as the listings of ENSO events.As for the Java reconstruction, however, there are some
Copyright 2008 Royal Meteorological Society Int. J. Climatol. 28: 1889–1901 (2008)DOI: 10.1002/joc
INDIAN OCEAN CLIMATE AND JAVA TREE RINGS 1897
years that do not show the expected relationships: of the29 negative values in the Seychelles record (related towarm SSTs), 20 (69%; p < 0.0000) coincide with ElNino events. On the other hand, only 50% of the negativeevents coincide with positive IODs since 1960. As withthe PDSI reconstruction, the coherence with La Nina andnegative IOD events is relatively weak.
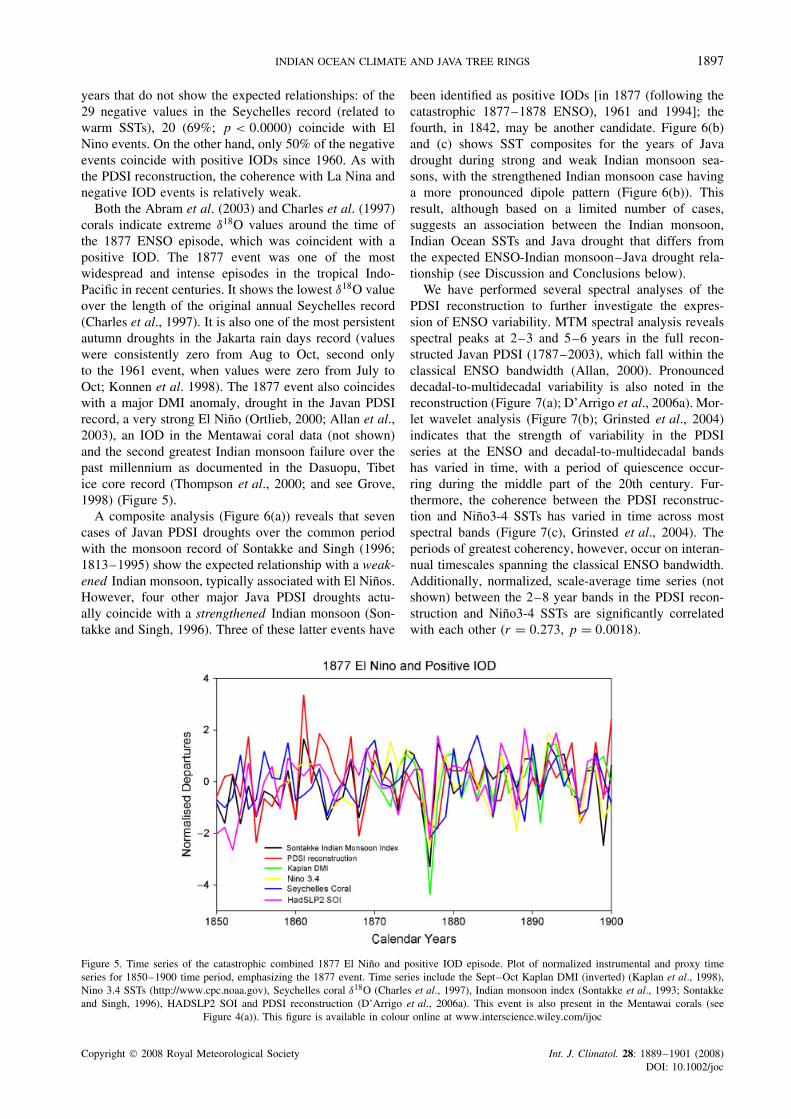
Both the Abram et al. (2003) and Charles et al. (1997)corals indicate extreme δ18O values around the time ofthe 1877 ENSO episode, which was coincident with apositive IOD. The 1877 event was one of the mostwidespread and intense episodes in the tropical Indo-Pacific in recent centuries. It shows the lowest δ18O valueover the length of the original annual Seychelles record(Charles et al., 1997). It is also one of the most persistentautumn droughts in the Jakarta rain days record (valueswere consistently zero from Aug to Oct, second onlyto the 1961 event, when values were zero from July toOct; Konnen et al. 1998). The 1877 event also coincideswith a major DMI anomaly, drought in the Javan PDSIrecord, a very strong El Nino (Ortlieb, 2000; Allan et al.,2003), an IOD in the Mentawai coral data (not shown)and the second greatest Indian monsoon failure over thepast millennium as documented in the Dasuopu, Tibetice core record (Thompson et al., 2000; and see Grove,1998) (Figure 5).
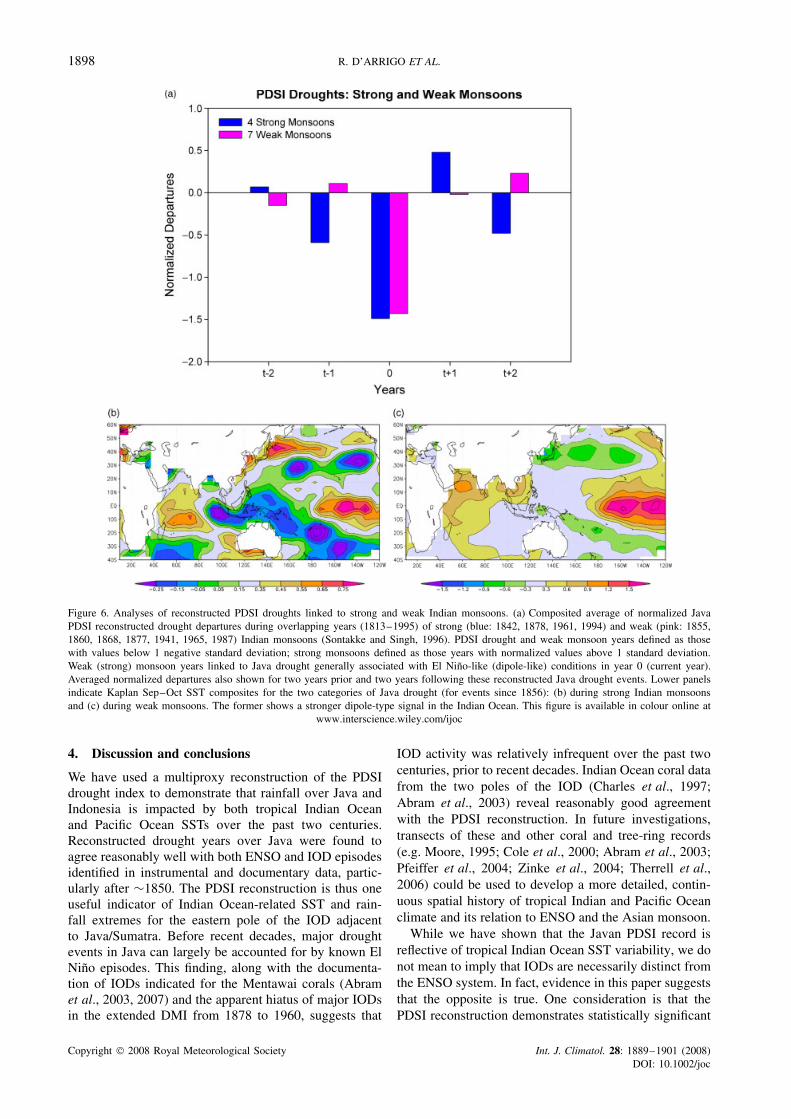
A composite analysis (Figure 6(a)) reveals that sevencases of Javan PDSI droughts over the common periodwith the monsoon record of Sontakke and Singh (1996;1813–1995) show the expected relationship with a weak-ened Indian monsoon, typically associated with El Ninos.However, four other major Java PDSI droughts actu-ally coincide with a strengthened Indian monsoon (Son-takke and Singh, 1996). Three of these latter events have
been identified as positive IODs [in 1877 (following thecatastrophic 1877–1878 ENSO), 1961 and 1994]; thefourth, in 1842, may be another candidate. Figure 6(b)and (c) shows SST composites for the years of Javadrought during strong and weak Indian monsoon sea-sons, with the strengthened Indian monsoon case havinga more pronounced dipole pattern (Figure 6(b)). Thisresult, although based on a limited number of cases,suggests an association between the Indian monsoon,Indian Ocean SSTs and Java drought that differs fromthe expected ENSO-Indian monsoon–Java drought rela-tionship (see Discussion and Conclusions below).
We have performed several spectral analyses of thePDSI reconstruction to further investigate the expres-sion of ENSO variability. MTM spectral analysis revealsspectral peaks at 2–3 and 5–6 years in the full recon-structed Javan PDSI (1787–2003), which fall within theclassical ENSO bandwidth (Allan, 2000). Pronounceddecadal-to-multidecadal variability is also noted in thereconstruction (Figure 7(a); D’Arrigo et al., 2006a). Mor-let wavelet analysis (Figure 7(b); Grinsted et al., 2004)indicates that the strength of variability in the PDSIseries at the ENSO and decadal-to-multidecadal bandshas varied in time, with a period of quiescence occur-ring during the middle part of the 20th century. Fur-thermore, the coherence between the PDSI reconstruc-tion and Nino3-4 SSTs has varied in time across mostspectral bands (Figure 7(c), Grinsted et al., 2004). Theperiods of greatest coherency, however, occur on interan-nual timescales spanning the classical ENSO bandwidth.Additionally, normalized, scale-average time series (notshown) between the 2–8 year bands in the PDSI recon-struction and Nino3-4 SSTs are significantly correlatedwith each other (r = 0.273, p = 0.0018).
Figure 5. Time series of the catastrophic combined 1877 El Nino and positive IOD episode. Plot of normalized instrumental and proxy timeseries for 1850–1900 time period, emphasizing the 1877 event. Time series include the Sept–Oct Kaplan DMI (inverted) (Kaplan et al., 1998),Nino 3.4 SSTs (http://www.cpc.noaa.gov), Seychelles coral δ18O (Charles et al., 1997), Indian monsoon index (Sontakke et al., 1993; Sontakkeand Singh, 1996), HADSLP2 SOI and PDSI reconstruction (D’Arrigo et al., 2006a). This event is also present in the Mentawai corals (see
Figure 4(a)). This figure is available in colour online at www.interscience.wiley.com/ijoc
Copyright 2008 Royal Meteorological Society Int. J. Climatol. 28: 1889–1901 (2008)DOI: 10.1002/joc
1898 R. D’ARRIGO ET AL.
Figure 6. Analyses of reconstructed PDSI droughts linked to strong and weak Indian monsoons. (a) Composited average of normalized JavaPDSI reconstructed drought departures during overlapping years (1813–1995) of strong (blue: 1842, 1878, 1961, 1994) and weak (pink: 1855,1860, 1868, 1877, 1941, 1965, 1987) Indian monsoons (Sontakke and Singh, 1996). PDSI drought and weak monsoon years defined as thosewith values below 1 negative standard deviation; strong monsoons defined as those years with normalized values above 1 standard deviation.Weak (strong) monsoon years linked to Java drought generally associated with El Nino-like (dipole-like) conditions in year 0 (current year).Averaged normalized departures also shown for two years prior and two years following these reconstructed Java drought events. Lower panelsindicate Kaplan Sep–Oct SST composites for the two categories of Java drought (for events since 1856): (b) during strong Indian monsoonsand (c) during weak monsoons. The former shows a stronger dipole-type signal in the Indian Ocean. This figure is available in colour online at
www.interscience.wiley.com/ijoc
4. Discussion and conclusions
We have used a multiproxy reconstruction of the PDSIdrought index to demonstrate that rainfall over Java andIndonesia is impacted by both tropical Indian Oceanand Pacific Ocean SSTs over the past two centuries.Reconstructed drought years over Java were found toagree reasonably well with both ENSO and IOD episodesidentified in instrumental and documentary data, partic-ularly after ∼1850. The PDSI reconstruction is thus oneuseful indicator of Indian Ocean-related SST and rain-fall extremes for the eastern pole of the IOD adjacentto Java/Sumatra. Before recent decades, major droughtevents in Java can largely be accounted for by known ElNino episodes. This finding, along with the documenta-tion of IODs indicated for the Mentawai corals (Abramet al., 2003, 2007) and the apparent hiatus of major IODsin the extended DMI from 1878 to 1960, suggests that
IOD activity was relatively infrequent over the past twocenturies, prior to recent decades. Indian Ocean coral datafrom the two poles of the IOD (Charles et al., 1997;Abram et al., 2003) reveal reasonably good agreementwith the PDSI reconstruction. In future investigations,transects of these and other coral and tree-ring records(e.g. Moore, 1995; Cole et al., 2000; Abram et al., 2003;Pfeiffer et al., 2004; Zinke et al., 2004; Therrell et al.,2006) could be used to develop a more detailed, contin-uous spatial history of tropical Indian and Pacific Oceanclimate and its relation to ENSO and the Asian monsoon.
While we have shown that the Javan PDSI record isreflective of tropical Indian Ocean SST variability, we donot mean to imply that IODs are necessarily distinct fromthe ENSO system. In fact, evidence in this paper suggeststhat the opposite is true. One consideration is that thePDSI reconstruction demonstrates statistically significant
Copyright 2008 Royal Meteorological Society Int. J. Climatol. 28: 1889–1901 (2008)DOI: 10.1002/joc
INDIAN OCEAN CLIMATE AND JAVA TREE RINGS 1899
(a)
(b)
(c)
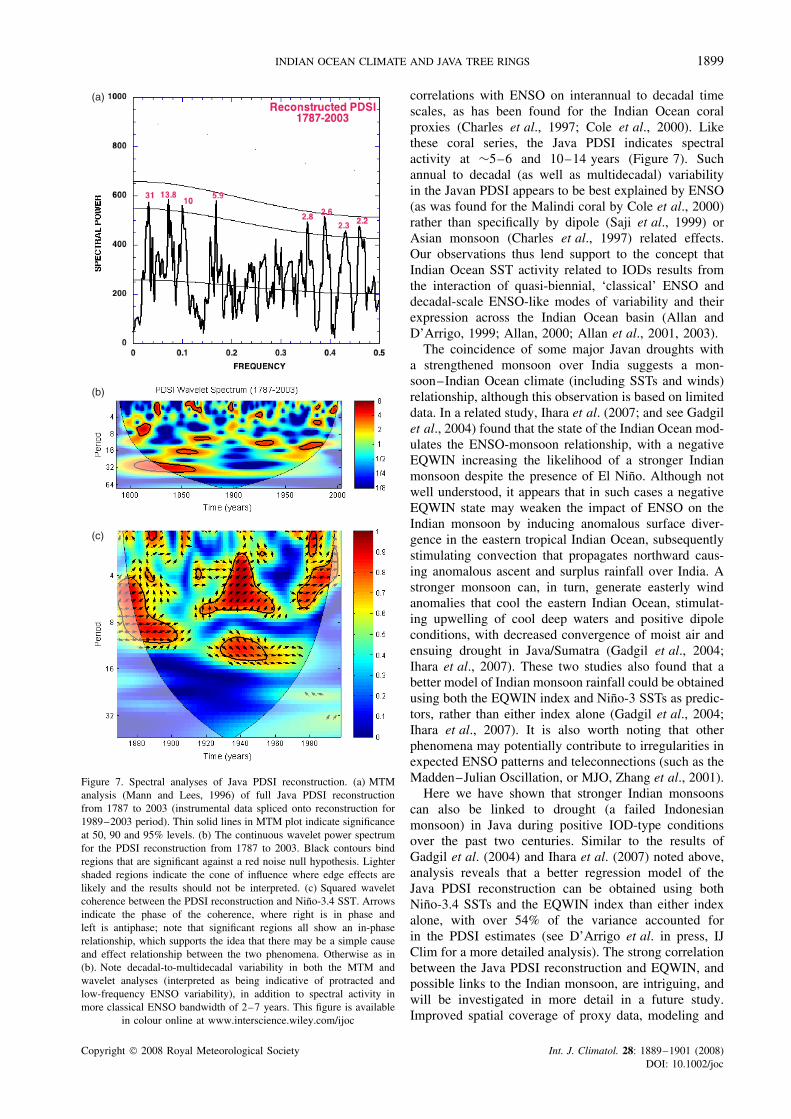
Figure 7. Spectral analyses of Java PDSI reconstruction. (a) MTManalysis (Mann and Lees, 1996) of full Java PDSI reconstructionfrom 1787 to 2003 (instrumental data spliced onto reconstruction for1989–2003 period). Thin solid lines in MTM plot indicate significanceat 50, 90 and 95% levels. (b) The continuous wavelet power spectrumfor the PDSI reconstruction from 1787 to 2003. Black contours bindregions that are significant against a red noise null hypothesis. Lightershaded regions indicate the cone of influence where edge effects arelikely and the results should not be interpreted. (c) Squared waveletcoherence between the PDSI reconstruction and Nino-3.4 SST. Arrowsindicate the phase of the coherence, where right is in phase andleft is antiphase; note that significant regions all show an in-phaserelationship, which supports the idea that there may be a simple causeand effect relationship between the two phenomena. Otherwise as in(b). Note decadal-to-multidecadal variability in both the MTM andwavelet analyses (interpreted as being indicative of protracted andlow-frequency ENSO variability), in addition to spectral activity inmore classical ENSO bandwidth of 2–7 years. This figure is available
in colour online at www.interscience.wiley.com/ijoc
correlations with ENSO on interannual to decadal timescales, as has been found for the Indian Ocean coralproxies (Charles et al., 1997; Cole et al., 2000). Likethese coral series, the Java PDSI indicates spectralactivity at ∼5–6 and 10–14 years (Figure 7). Suchannual to decadal (as well as multidecadal) variabilityin the Javan PDSI appears to be best explained by ENSO(as was found for the Malindi coral by Cole et al., 2000)rather than specifically by dipole (Saji et al., 1999) orAsian monsoon (Charles et al., 1997) related effects.Our observations thus lend support to the concept thatIndian Ocean SST activity related to IODs results fromthe interaction of quasi-biennial, ‘classical’ ENSO anddecadal-scale ENSO-like modes of variability and theirexpression across the Indian Ocean basin (Allan andD’Arrigo, 1999; Allan, 2000; Allan et al., 2001, 2003).
The coincidence of some major Javan droughts witha strengthened monsoon over India suggests a mon-soon–Indian Ocean climate (including SSTs and winds)relationship, although this observation is based on limiteddata. In a related study, Ihara et al. (2007; and see Gadgilet al., 2004) found that the state of the Indian Ocean mod-ulates the ENSO-monsoon relationship, with a negativeEQWIN increasing the likelihood of a stronger Indianmonsoon despite the presence of El Nino. Although notwell understood, it appears that in such cases a negativeEQWIN state may weaken the impact of ENSO on theIndian monsoon by inducing anomalous surface diver-gence in the eastern tropical Indian Ocean, subsequentlystimulating convection that propagates northward caus-ing anomalous ascent and surplus rainfall over India. Astronger monsoon can, in turn, generate easterly windanomalies that cool the eastern Indian Ocean, stimulat-ing upwelling of cool deep waters and positive dipoleconditions, with decreased convergence of moist air andensuing drought in Java/Sumatra (Gadgil et al., 2004;Ihara et al., 2007). These two studies also found that abetter model of Indian monsoon rainfall could be obtainedusing both the EQWIN index and Nino-3 SSTs as predic-tors, rather than either index alone (Gadgil et al., 2004;Ihara et al., 2007). It is also worth noting that otherphenomena may potentially contribute to irregularities inexpected ENSO patterns and teleconnections (such as theMadden–Julian Oscillation, or MJO, Zhang et al., 2001).
Here we have shown that stronger Indian monsoonscan also be linked to drought (a failed Indonesianmonsoon) in Java during positive IOD-type conditionsover the past two centuries. Similar to the results ofGadgil et al. (2004) and Ihara et al. (2007) noted above,analysis reveals that a better regression model of theJava PDSI reconstruction can be obtained using bothNino-3.4 SSTs and the EQWIN index than either indexalone, with over 54% of the variance accounted forin the PDSI estimates (see D’Arrigo et al. in press, IJClim for a more detailed analysis). The strong correlationbetween the Java PDSI reconstruction and EQWIN, andpossible links to the Indian monsoon, are intriguing, andwill be investigated in more detail in a future study.Improved spatial coverage of proxy data, modeling and
Copyright 2008 Royal Meteorological Society Int. J. Climatol. 28: 1889–1901 (2008)DOI: 10.1002/joc
1900 R. D’ARRIGO ET AL.
other analyses will further aid our understanding of thenature and origin of Indian Ocean climatic variability,its relation to ENSO and the Asian monsoon, and howsuch activity may be modulated by future greenhousewarming.
Acknowledgements
This study was funded by the National Science Founda-tion’s Earth System History and Paleoclimate programs(Grant No. OCE-04-02474). Rob Wilson is funded by theEuropean Community under research contract 017008-2MILLENNIUM. Rob Allan was supported by the UKDepartment for Environment, Food and Rural Affairs(DEFRA), Climate Prediction Program, and this paper isUK Crown Copyright. We also gratefully acknowledgethe Indonesian Institute of Sciences (LIPI). We thank N.Abram, C. Charles and M. Moore for data and assis-tance, D. Parker for reviewing an early version of themanuscript and A. Wilson for help with the probabilityanalysis. Crosswavelet and wavelet coherence softwarewere provided by A. Grinsted. Lamont-Doherty EarthObservatory Contribution No. 7130.
References
Abram N, Gagan M, McCulloch M, Chappell J, Hantoro W. 2003.Coral reef death during the 1997 Indian Ocean dipole linked toIndonesian wildfires. Science 301: 952–955.
Abram N, Gagan M, Liu Z, Hantoro W, McCulloch M, Suwargadi B.2007. Seasonal characteristics of the Indian Ocean dipole during theHolocene epoch. Nature 445: 299–302.
Abram N, Gagan M, Liu Z, Hantoro W, McCulloch M, Suwargadi B,Chappell J. 2005. Recent evolution of tropical climate variabilityin the Indian Ocean region. Geophysical Research and Abstracts 7:049302.
Aldrian E, Susanto D. 2003. Identification of three dominant rainfallregions within Indonesia and their relationship to sea surfacetemperature. International Journal of Climatology 23: 1435–1452.
Allan RJ. 2000. ENSO and climatic variability in the past150 years. In ENSO: Multiscale Variability and Global and RegionalImpacts, Diaz HF, Markgraf V (eds). Cambridge University Press:Cambridge; 3–55.
Allan R, D’Arrigo R. 1999. ’Persistent’ ENSO sequences: how unusualwas the 1990–1995 El Nino? The Holocene 9: 101–118.
Allan R, Ansell T. 2006. A new globally-complete monthly historicalgridded sea-level pressure data set (HadSLP2): 1850–2004. Journalof Climate 19: 5816–5812.
Allan R, Reason C, Lindesay J, Ansell T. 2003. ’Protracted’ ENSOepisodes and their impacts in the Indian Ocean region. Deep-SeaResearch II 50: 2331–2347.
Allan R, Chambers D, Drosdwosky W, Hendon H, Latif M,Nicholls N, Smith I, Stone R, Tourre Y. 2001. Is there an IndianOcean dipole, and is it independent of the El Nino-Southern Oscil-lation? Climate Variability and Predictability Exchanges 6: 18–22.
Baquero-Bernal A, Latif M, Legutke S. 2002. On dipole-like variabil-ity in the tropical Indian Ocean. Journal of Climate 15: 1358–1368.
Beck C, Grieser J, Rudolf B. 2005. A new monthly precipitationclimatology for the global land areas for the period 1951 to 2000.Climate Status Report 2004. German Weather Service: Offenbach,Germany; 181–190.
Behera S, Luo L, Masson S, Rao S, Sakuma H. 2006. A CGCM studyon the interaction between IOD and ENSO. Journal of Climate 19:1688–1705.
Chakraborty S. 2006. Coral records from the northern Indian ocean:understanding monsoon variability. Journal of the Geological SocietyIndia 68: 395–405.
Charles C, Hunter D, Fairbanks R. 1997. Interaction between theENSO and the Asian monsoon in a coral record of tropical climate.Science 277: 925–928.
Charles CD, Cobb K, Moore MD, Fairbanks RG. 2003. Monsoon-tropical ocean interaction in a network of coral records spanningthe 20th century. Marine Geology 201: 207–222.
Chenoweth M. 2001. Two major volcanic cooling episodes derivedfrom global marine air temperature, AD 1807–1827. GeophysicalResearch Letters 28: 2963–2966.
Cole J, Dunbar R, McClanahan T, Muthiga N. 2000. Tropical Pacificforcing of decadal SST variability in the western Indian Ocean overthe past two centuries. Science 287: 617–619.
Dai A, Trenberth K, Qian T. 2004. A global data set of Palmer DroughtSeverity Index for 1870–2002: relationship with soil moistureand effects of surface warming. Journal of Hydrometeorology 5:1117–1130.
D’Arrigo R, Wilson R, Palmer J, Krusic P, Curtis A, Sakulich J,Bijaksana S, Zulaikah S, Ngkoimani O. 2006a. Monsoon droughtover Java, Indonesia during the past two centuries. GeophysicalResearch Letters 33: L04709, DOI:10.1029/2005GL025465.
D’Arrigo R, Wilson R, Palmer J, Krusic P, Curtis A, Sakulich J,Bijaksana S, Zulaikah S, Ngkoimani O, Tudhope S. 2006b. Recon-structed Indonesian warm pool SSTs from tree rings and corals:linkages with ENSO and the Asian monsoon. Paleoceanography 21:PA3005, DOI:10.1029/2005PA001256.
D’Arrigo R, Wilson R. El Nino and Indian Ocean influences onIndonesian drought : implications for forecasting rainfall and cropproductivity. International Journal of Climatology (in press).
Dommenget D, Latif M. 2002. A cautionary note on the interpretationof EOFs. Journal of Climate 15: 216–225.
Fischer A, Terray P, Guilyardi E, Gualdi S, Delacluse P. 2005. Twoindependent triggers for the Indian Ocean Dipole/Zonal Mode in acoupled GCM. Journal of Climate 18: 3428–3449.
Fritts H. 1976. Tree Rings and Climate. Academic Press: New York.Gadgil S, Vinayachandran P, Francis P, Siddhartha G. 2004. Extremes
of the Indian summer monsoon rainfall, ENSO and equatorial IndianOcean oscillation. Geophysical Research Letters 31: L12213.
Grinsted A, Moore J, Jevrejeva S. 2004. Application of the crosswavelet transform and wavelet coherence to geophysical time series.Nonlinear Processes in Geophysics 11: 561–566.
Grove R. 1998. Global impact of the 1789–1793 El Nino. Nature 393:318–319.
Ihara C, Kushnir Y, Cane M. Warming trend of the Indian Ocean SSTand Indian Ocean Dipole from 1880 to 2004. Journal of Climate Inpress.
Ihara C, Kushnir Y, Cane M, De La Pena V. 2007. Indian summermonsoon rainfall and its links with ENSO and Indian Ocean climateanomalies. International Journal of Climatology 27: 179–187.
Kaplan A, Cane M, Kushnir Y, Clement A, Blumenthal M,Rajagopalan B. 1998. Analyses of global sea surface tempera-ture 1856–1991. Journal of Geophysical Research-Oceans 103:18567–18589.
Kayanne H, Iijima H, Nakamura N, McClanahan T, Behera S, Yama-gata T. 2006. Indian Ocean dipole index recorded in Kenyan coralannual density bands. Geophysical Research Letters 33: L19709,DOI:10.1029/2006GL027168.
Konnen G, Jones P, Kaltofen M, Allan R. 1998. Pre-1866 extensionsof the Southern Oscillation index using early Indonesian and Tahitianmeteorological readings. Journal of Climate 11: 2325–2339.
Kumar K, Rajagopalan B, Hoerling M, Bates G, Cane M. 2006.Unraveling the mystery of Indian monsoon failure During El Nino.Science 314: 115–119.
Mann ME, Lees J. 1996. Robust estimation of background noiseand signal detection in climatic time series. Climatic Change 33:409–445.
Meyers G, McIntosh P, Pigot L, Pook M. 2007. The years of El Nino,La Nina and interactions with the tropical Indian Ocean. Journal ofClimate 20: 2872–2880.
Moore M. 1995. Proxy records of the Indonesian Low and the El Nino-Southern Oscillation (ENSO) from stable isotope measurements ofIndonesian reef corals. Ph.D. thesis, University of California atBerkeley.
Ortlieb L. 2000. The documented historical record of El Nino eventsin Peru: an update of the Quinn record (sixteenth through nineteenthcenturies). In El Nino and the Southern Oscillation: MultiscaleVariability and Global and Regional Impacts, Diaz H, Markgraf V(eds). Cambridge University Press: Cambridge; 207–295.
O’Sullivan D. 1994. El Nino and the Southern Oscillation,http://www.longpaddock.qld.gov.au/Help/ElNinoSouthernOscillation/.
Copyright 2008 Royal Meteorological Society Int. J. Climatol. 28: 1889–1901 (2008)DOI: 10.1002/joc
INDIAN OCEAN CLIMATE AND JAVA TREE RINGS 1901
List taken from: Mean Sea Level Pressure Indices of the El Nino-Southern Oscillation: relevance to stream discharge in south-eastern Australia, April 1996. By Allan RJ, Beard GS, Close A,Herczeg AL, Jones PD, Simpson HJ. CSIRO Divisional Report 96/1ISSN 1033 5579.
Pfeiffer M, Dullo W. 2006. Monsoon-induced cooling of the westernequatorial Indian Ocean as recorded in coral oxygen isotoperecords from the Seychelles covering the period of 1840–1994 AD.Quaternary Science Reviews 25: 993–1009.
Pfeiffer M, Dullo W, Eisenhauer A. 2004. Variability of theintertropical convergence Zone recorded in coral isotopic recordsfrom the central Indian Ocean (Chagos Archipelago). QuaternaryResearch 61: 245–255.
Rayner N, Brohan P, Parker D, Folland C, Kennedy J, Vanicek M,Ansell T, Tett S. 2006. Improved analyses of changes anduncertainties in sea surface temperature measured in situ since themid-nineteenth century: the HADSST2 data set. Journal of Climate19: 446–469.
Reason CJC, Allan RJ, Lindesay JA, Ansell TJ. 2000. ENSO andclimatic signals across the Indian Ocean basin in the global context:Part I, interannual composite patterns. International Journal ofClimatology 20: 1285–1327.
Saji N, Yamagata T. 2003. Possible impacts of Indian Ocean Dipolemode events on global climate. Climatic Research 25: 151–169.
Saji N, Goswami B, Vinayachandran P, Yamagata T. 1999. A dipolemode in the tropical Indian Ocean. Nature 401: 360–363.
Sontakke N, Singh N. 1996. Longest instrumental and regional All-India summer monsoon rainfall series using optimum observations:reconstruction and update. The Holocene 6: 315–331.
Sontakke N, Pant G, Singh N. 1993. Construction of all-India summermonsoon rainfall series for the period 1844–1991. Journal of Climate6: 1807–1811.
Therrell M, Stahle D, Ries L, Shugart H. 2006. Tree-ring reconstructedrainfall variability in Zimbabwe. Climate Dynamics 26: 677–685.
Thompson L, Yao T, Mosley-Thompson E, Davis M, Henderson K,Lin P. 2000. A high-resolution millennial record of the South Asianmonsoon from Himalayan ice cores. Science 289: 1916–1919.
Torrence C, Compo G. 1998. A practical guide to wavelet analysis.Bulletin of the American Meteorological Society 79: 61–78.
Trenberth K, Stepaniak D. 2001. Indices of El Nino evolution. Journalof Climate 14: 1697–1701.
Webster P, Moore A, Ioschnigg J, Leben R. 1999. Coupled ocean-atmosphere dynamics in the Indian Ocean during 1997–1998. Nature401: 356–360.
Whetton P, Rutherford I. 1994. El Nino-Southern Oscillation telecon-nections in the Eastern hemisphere over the last 500 years. ClimateChange 28: 221–253.
Wilson R, Tudhope A, Brohan P, Briffa K, Osborn T, Tett S. 2006.Two hundred-fifty years of reconstructed and modeled tropicaltemperatures. Journal of Geophysical Research 111: C10007,DOI:10.1029/2005JC003188.
Worley S, Woodruff S, Reynolds R, Lubker S, Lott N. 2005. ICOADSrelease 2.1 data and products. International Journal of Climatology25: 823–842.
Wright PB, Mitchell TP, Wallace JM. 1985. Relationships BetweenSurface Observations over the Global Oceans and the SouthernOscillation. Data Report ERL PMEL-12, Seattle, NOAA.
Zhang C, Hendon H, Kessler W, Rosati A. 2001. A workshop on theMJO and ENSO. Bulletin of the American Meteorological Society82: 971–976.
Zinke J, Dullo W, Heiss G, Eisenhauer A. 2004. ENSO and IndianOcean subtropical dipole variability is recorded in a coral record offsouthwest Madagascar for the period 1659 to 1995. Earth PlanetaryScience Letters 228: 177–194.
Zinke J, Pfeiffer M, Timm O, Dullo W, Davies G. 2005. Atmosphere-ocean dynamics in the western Indian Ocean recorded in corals.Philosophical Transactions of the Royal Society A 363: 121–142.
Copyright 2008 Royal Meteorological Society Int. J. Climatol. 28: 1889–1901 (2008)DOI: 10.1002/joc