+ All Categories
Home > Documents > Package ‘motifStack’ · Package ‘motifStack’ October 16, 2019 Type Package Version 1.28.0...

Package ‘motifStack’ · Package ‘motifStack’ October 16, 2019 Type Package Version 1.28.0...

Date post: 20-Apr-2020
Category:
Upload: others
View: 25 times
Download: 0 times
Share this document with a friend
42
Package ‘motifStack’ April 15, 2020 Type Package Version 1.30.0 Title Plot stacked logos for single or multiple DNA, RNA and amino acid sequence Author Jianhong Ou, Michael Brodsky, Scot Wolfe and Lihua Julie Zhu Maintainer Jianhong Ou <[email protected]> Imports XML, scales, htmlwidgets,grDevices, stats, stats4, graphics, utils, ggplot2 Depends R (>= 2.15.1), methods, grImport2, grid, MotIV, ade4, Biostrings Suggests RUnit, BiocGenerics, MotifDb, RColorBrewer, BiocStyle, knitr, httr, htmltools biocViews SequenceMatching, Visualization, Sequencing, Microarray, Alignment, ChIPchip, ChIPSeq, MotifAnnotation, DataImport Description The motifStack package is designed for graphic representation of multiple motifs with different similarity scores. It works with both DNA/RNA sequence motif and amino acid sequence motif. In addition, it provides the flexibility for users to customize the graphic parameters such as the font type and symbol colors. License GPL (>= 2) Lazyload yes VignetteBuilder knitr git_url https://git.bioconductor.org/packages/motifStack git_branch RELEASE_3_10 git_last_commit e807768 git_last_commit_date 2019-10-29 Date/Publication 2020-04-14 R topics documented: motifStack-package ..................................... 2 browseMotifs ........................................ 3 browseMotifs-shiny ..................................... 4 1
Transcript

Package ‘motifStack’April 15, 2020

Type Package

Version 1.30.0

Title Plot stacked logos for single or multiple DNA, RNA and aminoacid sequence

Author Jianhong Ou, Michael Brodsky, Scot Wolfe and Lihua Julie Zhu

Maintainer Jianhong Ou <[email protected]>

Imports XML, scales, htmlwidgets,grDevices, stats, stats4, graphics,utils, ggplot2

Depends R (>= 2.15.1), methods, grImport2, grid, MotIV, ade4,Biostrings

Suggests RUnit, BiocGenerics, MotifDb, RColorBrewer, BiocStyle, knitr,httr, htmltools

biocViews SequenceMatching, Visualization, Sequencing, Microarray,Alignment, ChIPchip, ChIPSeq, MotifAnnotation, DataImport

Description The motifStack package is designed for graphicrepresentation of multiple motifs with different similarityscores. It works with both DNA/RNA sequence motif and aminoacid sequence motif. In addition, it provides the flexibilityfor users to customize the graphic parameters such as thefont type and symbol colors.

License GPL (>= 2)

Lazyload yes

VignetteBuilder knitr

git_url https://git.bioconductor.org/packages/motifStack

git_branch RELEASE_3_10

git_last_commit e807768

git_last_commit_date 2019-10-29

Date/Publication 2020-04-14

R topics documented:motifStack-package . . . . . . . . . . . . . . . . . . . . . . . . . . . . . . . . . . . . . 2browseMotifs . . . . . . . . . . . . . . . . . . . . . . . . . . . . . . . . . . . . . . . . 3browseMotifs-shiny . . . . . . . . . . . . . . . . . . . . . . . . . . . . . . . . . . . . . 4

1

2 motifStack-package

colorset . . . . . . . . . . . . . . . . . . . . . . . . . . . . . . . . . . . . . . . . . . . 4DNAmotifAlignment . . . . . . . . . . . . . . . . . . . . . . . . . . . . . . . . . . . . 5GeomMotif . . . . . . . . . . . . . . . . . . . . . . . . . . . . . . . . . . . . . . . . . 5geom_motif . . . . . . . . . . . . . . . . . . . . . . . . . . . . . . . . . . . . . . . . . 6getRankedUniqueMotifs . . . . . . . . . . . . . . . . . . . . . . . . . . . . . . . . . . 8highlightCol . . . . . . . . . . . . . . . . . . . . . . . . . . . . . . . . . . . . . . . . . 9importMatrix . . . . . . . . . . . . . . . . . . . . . . . . . . . . . . . . . . . . . . . . 9marker-class . . . . . . . . . . . . . . . . . . . . . . . . . . . . . . . . . . . . . . . . . 10mergeMotifs . . . . . . . . . . . . . . . . . . . . . . . . . . . . . . . . . . . . . . . . . 11motifCircos . . . . . . . . . . . . . . . . . . . . . . . . . . . . . . . . . . . . . . . . . 11motifCloud . . . . . . . . . . . . . . . . . . . . . . . . . . . . . . . . . . . . . . . . . 14motifGrob . . . . . . . . . . . . . . . . . . . . . . . . . . . . . . . . . . . . . . . . . . 15motifPiles . . . . . . . . . . . . . . . . . . . . . . . . . . . . . . . . . . . . . . . . . . 16motifSig-class . . . . . . . . . . . . . . . . . . . . . . . . . . . . . . . . . . . . . . . . 18motifSig-methods . . . . . . . . . . . . . . . . . . . . . . . . . . . . . . . . . . . . . . 19motifSignature . . . . . . . . . . . . . . . . . . . . . . . . . . . . . . . . . . . . . . . 20motifStack . . . . . . . . . . . . . . . . . . . . . . . . . . . . . . . . . . . . . . . . . . 21ouNode-class . . . . . . . . . . . . . . . . . . . . . . . . . . . . . . . . . . . . . . . . 21pcm-class . . . . . . . . . . . . . . . . . . . . . . . . . . . . . . . . . . . . . . . . . . 22pcm-methods . . . . . . . . . . . . . . . . . . . . . . . . . . . . . . . . . . . . . . . . 23pfm-class . . . . . . . . . . . . . . . . . . . . . . . . . . . . . . . . . . . . . . . . . . 25pfm-methods . . . . . . . . . . . . . . . . . . . . . . . . . . . . . . . . . . . . . . . . 26pfm2pwm . . . . . . . . . . . . . . . . . . . . . . . . . . . . . . . . . . . . . . . . . . 27plotAffinityLogo . . . . . . . . . . . . . . . . . . . . . . . . . . . . . . . . . . . . . . 28plotMotifLogo . . . . . . . . . . . . . . . . . . . . . . . . . . . . . . . . . . . . . . . . 29plotMotifLogoA . . . . . . . . . . . . . . . . . . . . . . . . . . . . . . . . . . . . . . . 30plotMotifLogoStack . . . . . . . . . . . . . . . . . . . . . . . . . . . . . . . . . . . . . 30plotMotifLogoStackWithTree . . . . . . . . . . . . . . . . . . . . . . . . . . . . . . . . 31plotMotifOverMotif . . . . . . . . . . . . . . . . . . . . . . . . . . . . . . . . . . . . . 32plotMotifStackWithPhylog . . . . . . . . . . . . . . . . . . . . . . . . . . . . . . . . . 33plotMotifStackWithRadialPhylog . . . . . . . . . . . . . . . . . . . . . . . . . . . . . 34plotXaxis . . . . . . . . . . . . . . . . . . . . . . . . . . . . . . . . . . . . . . . . . . 36plotYaxis . . . . . . . . . . . . . . . . . . . . . . . . . . . . . . . . . . . . . . . . . . 37psam-class . . . . . . . . . . . . . . . . . . . . . . . . . . . . . . . . . . . . . . . . . . 37psam-methods . . . . . . . . . . . . . . . . . . . . . . . . . . . . . . . . . . . . . . . . 38readPCM . . . . . . . . . . . . . . . . . . . . . . . . . . . . . . . . . . . . . . . . . . 39reorderUPGMAtree . . . . . . . . . . . . . . . . . . . . . . . . . . . . . . . . . . . . . 40

Index 41

motifStack-package Plot stacked logos for single or multiple DNA, RNA and amino acidsequence

Description

motifStack is a package that is able to draw amino acid sequence as easy as to draw DNA/RNAsequence. motifStack provides the flexibility for users to select the font type and symbol colors.motifStack is designed for graphical representation of multiple motifs.

browseMotifs 3

Author(s)

Jianhong Ou and Lihua Julie Zhu

Maintainer: Jianhong Ou <[email protected]>

browseMotifs browse motifs

Description

browse motifs in a web browser

Usage

browseMotifs(pfms, phylog,layout=c("tree", "cluster", "radialPhylog"),nodeRadius=2.5, baseWidth=12, baseHeight=30,xaxis=TRUE, yaxis=TRUE,width=NULL, height=NULL,...)

Arguments

pfms a list of pfm

phylog layout type. see GraphvizLayouts

layout layout type. Could be tree, cluster or radialPhylog.

nodeRadius node radius, default 2.5px.baseWidth,baseHeight

width and height of each alphabet of the motif logo.

xaxis,yaxis plot x-axis or y-axis or not in the motifs.

width width of the figure

height height of the figure

... parameters not used

Value

An object of class htmlwidget that will intelligently print itself into HTML in a variety of contextsincluding the R console, within R Markdown documents, and within Shiny output bindings.

Examples

library("MotifDb")matrix.fly <- query(MotifDb, "Dmelanogaster")motifs <- as.list(matrix.fly)motifs <- motifs[grepl("Dmelanogaster-FlyFactorSurvey-", names(motifs), fixed=TRUE)]names(motifs) <- gsub("Dmelanogaster_FlyFactorSurvey_", "",

gsub("_FBgn[0-9]+$", "",gsub("[^a-zA-Z0-9]","_",

gsub("(_[0-9]+)+$", "", names(motifs)))))motifs <- motifs[unique(names(motifs))]

4 colorset

pfms <- sample(motifs, 10)pfms <- lapply(names(pfms), function(.ele, pfms){new("pfm",mat=pfms[[.ele]], name=.ele)},pfms)browseMotifs(pfms)

browseMotifs-shiny Shiny bindings for browseMotifs

Description

Output and render functions for using browseMotifs within Shiny applications and interactive Rmddocuments.

Usage

browseMotifsOutput(outputId, width = "100%", height = "400px")

renderbrowseMotifs(expr, env = parent.frame(), quoted = FALSE)

Arguments

outputId output variable to read fromwidth, height Must be a valid CSS unit (like '100%', '400px', 'auto') or a number, which

will be coerced to a string and have 'px' appended.expr An expression that generates a browseMotifsenv The environment in which to evaluate expr.quoted Is expr a quoted expression (with quote())? This is useful if you want to save

an expression in a variable.

colorset retrieve color setting for logo

Description

retrieve color setting for logo

Usage

colorset(alphabet="DNA", colorScheme='auto')

Arguments

alphabet character, ’DNA’, ’RNA’ or ’AA’colorScheme ’auto’, ’charge’, ’chemistry’, ’classic’ or ’hydrophobicity’ for AA, ’auto’, ’base-

pairing’, or ’blindnessSafe’ for DNA ro RNA

Value

A character vector of color scheme

Examples

col <- colorset("AA", "hydrophobicity")

DNAmotifAlignment 5

DNAmotifAlignment align DNA motifs

Description

align DNA motifs for plotting motifs stack

Usage

DNAmotifAlignment(pfms, threshold=0.4, minimalConsensus=0,rcpostfix="(RC)", revcomp=rep(TRUE, length(pfms)))

Arguments

pfms a list of position frequency matrices, pfms must be a list of class pfm or psam

threshold information content cutoff threshold for useful postionsminimalConsensus

minimal length of consensus for alignment

rcpostfix the postfix for reverse complements

revcomp a logical vector to indicates whether the reverse complemet should be involvedinto alignment

Value

a list of aligned motifs

Examples

pcms<-readPCM(file.path(find.package("motifStack"), "extdata"),"pcm$")motifs<-lapply(pcms,pcm2pfm)motifs<-DNAmotifAlignment(motifs)

GeomMotif GeomMotif object

Description

GeomMotif object is a ggproto object.

Format

The format is: Classes ’GeoMotif’, ’Geom’, ’ggproto’, ’gg’ <ggproto object: Class GeoMotif,Geom, gg> aesthetics: function default_aes: uneval draw_group: function draw_key: functiondraw_layer: function draw_panel: function extra_params: na.rm handle_na: function non_missing_aes:optional_aes: parameters: function required_aes: xmin ymin xmax ymax motif setup_data: func-tion use_defaults: function super: <ggproto object: Class Geom, gg>

See Also

geom_motif

6 geom_motif

Examples

pcm <- read.table(file.path(find.package("motifStack"),"extdata", "bin_SOLEXA.pcm"))

pcm <- pcm[,3:ncol(pcm)]rownames(pcm) <- c("A","C","G","T")motif <- new("pcm", mat=as.matrix(pcm), name="bin_SOLEXA")

df <- data.frame(xmin=c(.25, .25), ymin=c(.25, .75), xmax=c(.75, .75), ymax=c(.5, 1))df$motif <- list(pcm2pfm(motif), pcm2pfm(motif))

library(ggplot2)

ggplot(df, aes(xmin=xmin, ymin=ymin, xmax=xmax, ymax=ymax, motif=motif)) +geom_motif() + theme_bw() + ylim(0, 1) + xlim(0, 1)

geom_motif geom_motif

Description

geom_motif uses the locations of the four corners (xmin, xmax, ymin and ymax) to plot motifs.

Usage

geom_motif(mapping = NULL, data = NULL, stat = "identity", position = "identity",..., ic.scale = TRUE, use.xy=FALSE, show.legend = NA, inherit.aes = TRUE)

Arguments

mapping Set of aesthetic mappings created by aes() or aes_(). If specified and inherit.aes= TRUE (the default), it is combined with the default mapping at the top levelof the plot. You must supply mapping if there is no plot mapping.

data The data to be displayed in this layer.

stat The statistical transformation to use on the data for this layer, as a string.

position Position adjustment, either as a string, or the result of a call to a position adjust-ment function.

... Other arguments passed on to layer().

ic.scale logical If TRUE, the height of each column is proportional to its informationcontent. Otherwise, all columns have the same height.

use.xy logical If TRUE, the required aesthethics will be x, y, width, height, and motif.Otherwise, xmin, ymin, xmax, ymax and motif.

show.legend Not used.

inherit.aes If FALSE, overrides the default aesthetics, rather than combining with them.

Value

a layer that contains GeomMotif object.

geom_motif 7

Aesthetics

geom_motif() understands the following aesthetics (required aesthetics are in bold):

• xmin

• xmax

• ymin

• ymax

• motif

• angle

• fontfamily

• fontface

OR

• x

• y

• width

• height

• motif

• angle

• fontfamily

• fontface

Author(s)

Jianhong Ou

Examples

pcm <- read.table(file.path(find.package("motifStack"),"extdata", "bin_SOLEXA.pcm"))

pcm <- pcm[,3:ncol(pcm)]rownames(pcm) <- c("A","C","G","T")motif <- new("pcm", mat=as.matrix(pcm), name="bin_SOLEXA")

df <- data.frame(xmin=c(.25, .25), ymin=c(.25, .75), xmax=c(.75, .75), ymax=c(.5, 1))df$motif <- list(pcm2pfm(motif), pcm2pfm(motif))

library(ggplot2)ggplot(df, aes(xmin=xmin, ymin=ymin, xmax=xmax, ymax=ymax, motif=motif)) +geom_motif() + theme_bw() + ylim(0, 1) + xlim(0, 1)

8 getRankedUniqueMotifs

getRankedUniqueMotifs get the unique motif in each category grouped by distance

Description

to get the unique motif in a given category, eg by species.

Usage

getRankedUniqueMotifs(phylog, attr)

Arguments

phylog an object of class phylog

attr attribute used for category of motifs

Value

return a list:

uni.rank unique motif ranks

uni.length length of unique motif grouped by distance

uni.list unique motif names grouped by distance

Author(s)

Jianhong Ou

Examples

if(interactive()){library("MotifDb")matrix.fly <- query(MotifDb, "Dmelanogaster")matrix.human <- query(MotifDb, "Hsapiens")pfms <- c(as.list(matrix.fly), as.list(matrix.human))pfms <- pfms[sample(1:length(pfms), 100)]jaspar.scores <- MotIV::readDBScores(file.path(find.package("MotIV"),

"extdata", "jaspar2010_PCC_SWU.scores"))d <- MotIV::motifDistances(lapply(pfms, pfm2pwm))hc <- MotIV::motifHclust(d, method="average")phylog <- hclust2phylog(hc)leaves <- names(phylog$leaves)attr <- gsub("^(.*?)_.*$", "\1", leaves)getRankedUniqueMotifs(phylog, attr)

}

highlightCol 9

highlightCol add alpha transparency value to a color

Description

An alpha transparency value can be specified to a color, in order to get better color for background.

Usage

highlightCol(col, alpha = 0.5)

Arguments

col vector of any of the three kinds of R color specifications, i.e., either a color name(as listed by colors()), a hexadecimal string of the form "#rrggbb" or "#rrggbbaa"(see rgb), or a positive integer i meaning palette()[i].

alpha a value in [0, 1]

Value

a vector of colors in hexadecimal string of the form "#rrggbbaa".

Author(s)

Jianhong Ou

Examples

highlightCol(1:5, 0.3)highlightCol(c("red", "green", "blue"), 0.3)

importMatrix import motifs from local files

Description

Import the motifs into pcm-class or pfm-class from files exported from Transfac, CisBP, and JAS-PAR.

Usage

importMatrix(filenames,format=c("auto", "pfm", "cm", "pcm", "meme",

"transfac", "jaspar", "scpd", "cisbp","psam"),

to=c("auto", "pcm", "pfm", "psam"))

10 marker-class

Arguments

filenames filename to be imported.

format file format

to import to pcm-class or pfm-class

Value

a list of object pcm-class or pfm-class

Author(s)

Jianhong Ou

Examples

path <- system.file("extdata", package = "motifStack")importMatrix(dir(path, "*.pcm", full.names = TRUE))

marker-class Class marker

Description

An object of class "marker" represents a marker in a motif

Objects from the Class

Objects can be created by calls of the form new("marker",type,start,stop,label,gp).

Slots

type: character(1), 1 of ’rect’, ’text’, ’line’

start: numberic indicates the start position of the marker

stop: numberic indicates the end position of the marker

label: character(1) indicates the text to be marked

gp: an object of gpar

Methods

$, $<- Get or set the slot of marker

Examples

new("marker", type="rect", start=c(2, 4), gp=gpar(lty=3))

mergeMotifs 11

mergeMotifs merge multiple motifs

Description

merge multiple motifs by calculate mean of each position

Usage

mergeMotifs(..., bgNoise=NA)

Arguments

... pcm or pfm objects

bgNoise if it is not NA, test will using a background by Dirichlet(1)-distributed randomfrequencies with weight bg.noise. The value of bgNoise should be a number inthe range of 0 to 1, eg. 0.05

Value

a pfm object

Author(s)

Jianhong Ou

Examples

pcms<-readPCM(file.path(find.package("motifStack"), "extdata"),"pcm$")mergeMotifs(pcms)

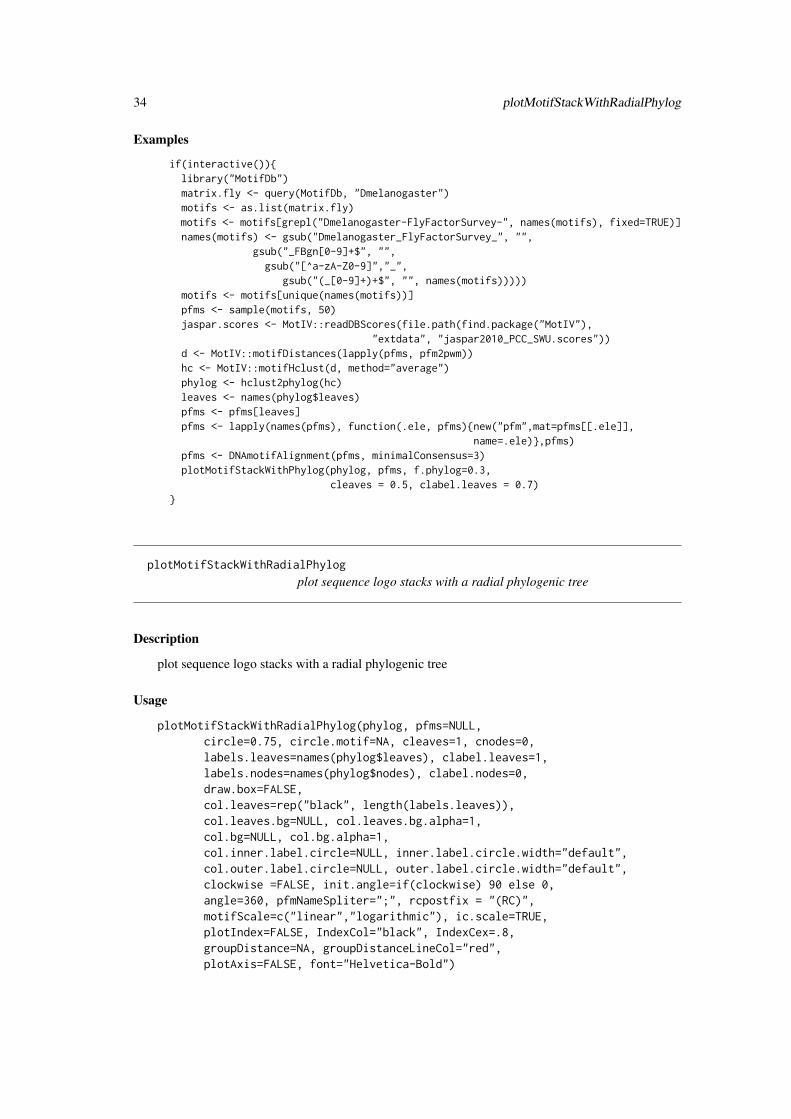
motifCircos plot sequence logo stacks with a radial phylogenic tree and multiplecolor rings

Description

plot sequence logo stacks with a radial phylogenic tree and multiple color rings. The difference fromplotMotifStackWithRadialPhylog is that it has more color setting and one more group of pfms.

Usage

motifCircos(phylog, pfms=NULL, pfms2=NULL, R=2.5,r.tree=1, col.tree.bg=NULL, col.tree.bg.alpha=1,cnodes=0, labels.nodes=names(phylog$nodes), clabel.nodes=0,r.leaves=NA,cleaves=1, labels.leaves=names(phylog$leaves), clabel.leaves=1,col.leaves=rep("black", length(labels.leaves)),col.leaves.bg=NULL, col.leaves.bg.alpha=1,r.pfms=NA, r.pfms2=NA,

12 motifCircos

r.rings=0, col.rings=list(),col.inner.label.circle=NULL, inner.label.circle.width=0.02,col.outer.label.circle=NULL, outer.label.circle.width=0.02,draw.box=FALSE,clockwise =FALSE, init.angle=if(clockwise) 90 else 0,angle=360, pfmNameSpliter=";", rcpostfix="(RC)",motifScale=c("linear","logarithmic","none"), ic.scale=TRUE,plotIndex=FALSE, IndexCol="black", IndexCex=.8,groupDistance=NA, groupDistanceLineCol="red",plotAxis=FALSE)

Arguments

phylog an object of class phylog

pfms a list of objects of class pfm

pfms2 a list of objects of class pfm

R radius of canvas

r.tree half width of the tree

col.tree.bg a vector of colors for tree backgroundcol.tree.bg.alpha

a alpha value [0, 1] of colors for tree background

cnodes a character size for plotting the points that represent the nodes, used with par("cex")*cnodes.If zero, no points are drawn

labels.nodes a vector of strings of characters for the nodes labels

clabel.nodes a character size for the nodes labels, used with par("cex")*clabel.nodes. If zero,no nodes labels are drawn

r.leaves width of the leaves

cleaves a character size for plotting the points that represent the leaves, used with par("cex")*cleaves.If zero, no points are drawn

labels.leaves a vector of strings of characters for the leaves labels

clabel.leaves a character size for the leaves labels, used with par("cex")*clavel.leaves

col.leaves a vector of colors for leaves labels

col.leaves.bg a vector of colors for background of leaves labelscol.leaves.bg.alpha

alpha value [0, 1] for the colors of backgroud of leaves labels

r.pfms width of the pfms

r.pfms2 width of the pfms2

r.rings a vector of width of color rings

col.rings a list of color ringscol.inner.label.circle

a vector of colors for inner cirlce of pfmsinner.label.circle.width

width for inner circle of pfmscol.outer.label.circle

a vector of colors for outer circle of pfms

motifCircos 13

outer.label.circle.width

width for outer circle of pfms

draw.box if TRUE draws a box around the current plot with the function box()

clockwise a logical value indicating if slices are drawn clockwise or counter clockwise

init.angle number specifying the starting angle (in degrees) for the slices. Defaults to 0(i.e., ‘3 o’clock‘) unless clockwise is true where init.angle defaults to 90 (de-grees), (i.e., ‘12 o’clock‘)

angle number specifying the angle (in degrees) for phylogenic tree. Defaults 360

pfmNameSpliter spliter when name of pfms/pfms2 contain multiple node of labels.leaves

rcpostfix the postfix for reverse complements

motifScale the scale of logo size

ic.scale logical. If TRUE, the height of each column is proportional to its informationcontent. Otherwise, all columns have the same height.

plotIndex logical. If TRUE, will plot index number in the motifLogo which can help userto describe the motifLogo

IndexCol The color of the index number when plotIndex is TRUE.

IndexCex The cex of the index number when plotIndex is TRUE.

groupDistance show groupDistance on the drawgroupDistanceLineCol

groupDistance line color, default: red

plotAxis logical. If TRUE, will plot distance axis.

Value

none

Author(s)

Jianhong Ou

See Also

plotMotifStackWithRadialPhylog

Examples

if(interactive()){library("MotifDb")matrix.fly <- query(MotifDb, "Dmelanogaster")motifs <- as.list(matrix.fly)motifs <- motifs[grepl("Dmelanogaster-FlyFactorSurvey-", names(motifs), fixed=TRUE)]names(motifs) <- gsub("Dmelanogaster_FlyFactorSurvey_", "",

gsub("_FBgn[0-9]+$", "",gsub("[^a-zA-Z0-9]","_",

gsub("(_[0-9]+)+$", "", names(motifs)))))motifs <- motifs[unique(names(motifs))]pfms <- sample(motifs, 50)jaspar.scores <- MotIV::readDBScores(file.path(find.package("MotIV"),

"extdata", "jaspar2010_PCC_SWU.scores"))d <- MotIV::motifDistances(lapply(pfms, pfm2pwm))hc <- MotIV::motifHclust(d, method="average")

14 motifCloud

phylog <- hclust2phylog(hc)leaves <- names(phylog$leaves)pfms <- pfms[leaves]pfms <- lapply(names(pfms), function(.ele, pfms){new("pfm",mat=pfms[[.ele]],

name=.ele)},pfms)pfms <- DNAmotifAlignment(pfms, minimalConsensus=3)library(RColorBrewer)color <- brewer.pal(12, "Set3")motifCircos(phylog, pfms, cleaves = 0.5, clabel.leaves = 0.7,

col.tree.bg=rep(color, each=5), col.leaves=rep(color, each=5),r.rings=c(0.02, 0.03, 0.04),col.rings=list(sample(colors(), 50),

sample(colors(), 50),sample(colors(), 50)))

}

motifCloud plot a DNA sequence logo cloud

Description

Plot a DNA sequence logo cloud

Usage

motifCloud(motifSig, rcpostfix="(RC)",layout=c("rectangles", "cloud", "tree"),scale=c(6, .5), rot.per=.1,draw.box=TRUE, draw.freq=TRUE,box.col="gray", freq.col="gray",group.col=NULL, groups=NULL, draw.legend=FALSE,font="Helvetica-Bold", ic.scale=TRUE)

Arguments

motifSig an object of class motifSigrcpostfix postfix for reverse-complement motif names, default: (RC)layout layout of the logo cloud, rectangles, cloud or treescale A vector of length 2 indicating the range of the size of the sequence logo.rot.per proportion sequence logo with 90 degree rotation. Only work for "cloud" layoutdraw.box draw box for each sequence logo or notdraw.freq label frequency of each signature or notbox.col color of box for each sequence logofreq.col color of frequency labelgroup.col color setting for groupsgroups a named vectors of motif groupsdraw.legend draw group color legend or notfont font of logoic.scale logical If TRUE, the height of each column is proportional to its information

content. Otherwise, all columns have the same height.

motifGrob 15

Value

none

Examples

if(interactive()){library("MotifDb")matrix.fly <- query(MotifDb, "Dmelanogaster")motifs <- as.list(matrix.fly)motifs <- motifs[grepl("Dmelanogaster-FlyFactorSurvey-", names(motifs), fixed=TRUE)]names(motifs) <- gsub("Dmelanogaster_FlyFactorSurvey_", "",

gsub("_FBgn[0-9]+$", "",gsub("[^a-zA-Z0-9]","_",

gsub("(_[0-9]+)+$", "", names(motifs)))))motifs <- motifs[unique(names(motifs))]pfms <- sample(motifs, 50)jaspar.scores <- MotIV::readDBScores(file.path(find.package("MotIV"),

"extdata", "jaspar2010_PCC_SWU.scores"))d <- MotIV::motifDistances(lapply(pfms, pfm2pwm))hc <- MotIV::motifHclust(d, method="average")phylog <- hclust2phylog(hc)leaves <- names(phylog$leaves)pfms <- pfms[leaves]pfms <- lapply(names(pfms), function(.ele, pfms){new("pfm",mat=pfms[[.ele]],

name=.ele)},pfms)motifSig <- motifSignature(pfms, phylog, groupDistance=0.1)motifCloud(motifSig)

}

motifGrob Motif Grob

Description

This function create a motif grob.

Usage

motifGrob(pfm, x = unit(0.5, "npc"), y = unit(0.5, "npc"),width = unit(1, "npc"), height = unit(1, "npc"),

angle = 0, ic.scale=TRUE, default.units = "native", name=NULL,gp = gpar(fontfamily = "Helvetica-Bold",

fontface="bold"))

Arguments

pfm an object of pfm

x A numeric vector or unit object specifying x-values.

y A numeric vector or unit object specifying y-values.

width A numeric vector or unit object specifying width.

height A numeric vector or unit object specifying height.

16 motifPiles

angle A numeric value indicating the angle of rotation of the motif. Positive valuesindicate the amount of rotation, in degrees, anticlockwise from the positive x-axis.

ic.scale logical If TRUE, the height of each column is proportional to its informationcontent. Otherwise, all columns have the same height.

default.units A string indicating the default units to use if x, y, width, or height are only givenas numeric vectors.

name A character value to uniquely identify the motifGrob once it has been pushedonto the grob tree.

gp A gpar object, typically the output from a call to the function gpar. The list willbe used as parameter of plotMotifLogoA.

Value

An gTree object.

Author(s)

Jianhong Ou

Examples

pcm<-matrix(runif(40,0,100),nrow=4,ncol=10)pfm<-pcm2pfm(pcm)rownames(pfm)<-c("A","C","G","T")motif <- new("pfm", mat=pfm, name="bin_SOLEXA")motifGrob(motif)

motifPiles plot sequence logo stacks with a linear phylogenic tree and multiplecolor sets

Description

plot sequence logo stacks with a linear phylogenic tree and multiple color sets.

Usage

motifPiles(phylog, pfms=NULL, pfms2=NULL,r.tree=.45, col.tree=NULL,cnodes=0, labels.nodes=names(phylog$nodes), clabel.nodes=0,cleaves=.2, labels.leaves=names(phylog$leaves), clabel.leaves=1,col.leaves=rep("black", length(labels.leaves)),col.leaves.bg=NULL, col.leaves.bg.alpha=1,r.pfms=NA, r.pfms2=NA, motifScale=c("logarithmic", "linear", "none"),col.pfms=NULL, col.pfms.width=0.02,col.pfms2=NULL, col.pfms2.width=0.02,r.anno=0, col.anno=list(),pfmNameSpliter=";", rcpostfix="(RC)", ic.scale=TRUE,plotIndex=FALSE, IndexCol="black", IndexCex=.8,groupDistance=NA, groupDistanceLineCol="red")

motifPiles 17

Arguments

phylog an object of class phylog

pfms a list of objects of class pfm

pfms2 a list of objects of class pfm

r.tree width of the tree

col.tree a vector of colors for tree

cnodes a character size for plotting the points that represent the nodes, used with par("cex")*cnodes.If zero, no points are drawn

labels.nodes a vector of strings of characters for the nodes labels

clabel.nodes a character size for the nodes labels, used with par("cex")*clabel.nodes. If zero,no nodes labels are drawn

cleaves a character size for plotting the points that represent the leaves, used with par("cex")*cleaves.If zero, no points are drawn

labels.leaves a vector of strings of characters for the leaves labels

clabel.leaves a character size for the leaves labels, used with par("cex")*clavel.leaves

col.leaves a vector of colors for leaves labels

col.leaves.bg a vector of colors for background of leaves labelscol.leaves.bg.alpha

alpha value [0, 1] for the colors of backgroud of leaves labels

r.pfms width of the pfms

r.pfms2 width of the pfms2

motifScale the scale of logo size

col.pfms a vector of colors for inner pile of pfms

col.pfms.width width for inner pile of pfms

col.pfms2 a vector of colors for outer pile of pfmscol.pfms2.width

width for outer pile of pfms

r.anno a vector of width of color sets

col.anno a list of color sets

pfmNameSpliter spliter when name of pfms/pfms2 contain multiple node of labels.leaves

rcpostfix the postfix for reverse complements

ic.scale logical. If TRUE, the height of each column is proportional to its informationcontent. Otherwise, all columns have the same height.

plotIndex logical. If TRUE, will plot index number in the motifLogo which can help userto describe the motifLogo

IndexCol The color of the index number when plotIndex is TRUE.

IndexCex The cex of the index number when plotIndex is TRUE.

groupDistance show groupDistance on the drawgroupDistanceLineCol

groupDistance line color, default: red

Value

none

18 motifSig-class

Author(s)

Jianhong Ou

See Also

motifCircos

Examples

if(interactive()){library("MotifDb")matrix.fly <- query(MotifDb, "Dmelanogaster")motifs <- as.list(matrix.fly)motifs <- motifs[grepl("Dmelanogaster-FlyFactorSurvey-", names(motifs), fixed=TRUE)]names(motifs) <- gsub("Dmelanogaster_FlyFactorSurvey_", "",

gsub("_FBgn[0-9]+$", "",gsub("[^a-zA-Z0-9]","_",

gsub("(_[0-9]+)+$", "", names(motifs)))))motifs <- motifs[unique(names(motifs))]pfms <- sample(motifs, 50)jaspar.scores <- MotIV::readDBScores(file.path(find.package("MotIV"),

"extdata", "jaspar2010_PCC_SWU.scores"))d <- MotIV::motifDistances(lapply(pfms, pfm2pwm))hc <- MotIV::motifHclust(d, method="average")phylog <- hclust2phylog(hc)leaves <- names(phylog$leaves)pfms <- pfms[leaves]pfms <- lapply(names(pfms), function(.ele, pfms){new("pfm",mat=pfms[[.ele]],

name=.ele)},pfms)pfms <- DNAmotifAlignment(pfms, minimalConsensus=3)library(RColorBrewer)color <- brewer.pal(12, "Set3")motifPiles(phylog, pfms, cleaves = 0.5, clabel.leaves = 0.7,

col.leaves=rep(color, each=5),col.leaves.bg = sample(colors(), 50),col.tree=rep(color, each=5),r.anno=c(0.02, 0.03, 0.04),col.anno=list(sample(colors(), 50),

sample(colors(), 50),sample(colors(), 50)))

}

motifSig-class Class "motifSig"

Description

An object of class "motifSig" represents the output of function motifSignature

Objects from the Class

Objects can be created by calls of the form new("motifSig",signature,freq,nodelist,gpcol).

motifSig-methods 19

Slots

signatures list object of class "pfm"

freq code"numeric" signature frequency

nodelist list object of class "ouNode"

gpcol code"character" signature group color sets

Methods

signatures signature(object = "motifSig") return the signatures of motifSig

frequence signature(object = "motifSig") return the frequency of motifSig

nodelist signature(object = "motifSig") return the nodelist of motifSig

sigColor signature(object = "motifSig") return the group color sets of motifSig

motifSig-methods "motifSig" methods

Description

methods for motifSig objects.

Usage

## S4 method for signature 'motifSig'signatures(object)## S4 method for signature 'motifSig'frequence(object)## S4 method for signature 'motifSig'nodelist(object)

## S4 method for signature 'motifSig'sigColor(object)

Arguments

object An object of class motifSig.

Methods

signatures signature(object = "motifSig") return the signatures of motifSig

frequence signature(object = "motifSig") return the frequency of motifSig

nodelist signature(object = "motifSig") return the nodelist of motifSig

sigColor signature(object = "motifSig") return the group color sets of motifSig

$, $<- Get or set the slot of motifSig

20 motifSignature

motifSignature get signatures from motifs

Description

extract signatures from multiple motifs by distance calculated from STAMP

Usage

motifSignature(pfms, phylog, groupDistance, rcpostfix="(RC)",min.freq=2, trim=0.2, families=list(), sort=TRUE)

Arguments

pfms a list of objects of class pfm

phylog an object of class phylog

groupDistance maxmal distance of motifs in the same group

rcpostfix postfix for reverse-complement motif names, default: (RC)

min.freq signatures with frequency below min.freq will not be plotted

trim minimal information content for each position of signature

families for each family, the motif number in one signature should only count as 1

sort sort the signatures by frequency or not.

Value

an Object of class motifSig

Examples

if(interactive()){library("MotifDb")matrix.fly <- query(MotifDb, "Dmelanogaster")motifs <- as.list(matrix.fly)motifs <- motifs[grepl("Dmelanogaster-FlyFactorSurvey-", names(motifs), fixed=TRUE)]names(motifs) <- gsub("Dmelanogaster_FlyFactorSurvey_", "",

gsub("_FBgn[0-9]+$", "",gsub("[^a-zA-Z0-9]","_",

gsub("(_[0-9]+)+$", "", names(motifs)))))motifs <- motifs[unique(names(motifs))]pfms <- sample(motifs, 50)jaspar.scores <- MotIV::readDBScores(file.path(find.package("MotIV"),

"extdata", "jaspar2010_PCC_SWU.scores"))d <- MotIV::motifDistances(lapply(pfms, pfm2pwm))hc <- MotIV::motifHclust(d, method="average")phylog <- hclust2phylog(hc)leaves <- names(phylog$leaves)pfms <- pfms[leaves]pfms <- lapply(names(pfms), function(.ele, pfms){new("pfm",mat=pfms[[.ele]],

name=.ele)},pfms)motifSig <- motifSignature(pfms, phylog, groupDistance=0.1)

}

motifStack 21

motifStack plot a DNA sequence logo stack

Description

Plot a DNA sequence logo stack

Usage

motifStack(pfms, layout=c("stack", "treeview", "phylog", "radialPhylog"), ...)

Arguments

pfms a list of objects of class pfm

layout layout of the logo stack, stack, treeview or radialPhylog

... any parameters could to pass to plotMotifLogoStack, plotMotifLogoStackWith-Tree, plotMotifStackWithPhylog or plotMotifStackWithRadialPhylog

Value

return a list contains pfms and phylog

Examples

if(interactive()){library("MotifDb")matrix.fly <- query(MotifDb, "Dmelanogaster")motifs <- as.list(matrix.fly)motifs <- motifs[grepl("Dmelanogaster-FlyFactorSurvey-", names(motifs), fixed=TRUE)]names(motifs) <- gsub("Dmelanogaster_FlyFactorSurvey_", "",

gsub("_FBgn[0-9]+$", "",gsub("[^a-zA-Z0-9]","_",

gsub("(_[0-9]+)+$", "", names(motifs)))))motifs <- motifs[unique(names(motifs))]pfms <- sample(motifs, 50)

pfms <- lapply(names(pfms), function(.ele, pfms){new("pfm",mat=pfms[[.ele]], name=.ele)},pfms)motifStack(pfms, "radialPhylog")

}

ouNode-class Class ouNode

Description

An object of class "ouNode" represents a motif node in a cluster tree

Objects from the Class

Objects can be created by calls of the form new("ouNode",left,right,parent,distl,distr,sizel,sizer).

22 pcm-class

Slots

left: character indicates the name of left leave

right: character indicates the name of right leave

parent: character indicates the name of parent node

distl: numeric indicates the distance of left leave

distr: numeric indicates the distance of right leave

sizel: numeric indicates the size of left leave

sizer: numeric indicates the size of right leave

Methods

$, $<- Get or set the slot of ouNode

Examples

new("ouNode", left="A", right="B", parent="Root", distl=1, distr=2, sizel=1, sizer=1)

pcm-class Class "pcm"

Description

An object of class "pcm" represents the position count matrix of a DNA/RNA/amino-acid sequencemotif. The entry stores a matrix, which in row i, column j gives the counts of observing nu-cleotide/or amino acid i in position j of the motif.

Objects from the Class

Objects can be created by calls of the form new("pcm",mat,name,alphabet,color,background).

Slots

mat Object of class "matrix" The position count matrix

name code"character" The motif name

alphabet "character" The sequence alphabet. "DNA", "RNA", "AA" or "others".

color a "character" vector. The color setting for each symbol

background a "numeric" vector. The background frequency.

tags a list to save metadata of motif.

markers a list of marker object.

pcm-methods 23

Methods

addBlank signature(x="pcm",n="numeric",b="logical") add space into the position countmatrix for alignment. b is a bool value, if TRUE, add space to the 3’ end, else add space to the5’ end. n indicates how many spaces should be added.

coerce signature(from = "pcm",to = "matrix"): convert object pcm to matrix

getIC signature(x = "pcm",) Calculate information content profile for position frequency ma-trix.

matrixReverseComplement signature(x = "pcm") get the reverse complement of position fre-quency matrix.

trimMotif signature(x = "pcm",t= "numeric") trim motif by information content.

plot signature(x = "pcm") Plots the sequence logo of the position count matrix.

Examples

pcm <- read.table(file.path(find.package("motifStack"), "extdata", "bin_SOLEXA.pcm"))pcm <- pcm[,3:ncol(pcm)]rownames(pcm) <- c("A","C","G","T")motif <- new("pcm", mat=as.matrix(pcm), name="bin_SOLEXA")plot(motif)

pcm-methods "pcm" methods

Description

methods for pcm objects.

Usage

## S4 method for signature 'pcm,numeric,logical'addBlank(x,n,b)## S4 method for signature 'pcm,ANY'getIC(x,p="missing")## S4 method for signature 'pcm'matrixReverseComplement(x)## S4 method for signature 'pcm,ANY'plot(x,y="missing",...)## S4 method for signature 'pcm,ANY'pcm2pfm(x,background="missing")## S4 method for signature 'matrix,ANY'pcm2pfm(x,background="missing")## S4 method for signature 'matrix,numeric'pcm2pfm(x,background)## S4 method for signature 'data.frame,ANY'pcm2pfm(x,background="missing")## S4 method for signature 'data.frame,numeric'pcm2pfm(x,background)## S4 method for signature 'pcm,numeric'trimMotif(x,t)

24 pcm-methods

## S4 method for signature 'pcm'as.data.frame(x, row.names = NULL, optional = FALSE,...)## S4 method for signature 'pcm'format(x,...)

Arguments

x An object of class pcm. For getIC, if parameter p is followed, x should be anobject of matrix. For pcm2pfm, x also could be an object of matrix.

y Not use.

p p is the background frequency.

n how many spaces should be added.

b logical value to indicate where the space should be added.

background a "numeric" vector. The background frequency.

t numeric value of information content threshold for trimming.

... Further potential arguments passed to plotMotifLogo.row.names,optional

see as.data.frame

Methods

addBlank signature(x="pcm",n="numeric",b="logical") add space into the position countmatrix for alignment. b is a bool value, if TRUE, add space to the 3’ end, else add space to the5’ end. n indicates how many spaces should be added.

coerce signature(from = "pcm",to = "matrix"): convert object pcm to matrix

getIC signature(x = "pcm",) Calculate information content profile for position frequency ma-trix.

matrixReverseComplement signature(x = "pcm") get the reverse complement of position fre-quency matrix.

plot signature(x = "pcm") Plots the sequence logo of the position count matrix.

trimMotif signature(x = "pcm",t= "numeric") trim motif by information content.

$, $<- Get or set the slot of pcm-class

as.data.frame convert pcm-class to a data.frame

format return the name_pcm of pcm-class

Examples

pcm <- read.table(file.path(find.package("motifStack"), "extdata", "bin_SOLEXA.pcm"))pcm <- pcm[,3:ncol(pcm)]rownames(pcm) <- c("A","C","G","T")motif <- new("pcm", mat=as.matrix(pcm), name="bin_SOLEXA")getIC(motif)matrixReverseComplement(motif)as(motif,"matrix")pcm2pfm(motif)as.data.frame(motif)format(motif)

pfm-class 25

pfm-class Class "pfm"

Description

An object of class "pfm" represents the position frequency matrix of a DNA/RNA/amino-acid se-quence motif. The entry stores a matrix, which in row i, column j gives the frequency of observingnucleotide/or amino acid i in position j of the motif.

Objects from the Class

Objects can be created by calls of the form new("pfm",mat,name,alphabet,color,background).

Slots

mat Object of class "matrix" The position frequency matrix

name code"character" The motif name

alphabet "character" The sequence alphabet. "DNA", "RNA", "AA" or "others".

color a "character" vector. The color setting for each symbol

background a "numeric" vector. The background frequency.

tags a list to save metadata of motif.

markers a list of marker object.

Methods

addBlank signature(x="pfm",n="numeric",b="logical") add space into the position frequencymatrix for alignment. b is a bool value, if TRUE, add space to the 3’ end, else add space to the5’ end. n indicates how many spaces should be added.

coerce signature(from = "pfm",to = "matrix"): convert object pfm to matrix

getIC signature(x = "pfm",) Calculate information content profile for position frequency ma-trix.

getIC signature(x = "matrix",p = "numeric") Calculate information content profile for ma-trix. p is the background frequency

matrixReverseComplement signature(x = "pfm") get the reverse complement of position fre-quency matrix.

trimMotif signature(x = "pfm",t= "numeric") trim motif by information content.

plot signature(x = "pfm") Plots the sequence logo of the position frequency matrix.

Examples

pcm <- read.table(file.path(find.package("motifStack"), "extdata", "bin_SOLEXA.pcm"))pcm <- pcm[,3:ncol(pcm)]rownames(pcm) <- c("A","C","G","T")motif <- pcm2pfm(pcm)motif <- new("pfm", mat=motif, name="bin_SOLEXA")plot(motif)

26 pfm-methods

pfm-methods "pfm" methods

Description

methods for pfm objects.

Usage

## S4 method for signature 'pfm,numeric,logical'addBlank(x,n,b)## S4 method for signature 'pfm,ANY'getIC(x,p="missing")## S4 method for signature 'matrix,numeric'getIC(x,p)## S4 method for signature 'pfm'matrixReverseComplement(x)## S4 method for signature 'pfm,ANY'plot(x,y="missing",...)## S4 method for signature 'pfm,numeric'trimMotif(x,t)## S4 method for signature 'pfm'as.data.frame(x, row.names = NULL, optional = FALSE,...)## S4 method for signature 'pfm'format(x,...)

Arguments

x An object of class pfm. For getIC, if parameter p is followed, x should be anobject of matrix.

y Not use.

p p is the background frequency.

n how many spaces should be added.

b logical value to indicate where the space should be added.

t numeric value of information content threshold for trimming.

... Further potential arguments passed to plotMotifLogo.row.names,optional

see as.data.frame

Methods

addBlank signature(x="pfm",n="numeric",b="logical") add space into the position frequencymatrix for alignment. b is a bool value, if TRUE, add space to the 3’ end, else add space to the5’ end. n indicates how many spaces should be added.

getIC signature(x = "pfm",) Calculate information content profile for position frequency ma-trix.

getIC signature(x = "matrix",p = "numeric") Calculate information content profile for ma-trix. p is the background frequency

pfm2pwm 27

matrixReverseComplement signature(x = "pfm") get the reverse complement of position fre-quency matrix.

plot signature(x = "pfm") Plots the sequence logo of the position frequency matrix.

trimMotif signature(x = "pfm",t= "numeric") trim motif by information content.

$, $<- Get or set the slot of pfm-class

as.data.frame convert pfm-class to a data.frame

format return the name_pfm of pfm-class

Examples

pcm <- read.table(file.path(find.package("motifStack"), "extdata", "bin_SOLEXA.pcm"))pcm <- pcm[,3:ncol(pcm)]rownames(pcm) <- c("A","C","G","T")motif <- pcm2pfm(pcm)motif <- new("pfm", mat=motif, name="bin_SOLEXA")getIC(motif)matrixReverseComplement(motif)addBlank(motif, 1, FALSE)addBlank(motif, 3, TRUE)as(motif,"matrix")as.data.frame(motif)format(motif)

pfm2pwm convert pfm object to PWM

Description

convert pfm object to PWM

Usage

pfm2pwm(x)

Arguments

x an object of pfm or pcm or matrix

Value

A numeric matrix representing the Position Weight Matrix for PWM.

Author(s)

Jianhong Ou

See Also

PWM

28 plotAffinityLogo

Examples

library("MotifDb")matrix.fly <- query(MotifDb, "Dmelanogaster")pfm2pwm(matrix.fly[[1]])

plotAffinityLogo plot affinity logo

Description

plot affinity logo

Usage

plotAffinityLogo(psam, motifName, font="Helvetica-Bold", fontface="bold",colset=c("#00811B","#2000C7","#FFB32C","#D00001"),alpha=0.5, newpage=TRUE, draw=TRUE)

Arguments

psam a position-specific affinity matrix

motifName motif name

font font of logo

fontface fontface of logo

colset color setting for each logo letter

alpha Alpha channel for transparency of low affinity letters.

newpage plot in a new canvas or not.

draw Vector (logical(1)). TRUE to plot. FALSE, return a gList

Value

none

References

Barrett C. Foat, Alexandre V. Morozov, Harmen J. Bussemaker; Statistical mechanical modeling ofgenome-wide transcription factor occupancy data by MatrixREDUCE, Bioinformatics, Volume 22,Issue 14, 15 July 2006, Pages e141-e149, https://doi.org/10.1093/bioinformatics/btl223

Examples

psam <- importMatrix(file.path(find.package("motifStack"), "extdata", "PSAM.mxr"),format="psam")[[1]]

plotAffinityLogo(psam)

plotMotifLogo 29

plotMotifLogo plot sequence logo

Description

plot amino acid or DNA sequence logo

Usage

plotMotifLogo(pfm, motifName, p=rep(0.25, 4), font="Helvetica-Bold", fontface="bold",colset=c("#00811B","#2000C7","#FFB32C","#D00001"),xaxis=TRUE,yaxis=TRUE,xlab="position",ylab="bits",xlcex=1.2, ylcex=1.2, ncex=1.2, ic.scale=TRUE, newpage=TRUE,margins=c(4.1, 4.1, 2.1, .1), draw=TRUE)

Arguments

pfm a position frequency matrices

motifName motif name

p background possibility

font font of logo

fontface fontface of logo

colset color setting for each logo letter

xaxis draw x-axis or not

yaxis draw y-axis or not

xlab x-label, do nothing if set xlab as NA

ylab y-label, do nothing if set ylab as NA

xlcex cex value for x-label

ylcex cex value for y-label

ncex cex value for motif name

ic.scale logical If TRUE, the height of each column is proportional to its informationcontent. Otherwise, all columns have the same height.

newpage logical If TRUE, plot it in a new page.

margins A numeric vector interpreted in the same way as par(mar) in base graphics.

draw Vector (logical(1)). TRUE to plot. FALSE, return a gList

Value

none

Examples

pcm<-matrix(runif(40,0,100),nrow=4,ncol=10)pfm<-pcm2pfm(pcm)rownames(pfm)<-c("A","C","G","T")plotMotifLogo(pfm)

30 plotMotifLogoStack

plotMotifLogoA plot sequence logo without plot.new

Description

plot amino acid or DNA sequence logo in a given canvas

Usage

plotMotifLogoA(pfm, font="Helvetica-Bold", fontface="bold", ic.scale=TRUE, draw=TRUE)

Arguments

pfm an object of pfm

font font of logo

fontface fontface of logo

ic.scale logical If TRUE, the height of each column is proportional to its informationcontent. Otherwise, all columns have the same height.

draw Vector (logical(1)). TRUE to plot. FALSE, return a gList

Value

none

Examples

pcm<-matrix(runif(40,0,100),nrow=4,ncol=10)pfm<-pcm2pfm(pcm)rownames(pfm)<-c("A","C","G","T")motif <- new("pfm", mat=pfm, name="bin_SOLEXA")plotMotifLogoA(motif)

plotMotifLogoStack plot sequence logos stack

Description

plot sequence logos stack

Usage

plotMotifLogoStack(pfms, ...)

Arguments

pfms a list of position frequency matrices, pfms must be a list of class pfm

... other parameters can be passed to plotMotifLogo function

plotMotifLogoStackWithTree 31

Value

none

Examples

pcm1<-matrix(c(0,50,0,50,100,0,0,0,0,100,0,0,0,0,100,0,0,0,0,100,50,50,0,0,0,0,50,50), nrow=4)

pcm2<-matrix(c(50,50,0,0,0,100,0,0,0,50,50,0,0,0,0,100,50,50,0,0,0,0,50,50), nrow=4)

rownames(pcm1)<-c("A","C","G","T")rownames(pcm2)<-c("A","C","G","T")pfms<-list(p1=new("pfm",mat=pcm2pfm(pcm1),name="m1"),

p2=new("pfm",mat=pcm2pfm(pcm2),name="m2"))pfms<-DNAmotifAlignment(pfms)plotMotifLogoStack(pfms)

plotMotifLogoStackWithTree

plot sequence logos stack with hierarchical cluster tree

Description

plot sequence logos stack with hierarchical cluster tree

Usage

plotMotifLogoStackWithTree(pfms, hc, treewidth=1/8, trueDist=FALSE, ...)

Arguments

pfms a list of position frequency matrices, pfms must be a list of class pfm

hc an object of the type produced by stats::hclust

treewidth the width to show tree

trueDist logical flags to use hclust height or not.

... other parameters can be passed to plotMotifLogo function

Value

none

32 plotMotifOverMotif

Examples

#####Input#####pcms<-readPCM(file.path(find.package("motifStack"), "extdata"),"pcm$")motifs<-lapply(pcms,pcm2pfm)

#####Clustering#####jaspar.scores <- MotIV::readDBScores(file.path(find.package("MotIV"),

"extdata", "jaspar2010_PCC_SWU.scores"))d <- MotIV::motifDistances(lapply(motifs, pfm2pwm))hc <- MotIV::motifHclust(d, method="average")

##reorder the motifs for plotMotifLogoStackmotifs<-motifs[hc$order]##do alignmentmotifs<-DNAmotifAlignment(motifs)##plot stacksplotMotifLogoStack(motifs, ncex=1.0)plotMotifLogoStackWithTree(motifs, hc=hc)

plotMotifOverMotif plot motif over another motif

Description

plot motif over another motif to emphesize the difference.

Usage

plotMotifOverMotif(motif, backgroundMotif, bgNoise=NA,font="Helvetica-Bold", textgp=gpar())

Arguments

motif an object of pcm or pfmbackgroundMotif

an object of pcm or pfm

bgNoise if it is not NA, test will using a background by Dirichlet(1)-distributed randomfrequencies with weight bg.noise. The value of bgNoise should be a number inthe range of 0 to 1, eg. 0.05

font font for logo symbol

textgp text parameter

Value

none

Examples

pcms <- readPCM(file.path(find.package("motifStack"), "extdata"),"pcm$")len <- sapply(pcms, function(.ele) ncol(.ele$mat))pcms <- pcms[len==7]plotMotifOverMotif(pcms[[1]], pcms[[2]], bgNoise=0.05)

plotMotifStackWithPhylog 33

plotMotifStackWithPhylog

plot sequence logo stacks with a ape4-style phylogenic tree

Description

plot sequence logo stacks with a ape4-style phylogenic tree

Usage

plotMotifStackWithPhylog(phylog, pfms=NULL,f.phylog = 0.3, f.logo = NULL, cleaves =1, cnodes =0,labels.leaves = names(phylog$leaves), clabel.leaves=1,labels.nodes = names(phylog$nodes), clabel.nodes = 0,font="Helvetica-Bold", ic.scale=TRUE)

Arguments

phylog an object of class phylog

pfms a list of objects of class pfm

f.phylog a size coefficient for tree size (a parameter to draw the tree in proportion toleaves label)

f.logo a size coefficient for the motif

cleaves a character size for plotting the points that represent the leaves, used with par("cex")*cleaves.If zero, no points are drawn

cnodes a character size for plotting the points that represent the nodes, used with par("cex")*cnodes.If zero, no points are drawn

labels.leaves a vector of strings of characters for the leaves labels

clabel.leaves a character size for the leaves labels, used with par("cex")*clavel.leaves

labels.nodes a vector of strings of characters for the nodes labels

clabel.nodes a character size for the nodes labels, used with par("cex")*clabel.nodes. If zero,no nodes labels are drawn

font font of logo

ic.scale logical If TRUE, the height of each column is proportional to its informationcontent. Otherwise, all columns have the same height.

Value

none

See Also

plot.phylog

34 plotMotifStackWithRadialPhylog

Examples

if(interactive()){library("MotifDb")matrix.fly <- query(MotifDb, "Dmelanogaster")motifs <- as.list(matrix.fly)motifs <- motifs[grepl("Dmelanogaster-FlyFactorSurvey-", names(motifs), fixed=TRUE)]names(motifs) <- gsub("Dmelanogaster_FlyFactorSurvey_", "",

gsub("_FBgn[0-9]+$", "",gsub("[^a-zA-Z0-9]","_",

gsub("(_[0-9]+)+$", "", names(motifs)))))motifs <- motifs[unique(names(motifs))]pfms <- sample(motifs, 50)jaspar.scores <- MotIV::readDBScores(file.path(find.package("MotIV"),

"extdata", "jaspar2010_PCC_SWU.scores"))d <- MotIV::motifDistances(lapply(pfms, pfm2pwm))hc <- MotIV::motifHclust(d, method="average")phylog <- hclust2phylog(hc)leaves <- names(phylog$leaves)pfms <- pfms[leaves]pfms <- lapply(names(pfms), function(.ele, pfms){new("pfm",mat=pfms[[.ele]],

name=.ele)},pfms)pfms <- DNAmotifAlignment(pfms, minimalConsensus=3)plotMotifStackWithPhylog(phylog, pfms, f.phylog=0.3,

cleaves = 0.5, clabel.leaves = 0.7)}

plotMotifStackWithRadialPhylog

plot sequence logo stacks with a radial phylogenic tree

Description

plot sequence logo stacks with a radial phylogenic tree

Usage

plotMotifStackWithRadialPhylog(phylog, pfms=NULL,circle=0.75, circle.motif=NA, cleaves=1, cnodes=0,labels.leaves=names(phylog$leaves), clabel.leaves=1,labels.nodes=names(phylog$nodes), clabel.nodes=0,draw.box=FALSE,col.leaves=rep("black", length(labels.leaves)),col.leaves.bg=NULL, col.leaves.bg.alpha=1,col.bg=NULL, col.bg.alpha=1,col.inner.label.circle=NULL, inner.label.circle.width="default",col.outer.label.circle=NULL, outer.label.circle.width="default",clockwise =FALSE, init.angle=if(clockwise) 90 else 0,angle=360, pfmNameSpliter=";", rcpostfix = "(RC)",motifScale=c("linear","logarithmic"), ic.scale=TRUE,plotIndex=FALSE, IndexCol="black", IndexCex=.8,groupDistance=NA, groupDistanceLineCol="red",plotAxis=FALSE, font="Helvetica-Bold")

plotMotifStackWithRadialPhylog 35

Arguments

phylog an object of class phylog

pfms a list of objects of class pfm

circle a size coefficient for the outer circle of the labels. Please note this is the positionof inner.label.cirle.

circle.motif a size coefficient for the motif circle

cleaves a character size for plotting the points that represent the leaves, used with par("cex")*cleaves.If zero, no points are drawn

cnodes a character size for plotting the points that represent the nodes, used with par("cex")*cnodes.If zero, no points are drawn

labels.leaves a vector of strings of characters for the leaves labels

clabel.leaves a character size for the leaves labels, used with par("cex")*clabel.leaves

labels.nodes a vector of strings of characters for the nodes labels

clabel.nodes a character size for the nodes labels, used with par("cex")*clabel.nodes. If zero,no nodes labels are drawn

draw.box if TRUE draws a box around the current plot with the function box()

col.leaves a vector of colors for leaves labels

col.leaves.bg a vector of colors for background of leaves labelscol.leaves.bg.alpha

alpha value [0, 1] for the colors of backgroud of leaves labels

col.bg a vector of colors for tree background

col.bg.alpha a alpha value [0, 1] of colors for tree backgroundcol.inner.label.circle

a vector of colors for inner cirlce of pfmsinner.label.circle.width

width for inner circle of pfmscol.outer.label.circle

a vector of colors for outer circle of pfmsouter.label.circle.width

width for outer circle of pfms

clockwise a logical value indicating if slices are drawn clockwise or counter clockwise

init.angle number specifying the starting angle (in degrees) for the slices. Defaults to 0(i.e., ‘3 o’clock‘) unless clockwise is true where init.angle defaults to 90 (de-grees), (i.e., ‘12 o’clock‘)

angle number specifying the angle (in degrees) for phylogenic tree. Defaults 360

pfmNameSpliter spliter when name of pfms contain multiple node of labels.leaves

rcpostfix the postfix for reverse complements

motifScale the scale of logo size

ic.scale logical. If TRUE, the height of each column is proportional to its informationcontent. Otherwise, all columns have the same height.

plotIndex logical. If TRUE, will plot index number in the motifLogo which can help userto describe the motifLogo

IndexCol The color of the index number when plotIndex is TRUE.

36 plotXaxis

IndexCex The cex of the index number when plotIndex is TRUE.

groupDistance show groupDistance on the drawgroupDistanceLineCol

groupDistance line color, default: red

plotAxis logical. If TRUE, will plot distance axis.

font font of logo

Value

none

See Also

plot.phylog

Examples

if(interactive()){library("MotifDb")matrix.fly <- query(MotifDb, "Dmelanogaster")motifs <- as.list(matrix.fly)motifs <- motifs[grepl("Dmelanogaster-FlyFactorSurvey-", names(motifs), fixed=TRUE)]names(motifs) <- gsub("Dmelanogaster_FlyFactorSurvey_", "",

gsub("_FBgn[0-9]+$", "",gsub("[^a-zA-Z0-9]","_",

gsub("(_[0-9]+)+$", "", names(motifs)))))motifs <- motifs[unique(names(motifs))]pfms <- sample(motifs, 50)jaspar.scores <- MotIV::readDBScores(file.path(find.package("MotIV"),

"extdata", "jaspar2010_PCC_SWU.scores"))d <- MotIV::motifDistances(pfms)hc <- MotIV::motifHclust(d, method="average")phylog <- hclust2phylog(hc)leaves <- names(phylog$leaves)pfms <- pfms[leaves]pfms <- lapply(names(pfms), function(.ele, pfms){new("pfm",mat=pfms[[.ele]],

name=.ele)},pfms)pfms <- DNAmotifAlignment(pfms, minimalConsensus=3)library(RColorBrewer)color <- brewer.pal(12, "Set3")plotMotifStackWithRadialPhylog(phylog, pfms, circle=0.9,

cleaves = 0.5, clabel.leaves = 0.7,col.bg=rep(color, each=5), col.leaves=rep(color, each=5))

}

plotXaxis plot x-axis

Description

plot x-axis for the sequence logo

plotYaxis 37

Usage

plotXaxis(pfm, p=rep(0.25, 4))

Arguments

pfm position frequency matrices

p background possibility

Value

none

plotYaxis plot y-axis

Description

plot y-axis for the sequence logo

Usage

plotYaxis(ymax)

Arguments

ymax max value of y axix

Value

none

psam-class Class "psam"

Description

An object of class "psam" represents the position specific affinity matrix (PSAM) of a DNA/RNA/amino-acid sequence motif. The entry stores a matrix, which in row i, column j gives the affinity ofobserving nucleotide/or amino acid i in position j of the motif.

Objects from the Class

Objects can be created by calls of the form new("psam",mat,name,alphabet,color).

38 psam-methods

Slots

mat Object of class "matrix" The position specific affinity matrix

name code"character" The motif name

alphabet "character" The sequence alphabet. "DNA", "RNA", "AA" or "others".

color a "character" vector. The color setting for each symbol

tags a list to save metadata of motif.

markers a list of marker object.

Methods

addBlank signature(x="psam",n="numeric",b="logical") add space into the position spe-cific affinity matrix for alignment. b is a bool value, if TRUE, add space to the 3’ end, elseadd space to the 5’ end. n indicates how many spaces should be added.

coerce signature(from = "psam",to = "matrix"): convert object psam to matrix

matrixReverseComplement signature(x = "psam") get the reverse complement of position spe-cific affinity matrix.

plot signature(x = "psam") Plots the affinity logo of the position specific affinity matrix.

Examples

motif <- importMatrix(file.path(find.package("motifStack"), "extdata", "PSAM.mxr"),format="psam")[[1]]

plot(motif)

psam-methods "psam" methods

Description

methods for psam objects.

Usage

## S4 method for signature 'psam,numeric,logical'addBlank(x,n,b)## S4 method for signature 'psam'matrixReverseComplement(x)## S4 method for signature 'psam,ANY'plot(x,y="missing",...)## S4 method for signature 'psam'as.data.frame(x, row.names = NULL, optional = FALSE,...)## S4 method for signature 'psam'format(x,...)

readPCM 39

Arguments

x An object of class psam.

y Not use.

n how many spaces should be added.

b logical value to indicate where the space should be added.

... Further potential arguments passed to plotAffinityLogo.row.names,optional

see as.data.frame

Methods

addBlank signature(x="psam",n="numeric",b="logical") add space into the position spe-cific affinity matrix for alignment. b is a bool value, if TRUE, add space to the 3’ end, elseadd space to the 5’ end. n indicates how many spaces should be added.

matrixReverseComplement signature(x = "psam") get the reverse complement of position spe-cific affinity matrix.

plot signature(x = "psam") Plots the affinity logo of the position specific affinity matrix.

$, $<- Get or set the slot of psam-class

as.data.frame convert psam-class to a data.frame

format return the name_pfm of psam-class

Examples

motif <- importMatrix(file.path(find.package("motifStack"), "extdata", "PSAM.mxr"),format="psam")[[1]]

matrixReverseComplement(motif)addBlank(motif, 1, FALSE)addBlank(motif, 3, TRUE)as(motif,"matrix")as.data.frame(motif)format(motif)

readPCM read pcm from a path

Description

read position count matrix from a path

Usage

readPCM(path=".", pattern=NULL)

Arguments

path a character vector of full path names

pattern an optional regular expression

40 reorderUPGMAtree

Value

A list of pcm objects

Examples

pcms<-readPCM(file.path(find.package("motifStack"), "extdata"),"pcm$")

reorderUPGMAtree re-order UPGMA tree

Description

re-order the UPGMA tree by adjacent motif distance

Usage

reorderUPGMAtree(phylog, motifs, rcpostfix = "(RC)")

Arguments

phylog an object of phylog

motifs a list of objects of pfm

rcpostfix the postfix for reverse complements

Value

an object of phylog

Author(s)

Jianhong Ou

Examples

if(interactive()){library("MotifDb")matrix.fly <- query(MotifDb, "Dmelanogaster")motifs <- as.list(matrix.fly)motifs <- motifs[grepl("Dmelanogaster-FlyFactorSurvey-", names(motifs), fixed=TRUE)]names(motifs) <- gsub("Dmelanogaster_FlyFactorSurvey_", "",

gsub("_FBgn[0-9]+$", "",gsub("[^a-zA-Z0-9]","_",

gsub("(_[0-9]+)+$", "", names(motifs)))))motifs <- motifs[unique(names(motifs))]pfms <- sample(motifs, 50)jaspar.scores <- MotIV::readDBScores(file.path(find.package("MotIV"),

"extdata", "jaspar2010_PCC_SWU.scores"))d <- MotIV::motifDistances(pfms)hc <- MotIV::motifHclust(d, method="average")phylog <- hclust2phylog(hc)reorderUPGMAtree(phylog, pfms)

}

Index

∗Topic classesmarker-class, 10motifSig-class, 18motifSig-methods, 19ouNode-class, 21pcm-class, 22pcm-methods, 23pfm-class, 25pfm-methods, 26psam-class, 37psam-methods, 38

∗Topic datasetsGeomMotif, 5

∗Topic miscgetRankedUniqueMotifs, 8highlightCol, 9importMatrix, 9mergeMotifs, 11motifCircos, 11motifPiles, 16pfm2pwm, 27reorderUPGMAtree, 40

∗Topic packagemotifStack-package, 2

∗Topic plotbrowseMotifs, 3

$,marker-method (marker-class), 10$,motifSig-method (motifSig-methods), 19$,ouNode-method (ouNode-class), 21$,pcm-method (pcm-methods), 23$,pfm-method (pfm-methods), 26$,psam-method (psam-methods), 38$<-,marker-method (marker-class), 10$<-,motifSig-method (motifSig-methods),

19$<-,ouNode-method (ouNode-class), 21$<-,pcm-method (pcm-methods), 23$<-,pfm-method (pfm-methods), 26$<-,psam-method (psam-methods), 38

addBlank (pfm-methods), 26addBlank,pcm,numeric,logical-method

(pcm-methods), 23

addBlank,pfm,numeric,logical-method(pfm-methods), 26

addBlank,psam,numeric,logical-method(psam-methods), 38

as.data.frame,pcm-method (pcm-methods),23

as.data.frame,pfm-method (pfm-methods),26

as.data.frame,psam-method(psam-methods), 38

browseMotifs, 3browseMotifs-shiny, 4browseMotifsOutput

(browseMotifs-shiny), 4

colors, 9colorset, 4

DNAmotifAlignment, 5

format,pcm-method (pcm-methods), 23format,pfm-method (pfm-methods), 26format,psam-method (psam-methods), 38frequence (motifSig-methods), 19frequence,motifSig-method

(motifSig-methods), 19

geom_motif, 6GeomMotif, 5getIC (pfm-methods), 26getIC,matrix,matrix-method

(pfm-methods), 26getIC,matrix,numeric-method

(pfm-methods), 26getIC,pcm,ANY-method (pcm-methods), 23getIC,pfm,ANY-method (pfm-methods), 26getRankedUniqueMotifs, 8GraphvizLayouts, 3

highlightCol, 9

importMatrix, 9

marker, 10

41

42 INDEX

marker (marker-class), 10marker-class, 10matrixReverseComplement (pfm-methods),

26matrixReverseComplement,pcm-method

(pcm-methods), 23matrixReverseComplement,pfm-method

(pfm-methods), 26matrixReverseComplement,psam-method

(psam-methods), 38mergeMotifs, 11motifCircos, 11, 18motifCloud, 14motifGrob, 15motifPiles, 16motifSig, 14, 19, 20motifSig (motifSig-methods), 19motifSig-class, 18motifSig-methods, 19motifSignature, 18, 20motifStack, 21motifStack-package, 2

nodelist (motifSig-methods), 19nodelist,motifSig-method

(motifSig-methods), 19

ouNode, 19, 22ouNode (ouNode-class), 21ouNode-class, 21

palette, 9pcm, 11, 27, 32, 40pcm (pcm-methods), 23pcm-class, 9, 10, 22pcm-methods, 23pcm2pfm (pcm-methods), 23pcm2pfm,data.frame,ANY-method

(pcm-methods), 23pcm2pfm,data.frame,numeric-method

(pcm-methods), 23pcm2pfm,matrix,ANY-method

(pcm-methods), 23pcm2pfm,matrix,numeric-method

(pcm-methods), 23pcm2pfm,pcm,ANY-method (pcm-methods), 23pfm, 3, 11, 21, 27, 32pfm (pfm-methods), 26pfm-class, 9, 10, 25pfm-methods, 26pfm2pwm, 27plot,pcm,ANY-method (pcm-methods), 23plot,pfm,ANY-method (pfm-methods), 26

plot,psam,ANY-method (psam-methods), 38plot.phylog, 33, 36plotAffinityLogo, 28plotMotifLogo, 29plotMotifLogoA, 30plotMotifLogoStack, 21, 30plotMotifLogoStackWithTree, 21, 31plotMotifOverMotif, 32plotMotifStackWithPhylog, 21, 33plotMotifStackWithRadialPhylog, 13, 21,

34plotXaxis, 36plotYaxis, 37psam (psam-methods), 38psam-class, 37psam-methods, 38PWM, 27

readPCM, 39renderbrowseMotifs

(browseMotifs-shiny), 4reorderUPGMAtree, 40rgb, 9

sigColor (motifSig-methods), 19sigColor,motifSig-method

(motifSig-methods), 19signatures (motifSig-methods), 19signatures,motifSig-method

(motifSig-methods), 19

trimMotif (pcm-methods), 23trimMotif,pcm,numeric-method

(pcm-methods), 23trimMotif,pfm,numeric-method

(pfm-methods), 26


Recommended