39
A2T Packet #2: Absolute Value Equations and Inequalities; Quadratic Inequalities; Rational Inequalities Name:______________________________ Teacher:____________________________ Pd: _______

A2T
Packet #2: Absolute Value Equations and
Inequalities; Quadratic Inequalities;
Rational Inequalities
Name:______________________________
Teacher:____________________________
Pd: _______

Table of Contents
o Day 1: SWBAT: Solve Compound Inequalities
Pgs: 1 - 6 in Packet
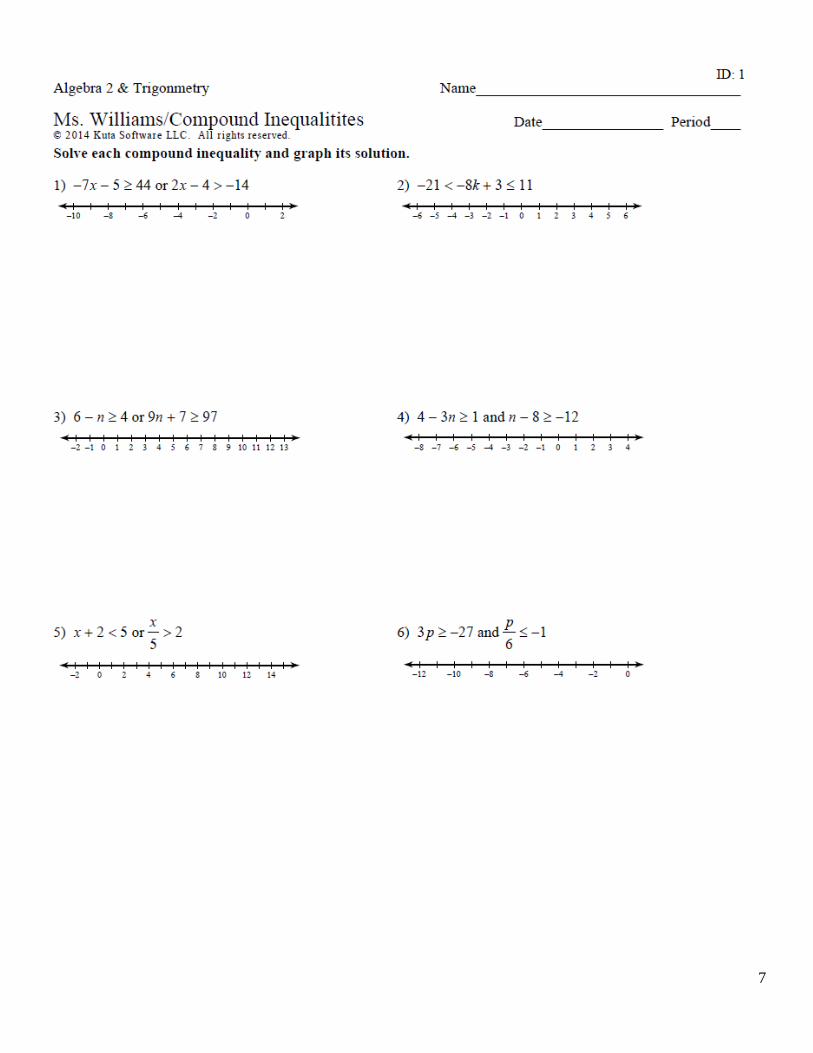
HW: Pages #7-8 in Packet
o Day 2: SWBAT: Solve Absolute Value Equations
Pgs: 9-14 in Packet
HW: Page 16 in Textbook #5-14 all
o Day 3: SWBAT: Solve Absolute Value Inequalities
Pgs: 15-21 in Packet
HW: Page 16 in Textbook #19- 25 (odd) and Page 83 in Textbook #21,22,24-26
o Day 4: SWBAT: Solve and graph Quadratic Inequalities Pgs: 22-26 in Packet
HW: Page 35 in Textbook #3-17 (odd)
o Day 5: SWBAT: Solve Rational Inequalities
Pgs: 27-33 in Packet
HW: Page 73 in Textbook #3-13 all
HW Answer Keys – Pages 35 – 37 in Packet
1
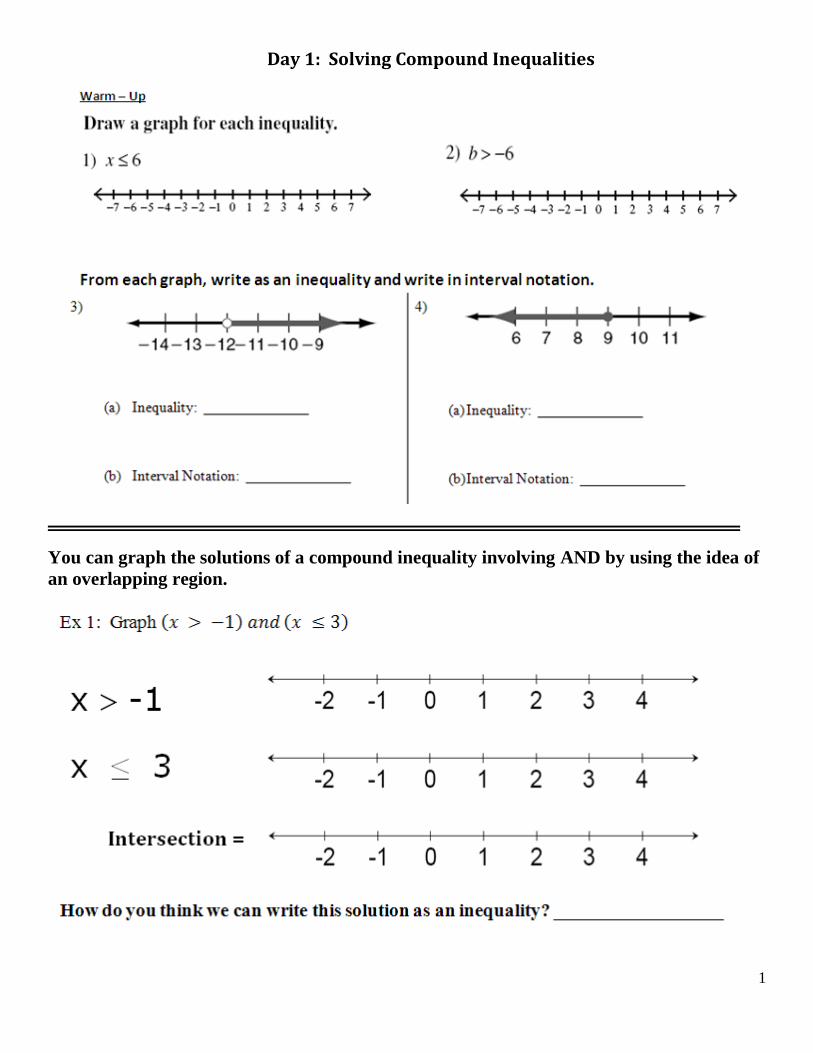
Day 1: Solving Compound Inequalities
You can graph the solutions of a compound inequality involving AND by using the idea of
an overlapping region.
Ex 1: Graph ( ) ( )

2
You can graph the solutions of a compound inequality involving OR by using the idea of combining regions. The combine regions are called the union and show the numbers that are solutions of either inequality.
Ex 2: Graph ( ) ( )
Union =
How do you think we can write this solution as an inequality? __________________
Compound Inequalities
The inequalities you have seen so far are simple inequalities. When two simple inequalities are
combined into one statement by the words AND or OR, the result is called a compound inequality.
NOTE the following symbols:
Λ means AND V means OR
3
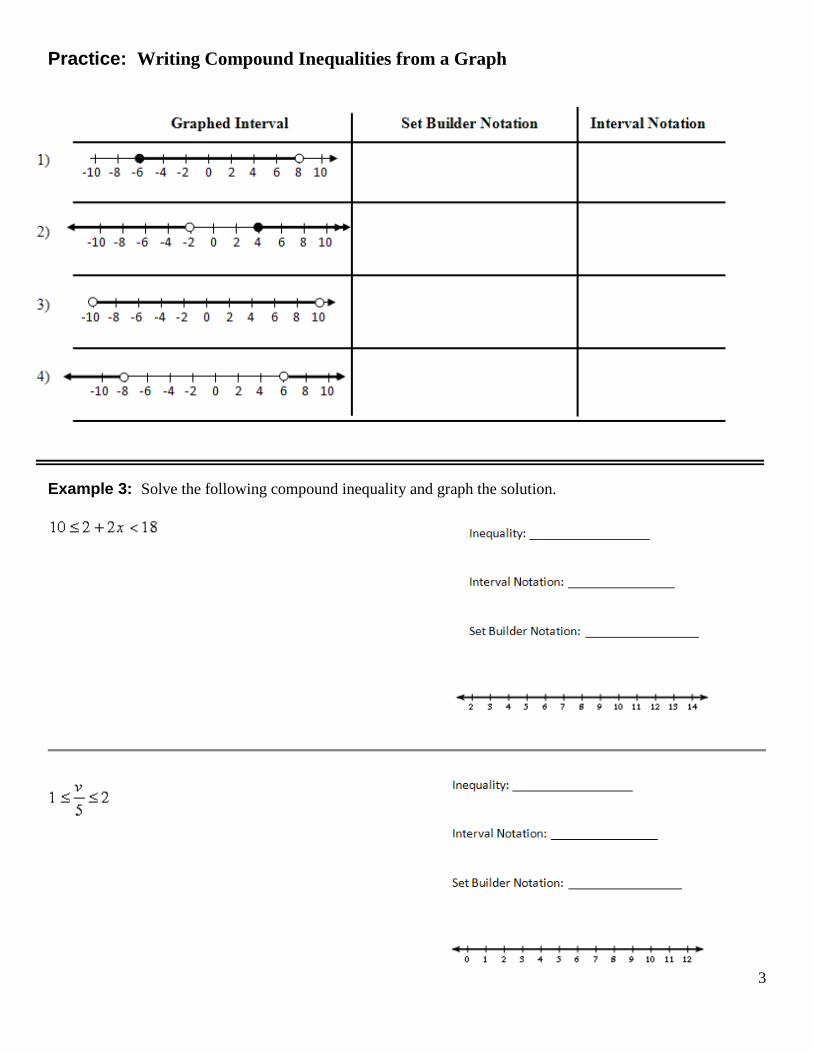
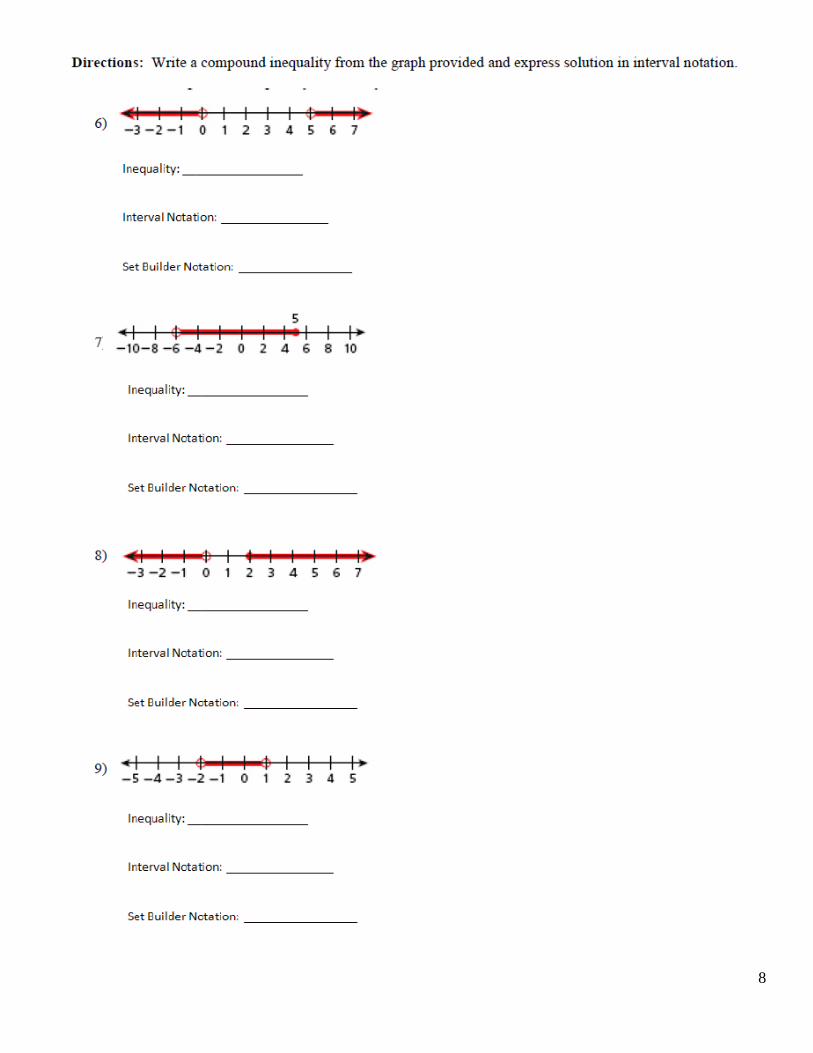
Practice: Writing Compound Inequalities from a Graph
Example 3: Solve the following compound inequality and graph the solution.
Example 3: Solve the following compound inequality and graph the solution.
4
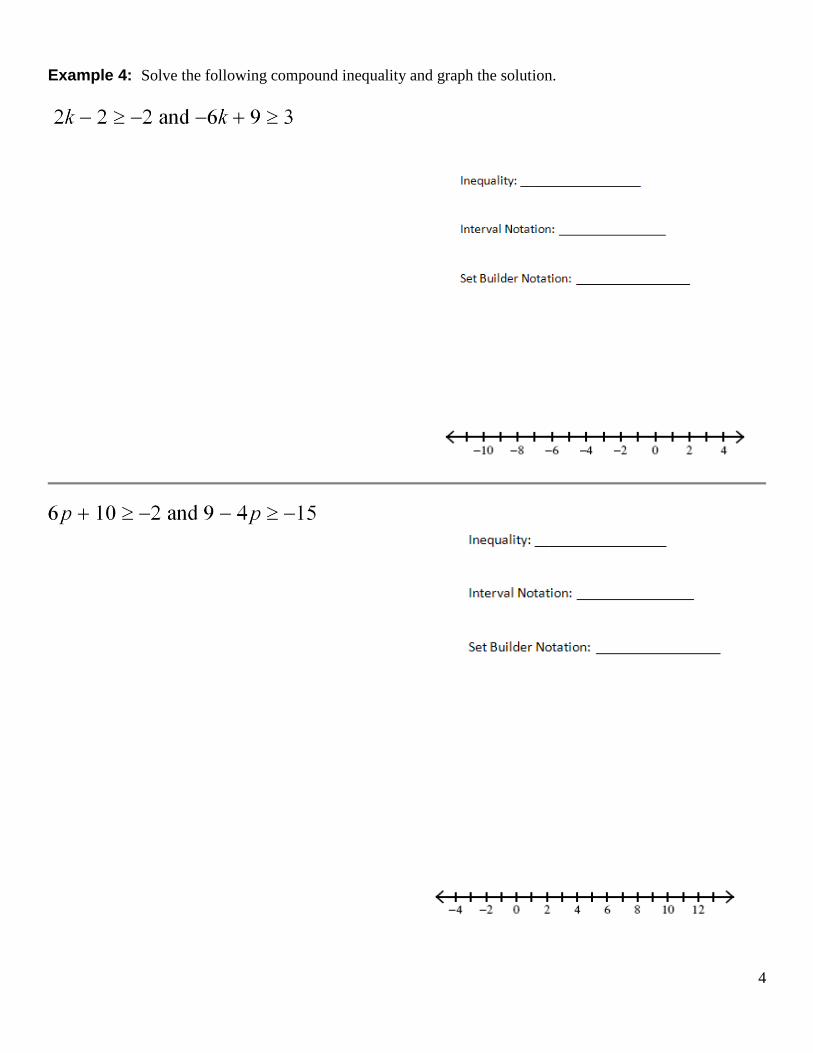
Example 4: Solve the following compound inequality and graph the solution.

5
Example 5: Solve the following compound inequality and graph the solution.
Challenge

6
Exit Ticket
7
8

9
Day 2: Solving Absolute Value Equations
Warm – Up:
Graphical Definition of Absolute Value: The absolute value of a number is the number’s distance from zero on the number line. Examples:
| | | |
| |

10
Please note that “just making the inside positive” does no work when there are algebraic expressions inside the absolute value symbols. Examples:
| | Does not always
equal
| | Does not always
equal
| | Generally does not equal
( ) . .
a) | |
{ }
b) | |
{ }
c) | |
{ }
d) | |
{ }
Solving Absolute Value Equations Algebraically
Example 2: What is the solution set of the equation | |

11
Practice: What is the solution set of the equation | |
Example 3: What is the solution set of the equation | |

12
Example 4: What is the solution set of the equation | |
Practice: What is the solution set of the equation | |

13
Example 5: What is the solution set of the equation | |
Practice: What is the solution set of the equation | |

14
Challenge:
Solve |x - 3| = |x + 2|
Summary:
Exit Ticket:

15
Day 3: Solving Absolute Value Inequalities
Warm – Up:
Yesterday we discussed that the absolute value of a number is the number’s distance from zero on the number line. So, |a| is defined as the distance from a to 0.
| | | |
So,
Use these facts to solve: Less ThAND
o Re-write as a compound AND statement o Interval and Graph will be between two numbers
GreatOR
o Re-write as an OR statement o Interval and Graph will be Union of two sets

16
Solve and graph each of the following inequalities:
Example 1: | |
Step 1: Is the absolute value isolated?
Step 2: Is the number on the other side negative?
Step 3: Set up a compound inequality
Step 4: Solve the compound inequality and graph.
Example 2: |
|
Step 1: Is the absolute value isolated?
Step 2: Is the number on the other side negative?
Step 3: Set up a compound inequality
Step 4: Solve the compound inequality and graph.

17
Solve and graph each of the following inequalities:
Practice: | |
|
|

18
Solve and graph each of the following inequalities:
Example 3: | |
Step 1: Is the absolute value isolated?
Step 2: Is the number on the other side negative?
Step 3: Set up a compound inequality
Step 4: Solve the compound inequality and graph.
Example 2: | |
Step 1: Is the absolute value isolated?
Step 2: Is the number on the other side negative?
Step 3: Set up a compound inequality
Step 4: Solve the compound inequality and graph.

19
Solve and graph each of the following inequalities:
Practice: | |
4 + | |

20
Special Cases: o If the Absolute value is greater than a negative number
o This is ALWAYS TRUE o Solution is (-∞ ∞) or All Real Numbers
|3x – 4| + 9 > 5 Step 1: Is the absolute value isolated?
Step 2: Is the number on the other side negative?
o If the Absolute value is less than zero
o This is NEVER TRUE o No Solution or { }
|5x + 6| + 4 < 1
Step 1: Is the absolute value isolated?
Step 2: Is the number on the other side negative?

21
Challenge Solve and graph the following inequality.
Summary: Exit Ticket
22
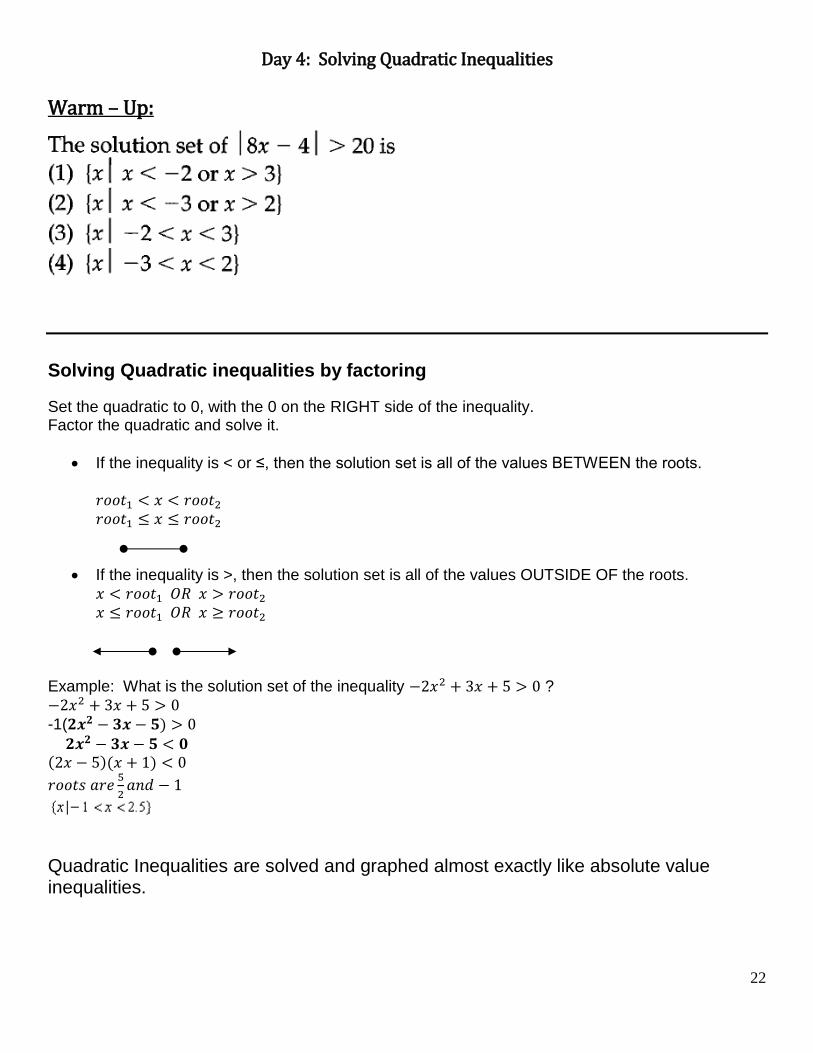
Day 4: Solving Quadratic Inequalities
Warm – Up:
Solving Quadratic inequalities by factoring
Set the quadratic to 0, with the 0 on the RIGHT side of the inequality. Factor the quadratic and solve it.
If the inequality is < or ≤, then the solution set is all of the values BETWEEN the roots.
If the inequality is >, then the solution set is all of the values OUTSIDE OF the roots.
Example: What is the solution set of the inequality ?
-1( )
( )( )
Quadratic Inequalities are solved and graphed almost exactly like absolute value inequalities.
23
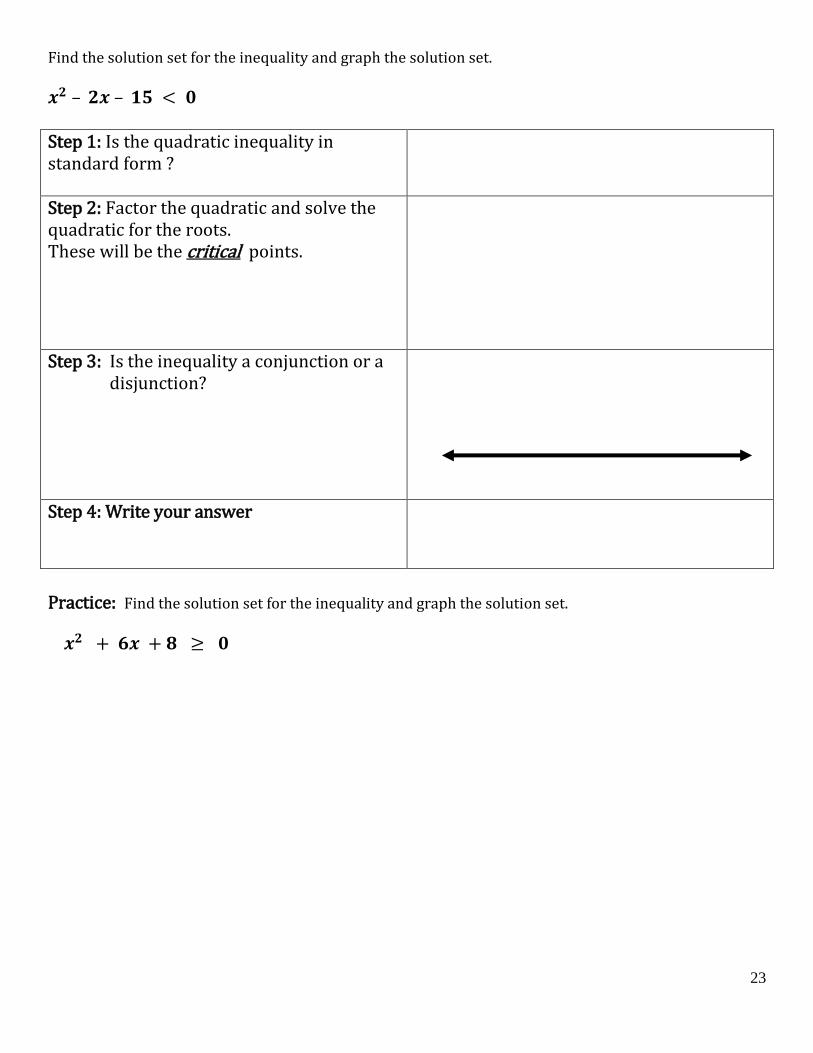
Find the solution set for the inequality and graph the solution set.
– – Step 1: Is the quadratic inequality in standard form ?
Step 2: Factor the quadratic and solve the quadratic for the roots. These will be the critical points.
Step 3: Is the inequality a conjunction or a disjunction?
Step 4: Write your answer
Practice: Find the solution set for the inequality and graph the solution set.

24
– – Step 1: Is the quadratic inequality in standard form ?
Step 2: Factor the quadratic and solve the quadratic for the roots. These will be the critical points.
Step 3: Is the inequality a conjunction or a disjunction?
Step 4: Write your answer
Practice: Find the solution set for the inequality and graph the solution set.

25
Step 1: Is the quadratic inequality in standard form ?
Step 2: Factor the quadratic and solve the quadratic for the roots. These will be the critical points.
Step 3: Is the inequality a conjunction or a disjunction?
Step 4: Write your answer
Practice: Find the solution set for the inequality and graph the solution set.

26
Regents Questions/Exit Ticket
1. The solution set for the inequality is
1) 2) 3) 4)
2. What is the solution set for the inequality ?
1)
2)
3)
4)
Challenge: Solve and Graph:
Summary:
Key Concept

27
Day 5: Solving Rational Inequalities Warm – Up: Which graph represents the solution of the inequality ?
1)
2)
3)
4)
*** Inequalities are usually solved with the same procedures that are used to solve equations. ***Remember that we divide or multiply by a negative number, the inequality is reversed. Example 1: Solving Simple Rational Inequalities (No Variable in Denominator)
Step 1: Is there a variable in your denominator?
Step 2: Find the LCD of your denominators LCD =
Step 3: Multiply each term by the LCD
Step 4: Solve the inequality.
28
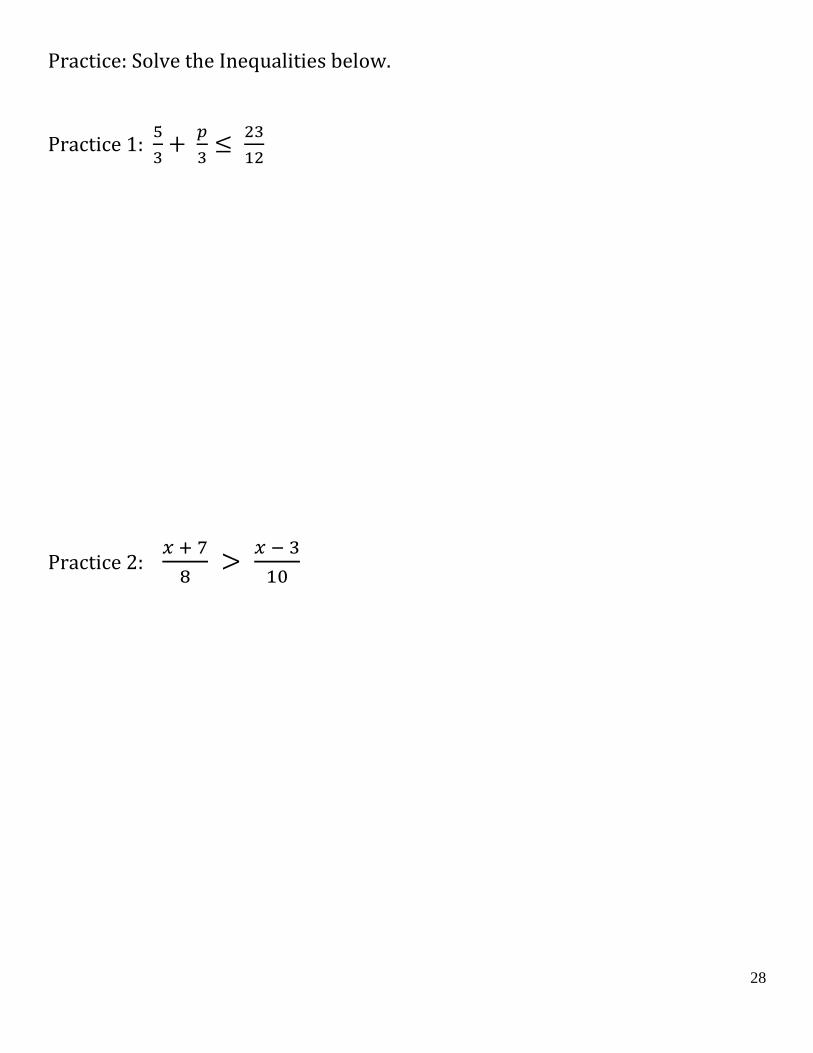
Practice: Solve the Inequalities below.
Practice 1:
Practice 2:

29
Example 2: Solving Rational Inequalities (Variables in Denominator)
Solve and Graph the following inequality:
Step 1: Is there a variable in your denominator?
Step 2: Write the inequality in the correct form.
One side must be zero and the other side can
have only one fraction, so simplify the fractions
if there is more than one fraction.
Step 3: Find the key or critical values. To find
the key/critical values, set the numerator and
denominator of the fraction equal to zero and
solve.
Step 4: Make a sign analysis chart. To make a
sign analysis chart, use the key/critical values
found in Step 2 to divide the number line into
sections.
Step 5: Perform the sign analysis. To do the sign
analysis, pick one number from each of the
sections created in Step 3 and plug that number
into the polynomial to determine the sign of the
resulting answer.
Step 6: Use the sign analysis chart to determine
which sections satisfy the inequality.
Step 7: Write the final answer.

30
Example 3: Solve and Graph the following inequality:
Step 1: Is there a variable in your denominator?
Step 2: Write the inequality in the correct form.
One side must be zero and the other side can
have only one fraction, so simplify the fractions
if there is more than one fraction.
Step 3: Find the key or critical values. To find
the key/critical values, set the numerator and
denominator of the fraction equal to zero and
solve.
Step 4: Make a sign analysis chart. To make a
sign analysis chart, use the key/critical values
found in Step 2 to divide the number line into
sections.
Step 5: Perform the sign analysis. To do the sign
analysis, pick one number from each of the
sections created in Step 3 and plug that number
into the polynomial to determine the sign of the
resulting answer.
Step 6: Use the sign analysis chart to determine
which sections satisfy the inequality.
Step 7: Write the final answer.

31
Example 4: Solve and Graph the following inequality:
Step 1: Is there a variable in your denominator?
Step 2: Write the inequality in the correct form.
One side must be zero and the other side can
have only one fraction, so simplify the fractions
if there is more than one fraction.
Step 3: Find the key or critical values. To find
the key/critical values, set the numerator and
denominator of the fraction equal to zero and
solve.
Step 4: Make a sign analysis chart. To make a
sign analysis chart, use the key/critical values
found in Step 2 to divide the number line into
sections.
Step 5: Perform the sign analysis. To do the sign
analysis, pick one number from each of the
sections created in Step 3 and plug that number
into the polynomial to determine the sign of the
resulting answer.
Step 6: Use the sign analysis chart to determine
which sections satisfy the inequality.
Step 7: Write the final answer.

32
Example 5: Solve and Graph the following inequality:
Step 1: Is there a variable in your denominator?
Step 2: Write the inequality in the correct form.
One side must be zero and the other side can
have only one fraction, so simplify the fractions
if there is more than one fraction.
Step 3: Find the key or critical values. To find
the key/critical values, set the numerator and
denominator of the fraction equal to zero and
solve.
Step 4: Make a sign analysis chart. To make a
sign analysis chart, use the key/critical values
found in Step 2 to divide the number line into
sections.
Step 5: Perform the sign analysis. To do the sign
analysis, pick one number from each of the
sections created in Step 3 and plug that number
into the polynomial to determine the sign of the
resulting answer.
Step 6: Use the sign analysis chart to determine
which sections satisfy the inequality.
Step 7: Write the final answer.

33
Summary:
Step 1: Write the inequality in the correct
form. One side must be zero and the other
side can have only one fraction, so simplify
the fractions if there is more than one
fraction.
Step 2: Find the key or critical values. To
find the key/critical values, set the numerator
and denominator of the fraction equal to zero
and solve.
Step 3: Make a sign analysis chart. To make
a sign analysis chart, use the key/critical
values found in Step 2 to divide the number
line into sections.
Step 4: Perform the sign analysis. To do the
sign analysis, pick one number from each of
the sections created in Step 3 and plug that
number into the polynomial to determine the
sign of the resulting answer.
Remember:
Same Signs Positive Different Signs egative
Step 5: Use the sign analysis chart to
determine which sections satisfy the
inequality. In this case, we have greater than
or equal to zero, so we want all of the
positive sections. Notice that x ≠ 1 because it
would make the original problem undefined,
so you must use an open circle at x = 1
instead of a closed circle to draw the graph.
Step 6: Use interval notation to write the
final answer.

34
HOMEWORK ANSWERS
35
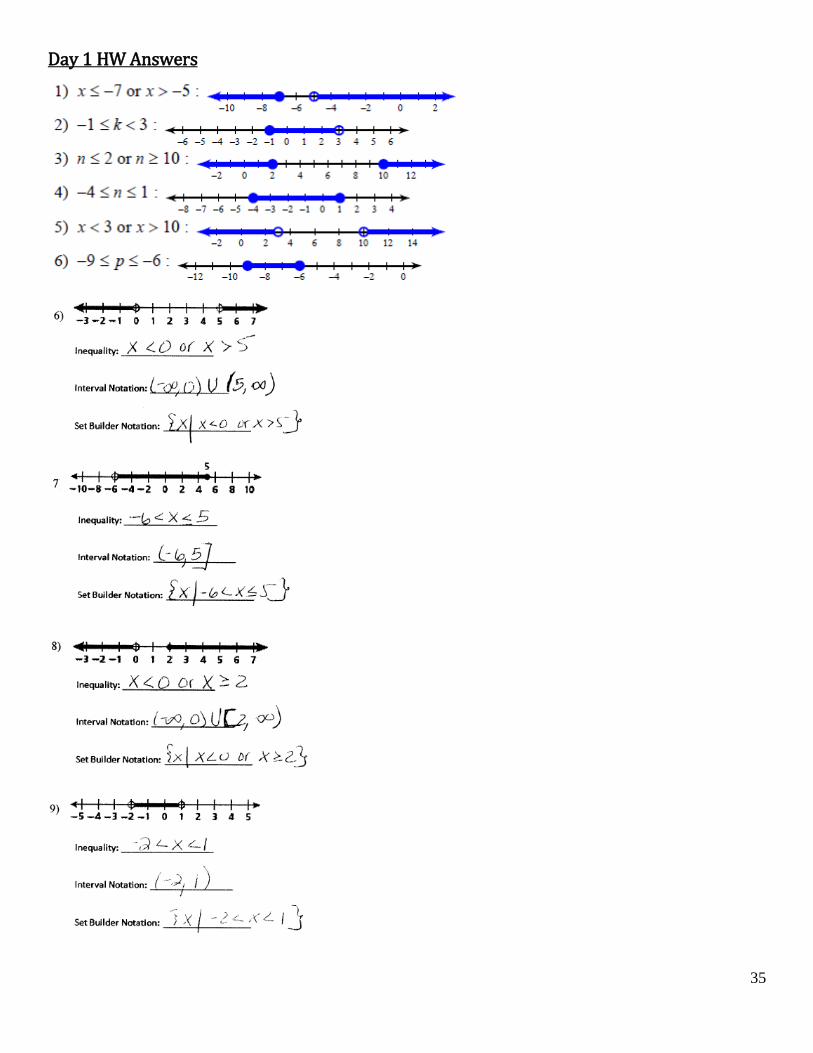
Day 1 HW Answers
36
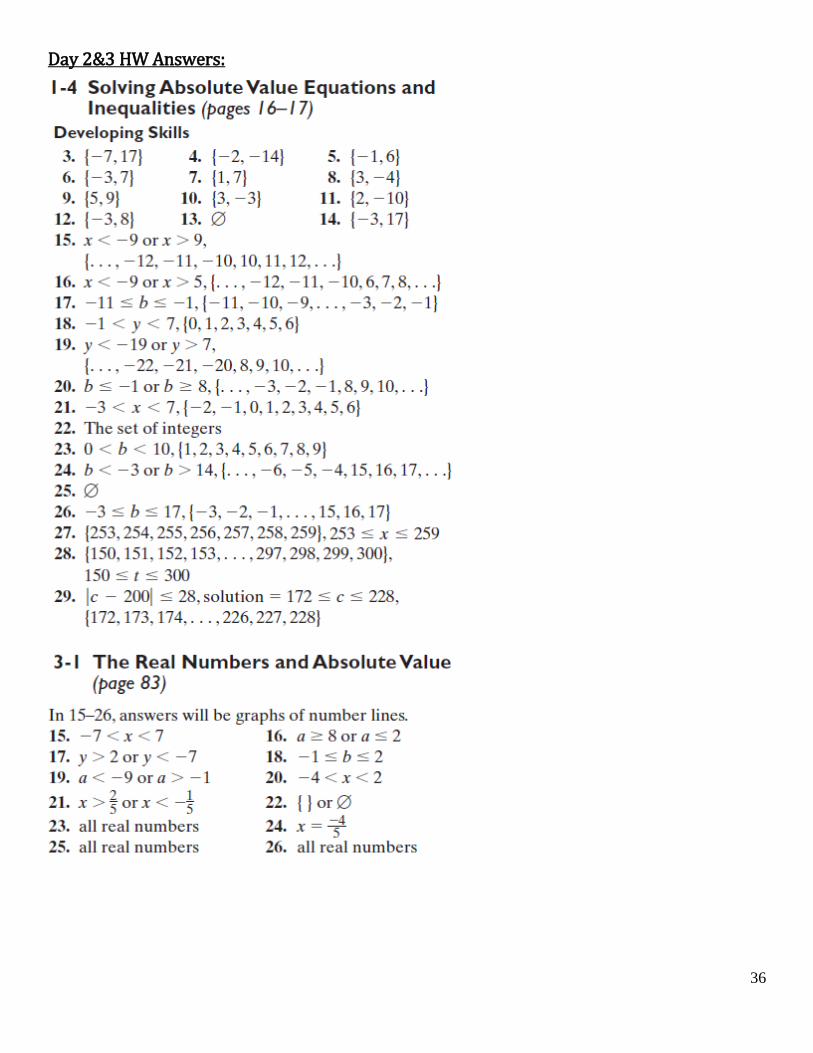
Day 2&3 HW Answers:

37
Day 4 Answers: Day 5 Answers:


