Packing Cues for Health Understanding the Effects of Explicit and Implicit Package Design Cues on Food Evaluation Conjoint study Clymbol Master Thesis MCB-80433 2014/2015 Prepared by: Olga Solcerová Registration number: 880806784130 E-mail: [email protected]Study programme: MME Specialization: Consumer Studies Supervisor: Ellen van Kleef Supervisor: Ivo van der Lans
Transcript
Packing Cues for Health
Understanding the Effects of Explicit and Implicit
Figure 17: Satiety task - picture ............................................................................................... 26 Figure 18: Satiety task - logo ................................................................................................... 26 Figure 19: Estimated marginal means of healthiness task for Logo and Claim ...................... 36 Figure 20: Estimated marginal means of health for Picture and Colour .................................. 36
Figure 21: Estimated marginal means of indulgence for Logo and Picture ............................. 37 Figure 22: Post-hoc Tukeys HSD for simple effect ................................................................. 38 Figure 23: Estimated marginal means of natural for Logo and Claim ..................................... 39
Table 1: Product attributes and levels included in pilot study ................................................. 19 Table 2: Recapitulation - results of pilot study – highest frequency of use of each attribute in
each task ................................................................................................................................... 26 Table 3: Background information about participants ............................................................... 27 Table 4: Product attributes and levels included in main study ................................................. 28
Table 5: Congruency scoring system ....................................................................................... 29 Table 6: 5 packages for common set ........................................................................................ 31
Table 7: Results of ANOVAs for 4 dependent variables: healthiness, indulgence, natural,
satiety ....................................................................................................................................... 34 Table 8: Simple effect analysis of claim at different levels of logo. ........................................ 35
Table 9: Post-hoc Tukeys HSD for simple effects ................................................................... 35 Table 10: Simple effect analysis of Picture at different level of colour .................................. 36
Table 11: Simple effect analysis of logo at different levels of picture .................................... 37 Table 12: Simple Effect Analysis of claim at different levels of logo .................................... 38 Table 13: Post-hoc Tukeys HSD .............................................................................................. 39
Table 14: ANOVA for attractiveness and willingness to purchase.......................................... 40 Table 15: Results ...................................................................................................................... 41 Table 16: SOP - Visual - Mean and St. Deviation ................................................................... 42 Table 17: SOP - Verbal - Mean and St. Deviation ................................................................... 42
The context in which health claims and logos appear is crucial to understanding the effects
they have on consumers. A matter that has been largely ignored in the marketing industry is
that health claims and symbols are perceived in the context of more implicit package cues.
Implicit cues such as pictures, package colour or pictorials have been shown to have a strong
impact on expectations. These “soft” packaging cues such as the colour of the pack and the
portrayal of ingredients may lead to an inference making process based on existing
knowledge, and previous experiences and associations (Grunert et al., 2011)
A question of how implicit cues interact with more explicit health claims on a food package
is unclear. Nutrition information in the form of a logo or claim is processed by consumers in
constant interaction with other package cues (e.g. brand name, images) and with knowledge
and associations already in memory (Grunert et al., 2011). It could be caused by large amount
of effects among which belongs the congruency effect; thus a certain level of conformity
between different factors or features of the particular stimuli (Krishna, Elder and Caldara,
2012). Certain combinations have more effect together than separate. This might be strongly
related to a certain type of fluency in information processing. Aim of this study is therefore to
understand how consumers value product package design cues (explicit and implicit) and how
combinations of cues (and possible congruence between them) can influence perceptions and
choice.
We will conduct a conjoint analysis as this method allows the analysis of the influence of
individual attribute levels on the overall healthiness and indulgence perception. As a control
dependent variable, we included perception of satiety and naturalness since these variables
can have very similar effect on consumers perception and evaluation of product as healthiness
and indulgence and thus the trade-off can be seen also in these variables. In this conjoint
study, two types of factors will be included: informational (i.e. verbal claims, logos) and
inferential (i.e. colour, illustrations of ingredients or persons). Our key dependent variables
are healthiness, indulgence, naturalness and satiety ratings of the food in the package.
Moreover, claims and logos on food packages influence not only consumer perceptions, but
also the amount of food they eventually eat (Albarracin, 2009) hence satiety of consumers.
Additionally we will also measure attractiveness of package design and willingness to
purchase certain product with specific combinations of cues.
This study can significantly help in the fight against overeating and its contribution to
overweight – both to consumers and to policymakers who make regulations dealing with this
topic. It can also educate and create awareness about the risky impact of appealing, yet
misleading packages on overeating.
In the next chapter a conceptual model will be presented in accordance the theory behind this
issue and also introduced studies that have been already published, and are related to this
topic. In the third chapter is methodology, which illustrates our progress in creating a pilot
and main study of this thesis as well as introduce sbujects, stimuli and procedure. The fourth
chapter is devoted to the results of the experimental part of the work and in the lasly,
discussion, conclusion, recommendations and limitations of this work .
8
2. THEORETICAL FRAMEWORK
Many factors affect the final process and overall perception, evaluation and willingness to
purchase the product by the consumer. Some studies deal specifically with the influence of
implicit or explicit design cues. Gap in knowledge is seen in the interactions of these two
types of design cues and how they work if the consumer is exposed to their action
simultaneously. These processes are independent of each other and will vary in different
situations for different consumers. Therefore, in the research process, we restrict to us
important phase, which can be found in Figure 1. This graph therefore indicates what process
we go through in understanding, purchase and consumption behaviour. Each part of this
conceptual model is explained using published literature and other available and reliable
sources. The numbers behind the names of each box in the model identifies the number of the
chapter, which is devoted to that specific topic.
Figure 1: Conceptual model of conjoint study
2.1 Explicit and Implicit design cues, their effects on perception and suggested mechanisms explaining the effects
In this chapter, we explain the basic very fundamental notions of implicit and explicit cues.
Also we will try to explain what effects these cues can have separately on the perception and
evaluation of product and suggest the underlying mechanisms of these effects.
2.1.1 Explicit design cues Explicit design cues of a package can be defined as cues that clearly communicate a message
in a verbal manner (Dillard and Shen, 2005). It relates to the degree of certainty in the
language that is used to communicate the message, and depends mainly on the clarity of
Congruency
(2.5) Fluency (2.6)
Exposure to
food package
design:
Combination
of implicit
and explicit
design cues
(2.1)
Categorizatio
n - health
versus
indulgent
(2.2)
Inference
making (2.3)
Expectations
of taste and
health (2.4)
Willingnes
to purchase
Individual differencies - style of processing,
personal traits, gender (2.7)
9
expression for the recipient of this information. According to Dillard and Shen, a message is
explicit when it is clearly and explicitly expressed using words such as "should" or "must",
and excluding less explicit expressions such as "could" and "would" (Miller et all., 2007).
Hodkings et al. (2012) used the word "directive-ness" when discussing explicitness of health
claim information. This term determines how much consumers are guided through the cues to
the conclusion that the product is healthy. It was demonstrated that if the value of "directive-
ness" information is high, this information will most likely accepted by consumers (Hodkings
et al., 2012). It is possible to find many studies that hypothesized that explicit expressions and
cues are generally more powerful than implicit. This was also proved in O'Keefe´s study in
1997, which confirmed that the formulated signs facilitate understanding and thus strengthen
the perception of such a cues. In this thesis, claims and logos are considered as explicit design
cues.
2.1.1.1 Effects of explicit information at food packages on healthiness perceptions and food consumption
Empirical evidence to how health claims and logos influence perceptions and intake
As we mention already in previous chapter food which contain “health claim” is perceived as
healthier and containing less fat (Provencher et al., 2009). On the other hand certain words or
statements can be perceived as too aggressive and therefore the overall effect can be opposite.
Due to the fact that the product bearing slogans such as “healthy" are these products
considered as less caloric (Gravel et al, 2012). When it comes to the second attribute of
explicit design cues, logo is defined as a possible combination of graphic and verbal
expression. A study shows that appearance of logo proclaiming health in one of two
absolutely identical products caused that this product is immediately perceived as a healthier
(Steenhuis, et al., 2010). To avoid this undesirable effect and at the same time meet the
demands of consumers for simplicity and intuitiveness, was proposed the solutions in the
form of a clearly-defined resolution graphic of a healthy (red)/unhealthy (red) amount of a
product or essential nutritional components (salt, fet, saturated fet, sugar) of this product in
form of traffic light method (green colour of traffic light displayed on the package means low
or healthy level of one of the keys component of this food product) (van Herpen, van Trijp,
2011). In this study was also discusses the so-called GDA (guideline daily amount), which
can consumer find on some food products packages. With GDA consumer sees a percentage
of nutritional ingredients like fat and sugar, contained in the product of a total of 100%, which
should get up in the body in average for one day, but the real information about the
healthiness/unhealthiness of product this information does not provide.
2.1.1.2 Suggested underlying mechanisms and theories explaining effects
Attention One of the prerequisites in the overall consumer decision-making process in term of choice is
attention. Attention is first behavioral process that will determine the subsequent behavior of
the consumer. If a product does not attract the attention of consumers, this product will not
emerge in the next stage of the decision-making process and will not be purchased. If the
product gets the consumer's attention, we can expect that the consumers will focus on
information about the nutritional values only in case they have the tendency to buy healthy
food (van Herpen, van Trijp 2011). As for the graphic design packages, the most attention
attractive packages that are simple, with a large sign (double letters) and uniform color.
Furthermore, Schuldt (2013), Bialkova and van Trijp, (2010) argue that color matters.
10
Different colors can differently attract consumers attention and thus evoke in the consumer
different feelings and tendencies to perceive the food product. The level of consumers
attention may be conditional on the colors that are used in various parts of the package (see
implicit cues and color psychology).
Goal accessibility and activation Another described attribute of food are goals of consumption. The goal can be defined as a
kind of future final state, which we want to achieve by our action (Aarts & Dijksterhuis,
2000). There are two main goals: the goals covering the enjoyment of food and goals, that are
rather focused at the weight control of consumers (Stroebe, 2002). These two objectives are
basically forcing consumers to choose between long-term satisfaction in the form of a healthy
lifestyle and therefore strong health, or an immediate and also short-term enjoyment of very
tasty but unhealthy food (Fishbach, Shah, 2006). Of course, given the previous definition of
goals it is certain that the majority of consumers stated that their goal the long-term health
(Fishbach, Friedman, Kgruglanski, 2003), but unfortunately not in all cases this means the
actual outcome in the form of self-regulation and a healthy lifestyle. For example Fishbach
and Dhar (2005) found that unfulfilled goals become more important, while the filled and well
managed ones enhance desire for our secondary goals.
Priming and liberating effect Furthermore, very related fact is how consumers create their goals and what it can affect. In
particular priming may at some point influence our goal (Aarts, 2007) and hope that the health
claims at the food labels can prime people to act according the weight control goal (Papies,
2012) therefore long-term health maintenance. Priming refers to the process of increasing the
accessibility of schemata, concepts or stored information by recent and repeated exposure to
similar schemata, concepts and information (Rotenberg et al., 2005). This tendency can
disrupt the liberating effect, which indicates a situation where the consumer consumes far
more product only because it is classified as healthy and also for the reason that this choice
may refuse the second alternative - to consume a product that is tasteful and very often
classified as unhealthy (Fishbach & Dhar 2005).
Licensing effect Wansink and Chandon (2006) describes in their work so-called licensing effect in which the
food consumption again rises due to reduced feelings of guilt, which is caused by misleading
health claims (e.g. the "low fat" claims on the packaging of chips) on product packaging. This
behavior consumers are trying to reduce the feeling of guilt that they have in case they eat
conventional regular type of products.
Health Halo effect Overall, there is evidence that people are affected in the process of inference making by
health claims and that they perceive products containing health claims as much healthier than
products without healthy claims (Lahteenmaki, 2013). At the same time it was proven that
health claims often cause misleading, which can result in negative effects such as Health hallo
effect (Grunert et all, 2011). Consumers regularly underestimate the caloric intake of a food
product labeled with health claims (Oakes, 2004). Provencher et al (2009) in their study
showed that health claims can increase consumption up to 35%.
11
Food compensation Health claims and subsequent inference making can also lead to food compensation. This
effect is partially explained in the study of Werle et al. (2011), who suggests that mental effort
we put into thinking about physical activity is associated and highly connected with
subsequent actual physical consumption of food. In other words, if the packaging is
highlighted with the word "active", our mind is immediately engaged with the idea of physical
activity and we feel like we can consume far more food. Food compensation can be related
also to implicit cues which was confirmed by e.g. a study of Albarracin et al. (2009), who
hypothesized that if a person is exposed to an image or inscription, which is in some sense
related to a physical activity, that consumer then automatically consumes more food.
2.1.2 Implicit design cues Implicit information allows message recipients to understand communication in different
ways. In other words, recipients may interpret the information differently. Implicitness is
defined as a degree of uncertainty in communication, something that is not directly said but is
included in the information. Miller et al. (2007) believe that implicitness is a somewhat
indirect expression of the message. In the case of implicit messages there is a certain space for
independence in terms of explanation of the cues by each separate individual.
There is evidence that implicit design cues are perceived as more powerful (Paek et al., 2010),
since these cues are easily processed and stored in human brain (Chrysochou, Grunert, 2014).
This effect is clearly proved by Paek et al. (2010) which conducted a study where were verbal
claims substituted by different colors or pictures which eventually caused easier processing
and therefore higher level of persuasion. In this thesis colour and image are considered as
implicit cues. Both package colour and images on the package may be a source of extrinsic
information, which helps to create an overall intrinsic impression (Underwood, Klein, 2002).
2.1.2.1 The effect of implicit cues on perceptions and food consumption
Empirical evidence on how color influence perceptions and intake Color is one of the attributes in which, the effect of implicit packaging cues is. Such
information is commonly seen in specific colors or images on the packaging containers.
Chrysochou, Grunert (2014) and Peak (2010) suggest that visual cues on food packaging have
a powerful effect in influencing consumer behavior. This example demonstrates the
experiment, which was created by Chrystochou and Grunert (2014) in their study, which
consisted of the evaluation of 12 products (5 yoghurts, 5 cheeses and 2 indeterminate products
only with a specific ad). Study participants were asked to rate these 12 products in terms of
healthiness and a tendency to purchase the product. The result showed that the largest effect
on the overall evaluation had health images that were displayed in different contexts. The
human brain can remember visual graphical cues much faster and easier than explicit verbal
ones (Chrysochou, Grunert, 2014). Color can also significantly effect consumer behavior and
choice. Different colors have different effects on consumers. This is evident from Schuldt´s
(2013) studies, where it is claimed that e.g. consumers perceive green as the color of health.
In this study was conducted an experiment in which participants were exposed to red or green
label, which contained information about calories. On both labels on a candy bar were
displayed the same amount of calories. Participants were asked about the healthfulness
perception, caloric judgment and healthfulness judgment. It turned out that candy bar was
considered as healthier if a label with calories was green. Therefore while the packaging is
decorated in green, consumer subconsciously perceive the product as a healthier than other
products with other colors, regardless of the actual number of calories that this particular food
12
product has. Also Bilman (2014) carried out a similar study, where was found that if the
biscuit is wrapped in bright packaging, is immediately perceived as a type of lighter snacks
and also have a fresher taste.
The effect of pictorials on perceptions and food consumption Other implicit elements that can change our perception of the product are pictorial cues and
pictorials on product packaging. The account should be taken not only the image content, but
also the type of picture if it is a photo or graphically designed/painted image as was shown in
study by Deliza, MacFie, Hedderley (2003) where were participants exposed to a different
kinds of pictures. At the end was shown different evaluation about sensory expectation.
Pictures on the packaging of the products can significantly improve the overall perception and
evaluation of consumer (Underwood, Klein 2002). Cardello (2007) states the visual and
photographic reproduction on the packaging of products is very important in terms of sensory
expectations as figures provide clear information on the expected product shape, color, size,
and texture. Also pictorials are categorized as implicit design cues, which is an integral part of
communication through packaging. Albarracin et al. (2009) showed that if the food packaging
will display the exercising cues such as slim silhouette or famous athletes it immediately
increases the consumption of the product. Albarracin conducted a study that included two ads:
The first one was was shown printed advertising with exercise cues, in the second case was
presented an action word. Participants were asked to rate the appeal and efficacy of ads. At
the same time the participants were given a bag that contained raisins and were told that they
could eat how many of them they want. At the end of the experiment it was shown that
participants who were exposed with exercise message ate significantly more raisins. Also
Wagner et al. (2014) argues that implicit indications in the form of pictures or other graphic
representations are more potent if we want customer to be guided to the preference of a
healthy product instead of unhealthy one. Specifically, in an experiment carried out by
Wagner (2014) was conducted during a conference as a part of which was also served food in
several baskets. One of the baskets also contained apples. Participants who register for the
conference saw these baskets and nearby demonstrated messages which were every once in a
time changed. The messages were of two types: explicit (sign Healthy Choice) and implicit
(picture of heart with a white check - universally known symbol for healthy products).
Participants who were registering themselves at the time when next to the baskets has been
shown implicit message of red heart more inclined to eat apple (healthy food) after the
conference. According to a recent study of Chrysochou and Grunert from 2014 are sports
figures considered as the most powerful cues which are most affecting consumers.
The effect of sensory descriptions on perceptions and food consumption
Consumers can be influenced through sensory perception, which can cause different
perceptions of the product. This part is very closely associated with consumers’ expectations.
E.g. Yeomans with colleagues (2008) demonstrated that the labels on food products may play
a crucial role if we infer and create expectations based on visual contact with the product. If
the label is in conflict with the real taste or flavor of food, consumers often describe such
products as inappropriate and do not like them. On the other hand, it is shown that consumers
prefer if a taste is marked with "the name of food" (e.g. coffee jelly or caramel candy)
(Okamoto et al., 2009). Subsequently, these consumers strongly prefer congruence between
name of the product and its true taste. Other cases again demonstrate the importance of the
use of descriptive adjectives that often evoke a feeling that food tastes better then in the case
of basic labels (e.g. Chicken Parmesan versus Homestyle Chicken Parmesan). The second
sign was appreciated much more and also the actual taste was evaluated much higher than in
case of the first name (Wansink, van Ittersum, Painter, 2005).
13
Consumers can also be affected by sensory cues, which can shape the overall decision. In the
study by Aarts et al. (2000), it was showed that people can be influenced cognitively without
being consciously aware of the cues through three different experiments. First experiment
included the situation where the participants in the experimental group were exposed to a
citrus scent. The results revealed that their thoughts were focussed more on the cleaning tasks
and cleanliness, determined by a faster choice of words related to cleanliness. In the second
experiment, the participants were asked what their plans were for the rest of the day. The
participants who were exposed to the scent had a higher rate of reporting cleaning related
activities than the rest (control group). Finally, in the last experiment, the participants were
examined while they were eating a biscuit. Those who were exposed to the citrus scent had a
higher frequency in cleaning their surroundings than the ones who were not. In sum, the study
showed that some actions taken by people are rather involuntary and could be easily
manipulated by their surrounding and sensory input.
2.1.2.2 Suggested underlying mechanisms and theories explaining effects of implicit cues
Color psychology
The colors have been considered not only as a means of aesthetics, but are used also as a
communication means communicating a specific message to recipients. It is clear that the
color can change the final consumer behavior (Paul & Okan 2011). It is very important that
the colors are dependent on the context in which they appear. As for colors on product
packaging, it has been demonstrated that the red color is associated with luxury goods or
status (e.g. a car) (Bottomley & Doyle 2006). On the other hand, the blue color in the
consumer associates the water content in the product, and products that are focused on
functionality. When the context is changed, these colors can mean something diametrically
different. E.g. in relation to food products people tend to assume flavor based on product
packaging color (e.g. red color is immediately associated with strawberry or cherry flavor,
green color with lime, apple flavor or mint - Shankar et al., 2010). At the same time, our
expectations regarding the taste of the product are often consistent with the intensity of color
on packaging of food product - e.g. M&Ms candies in brown packaging, are rated as more
chocolate (Hoegg & Alba, 2007). In general, the red color associated with blood flow in our
body and aggressive behavior, green is compared to nature and fertility and positive emotions,
blue is the color of heaven and lightness (Eliot & Mayer, 2014). Schuldt (2013) hypothesized
there is a clear relation between green colour and healthiness perception where more green
colour of package or on calorie label is perceived as more healthy or containing adequate
amount of important components (traffic light system - salt, sugar, fat, saturated fat).
2.2 Categorization - Health and indulgence as two key choice criteria in food purchasing The current situation indicates an increasing number of obese people worldwide (nearly
doubled over the last 30 years) (WHO, 2014). This fact put consumers before a crucial
decision when choosing food products. Despite the fact that the trend of obesity as a disease
of modern population is widely known, people in many cases, still prefer to choose products
indulgent than healthy.
14
It may be also caused by the fact that we are surrounded by plenty of elements that may affect
our final choice. Although health product is available in shop, our selection seeks indulgent
product (Friedl et al, 2014). Consumers have to trade-off health and indulgence in making
food decisions. The problem is, however, that in today’s society, consumers have the idea that
taste and health are inversely related. That means, the more fat, salt or sugar a food contains,
the less healthy it is perceived to be (Wansink, Huckabee, 2005). Oaks and Slotterback (2005)
showed that consumers distinguish two basic categories when it comes to healthy eating -
either the food is tasty and indulgent, or not very tasty and healthy (Lahteenmaki et al., 2010).
Such categorization is very general and can often mislead consumers.
The trade-off between health and indulgence is at the heart of self-control. In most cases, the
high degree of self-control is a kind of precursor for subsequent healthy choices (Schwarzer,
2008), which may be affected by impulsive behavior (Vohs, Baumeister, 2004). Self-control
typically involves efforts to resist temporary or short-term preferences in order to uphold
longer-term preferences (Karlsson, 2003). It is also defined as the process of overriding or
inhibiting automatic, habitual, or innate behaviors, urges, emotions or desires that would
otherwise interfere with goal directed behavior (Muraven et al., 2008). Consumers are forced
to choose between long-term satisfaction in the form of a healthy lifestyle and therefore
strong health, or an immediate and also short-term enjoyment of very tasty and indulgent food
(Stroebe, 2002; Fishbach, Shah, 2006).
Nowadays companies try to find and produce more and more products that combine these two
categories (healthy and tasty at the same time) to form fulfillment of the consumers objectives
(Palmer, 2008). This gave rise to the so-called health-full indulgences. Examples of such
products include, in principle, products generally regarded as unhealthy, but containing also
the improved part, for example claims referring to the contents of something healthy e.g. low
fat chips, vanilla muffins enriched with vitamins, low fat cookies and so on. It is therefore an
addition of healthy ingredients, or the disappearance of these which are unhealthy (Belei et
al., 2012).
2.3 Inference making processes and the role of expectations
2.3.1 Informational and inferential inference making When consumers make an inference about the different kinds of food products, they often use
two kinds of belief formation processes. The theory about belief formation processes was
presented already in 1975 (Fishbein and Ajzen). The central premise of the theory is that
information processing can be divided in two parts: an informational and an inferential part.
Informational refers to the process where consumer processes the information based on
others, such as the opinion from friends or relatives.
On the other hand, there is inferential belief formation process which is characterized by the
fact that consumers process information based on the information they already have, or based
on their own experience. Inferential belief formation has been explained by association
processes in the brain of people. People have structures of knowledge in their brain that they
use as a basis of interpreting new information and for making inferences. For example, studies
from Zinkhan and Martin (1987), which examines the influence of brand name on the overall
evaluation of the product by the consumer. This study tested two products - ice cream and
cameras. It has been shown that the typical logos or brand names are immediately considered
by consumers as more positive and have a more positive attitude towards them. It is evident
15
that the consumer uses the process of inferential belief formation in the categorization of
typical brand names. Brand names can significantly affect the overall perception and attitude
regarding the product.
Informational processes are closely connected with the explicit information cues given on the
packaging such as claims and logos. Inferential belief formation processes are more likely to
occur when food package cues are implicit, such as the colour or image. Of course for some
consumers may be some explicit cues perceived as implicit and other way round (for example
in case of logo is difficult to determine the explicitness or implicitness due to the fact that the
majority of logos contains both – text and graphical representation. It is therefore evident that
this information cannot be completely generalized and thus does not apply to all cases.
2.4 Expectations and consistency theories
Expectations may significantly affect our judgment and the final behaviour. Our expectation
is strongly associated with how our brain processes incoming information. Expectations are
very closely associated with a certain amount of experience that we have from previous
experiences. Consumers often assume what will be their future experiences and thus create
certain expectations (Spence, Piqueras-Fiszman, 2014). For food products we may have
expectations for instance about the taste, aroma, and flavour. Most of the expectations we
create based on our level of experience or familiarity with the product. The resulting
experience, however, may be different from the expected experience. In this case very often
occurs one of following consistency theories effects - assimilation, contrast, generalise
negatively or a combination of the first two mentioned thus assimilation/contrast. The
assimilation occurs particularly in cases where consumers adjust their perception of the
product on the basis of what to expect beforehand from the product with the clear purpose in
order to avoid a split between expectations and subsequent experiences. In contrast case, if it
comes to a situation where the actual discrepancy appears consumer evaluate it as a positive
effect. Negative generalization will appears when the product is negatively perceived by
consumers as they did not meet initial expectations of consumers regardless of whether the
final product is rated as better or worse than expected. The final effect is
assimilation/contrast, within which depends on the size of the deviations that occurred during
the formation of expectations. If the discrepancy is just little, assimilation occurs, when the
discrepancy is huge contrast occurs (Deliza, MacFie, 1996).
16
Figure 2: Assimilation-contrast theory
Our expectations may be strongly influenced by packaging of food product. It often affects
the quantity of consumption of the food product (Vadiveloo, Morwitz, Chandon, 2013),
hence, our perception of satiety. Expected saturation can be affected by weight, shape, colour,
drawings, size and shape of fonts and content of claims on food labels because the consumer
has tendency considered these elements as stimuli that made up the expectation of satiety
(Becker et al., 2011). Expectations are particularly important for this work because it is good
for high-quality prediction of calories amount of our portions size (Brunstrom, Collingwood,
Rogers, 2010).
As has been written above, familiarity of the product can highly effect our expectations. As
Sakai (2011) indicated it is a known product for and at the same time is somehow different
from our expectations, this often leads to negative effects on hedonic evaluation, but also can
catch consumer attention. However, if the deviation from the normal (and expected) becomes
too large, it may caused the feelings of disgust (Pliner, Hobden, 1992). The more we know the
product, the more confident our expectations are (Ludden, Schifferstein, Hekkert, 2009).
17
2.5 Congruency among packaging cues
What is congruency and what has been found regarding this concept? Consumers do not perceive the product on the basis of one attribute, but sees it as a whole, i.e.
as a set of elements, which together form and affects its resulting perception, formation of
inferences and overall attitude (van Rompay & Pruyn, 2011). Congruency term implies a
certain level of conformity between different factors or features of the particular stimuli
(Krishna, Elder and Caldara, 2012). In our case, congruency can occur in three main
dimensions - claim, symbol and package. In case of match between these two or all three
attributes, it is possible that the overall evaluation of the product will be faster and more
positive (Spangenberg et al., 2006). Further more, Schwarz (2004) proved that the products
which have the same cues are also assessed as more credible. In the case where the attributes
are inconsisten, and the overall process of reasoning regarding the product is prolonged and
therefore there is more time to deeply elaborate on the overall decision making
(Oppenheimer, 2008). Arvola and Lahteenmaki (2003) also stated that if the nature of
packaging (design) is in accordance (congruency) with the actual contents (food), it will be far
easier for target consumers to achieve a healthy lifestyle and good eating habits. It is therefore
abundantly clear that it is very important to communicate accurate and legible information on
food labels in order to avoid increasing number of obese.
Based on the above information, the following hypotheses were made regarding health and
indulgence:
H1: Congruency between implicit health cues and implicit health cues will increase
perceptions of healthiness.
H2: Congruency between explicit health cues and explicit health cues will increase
perceptions of healthiness.
H3: Congruency between implicit health cues and explicit health cues will increase
perceptions of healthiness.
H4: Congruency between implicit indulgent cues and implicit indulgent cues will increase
perceptions of indulgence.
H5: Congruency between explicit indulgent cues and explicit indulgent cues will increase
perceptions of indulgence.
H6: Congruency between implicit indulgent cues and explicit indulgent cues will increase
perceptions of indulgence.
2.6 The role of fluency in information processing
Fluency in information processing Another expression that is necessary to define is fluency. We distinguish between processing
and conceptual fluency. First, we look at the processing fluency that describe how difficult or
easy is to perceive the particular cue. Following that, we can say that in 1993 Whittlesea
confirmed that, if the product is somehow known or familiar for consumer, the process of
judgment and evaluation of the product is much faster and easier than the same process but
with the product with which the consumer encountered for the first time. In relation to this, in
his study, it is stated that if a given stimuli simple and consumer is repeatedly exposed to its
action, it may caused faster and better storage in memory and thus this cues become a familiar
to this particular consumer. This can help guide consumers to choose a healthy food. So
fluency of the process can influence consumers reasoning about certain information (Schwarz,
18
2004). On the other hand there is the so-called conceptual fluency, which is rather focused on
ease of perception and understanding of the meaning of particular stimulus.
2.7 Individual differences in information processing of packaging cues
2.7.1 Verbal or visual processing strategies The process of how consumers process the messages and cues on packaging may vary. As
indicated in Bagozzi´s (2008) study, consumers can mostly be attributed to one of two groups
of processing strategies – either visual or verbal. Regarding food packaging and their
initiative is therefore clear that consumers with predominant verbal strategies of processing
will probably be more inclined to perceive claims and logos on the packaging, while
consumers at prevailing visual processing strategies will perceive more graphical site of the
food cover.
2.7.2 Personal traits Furthermore, there are some personal factors that may influence the processing. For instance
one of the distracting effects can be cognitive state of consumer. Already in 1999 (Shiv,
Fedorikhin) it has been shown that people who are not fully focused on the purchase or are
otherwise cognitively engaged are more likely to aim their choice impulsively and therefore
very often towards unhealthy food (in this study towards the chocolate cake instead of healthy
fruit salad). Koenigstorfer et al. (2013) suggested in his study that the final effect of
information processing may differ for athletes or for people whom are called restrained eaters.
Also Albarracin (2009) suggested including the BMI in the next studies as a possible
differentiating sign. Also possible individual differences in the form of self-concept between
dieters and non-dieters may moderate different final effect of control behaviour on food intake
(Rotenberg et al., 2005).
Self-control management is another personal trait in which can influence final information
processing of packaging cues. It is clear that each person tries to make good decisions about
their eating habits. However, it is also clear that every day is consumer expose to diverse cues
that may affect this decision quite significantly. Very often than their ongoing behavior does
not match with their previously stated personal goals (see section 2.3.) they want to achieve.
Kleef et all (2011) argues that people know very well that the actual physical activity is very
necessary in the case of weight loss. In this case therefore offers two options - either the
consumer will be far more cling at the control food consumption or will have to spend more
time by physical activity. In this case, however, personal traits, that can be very individual,
play a major role. It also supports Koeningstorfer et al. (2013) in his work, in which suggests
that the strategy consumer chooses also depends at the its current state (athlete vs. restrained
eater).
2.7.3 Gender It has been shown that women and men can go through the process of perception of package
cues differently. In a study from Killgore and Yurgelun-Todd (2001) can be seen visible
diversity between brain activity of women and men. It may in fact depend on many other
factors such as on mood. On the other hand, both genders showed longer processing time
information in the event that for them visual stimulus was unfamiliar (Wyer, Hung, Jiang,
2008).
19
3. METHODOLOGY
The following chapter is devoted to explanation of the pilot and main study. In a pilot study,
we asked the participants to create their own product design of biscuits in relation to four
dependent variables (health, naturalness, indulgence, satiety – we used also control varibales
in all our follow analysis to see possible similarities in evaluation of product), so we were able
to reduce the possible number of attribute (colour, picture, logo, claim) levels for the main
study. In the main study, we have already worked out an online questionnaire where main
components of design package of cookies were pre-defined, which were evaluated in terms of
four dependent variables plus two additional variables in the form of attractiveness of
products and a willingness to purchase. Additional informtion as a style of processing were
asked. The main study of this thesis will serve as a pilot study of the project Clymbol, which
will have very similar form and design utilizes cookies from a major study of this thesis. The
difference is most likely seen in particularly large number of participants with specific
features, which will be obtained through the services of marketing research agency.
3.1 Pilot study The pilot study was designed and constructed in order to find the correct and justified levels
of each attribute of cookies packaging designs, which were later used in the main study. These
attributes and the resulting designs should show us how people perceive the product
packaging as a whole and how individual attributes and their levels can affect overall
evaluation and perception of the product as well as the effect of synergy
(congruence)/disparity (incongruence) of attributes to evaluate the product by the consumer.
3.1.1 Subjects The study involved 52 participants (27 males, 25 females, mean age 22,9 years) who were
asked to create their own packaging design of cookies. A pilot study was carried out on the
Wageningen University, in one of the computer classrooms. That is why almost all of the
participants were students.
3.1.2 Stimuli and procedure Participants were asked to create a design of a cookie package, which they perceived as the
most healthy, indulgent, natural and satiating (see Annex 2). Each participant has created 4
different designs of biscuits package. Tasks were distributed to participants gradually to avoid
possible interference with one design over another. Therefore, participants in this research
formed various designs independently. Participants received the hard copy of the tasks (one
by one) where they were asked to use a Photoshop program, in which the packaging design
supposed to be created by them, and the manual with instructions which facilitate the
understanding of how the program works. On the screen was visible just the frame and shape
of the package of biscuits, all other attributes had to be added by respondents. Program
offered predefined 4 attributes and each attribute contained 6 levels (see. Table 1). Each
participant was asked to designing their own packaging designs according to the given task.
For each attribute could be used one attribute level or participant could decide not to use the
attribute at all.
Table 1: Product attributes and levels included in pilot study
For each combination of attributes (for each package) was further investigated attractiveness
of the product as a whole, as well as the potential willingness to buy this product due to the
visual side of the package again on the same seven-point scale (1 = not at all attractive/willing
to purchase and 7 = extremely attractive/willing to purchase).
Each respondent had to evaluate 11 or 12 packages and was asked above mentioned questions
including the evaluation task about each of these packages. Overall, there were 7 blocks
containing 11/12 packaging. Each block contains seven packages, which were selected based
on 7x7x7 design which substantially comply with the condition so that each of the 36 possible
combinations of attributes was used at least once within 7 possible blocks, and 5 packages,
which were common for each of the seven blocks and thus all 96 respondents had to evaluate
these 5 packages from common set. These packages were deliberately chosen in order to
include in each questionnaire 1) a highly congruent health package, 2) a highly congruent
indulgent package, 3) two packages that were in line with health task either only in 2 explicit
cues (claim, logo) or 2 implicit cues (color, picture ) and the other two cues were absolutely
incongruent and 4) fifth package was selected as completely congruent in implicit part of cues
and explicit cues of that package were missing (see Table 6).
Table 6: 5 packages for common set
Explicit cues (claim and logo)
Explicit cues are healthy
(Fibres claim and Choices logo)
Explicit cues are not healthy
(taste claim and organic logo (or
no logo)
No explicit cues
(no claim and no logo)
Implicit
cues
(color
and
picture)
Implicit
cues are
healthy
(green
colour,
couple
fitness
picture)
Most congruent on health
Very incongruent on health
Implicit
cues are
not
healthy
(red
colour,
woman
eating
picture)
Very incongruent on health
Most congruent on taste
3.2.4 Additional measures In addition to the key dependent variables, a number of potential moderating and process
variables were included in the questionnaire to reveal possible personal specifics, which could
affect the overall results of research.
Consumers can differ in the style and preference of information processing (visual versus
verbal processing). Also interesting can be to observe the chronic salience of health goals in
consumers’ life and explicit belief in the unhealthy=tasty intuition. Both these variables can
strongly influence the results of this study. We have also investigated the possible preference
of respondents in the healthiness and naturalness of individual products within their
consumption.
Furthermore, socio-demographic characteristics such as age, gender and education will be
obtained. At the same time we do our research also included a question on BMI (weight and
height) of individual respondents. This indicator can significantly influence consumer
behaviour of participants.
3.2.4 Measures
3.2.5.1 Dependent measures The main dependent measurements could be considered especially as a perception of
healthiness / indulgence / naturalness and satiety. The perception of each participant in the
study is expressed through the seven-point Semantic Differential scale with boundary points
"not at all" and "extremely". Participants were each asked a question like, "How healthy is
this package for you?" (Similarly for indulgence, naturalness and satiety).
Similarly, for each package of cookies was measured attractiveness (Please indicate on a scale
from 1 ("not at all") to 7 ("extremely") how attractive for you this package of cookies is?), and
the willingness to buy a given product (How much would you be willing to buy this package
of cookies? Please indicate on a 7 point scale).
3.2.5.2 Moderating variables
Style of processing can according to the theories influence the overall results and thus was
measured. Style of processing shows the individual’s disposition to process certain
information visually or verbally. It was measured through 12 items test suggested by the
original SOP (Style of Processing) scale developed by Childers, Houston and others (1985).
In this study participant had the opportunity to evaluate individual statements on a scale
ranging between “always true/usually true/usually false/always false”.
The chronic salience of health goals in consumers’ life was measured by the General Healthy
Eating Interest scale of Roininen and colleagues (1999) (e.g. ‘The healthiness of food has
little impact on my food choices’, ‘It is important for me that my diet is low in fat’). This part
of the research was measured on a five-point Likert scale, where the extreme border points
were “strongly disagree” and “strongly agree”.
The explicit belief in the unhealthy=tasty intuition was also measured by eliciting
participants’ agreement to the following items (1=strongly disagree; 7=strongly agree): (1)
‘Things that are good for me rarely taste good’and (2) ‘There is no way to make food
healthier without sacrificing taste’ (Raghunathan et al., 2006).
33
Health motivation and preference for nature choice is additional information that we
collected in the questionnaire. For this purpose very well serve already published
questionnaire called Food Choice Questionnaire (Steptoe, Pollard, Wardle, 1995), in
particular different parts of this complex questionnaire. More specifically, we focused on the
questions under the heading "Health", "Sensory appeal" and "Natural content". In the
questionnaire appeared the questions such as. "It is Important to me that the food I eat on a
typical day (a) Keeps me healthy (health), (b) Looks nice (sensory) or (c)Contains natural
ingredients (natural). Each statement was evaluated by participants on a 4 point scale - not at
all important, a little important, moderately important and very important.
3.2.5.3 Independent variables The main independent variables in this study are examined attributes. It is therefore a colours,
claims, logos and pictures (see Table 4). All these attributes are displayed in a various
combinations as a part of coffee cookies package.
3.2.5 Data analysis In order to be able to evaluate our hypotheses ANOVA was performed. With this method we
were able to detect how the attributes and their levels are significant within each of task and
thus if these attributes, their levels and interractions could influence the decision making of
consumer towards healthy food. Optionally significant interactions were identified between
each two attributes. In case interaction was significant between two attributes, we performed
Simple Effect Analysis. This analysis was performed mainly because we could see what kind
of interactions between a pair of attributes takes place, therefore, it was all about, to see the
effect of one independent variables on specific levels of another independent variables. With
this step, we can determine the effects of different levels of the attribute to other attributes.
For significant interactions we have also conducted a post-hoc analysis in the form of
Turkey’s HSD test, thanks to which we could compare all of means and that helped us to find
the means, which are significantly different from each other.
We deliberately did not include Moderating Variables into the data analysis. With these
variables, we will work later in the main study of this project, which will be attended by over
500 participants. Thanks to this large sample will be possible to deduce conclusions about the
possible impact of these variables, such as styles of processing on consumer decision making.
34
4. RESULTS In order to achieve the goal of this thesis and to get closer to answering our main research
question, therefore how implicit cues interact with more explicit health claims at food
package or in other words, how nutrition information in the form of a logo or claim is
processed by consumers in constant interaction with other package cues, we determined and
tested our hypotheses.
The following section is divided into six parts, in which is describe the progress and results of
ANOVA test for each of the four variables. From the results of this analysis, which are
compared with the hypotheses (and consequently with the results of scoring system regarding
the congruence) can be inferred conclusions on this research. Additionally also willingness to
purchase a certain package of cookies and its attractiveness is presented. All described data
are standardized on the basis of the results of common set, which was the set of 5 packages
for all participants, so to exclude extreme or untrustworthy values and to prevent the
manipulation with results.
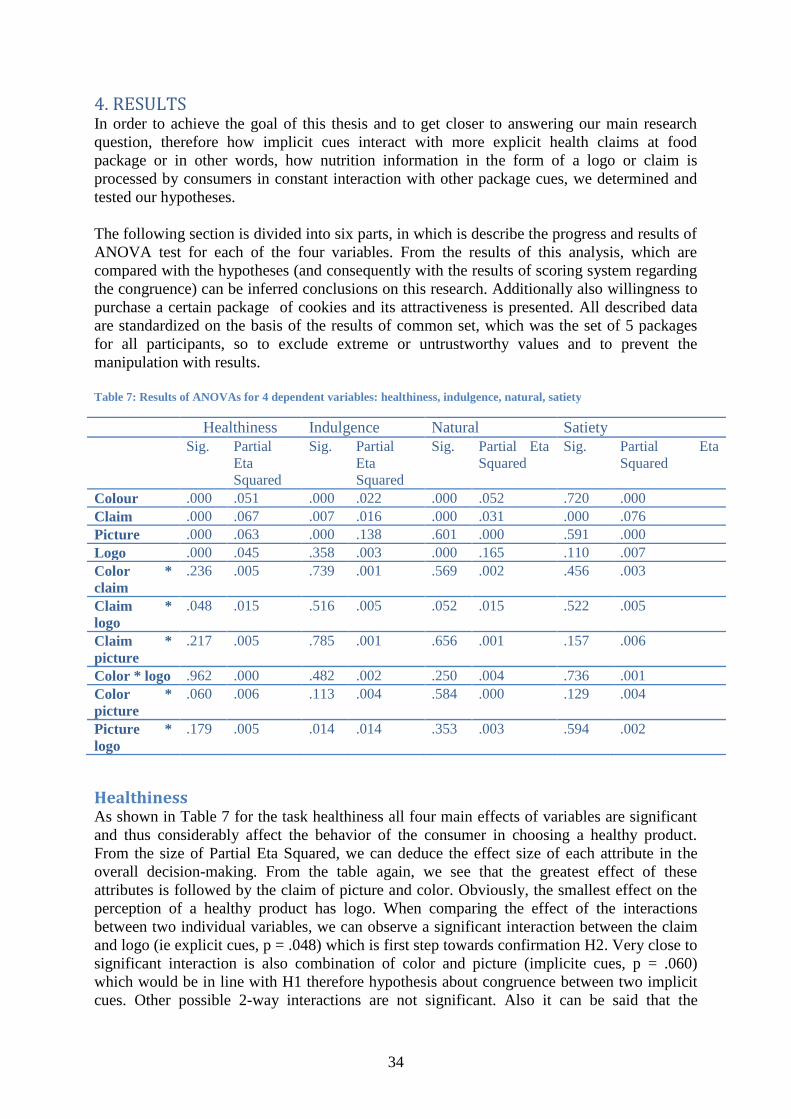
Table 7: Results of ANOVAs for 4 dependent variables: healthiness, indulgence, natural, satiety
Healthiness Indulgence Natural Satiety
Sig. Partial
Eta
Squared
Sig. Partial
Eta
Squared
Sig. Partial Eta
Squared
Sig. Partial Eta
Squared
Colour .000 .051 .000 .022 .000 .052 .720 .000
Claim .000 .067 .007 .016 .000 .031 .000 .076
Picture .000 .063 .000 .138 .601 .000 .591 .000
Logo .000 .045 .358 .003 .000 .165 .110 .007
Color *
claim
.236 .005 .739 .001 .569 .002 .456 .003
Claim *
logo
.048 .015 .516 .005 .052 .015 .522 .005
Claim *
picture
.217 .005 .785 .001 .656 .001 .157 .006
Color * logo .962 .000 .482 .002 .250 .004 .736 .001
Color *
picture
.060 .006 .113 .004 .584 .000 .129 .004
Picture *
logo
.179 .005 .014 .014 .353 .003 .594 .002
Healthiness As shown in Table 7 for the task healthiness all four main effects of variables are significant
and thus considerably affect the behavior of the consumer in choosing a healthy product.
From the size of Partial Eta Squared, we can deduce the effect size of each attribute in the
overall decision-making. From the table again, we see that the greatest effect of these
attributes is followed by the claim of picture and color. Obviously, the smallest effect on the
perception of a healthy product has logo. When comparing the effect of the interactions
between two individual variables, we can observe a significant interaction between the claim
and logo (ie explicit cues, p = .048) which is first step towards confirmation H2. Very close to
significant interaction is also combination of color and picture (implicite cues, p = .060)
which would be in line with H1 therefore hypothesis about congruence between two implicit
cues. Other possible 2-way interactions are not significant. Also it can be said that the
35
variability in our conditions is about the same (they are not significantly different - p-value in
Levenes test >.050).
Table 8: Simple effect analysis of claim at different levels of logo.
Logo F Sig.
choice Contrast 4.749 .009
organic Contrast 2.951 .053
No Contrast 24.340 .000
To break down and learn more about these interactions between two variables we also
performed a Simple effect analysis for two significant interactions. In table 9 we can look at
significance values for simple effects of this interaction. Very interesting is that almost all
levels of logo have an significant effect at individual levels of claim. Only non-significant is
difference between individual levels of claim at second level of logo (organic), p=.053. In the
case of other two levels (choice and no logo) we can see a very significant difference among
individual levels of claim at „choice“(p=.009, f=4.479) and „no“ (p=.000, f=24.34) level of
logo. From the plot (Figure 18) it is obvious that the mean for „no“logo is lower than other
two individual levels of this independent variable. Also we can see that respondents were
evaluating package as healthy in term of „fibre“ claim no matter what kind of logo was
present, which corresponds with strength of effect of logo on the whole package (ƞ2 part.=
.045) . In the interaction between “taste” claim and “no” logo the perception of health dropped
rapidly and very similar situation occurred in case of interaction between “no” claim and “no”
logo displayed on the package of cookies. Turkey’s HSD (Table 9) confirmed that only non-
significant level of difference between claims means is between “taste” and “no” claim and in
case of logo the non-significant results are seen only in case of difference between “choice”
and “organic” logo. Both these phenomenon are already clear from the Figure 18.
Table 9: Post-hoc Tukeys HSD for simple effects
(I) Claim (J) Claim Mean
Differenc
e (I-J)
Sig. (I) Logo (J) Logo Mean
Diference
(I – J)
Sig.
Fibre
Taste
taste ,7584* ,000 Choice
Organic
Organic ,1422 ,449
no ,9014* ,000 No ,7151
* ,000
no ,1429 ,380 No ,5728* ,000
36
Figure 19: Estimated marginal means of healthiness task for Logo and Claim
Table 10: Simple effect analysis of Picture at different level of colour
Color F Sig.
Green
\
Contrast 9.919 ,002
Red Contrast 40.303 ,000
Also interactions between implicit cues are almost significant (p=.060). From table 10 we can
clearly see that picture has an significant effect on both individual levels of colour. It basically
means that there is a significant difference between “girl” and “couple” picture at both levels
of colour in health perception task. This phenomenon is also easily visible form graph. The
difference in perception of health is very large when we compare for example package with
“red” and “girl” attribute levels and “red” and “couple” attribute levels.
Figure 20: Estimated marginal means of health for Picture and Colour
37
Indulgence
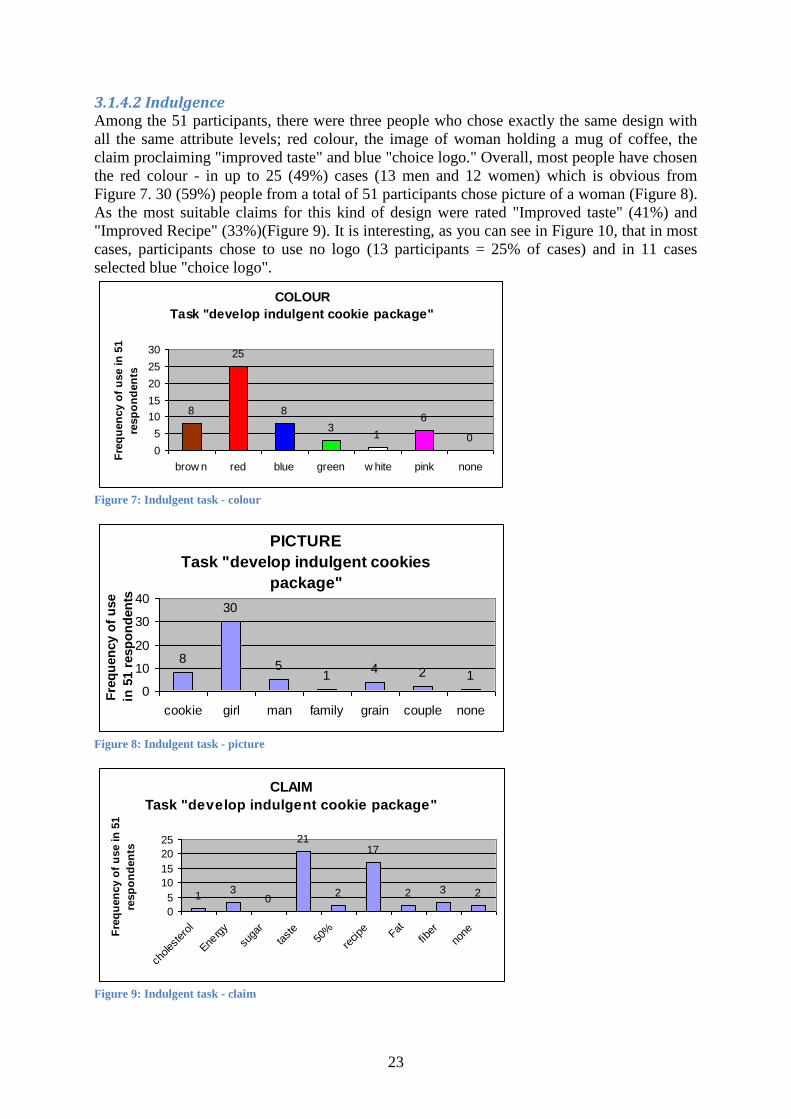
When look at the ANOVA results for Indulgence variable we again see a similar effect as in
the previous case. The colour and picture appear to be significant (p = .000) attributes in the
process of consumers´ perception of packaging. Compared to the previous case, we can say
that claim has less influence (p = .007, ƞ2 part.= .016 ) but is still significant for overall
evaluation. Absolutely insignificant in the case of evaluation of Indulgence happened to be
Logo (p = .358), which in this case is obviously the least effect on the overall perception of
the respondents (ƞ2 part =. 001). Conversely, the biggest effect in this case has Picture (ƞ
2
part. =. 138). When looking at individual attributes significance of cooperation we can see
that there is only one significant two-way interaction and congruency between Picture and
Logo (thus Implicit and Explicit cues which is related to hypothesis H6, p = .014).
Table 11: Simple effect analysis of logo at different levels of picture
Picture F Sig.
couple Contrast 1.565 .210
Girl Contrast 4.476 .012
To determine the effect of the interaction between the logo and picture in the case of
Indulgence task, we made Simple effect analysis. It showed that there is no significant
difference in perception of indulgence among logo levels when “couple” picture appears
which is also very easily visible at the graph 3 (p = .210, f= 1.565). On the other hand “girl”
picture can very significantly change reception of different individual levels of logo (p = .012
f=4.476) in case of indulgence task. It is also displayed in graph 3 that combination of “no”
logo and “girl” picture is mostly considered by respondents as indulgent combination of
attributes appearing on package.
Figure 21: Estimated marginal means of indulgence for Logo and Picture
38
(I) Logo (J) Logo Mean Difference (I-J) Sig.
Choice
Organic
organic ,0572 ,882
no -,2891* ,023
no -,3463* ,005
Figure 22: Post-hoc Tukeys HSD for simple effect
In case of logo, we can see that there is a significant difference between group means when it
comes to comparison between „no“ logo and „choice“ logo as well as between „no“ logo and
„organic“ logo. From the graph is obvious that more significant difference between means is
in case of „no“ logo and „choice“ logo. Respondents were evaluating package as more
indulgent when picture with girl (in combination with “no” logo) occurred which corresponds
with the results of power of effect of picture which was highest among other attributes (ƞ2 part
= .138). Overall effect of indulgence perception is lower when “couple” picture is displayed
on package no matter what individual level of logo is present.
Naturalness From the ANOVA testing of another variable in the form of naturalness is evident again
considerable influence of all attributes (sig. greater than .050) except of Image, on which has
a total evaluation and perception of the product in terms of naturalness almost no effect (p =
.601, ƞ2 part. = .000). Overall, the biggest effect on the overall perception of the product has
logo (ƞ2 part. = .165), followed by colour (ƞ2 part = .052). Regarding the two-way
interactions between individual attributes ANOVA test shows that there is not any single
significant interactions, although interactions between the claim and logo (explicit cues)
seems to be very strong (p = .052), Based on this I decided to carry out a Simple Effect
Analysis, to see what impact the interaction of these two attributes, and their levels has on
overall perception of the product packaging due to the naturalness.
Table 12: Simple Effect Analysis of claim at different levels of logo
Logo F Sig.
Choice Contrast 4.581 ,011
Organic Contrast .512 ,599
No Contrast 11.684 ,000
Results Simple Effect analysis confirmed that there is a significant effect of one independent
variable on the individual levels second independent variable. Specifically, in this case, we
tested the influence of claims and logos on individual levels. The results show that there is no
significant difference between the individual levels of claim when the packaging shows
"organic" logo. This is also evident from the graph consisting of the estimated marginal
Means of naturalness results where the "organic" logo curve is placed above the others and is
almost horizontal. Conversely, we can observe a truly significant impact on the perception of
individual levels of claim when these will appear on the packaging together with the "choice"
or "no" logo. The graph shows that the greatest difference in the perception of naturalness
between "no" logo and "choice" logo appears in the case where the product packaging
displays "taste" claim.
39
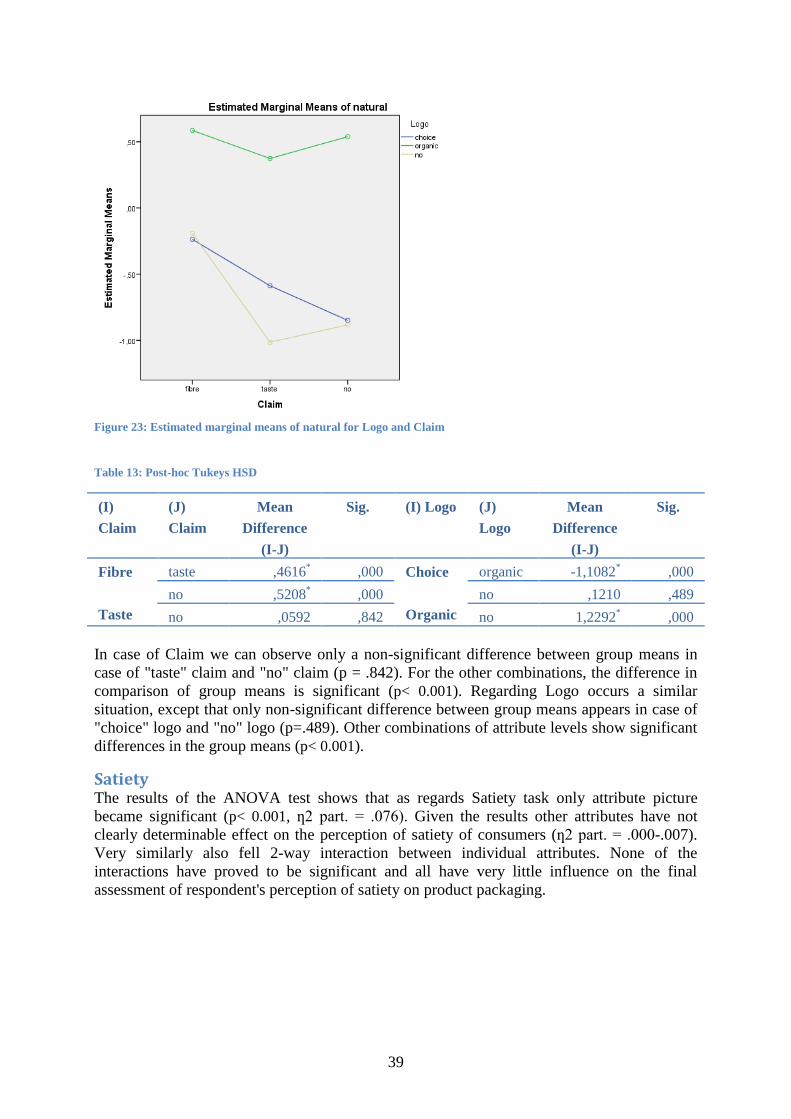
Figure 23: Estimated marginal means of natural for Logo and Claim
Table 13: Post-hoc Tukeys HSD
(I)
Claim
(J)
Claim
Mean
Difference
(I-J)
Sig. (I) Logo (J)
Logo
Mean
Difference
(I-J)
Sig.
Fibre
Taste
taste ,4616* ,000 Choice
Organic
organic -1,1082* ,000
no ,5208* ,000 no ,1210 ,489
no ,0592 ,842 no 1,2292* ,000
In case of Claim we can observe only a non-significant difference between group means in
case of "taste" claim and "no" claim (p = .842). For the other combinations, the difference in
comparison of group means is significant (p< 0.001). Regarding Logo occurs a similar
situation, except that only non-significant difference between group means appears in case of
"choice" logo and "no" logo (p=.489). Other combinations of attribute levels show significant
differences in the group means (p< 0.001).
Satiety The results of the ANOVA test shows that as regards Satiety task only attribute picture
became significant (p< 0.001, ƞ2 part. = .076). Given the results other attributes have not
clearly determinable effect on the perception of satiety of consumers (ƞ2 part. = .000-.007).
Very similarly also fell 2-way interaction between individual attributes. None of the
interactions have proved to be significant and all have very little influence on the final
assessment of respondent's perception of satiety on product packaging.
40
Attractiveness of product and willingness to purchase Table 14: ANOVA for attractiveness and willingness to purchase
Attractiveness Willingness to purchase
Sig. Partial Eta Squared Sig. Partial Eta Squared
Colour ,594 ,000 ,197 ,003
Claim ,099 ,007 ,008 ,017
Picture ,000 ,027 ,014 ,011
Logo ,732 ,001 ,220 ,005
Color * claim ,120 ,007 ,140 ,007
Claim * logo ,393 ,006 ,312 ,008
Claim * picture ,983 ,000 ,951 ,000
Color * logo ,680 ,001 ,870 ,000
Color * picture ,342 ,001 ,802 ,000
Picture * logo ,218 ,005 ,525 ,002
Results of ANOVA analysis to determine the effect on the perception of attractiveness of
individual attributes of product packaging to the consumer and willingness to purchase the
product did not proof any significant effects. In the case of attractiveness Picture is the only
significant attribute that can affect the level of the packaging attractiveness perception (p<
0.001, ƞ2 part. =. 027). Other attributes are not significant as well as two-way interaction
between the individual attributes. Not a very different situation is in the case of willingness to
buy a given product. Even this test showed that only two attributes may affect the consumer´
willingness to purchase the product – it is Claim (p = .008, ƞ2 part. =. 017) and again Picture
(p = .014, ƞ2 part. =. 011). Even in testing of 2-way interactions between individual attributes
wasn’t found a combination that would outcome in significant results or otherwise had a
significant effect on the perceived attractiveness of that product or increase willingness to buy
the product.
Based on the above results could be acknowledge three out of six hypotheses which we set at
the beginning of our work. When we take a closer look at the assumptions associated with the
perception of healthiness, we can confirm two out of the three health related hypotheses - H1
and H2 which means that there is significant influence between health cues – specifically
congruence between two implicit cues health will increase the perception of healthiness and
congruence between two health explicit cues will increase the perception of healthiness. The
high degree of congruence is also confirmed by congruence scoring system for each of the
four tasks. Under this system, we can observe the level of congruence. Since the scoring
system was developed based on the results of the pilot study, we can say that in this case, we
can see a clear consensus between highest rated combinations of attribute in the scoring
system (first and second most congruent health package) in term of congruency and the
results of main study where were very significant interaction (claim + logo and color +
picture) supporting perception of healthiness confirmed. Health hypothesis combining
implicit and explicit cues had no significant results in our testing and, therefore, cannot be
confirmed.
In case of hypotheses associated with perception of indulgence is due to testing and
comparison with scoring system possible to confirmed H6 thus congruence between implicit
41
indulgent cues and explicit indulgent cues will increase perceptions of indulgence. ANOVA
test results proved that there is a significant two-way interaction between the logo (explicit)
and picture (implicit) cues specifically picture of “girl” and “no” logo. When comparing these
results of main study with the scoring system we can again see clear consensus where the
combination of these attributes levels (“girl” picture and “no” logo) ranked as highest
congruent considering Indulgent task. Based on this comparison, it is possible to say that the
congruence between indulgent implicit and indulgent explicit cues increase the perception of
indulgence. With regard to the results, H4 and H5 were not confirmed.
Table 15: Results
Hypothesis Confirmed?
H1: Congruency between implicit health cues and implicit health cues will increase
perceptions of healthiness.
Yes
H2: Congruency between explicit health cues and explicit health cues will increase
perceptions of healthiness.
Yes
H3: Congruency between implicit health cues and explicit health cues will increase
perceptions of healthiness.
No
H4: Congruency between implicit indulgent cues and implicit indulgent cues will
increase perceptions of indulgence.
No
H5: Congruency between explicit indulgent cues and explicit indulgent cues will
increase perceptions of indulgence.
No
H6: Congruency between implicit indulgent cues and explicit indulgent cues will
increase perceptions of indulgence.
Yes
Other analysed variables beyond the hypothesis were naturalness and satiety. Although these
variables do not appear within our hypotheses, but rather serve as a control variable in this
work, the results of the analysis can be found on the following lines. These variables are, like
health and indulgence, observed in the context of congruence between two implicit, two
explicit or between implicit and explicit cues.
In the perception of the product as natural, we concluded that it is possible to confirm the
argument that the congruence between the two explicit natural cues enhances the perception
of the product as natural. From the ANOVA test indicates a noticeable impact of logo and
claim, specifically the logo "organic" with "fiber" or "no" claim. When looking into our
scoring system, we again see that this combination of explicit cues (“organic” logo and
“fibre” or “no” claim) in the case of a natural product evaluations, assessed as very congruent.
These kinds of attribute level combinations are included in the scoring system of packaging as
top ones.
In case of evaluation of the products from the viewpoint of satiety it wasn’t found any
significant interactions between attributes. This may be caused mainly by a small amount of
each attribute levels. It can be also caused by fact that our original goal was to determine only
effect of the perception of healthiness and indulgence. Other colours like brown (Hoegg &
Alba, 2007), or other claims, might increase the perception of satiety.
Additionally, we did a basic analysis of the background variables such as Style of processing
(range from 1= always true to 4=always false) where we discovered that most of the research
participants slightly incline to more visually orientation . On the other hand, however, we
42
cannot say that participants are purely visually focused. The results show that verbal style of
processing also plays an important role.
Table 16: SOP - Visual - Mean and St. Deviation
There are some
great moments
in my life that I
want to revive
by looking back
at how
everything
looked P
I like to picture
how I could fix
up my
apartement or
room if i could
buy anything i
wanted P
I like to
daydream P
I find that it
often helps to
think in pictures
P
When I have
forgetten
something, I
often try to form
a mental
picture in my
mind to
remember P
Mean 1,75 1,72 1,73 2,59 1,96
Std. Deviation ,681 ,867 ,688 ,865 ,893
Table 17: SOP - Verbal - Mean and St. Deviation
I like to work
with words W
I like to read a
lot W
I like to work
with words W
I like to learn
new words W
My preference
is for activities
that do not
require much
reading W
Mean 2,19 1,97 1,78 1,96 2,76
Std. Deviation ,638 ,827 ,728 ,724 ,830
Table 18: Unhealthy-tasty intuition results
N Minimu
m
Maximu
m
Mean Std.
Deviation
Food which is good for me
rarely taste good
96 1 6 2,21 1,337
-There Is no way to make
food healthier without
sacrificing taste
96 1 6 1,97 1,100
Valid N (listwise) 96
41.7% of participants absolutely disagree with the statement that there is no way to make food
healthier without sacrificing taste and they have the same negative opinion about the point
that the food is good for me, has rarely good taste. In this regard, it is apparent education of
research participants in the issue "unhelathy=tasty intuition" (range from 1=totally disagree to
6=totally agree) and therefore they do not succumb to the established stereotypes.
43
Table 19: Correlations between dependent variables
healthiness natural indulgence satiety
healthiness Pearson Correlation
Sig. (2-tailed)
N 658
natural Pearson Correlation ,434**
Sig. (2-tailed) ,000
N 651 665
indulgence Pearson Correlation -,260** -,090
*
Sig. (2-tailed) ,000 ,024
N 637 637 644
satiety Pearson Correlation ,170** ,262
** ,054
Sig. (2-tailed) ,000 ,000 ,182
N 616 623 609 623
**. Correlation is significant at the 0.01 level (2-tailed).
*. Correlation is significant at the 0.05 level (2-tailed).
Eventually we also sought to determine whether there is a correlation between the dependent
variables, respectively between the sizes of means within each dependent variable which were
gained by evaluating of each product design (combination of attributes and their levels). From
Table 19 it is obvious that there are considerable correlation. Regarding healthiness appears
positive and significant correlation mainly with naturalness (r = .432) and a lower level of
correlation can be seen also with Satiety (r = .170). A negative correlation is evident in the
case of healthiness and Indulgence (r = -. 260), which could be assume due to almost exact
opposite designs of packages and thus oposite evaluations. Negative almost zero (ie, none)
correlation also occurs at the Naturalness and Indulgence (r = -. 090), as well as in Indulgence
and Satiety, which is still positive one nevertheless very close to zero (r = .054) and due to the
results in the table can be said that this result is not significant (p = .182). Positive correlation
is also seen in case of Naturalness and Satiety (r = .262). All these results imply that ANOVA
testing gave us a very complex look at this whole issue.
44
5. GENERAL DISCUSSION
5.1 Conclusion
This research examined the effect of two explicit and two implicit cues appearing on the front
packaging of the products on the perception of final consumer behaviour and consumer
choice. In the experimental part of this study, we manipulated various versions of picture,
colour, logo and claim. Our aim was to determine how these four attributes can modify or
create perception of healthiness, indulgence, naturalness and satiety. Basically, we
hypothesized that the combination of two attributes (two implicit, two explicit, but also
implicit and explicit at the same time), which in their essence and content support the feelings
of health and indulgence, enhance the final overall effect and thus foster the perception that
could affect the final choice. We include in our work also naturalness and satiety as a control
dependent variable which we analysed but did not include in hypothesis. However, not all
hypotheses examining all of these perception positions could be after this research confirmed.
Based on the hypothesis testing, it was confirmed that there are many interactions between the
cues within our dependent variables. Certain congruence appeared at first tested variable
Health, where it was possible to confirm based on the results of the ANOVA compared to the
results of the scoring system that congruence exists between two implicit health cues and
congruence between the two explicit health cues that enhance perception of healthiness. In
case of testing for variables related to indulgence it was confirmed that there is a certain
degree of congruence between implicit and explicit indulgent cues that increases the
perception of overall indulgence. For testing of the control dependent variable in the form of
naturalness it was proved that clearly exist interaction between two explicit natural cues,
which increased the possibility of the perception of naturalness of a product. For testing of
satiety has not been confirmed significant interaction between the dependent variables.
Given the above, it can be confirmed that the package and its individual attributes in the form
of implicit and explicit cues and their interactions can strongly affect the overall behaviour of
consumers and lead to a very specific perception of the product as well as to final product
selection. Based on the results, it is very essential that the products are clearly communicated
through the packaging. Private enterprises producing food goods, as well as relevant
government organizations controlling market can commit to this goal. On the other hand, I
think is very crucial that people are aware about this issue and they can obtain as much
information as they need to adopt this behaviour in their daily life and thus they could spread
their knowledge to the younger generation. Based on the results of this study young people
should be educated from an early age, so that they are ready to resist possible marketing
coercion and so that they know that despite the fact that for instance there are two congruent
healthy design cues present on the package, the product may not necessarily be healthy. This
could prevent the spreading trend of obesity, which often results in severe disease devastating
our society.
5.2 Discussion
Our results are essentially in conflict with Peak (2010), which argues that the implicit cues are
more powerful in comparison with explicit. Our research shows, however, that most of our
45
confirmed significant interaction occurs between explicit cues which apparently lead
consumers better to a particular perception. It could be said that in this regard, our research
results more inclined to O'Keefes´ study (1997). Our results also show noticeable effect of
logo on the overall perception of healthiness whereby we agree with Steenhus et all. (2011).
In the case of logo, however, is rather vague overall definition mainly due to the fact that logo
itself is essentially part of the implicit cues because it is very often also composed of a graphic
representation. It is therefore possible that because of our selected and for the whole
Netherlands well known (“choice”) logo which is clearly associated with a healthy lifestyle on
daily basis, was used so many times just because of phenomenon described by Chrystochou
and Grunert (2014), who argue that the graphic illustrations are easier to remember and thus
were in our experiment easier to apply.
In case of colour we absolutely agree with the study presented by Schuldt (2013), which
reminds us that the green colour evoke a sense of the health in consumers, which is our study
seen from the results of our experiment.
5.3 Limitations and positive contribution of our study
We must realize that respondents had only choice of two very distinct colours in the main
study, which could lead to behaviour where participants choose colour which they see rather
on the package instead of ideal colour for them. The same phenomenon could occur, however,
in the case of for example images. In the main study were only two entirely different pictures
- one with a fitness cues and the other one with rather consummatory context. At the same
time however, it should be noted that our study is very unique just by examining the impact of
implicit and explicit cues for each dependent variable simultaneously.
Regarding the sample of respondents who answered the questionnaire, it is apparent that the
sample is not representative. Due to the method of collecting date (via university email or
social network), most respondents are students with higher education or university education
whose are very aware about healthy lifestyle and they are trying to fight against the “pitfalls”
of marketing. At the same time, the majority of research participants are female (80
respondents) and overall sample size is not too revealing (just 96 respondents). The results of
sample which would be more representative (ie. less respondents with high education and
greater proportion of males) would probably have been less focused on health since most of
the current undergraduates has this variable strongly rooted in their lifestyle.
Another problematic aspect of this study could be inappropriateness of the product as well as
the possible inappropriateness of the above mentioned levels of selected attributes. The very
name "coffee cookies" apparently does not increase perception of a healthy lifestyle even
though in terms of the research, we have arrived to significant conclusions. It is possible that
in this respect the phenomenon of "fitness cues" in the form of a picture of exercising couple
have operated, which according to Koeningsorfer (2013) reduce guilt, and increases feelings
of fulfilment of healthy goals. On the other hand, as I have already mentioned above health
claims may invalidate the overall impression of the product, as they are often not very well
formulated or only causes a decrease in consumer expectations (Wansink, 2004).
Another aspect that could manipulate results can be overwhelming number of respondents
who were more inclined to one of two styles of processing - either as a verbal processing type
or visual type (Childers, Houston et all, 1985). Style of processing would certainly be fully
46
assessed in the case that the sample number increase, and thus would be possible to deduce
how much the style of processing affects the overall perception of the product packaging. Due
to small sample we do not focus on style of processing in this thesis and we leave the already
collected information to examine this phenomenon more in depth in a large study that will be
conducted over the next two months. The results concerning the style of processing parts can
significantly affect the interpretation of the whole study results.
Additionally, it is possible that the way we approached the research participants influenced
the results. Since it was an online questionnaire, each participant could fill out a questionnaire
anytime and anywhere. On the other hand, however, this has led to a relatively large number
of unfinished questionnaires. This may also be possible due to large amounts of products (11-
12 products for each respondent), which were needed to be assessed. At the same time the
distribution of questionnaire led to the situation where for instance elderly or workers who are
in fact very strongly influence buying behaviour throughout the home, did not receive the
questionnaire.
Positive contribution of our work is very unique elaboration of pilot study. The experiment
that we conducted within this study, was based on bottom-up the system where participants
were involved in the dsigning task from the very beginning. They had been asked to create
their own package design in Photoshop program by adding individual attribute levels, which
very well determined their preferences and perception in consumer behaviour. Another
positive is the contribution in clarification of how can package design specifically four
attributes (picture, colour, logo, claim) influence overall evaluation of product and consumers
behaviour and final decision.
5.2 Recommendations
As already stated, there are not too many studies that examined the effect of explicit and
implicit cues simultaneously within a single product. It would therefore be interesting to
create another study, where would be another product (for instance yoghurt or oatmeal
porridge thus food which can be seen as a generally healthy but in their essence they can be
very unhealthy) used as well as other attributes (attention can be focussed also on the rear side
of the product, namely on a table with nutritional values or logos appearing on the back side
of the package) would be manipulated. It would also be very useful to create an experiment
that would take place a bit closer to the real situation like in the simulation of supermarket
where people can actually check the package of cookie or other products, instead of Internet
questionnaire. In that situation also eye tracking research would be interesting because it
would be possible to see for example correlation between the results of Style of processing
questions and results of eye tracking in the real setting. Given that in this experiment
participate only a relatively small number of respondents, it would be appropriate to enhance
this to gain information from representative sample size. It would also be very interesting to
look at the issue more in terms of psychology and explore mechanisms that precede consumer
behaviour as well as variables that can disrupt these mechanisms or on the contrary, that can
support them. Interesting would be to change specific conditions of experiment like for
instance how participants who haven’t been eating for 24 hours react on exposure of food
product package with different attribute levels and their evaluation in terms of healthiness or
indulgence.
47
As confirmed by Grunert et all (2010) in his work, it is essential for consumers that important
information about the product came from credible sources - whether from our friends or from
governmental organizations or even from professional athletes or celebrities in case we want
to motivate consumers to healthy dietary habits (Bhaskaranm, Hardley, 2002). This implies,
that it is very important that the information that consumer collect through implicit and
explicit cues on the packaging of products from these trustful sources are truthful and not
misleading and confusing, as in many cases it currently is. For instance Purnhagen, Herpen
and Kleef (2015) in their work stressed the high importance of implicit cues, which they
consider as being easier to process (system 1 processing in dual processing models in social
psychology1, Kahneman, 2011) by consumer and therefore are more often used by private
companies in the form of certain nudges to legally manipulate consumers choice since EU
restricts mostly textual (explicit) part of packages (which is processed by consumer with
system 2 processing2 which requires more effort and more extensive processing therefore is
used very often in second instance). This work could therefore help in the law restrictions
about the product packaging designs in the sense that packaging and its explicit but also
implicit parts provide true, honest and meticulous information that would lead consumers to
correct and conscious choice of product.
1 Dual processing system in social psychology distinguishes two types of systems to process information - system
1 and system 2. In case of system 1 are thoughts processed quickly and almost automatically suggesting that this system is easier for the consumer since they do not have to spend that much efforts to achieve final thoughts. The system 1 is most commonly used in conjunction with implicit messages that enable continuous processing (Kahnemann, 2011). 2 System 2 is essentially opposite system to system 1 within which the consumer handles thoughts slowly and
thoroughly. This process can be influenced by subjective feelings of consumers or by the personality differences. With this system we mostly process explicit information, which due to verbal form often requires more time and elaboration (Kahnemann, 2011).
48
REFERENCES
Aarts, H., & Dijksterhuis, A. (2000): Habits as knowledge structures: automaticity in goal-directed
behavior. Journal of Personality and Social Psychology, vol. 78, p. 53–63
Albarracin, D., Wang, W., Leeper, J. (2009) : Immediate Increase in Food Intake Following Exercise
Messages. Obesity, vol. 17, p. 1451-1452.
Ares, G., & Deliza, R. (2010). Studying the influence of package shape and colour on consumer
expectations of milk desserts using word association and conjoint analysis. Food Quality and
Preference, 21(8), 930-937.
Bagozzi, R.P. (2008). Some insights on visual and verbal processing strategies. Journal of Consumer
Psychology, 18, 258-263.
Becker, L., van Rompay, T. J. L., Schifferstein, H. N. J., & Galetzka, M. (2011). Tough package,
strong taste: The influence of packaging design on taste impressions and product evaluations.
Food Quality and Preference, 22, 17–23.
Belei, N., Geyskens, K., Goukens, C., Ramanathan, S., & Lemmink, J. (2012). The Best of Both
Worlds? Effects of Attribute-Induced Goal Conflict on Consumption of Healthful
Indulgences. Journal of Marketing Research, 49(6), 900-909.
Bhaskaranm, S., Hardley, F. (2002). Buyer beliefs, attitudes and behaviour: foods with therapeutic
claims. Journal of Consumer Marketing, 19(7), 591 – 606.
Bialkova,S., van Trijp, H. (2010). What determines consumer attention to nutrition labels?. Food