PACRA TRANSITION STUDY A Decade in Transition : CY10 – CY19 Usama Liaquat Assistant Manager Criteria Friday, January 31, 2020 You can’t control what you can’t measure Adapted from words of Tom DeMarco
Transcript
PACRA TRANSITION STUDY
A Decade in Transition : CY10 – CY19
Usama LiaquatAssistant Manager CriteriaFriday, January 31, 2020
You can’t control what you can’t measureAdapted from words of Tom DeMarco
Concept & Regulatory Framework
• What is a Transition & Default Study?
• Why need a Transition & Default Study?
• What is the Regulatory Framework & Best Practices Guidelines regarding Transition & Default Study?
1
Definition & Rationale
WHAT IS A TRANSITION & DEFAULTSTUDY?
A Set of Standardized Tools & Analyses for a Credit Rating Agency’s (CRA) ratings’ performance appraisal
WHY NEED A TRANSITION & DEFAULT
STUDY?
• Self Assessment of CRA
• Peer Analysis with other CRAs
• Regulatory Requirement
Concept & Applicable Law
PACRA Transition Methodology
Transition Study Limitations
ContextTransition &
Default TrendsPeer Analysis
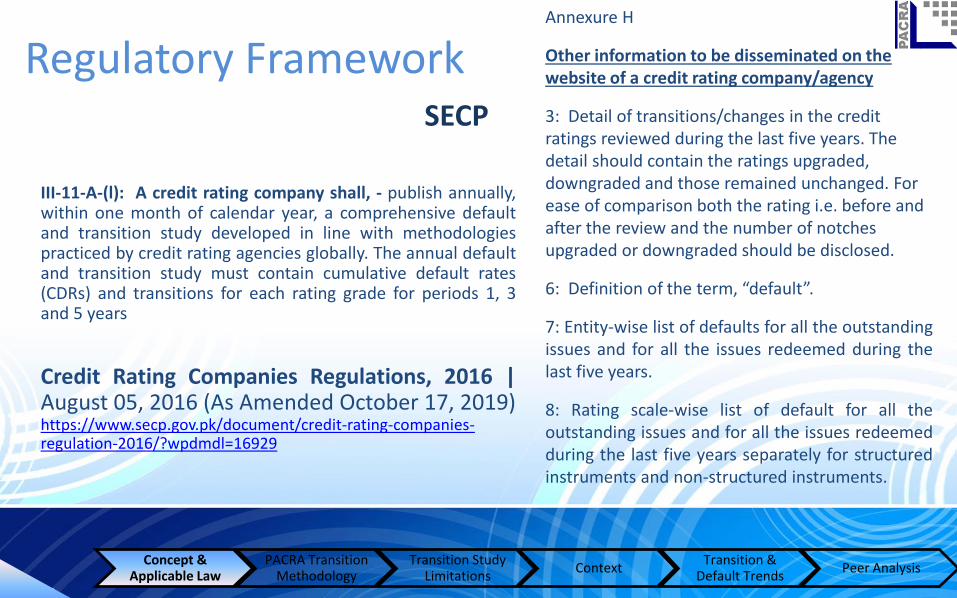
Regulatory FrameworkSECP
Annexure H
Other information to be disseminated on the website of a credit rating company/agency
3: Detail of transitions/changes in the credit ratings reviewed during the last five years. The detail should contain the ratings upgraded, downgraded and those remained unchanged. For ease of comparison both the rating i.e. before and after the review and the number of notches upgraded or downgraded should be disclosed.
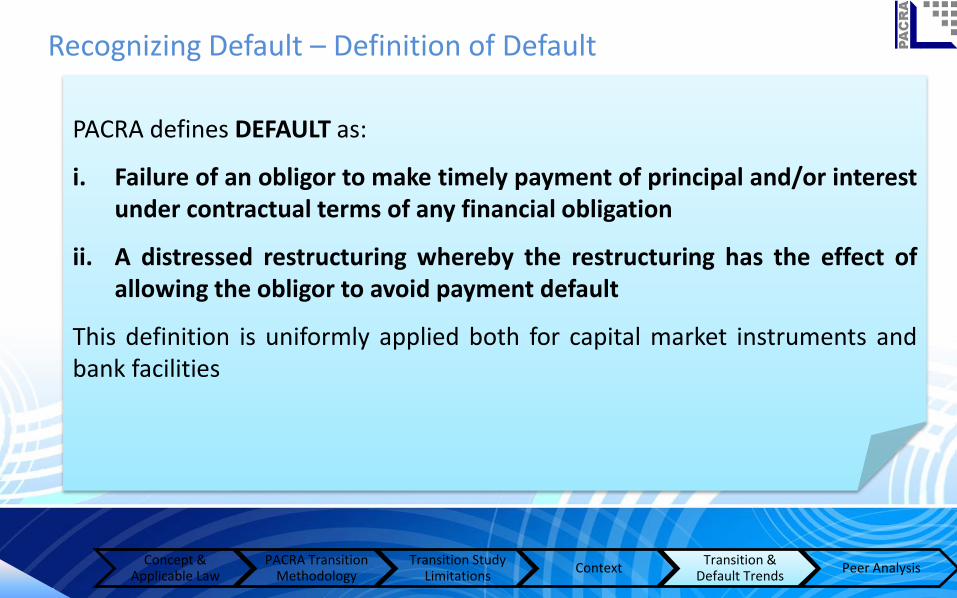
6: Definition of the term, “default”.
7: Entity-wise list of defaults for all the outstandingissues and for all the issues redeemed during thelast five years.
8: Rating scale-wise list of default for all theoutstanding issues and for all the issues redeemedduring the last five years separately for structuredinstruments and non-structured instruments.
III-11-A-(l): A credit rating company shall, - publish annually,within one month of calendar year, a comprehensive defaultand transition study developed in line with methodologiespracticed by credit rating agencies globally. The annual defaultand transition study must contain cumulative default rates(CDRs) and transitions for each rating grade for periods 1, 3and 5 years
a) Objectivity of the methodology: ECAI shouldhave methodology of assigning credit rating that isrigorous, systematic, continuous and subject tovalidation. To establish that ECAI fulfills thisprimary component of eligibility criteria, it mustdemonstrate that it meets minimum standardsgiven below:
5. ECAI should demonstrate that the ratingmethodologies are subject to quantitative backtesting. For this purpose, ECAI should calculate andpublish default studies, recovery studies andtransition matrices. For the purpose, the ECAIshould have a definition of default that isequivalent to international standard and isrelevant to domestic market.
d) Disclosure: ECAI should demonstrate that it provide access toinformation that are sufficient to enable its stakeholders to makedecision about the appropriateness of risk assessments. Thepurpose of this disclosure requirement is to promote transparencyand bring in market discipline. ECAI is therefore expected to makepublic following information:
2. Definition of default
6. Actual default rates experienced in each assessment category
7. Transition matrices
Eligibility Criteria for recognition ofExternal Credit Assessment Institutions (ECAIs), July 2005http://www.sbp.org.pk/bsd/Criteria_Rating_Agencies.pdf
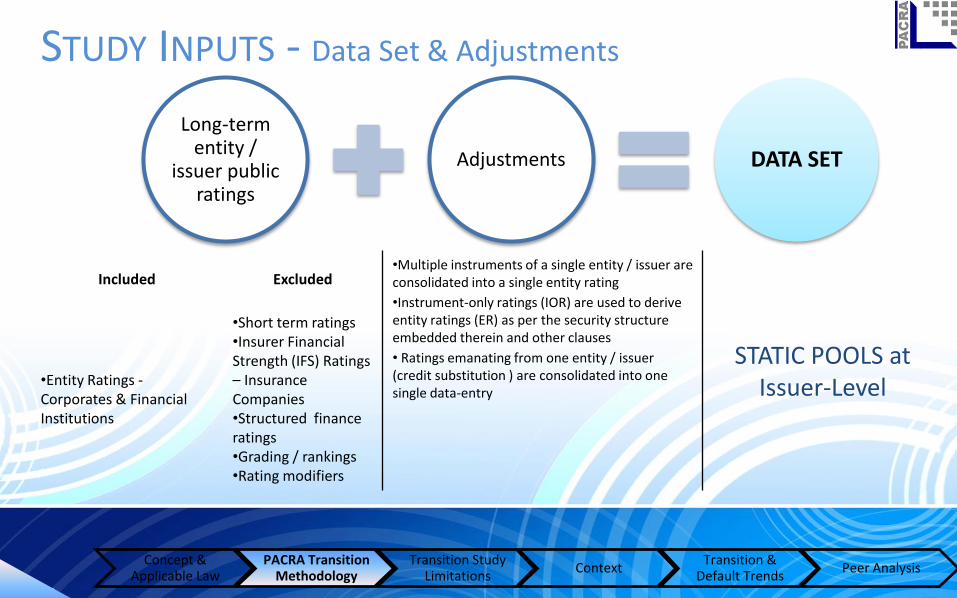
Static Pools aregroupings of data thatstay together in thegroup for the ENTIRELENGTH & BREADTHof the measurementperiod of the pool
WHAT ARE STATIC
POOLS ?
What is the Measurement
Period?
CAN We HIDE our defaults by
“withdrawing“ them anytime post-
default?
What is Withdrawal
Adjustment?
Where do Initial ratings GO?
• Annual (Single / Multiple)
• PACRA Static Pools are adjusted for all withdrawals during a measurement period
• NO, a rating put in default & subsequently withdrawn is reported as “D” ONLY.
• An initial rating of CY17 will form part of the next year (CY18) pool, if not withdrawn
Concept & Applicable Law
PACRA Transition Methodology
Transition Study Limitations
ContextTransition &
Default TrendsPeer Analysis
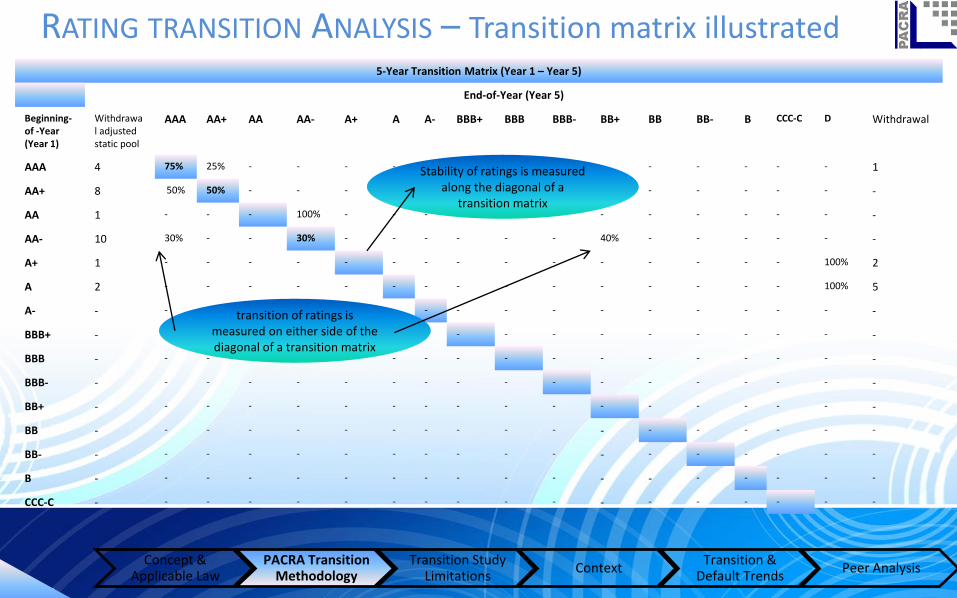
RATING TRANSITION ANALYSIS – Transition Rates
Concept & Applicable Law
PACRA Transition Methodology
Transition Study Limitations
ContextTransition &
Default TrendsPeer Analysis
Transition rates are defined as statistics quantifying the transition ofratings on the rating scale.
There are three kinds of Transition Rates:• Upgrade Rate: Proportion of entities / issuers upgraded during the period to total
number of entities / issuers.
• Downgrade Rate: Number of entities / issuers downgraded during the period tototal number of entities / issuers.
• Default Rate: Proportion of entities / issuers that have been assigned a Default“D” rating (As per PACRA Default Policy “How PACRA Recognizes Default”) to the total numberof entities / issuers
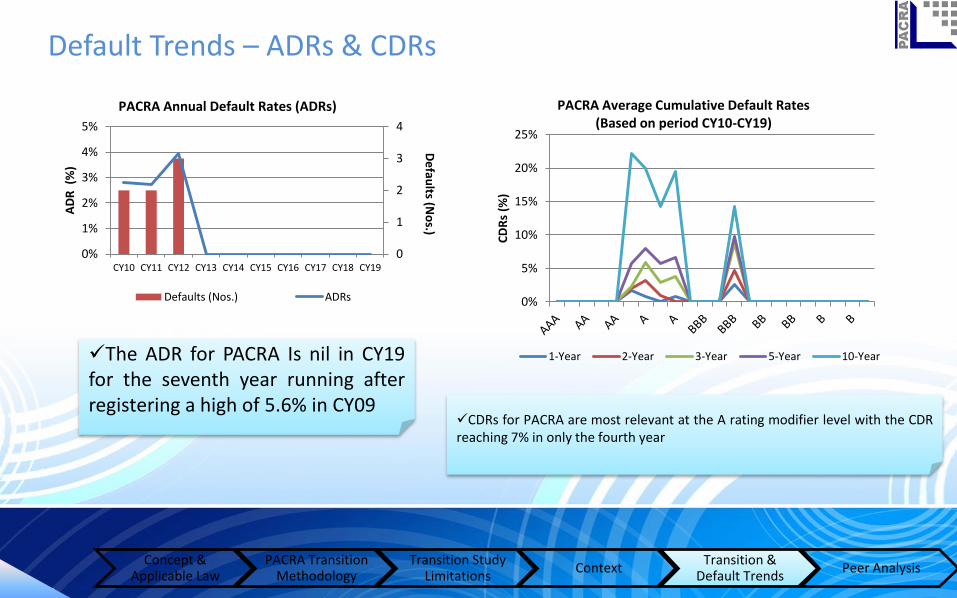
An ADR captures the Default Rate on a one-yearMeasurement Period. It is computed as thenumber of entities / issuers defaulting in a year asa proportion of the number of entities / issuers inthe Static Pool at the beginning of the year,adjusted for withdrawals.
CDRs are calculated by compounding constituent MDRs. For instance,a three-year CDR (CDR-3) has a Measurement Period of three yearsand would take into account only those Static Pools that have beenseasoned for three-years. The average Cumulative Default Raterepresents historical cumulative Default probabilities. It is calculated bytaking the averages over many pool periods.
Pros and Cons
ADRs CDRs
•Conventionally reported default rate
•Easy to understand
•Cannot be compared across time and CRAs
•Captures the effect of numerous business cycles
•Better comparability across time and CRAs
Concept & Applicable Law
PACRA Transition Methodology
Transition Study Limitations
ContextTransition &
Default TrendsPeer Analysis
PACRA’S DEFAULT RATES ARE USEFUL BOTH AS STATEMENTS OF HISTORICAL FACT AS WELL AS
UNBIASED ESTIMATES OF EXPECTED DEFAULT PROBABILITIES
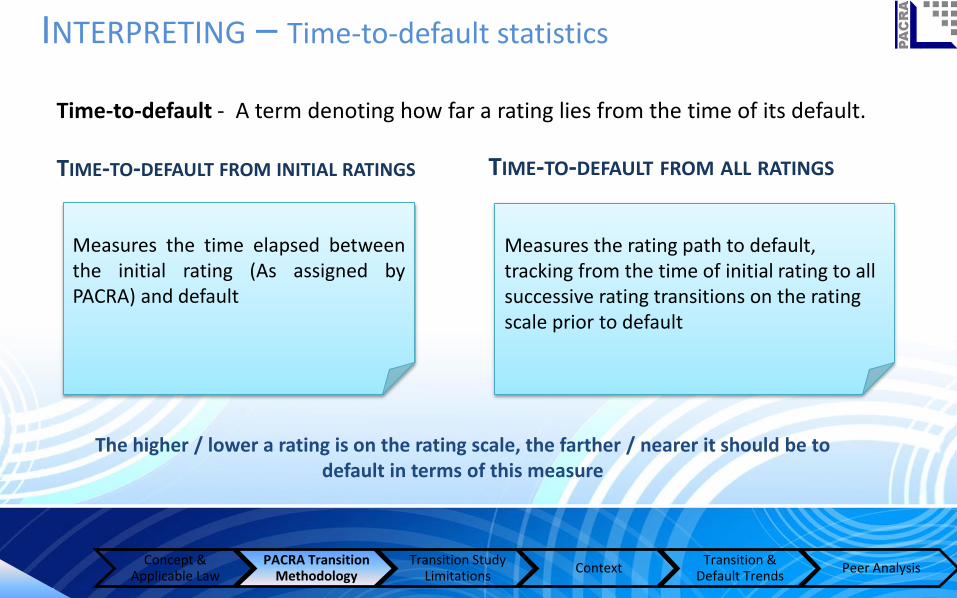
TIME-TO-DEFAULT FROM INITIAL RATINGS TIME-TO-DEFAULT FROM ALL RATINGS
INTERPRETING – Time-to-default statistics
Measures the time elapsed betweenthe initial rating (As assigned byPACRA) and default
Measures the rating path to default, tracking from the time of initial rating to all successive rating transitions on the rating scale prior to default
Time-to-default - A term denoting how far a rating lies from the time of its default.
Concept & Applicable Law
PACRA Transition Methodology
Transition Study Limitations
ContextTransition &
Default TrendsPeer Analysis
The higher / lower a rating is on the rating scale, the farther / nearer it should be to default in terms of this measure
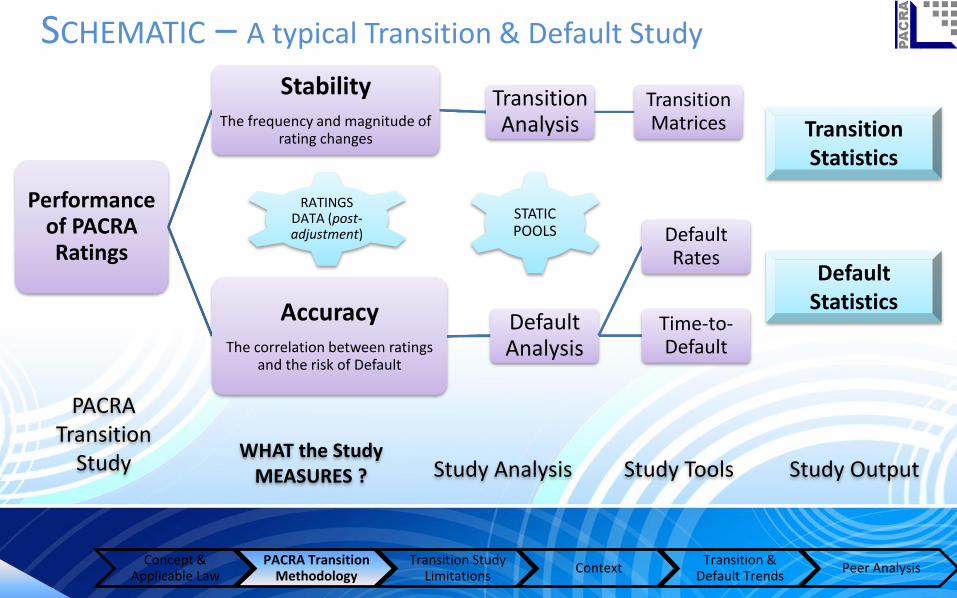
SCHEMATIC – A typical Transition & Default Study
Performance of PACRA Ratings
StabilityThe frequency and magnitude of
rating changes
Transition Analysis
Transition Matrices
AccuracyThe correlation between ratings
and the risk of Default
Default Analysis
Default Rates
Time-to-Default
STATIC POOLS
RATINGS DATA (post-adjustment)
PACRA Transition
StudyWHAT the Study
MEASURES ? Study Analysis Study Tools Study Output
Transition Statistics
Default Statistics
Concept & Applicable Law
PACRA Transition Methodology
Transition Study Limitations
ContextTransition &
Default TrendsPeer Analysis
PACRA Transition & Default Trends• Where lies the risk in PACRA’s Rating Universe?
• What are the key rating transition and default trends ?
• How PACRA’s ratings measure up to Stability?
• How PACRA’s ratings measure up to Accuracy?
5
This Transition & Default Study is the eleventh compilationof PACRA’s Transition & Default Study. The study capturesthe performance of PACRA ratings assigned from CY10–CY19 – a ten-year period
Measurement Period: Annual
Number of static Pools: 55
Transition & Default Rates expressed in percentage
RISK – Universe Composition & Concentration
Concept & Applicable Law
PACRA Transition Methodology
Transition Study Limitations
ContextTransition &
Default TrendsPeer Analysis
Concentration in higher ratingcategories
0
50
100
150
200
250
0%
20%
40%
60%
80%
100%
CY10 CY11 CY12 CY13 CY14 CY15 CY16 CY17 CY18 CY19
Rat
ings
Co
mp
osi
tio
n (
%)
PACRA Static Pools Composition(CY10-CY19)
AAA AA A
BBB BB B
CCC-C Total0%
10%
20%
30%
40%
50%
60%
AAA AA A BBB BB B
Stat
ic P
oo
ls' I
ssu
er-l
evel
Rat
ings
(%
)
PACRA Ratings' Composition
CY10 CY19
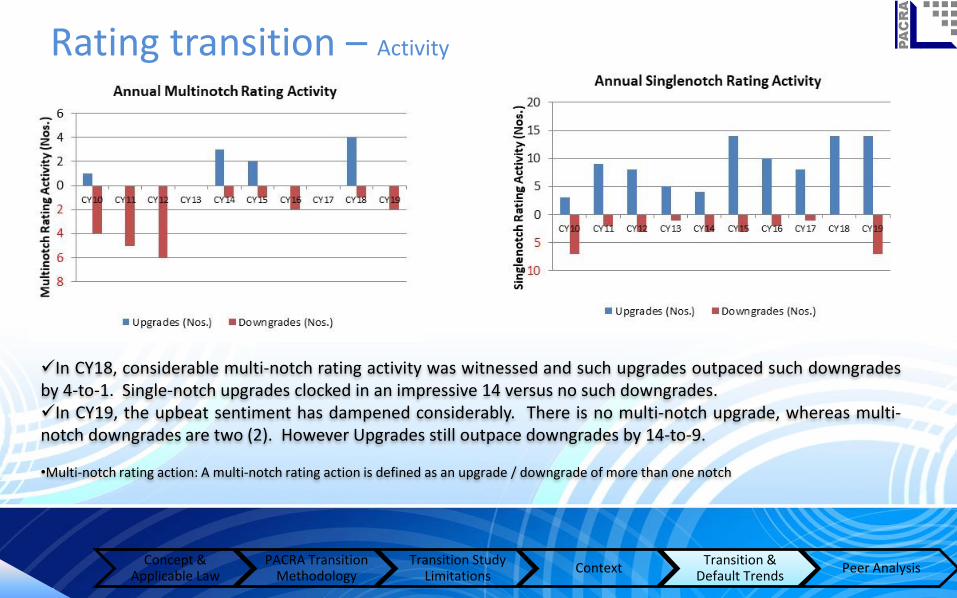
Rating Transition – Key Trends
Concept & Applicable Law
PACRA Transition Methodology
Transition Study Limitations
ContextTransition &
Default TrendsPeer Analysis
Rating drift has deteriorated: The ratioof downgrades versus upgrades movedfrom 0.1-18 in CY18 to 0.5-1.5 in CY19,showing significant deterioration during theperiod.
•Rating Drift is Calculated as downgrade rate (%) dividedby the upgrade rate (%) versus the upgrade rate (%)divided by the downgrade rate (%
In CY18, considerable multi-notch rating activity was witnessed and such upgrades outpaced such downgradesby 4-to-1. Single-notch upgrades clocked in an impressive 14 versus no such downgrades.In CY19, the upbeat sentiment has dampened considerably. There is no multi-notch upgrade, whereas multi-notch downgrades are two (2). However Upgrades still outpace downgrades by 14-to-9.
•Multi-notch rating action: A multi-notch rating action is defined as an upgrade / downgrade of more than one notch
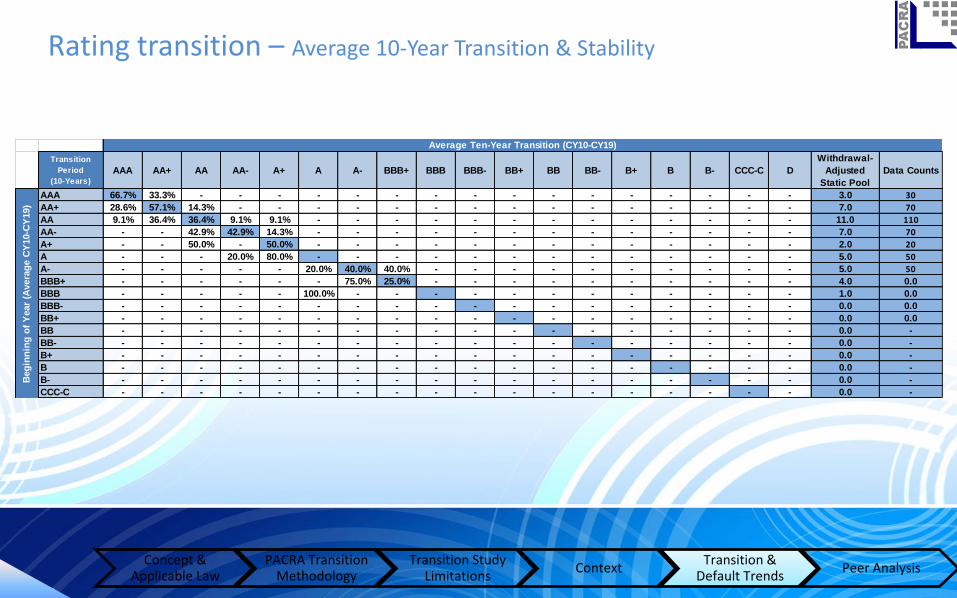
Rating transition – CY19 Transition & Stability
Concept & Applicable Law
PACRA Transition Methodology
Transition Study Limitations
ContextTransition &
Default TrendsPeer Analysis
In CY19, the upgrade rate dwindled and was slashed in half as compared to CY18 (CY19: 7%; CY18: 14%), whereasthe downgrade rate picked up significantly (CY19: 4.8%; CY18: 0.8%)Upgrades were wholly dominated by corporates with nil financial institution. Corporate upgrades were diversified across sectorssuch as power (3), chemicals (1), textiles (3), construction (1), pharmaceutical (2), infrastructure (1), Rice (1), sugar (1) and passengercars (1)
.Downgrades There were two multi-notch downgrades – both corporates | sectors Construction and Batteries
Transition
(Years) : 1
Withdrawal
Adjusted Static
Pool
AAA AA+ AA AA- A+ A A- BBB+ BBB BBB- BB+ BB BB- B+ B B- CCC-C D Withdrawals
The AA category has one (1) default from an entitythat attained its lifetime-high rating within thiscategory that was re-affirmed twice
The A category has an average time-to-default fromthe initial rating of 53 months and from all ratings of47 months
For the BBB category, it is 74 months from initialratings and 41 months from all ratings
The time-to-default for initial ratings is notrepresentative at the BB category. This is so as PACRAhas only two defaults emanating from this categorywidely varying in the time elapsed pre-default - Oneentity defaulting after 148 months and the other onlyafter 14 months, hence skewing the data
Initial Ratings All Ratings
AAA NA NA
AA NA 81
A 53 * 47
(7) **
BBB 74 41
(3)
BB 81 17
(2)
* Time to Default ** Default Counts
Months
Time-to-Default fromRating
Category
Concept & Applicable Law
PACRA Transition Methodology
Transition Study Limitations
ContextTransition &
Default TrendsPeer Analysis
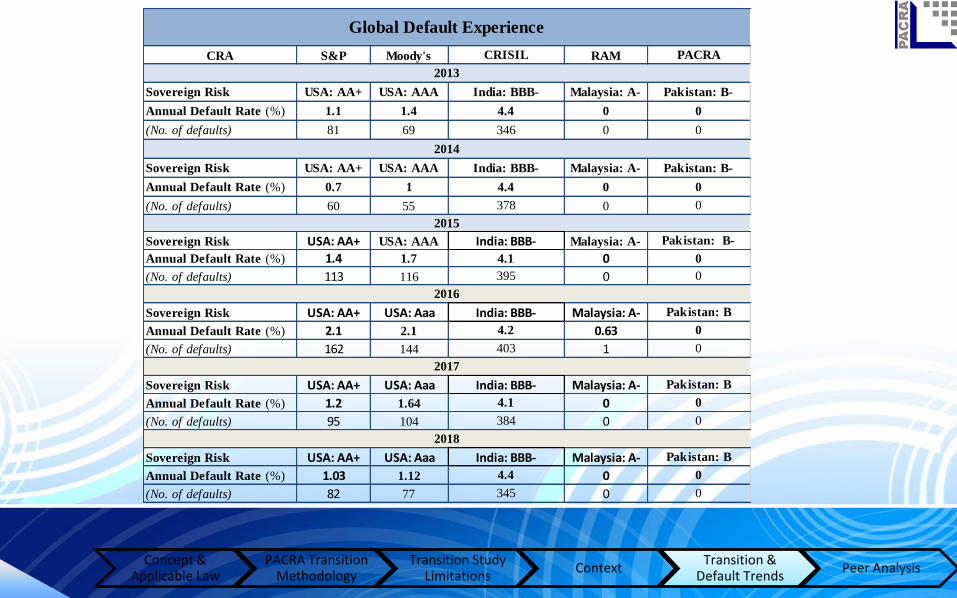
CRA S&P Moody's RAM
Sovereign Risk USA: AA+ USA: AAA Malaysia: A-
Annual Default Rate (%) 1.1 1.4 0
(No. of defaults) 81 69 0
Sovereign Risk USA: AA+ USA: AAA Malaysia: A-
Annual Default Rate (%) 0.7 1 0
(No. of defaults) 60 55 0
Sovereign Risk USA: AA+ USA: AAA Malaysia: A-
Annual Default Rate (%) 1.4 1.7 0
(No. of defaults) 113 116 0
Sovereign Risk USA: AA+ USA: Aaa Malaysia: A-
Annual Default Rate (%) 2.1 2.1 0.63
(No. of defaults) 162 144 1
Sovereign Risk USA: AA+ USA: Aaa Malaysia: A-
Annual Default Rate (%) 1.2 1.64 0
(No. of defaults) 95 104 0
Sovereign Risk USA: AA+ USA: Aaa Malaysia: A-
Annual Default Rate (%) 1.03 1.12 0
(No. of defaults) 82 77 0
4.4 0
345 0
CRISIL PACRA
384 0
2018
India: BBB- Pakistan: B
2017
India: BBB- Pakistan: B
4.1 0
0
0
0
0
2016
Pakistan: BIndia: BBB-
4.2
403
4.4
346
India: BBB-
4.4
4.1
395
India: BBB-
0
Global Default Experience
Pakistan: B-
Pakistan: B-
2015
2014
2013
India: BBB-
0
0
Pakistan: B-
378
0
Concept & Applicable Law
PACRA Transition Methodology
Transition Study Limitations
ContextTransition &
Default TrendsPeer Analysis
Initial Highest One year Last
BBB BBB BBB BBB D
(Mar-00) (Mar-00 to Oct-06) (Dec-04) (Oct-06) (Oct-06)
BBB A+ A+ BB D
(Aug-99) (Mar-03 to Mar-08) (Mar-08) (May-09) (Dec-09)
BB+ AA- BBB C D
(Apr-99) (Nov-04 to Apr-07) (May-11) (Sep-12) (Oct-12)
A A A- CC D
(Jul-06) (Jul-06 to Aug-07) (Sept-08) (May-09) (Nov-09)
A A BBB+ BBB- D
(Oct-07) (Oct-07) (Dec-08) (Dec-09) (Dec-09)
BBB+ BBB+ BBB+ BB- D
(Feb-08) (Feb-08) (Feb-08) (Nov-09) (Nov-09)
A+ A+ A A D
(Jun-07) (Jun-07 to May-08) (Aug-09) (Oct-10) (Mar-11)
A- A+ A+ BB+ D
(Sept-03) (Sept-07 to Nov-08) (Nov-08) (Jun-10) (Sept-10)
A+ A+ A+ BB+ D
(Sept-07) (Sept-07 to Nov-08) (Nov-08) (Jun-10) (Sept-10)
BB BB BB BB D
(Ju1-10) (Ju1-10 to Jul11) (Jul-10) (Ju1-11) (Sept-11)
A A A BBB D
(Jul-06) (Ju1-06 to Jun-10) (Jun-10) (Oct-11) (Jan-12)
A+ A+ A- BB+ D
(Jul-06) (Jul-06 to Sep-08) (Jul-11) (Jul-12) (Jul-12)
For PACRA, 12 Entities / Issuershave defaulted since inception
It is worth noting that most ofthe defaults occurred at higherratings. This is due to:
• Likelihood of defaultincreasing due to tougheroperating environment andPACRA’s historically limitedcoverage of the lower ratingsmarket
PACRA expects this latteranomaly to remain intact till thetime when the ratings universe inPakistan would increase to havea more equitable distribution ofratings across the entire lengthand breadth of the rating scale
Concept & Applicable Law
PACRA Transition Methodology
Transition Study Limitations
ContextTransition &
Default TrendsPeer Analysis
For VIS, 13Entities / Issuershave defaultedsince inception.
Initial Highest One year Last
A A BBB BBB- D
(Dec-04) (Dec-04) (Mar-09) (May-09) (Mar-10)
A- A A BBB D
(Oct-02) (Jun-07 to Oct-07) (Oct-07) (Jun-10) (Jul-10)
A- A- A- A- D
(Jun-08) (Jun-08 to Jul-10) (Jul-09) (Jul-10) (Sept-10)
A- A- BBB- C D
(Dec-05) (Dec-05 to Aug-08) (May-09) (Aug-10) (Oct-10)
AA- AA- C C D
(Aug-02) (Aug-02 to Jul-06) (Sept-10) (Sept-10) (Jan-13)
BBB BBB BBB BB+ D
(Jun-06) (Jun-06 to Jul-07) (Jul-07) (Jul-08) (Jul-08)
A- A- A- BB+ D
(Nov-06) (Nov-06 to Sept-08) (Apr-07) (Nov-08) (Dec-08)
BB+ BB+ BB+ BB+ D
(Jun-09) (Jun-09) (Jun-09) (Jun-09) (Oct-09)
A A A A D
(May-08) (May-08 to Oct-09) (May-08) (Oct-09) (Jan-10)
A A A A D
(Nov-06) (Nov-06 to Mar-09) (Mar-09) (Mar-09) (Oct-10)
A- A A- A- D
(Dec-08) (Dec-08 to Nov-10) (Dec-08) (Nov-10) (Jan-11)
A A BBB BBB D
(Oct-04) (Oct-04 to Oct-05) (Feb-09) (Oct-10) (Jun-11)
A- A- BBB+ BB D
(Mar-08) (Mar-08 to Mar-09) (May-10) (Mar-12) (Mar-12)Q uetta Textiles
• PACRA has used due care in preparation of this document. Our informationhas been obtained from sources we consider to be reliable but its accuracy orcompleteness is not guaranteed. The information in this document may becopied or otherwise reproduced, in whole or in part, provided the source isduly acknowledged. The presentation should not be relied upon asprofessional advice
• Each transition and default study issued by PACRA is self-contained. This isso as PACRA’s continuing data enhancement efforts may result in slightlydifferent statistics than in previously published studies and statistics. Inaddition, comparisons with earlier studies should be viewed within thecontext of the differing methodologies and definitions, employed therein
The Pakistan Credit Rating AgencyAwami Complex, FB-1, Usman Block, New Garden Town, Lahore