Page 1
1
Central regulation of glucose production may be impaired in type 2 diabetes mellitus
Yonah B. Esterson*, Michelle Carey*, Laura Boucai, Akankasha Goyal, Pooja Raghavan,
Kehao Zhang, Deeksha Mehta, Daorong Feng, Licheng Wu, Sylvia Kehlenbrink, Sudha
Koppaka, Preeti Kishore, Meredith Hawkins.
*authors contributed equally
1 Diabetes Research and Training Center, Division of Endocrinology, Department of Medicine,
Albert Einstein College of Medicine, Bronx, NY
Correspondence:
Meredith Hawkins, MD
1300 Morris Park Avenue
Belfer 709
Bronx, NY 10461
Tel: 718-430-8562
Fax: 718-430-8557
[email protected]
Running title: Central regulation of glucose production in diabetes
Page 1 of 34 Diabetes
Diabetes Publish Ahead of Print, published online May 10, 2016
Page 2
2
ABSTRACT
The challenges of achieving optimal glycemic control in type 2 diabetes highlight the need for
new therapies. Inappropriately elevated endogenous glucose production (EGP) is the main source
of hyperglycemia in type 2 diabetes. Since activation of central KATP channels suppresses EGP in
non-diabetic rodents and humans, this study examined whether type 2 diabetic humans and
rodents retain central regulation of EGP. The KATP channel activator diazoxide was administered
in a randomized, placebo-controlled crossover design to eight type 2 diabetes subjects and seven
age- and BMI-matched healthy controls. Comprehensive measures of glucose turnover and
insulin sensitivity were performed during euglycemic ‘pancreatic’ clamp studies following
diazoxide and placebo administration. Complementary rodent clamp studies were performed in
Zucker Diabetic Fatty rats. In type 2 diabetes subjects, extrapancreatic KATP channel activation
with diazoxide under fixed hormonal conditions failed to suppress EGP, while matched controls
demonstrated a 27% reduction in EGP (p=0.002) with diazoxide. Diazoxide also failed to
suppress EGP in diabetic rats. These results suggest that suppression of EGP by central KATP
channel activation may be lost in type 2 diabetes. Restoration of central regulation of glucose
metabolism could be a promising therapeutic target to reduce hyperglycemia in type 2 diabetes.
Page 2 of 34Diabetes
Page 3
3
INTRODUCTION
Substantial evidence indicates that optimal glycemic control is associated with better
clinical outcomes in type 2 diabetes (1,2). However, despite a sizeable therapeutic
armamentarium that targets pathways in liver, muscle, and pancreas, 50% of patients with type 2
diabetes are unable to achieve adequate glycemic control (3). Therefore, new approaches to
improve glucose homeostasis are urgently needed. Increased endogenous glucose production
(EGP) is the major source of both fasting and post-absorptive hyperglycemia in type 2 diabetes
(4,5). Although EGP is suppressed by both insulin and glucose in non-diabetic humans, this
effect is considerably impaired in individuals with type 2 diabetes (4). Therefore, this
inappropriately elevated EGP is an important target for intervention in type 2 diabetes.
Importantly, evidence for regulation of glucose homeostasis by the central nervous
system (CNS) has been accumulating in both rodents and humans. Several rodent studies have
demonstrated that the CNS is involved in the regulation of glucose metabolism through its
detection of nutrients and hormones, subsequent signaling through hypothalamic ATP-sensitive
potassium (KATP) channels, and transduction of those signals to the liver via vagal efferent fibers
(6-14). We recently reported that oral administration of diazoxide, a KATP channel activator,
significantly reduces EGP in non-diabetic humans under fixed hormonal conditions (15).
Additionally, we presented supporting evidence in rats that diazoxide’s suppressive effects on
EGP are abolished with central administration of the KATP channel blocker glibenclamide,
suggesting that these effects are centrally mediated (15). Furthermore, intranasal administration
of insulin at doses previously shown to increase CSF insulin concentrations ~2-fold suppressed
glucose production to a similar extent and over a similar time course, likely through activation of
central KATP channels (16). Collectively, these studies in rodents and humans suggest a role for
hypothalamic KATP channels in regulation of glucose metabolism.
Page 3 of 34 Diabetes
Page 4
4
Of note, a number of studies in obese or diabetic rodents have indicated that central
sensing mechanisms are ineffective at maintaining glucose homeostasis in these models (17-20).
In fact, it has been hypothesized that dysregulated CNS circuits may contribute to impaired
glucose homeostasis in type 2 diabetes (21). Therefore, it is essential to establish whether central
regulation of glucose homeostasis remains intact in humans with type 2 diabetes. If so,
hypothalamic KATP channels represent a potential therapeutic target to counteract excessive EGP
and improve hyperglycemia in type 2 diabetes. Conversely, if central regulation of EGP is lost in
type 2 diabetes, future therapies could be directed at restoring these pathways.
Given the evidence supporting regulation of EGP by a brain-liver pathway in non-
diabetic humans (15), the current randomized, placebo-controlled crossover study was designed
to determine whether activation of central KATP channels would suppress EGP in individuals
with type 2 diabetes. Importantly, we conducted parallel studies in a group of specifically
recruited age- and BMI-matched non-diabetic controls. To exclude any effects of diazoxide on
insulin secretion, these studies were performed under euglycemic ‘pancreatic clamp’ conditions.
Complementary studies in Zucker Diabetic Fatty (ZDF) rats were also performed to assess
diazoxide’s ability to cross the blood brain barrier and to suppress EGP in this animal model of
type 2 diabetes.
RESEARCH DESIGN AND METHODS
Human Studies. Eight subjects with moderately-to-poorly controlled type 2 diabetes were
studied (Table 1). Eligible subjects were diagnosed with type 2 diabetes within the past 10 years,
and were otherwise in good health. Seven healthy age- and BMI-matched non-diabetic control
subjects were also studied (Table 1). The purpose, nature, risks and benefits of the study were
explained to all subjects in the Clinical Research Center (CRC) prior to their enrollment in the
study, and their voluntary, informed, written consent was obtained. All subjects had an initial
Page 4 of 34Diabetes
Page 5
5
screening visit to allow for a clinical evaluation which included history, physical examination,
hematologic, lipid, and chemistry screening (including fasting glucose levels), baseline EKG,
and consent procedures. A 2-hour oral glucose tolerance test was performed to ensure normal
glucose tolerance in non-diabetic controls. Each subject received the experimental agents in
random order, and the agents were identical in appearance.
Euglycemic pancreatic clamp procedures. All experiments consisted of basal insulin and
somatostatin (250 µg/hr) infusions with replacement of glucoregulatory hormones (glucagon 0.6
ng/kg/min; growth hormone 3 ng/kg/min) starting at t=-120 minutes. From t=-120 to t=0
minutes, insulin infusion rates were adjusted every 20-25 mins to determine optimal insulin
infusion rates to maintain euglycemia. Finer calibration of insulin infusion rates were performed
from t=0 to t=120 mins, to establish individualized basal insulin infusion rates by 120 mins (15).
In eight of the thirty studies (n=1 non-diabetic placebo, n=2 non-diabetic diazoxide, n=2 diabetic
placebo, n=3 diabetic diazoxide), minor changes to the insulin infusion rates were made from t
=120 to t =170 minutes to prevent hypoglycemia. There were no significant changes in either
insulin infusion rates or in plasma insulin concentrations between 0 and 240 mins, emphasizing
the fact that any changes were minor. This careful approach to attaining individualized, basal
insulin infusion rates, avoiding the need for virtually any exogenous glucose infusion, permits
highly sensitive measures of glucose production without over-insulinization (15; 23). Plasma
glucose concentrations were measured at 5 minute intervals during the 240 minutes of the study
and maintained at normal fasting concentrations (~90 mg/dl), employing low infusion rates of
dextrose 20% if needed. All infusions were stopped at t=240 minutes, and subjects received a
standard meal with subsequent plasma glucose monitoring for 60 minutes after the completion of
the study before being discharged from the CRC. Data for glucose turnover represent the mean
values during the final 60 minutes of the studies (t=180-240 minutes).
Page 5 of 34 Diabetes
Page 6
6
Each subject underwent two paired euglycemic pancreatic clamp studies separated by 4-6 weeks.
After an overnight fast, non-diabetic subjects were admitted to the CRC on the morning of the
study. Subjects with type 2 diabetes were admitted to the CRC the night prior to the clamp study
for gradual lowering of plasma glucose levels with intravenous insulin infusions (22,23) and
were also fasted overnight prior to the study. Since an algorithm was used for insulin infusion
rates, subjects received progressively lower rates of insulin infusion as their glucose levels
dropped. Sulfonylurea agents and metformin were discontinued for 72 hours prior to all
admissions and thiazolidinediones were held for 8 days prior to admission. Long or intermediate
acting preparations of insulin were discontinued prior to admission such that subjects received no
long acting insulin for 24 hours prior to the study and no intermediate acting insulin for at least
12 hours. An 18-gauge catheter was inserted in an antecubital vein for infusions and a
contralateral hand vein was cannulated in a retrograde fashion for arterialized venous blood
sampling. To obtain arterialized venous blood, the hand was kept in a warming pad maintained at
55°C. During initial pilot studies (24), it was determined that optimal metabolic effects of
diazoxide were observed approximately 6-7 hours following drug administration.
At t=-180 minutes, the subjects were administered either oral diazoxide 4-6 mg/kg or
placebo in a double blinded fashion (Figure 1). Vital signs were recorded at t=-180 minutes and
hourly thereafter. Primed continuous infusions of 6-6 glucose (D2G) tracer were initiated at t=-
120 minutes (10.4 ml/min bolus, then 3.903 mg/min), to measure glucose fluxes under
‘pancreatic clamp’ conditions (15). From t=0 to t=240 minutes, blood samples were obtained for
determinations of plasma glucose, insulin, glucagon, C-peptide, cortisol, free fatty acids,
glycerol, lactate, and 6-6 glucose determinations. Each subject returned to the CRC for a second
study (either placebo or diazoxide) after 4-6 weeks had elapsed.
Page 6 of 34Diabetes
Page 7
7
Plasma hormone and substrate determinations. Plasma glucose was measured at the bedside
with a Beckman glucose analyzer (Fullerton, CA) by use of the glucose oxidase method.
Measurements of plasma insulin, C-peptide, and glucagon were undertaken in order to evaluate
the inhibitory effects of somatostatin on insulin secretion and the consistency of hormone
replacement. Plasma insulin, C-peptide, glucagon, and cortisol concentrations were measured by
radioimmunoassay in the Diabetes Research Center Hormone Assay Core (25). Plasma lactate,
free fatty acids, and glycerol were measured using spectrophotometric techniques (26-28). 6-6
glucose concentrations were measured by gas chromatography mass spectrometry (GCMS), as
previously described (29,30). The rates of EGP were compared during euglycemic clamp studies
following diazoxide administration versus following placebo in each subject. Rates of glucose
appearance (Ra) and disappearance (Rd) and other indices of glucose turnover were estimated by
using Steele equations (31), using the assumption that Ra=Rd for steady state, and using the
following equation: Rd=(Basal [6,6-2H2]glucose infusion rate +D20/[6,6-
2H2] glucose infusion
rate/APE fraction/wt (kg), with data averaged over 60-minute segments of each experiment. EGP
was determined by subtracting the rates of glucose infusion from the tracer-derived Ra.
Rat studies: Eleven-week old male Zucker Diabetic Fatty rats (n=12) (Charles River
Laboratories; Wilmington, MA), with an average weight of 354.5 ± 10.6 g, were studied under
the following conditions: (a) oral (gavage) saline control (n=6); (b) oral (gavage) diazoxide (n=6)
(Figure 5A). The night before infusion studies were performed, each animal received Neutral
Protamine Hagedorn (NPH) insulin (3-5 U/kg) to slowly correct hyperglycemia prior to the
study. Each infusion study lasted 240 minutes. 120 minutes prior to infusion studies, rats were
anesthetized with isofluorane, and either saline or diazoxide (100mg/kg) was administered by
oral gavage. For the remainder of the studies, rats were conscious and unrestrained. Insulin
infusion (3-6mU/kg/min) was then initiated to slowly lower blood glucose to ~140-150mg/dL
Page 7 of 34 Diabetes
Page 8
8
prior to initiation of the study. At t=0 minutes, a primed continuous i.v. infusion of [3-3H]-
glucose was begun and maintained for 4 hours to assess glucose kinetics (40µCi bolus followed
by 0.4µCi/min infusion, Perkin Elmer). Blood samples were obtained at 10-minute intervals
during the final hour of the clamp to assess [3-3H]-glucose specific activity. A peripheral basal
insulin pancreatic-euglycemic clamp was performed for the final 2 hours of the infusion study (t
= 120-240 min), as previously described, using continuous i.v. somatostatin infusion (15). This
specific protocol was followed, without glucagon infusion, in order to replicate previous studies
examining central regulation of glucose production (12, 15).
Rats were prepared for the in vivo experiments with implantation of carotid and internal jugular
catheters one week prior to the study. Following the study, rats were anesthetized with ketamine
(150mg/kg). CSF samples were obtained by ventricular puncture and liver tissue samples were
obtained by freeze clamping. CSF was analyzed for diazoxide content by NMS Labs (Willow
Grove, PA) using liquid chromatography tandem mass spectrometry (LC-MS). Real-time reverse
transcriptase polymerase chain reaction (rt-PCR) was performed to examine gene expression and
protein levels of phosphoenolpyruvate carboxykinase (PEPCK) and glucose-6-phosphatase
(G6Pase) in rat liver, using a Roche LightCycler abd SYBR Green I (Qiagen). Relative gene
expression was calculated as the ratio of target gene divided by the geometric mean of
housekeeping genes.
Statistical Analysis. Comparison of EGP, rate of glucose disappearance, glucose infusion rate,
and hormone and substrate levels during diazoxide versus placebo studies within each group
were performed using paired Student’s t-tests. Unpaired Student’s t-tests were used to compare
the percent change in EGP (diazoxide vs. placebo studies) and subject characteristics between
the two groups. Repeated measures analysis of variance (ANOVA) was used to assess the
stability of average percent enrichment of 6-6 glucose in the plasma during the last two hours of
the clamp studies. Student’s t-tests and ANOVA were performed under the assumptions of
Page 8 of 34Diabetes
Page 9
9
equality of variances and normality. Equality of variances was met when the standard deviations
of the variables differed by less than an order of magnitude. Normality of data could not be fully
assessed given that the classical tests of normality are not robust to smaller sample sizes.
Therefore, the significance or non-significance of each parametric test result was confirmed with
the alternative non-parametric test (Wilcoxon matched pairs signed rank sum test for comparison
of medians of paired data, Mann-Whitney tests for comparison of medians of two independent
groups, and Kruskall-Wallis test for comparison of medians of three or more independent
groups). Alpha was set at 0.05 for all tests. Data are reported as mean±standard error unless
otherwise noted.
Study Approval. All procedures were approved by the Institutional Review Board of
Albert Einstein College of Medicine.
RESULTS
Human Subject Characteristics. Eight diabetic subjects and seven non-diabetic controls were
frequency matched for age and BMI. Additional subject characteristics are presented in Table 1.
Since a number of rodent studies suggest that central regulation of metabolic homeostasis is
impaired with both obesity and aging (18-20), we specifically recruited an age- and BMI-
matched non-diabetic control group for these studies. All subjects with type 2 diabetes who
completed both placebo and diazoxide clamps were males. We included only male control
subjects to maintain consistency between groups. Of note, analysis of our previously published
data reveals that the decrease in EGP seen with diazoxide administration relative to placebo
administration in healthy subjects was not significantly different in females versus males
(p=0.22) (15). Furthermore, since study recruitment aimed to be representative of the ethnic
composition of the Bronx, both groups were racially/ethnically heterogeneous, although there
were more Hispanic subjects in the diabetic vs. non-diabetic group (4 vs. 1, respectively). While
Page 9 of 34 Diabetes
Page 10
10
the effects of diazoxide were comparable among all subjects in both groups, this study was not
sufficiently powered for a subgroup analysis to discern ethnic differences.
Human Clamp Conditions. Over the interval of measurement, average percent enrichment of 6-
6 glucose in the plasma during diazoxide studies remained stable in both diabetic subjects
(p=0.42) and non-diabetic controls (p=0.96). Similarly, APE during placebo studies remained
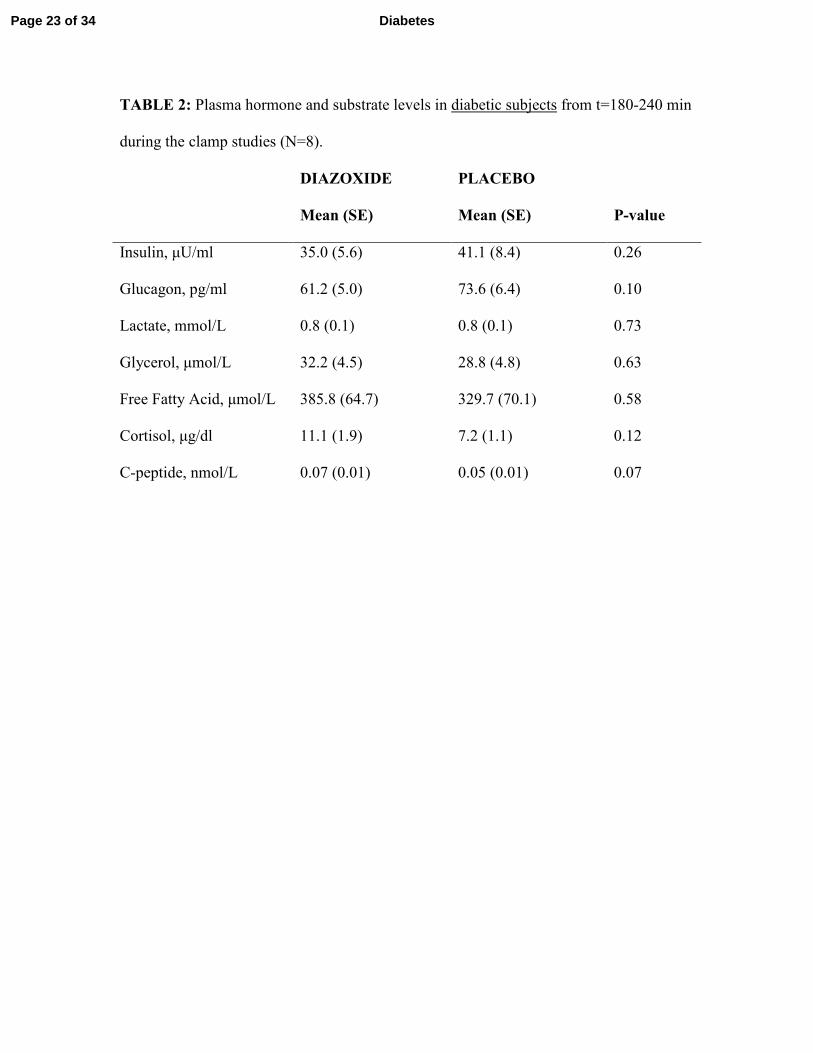
stable in both diabetic subjects (p=0.99) and non-diabetic controls (p=0.89). Plasma hormone
levels were measured to confirm that the clamp conditions prevented pancreatic hormone
secretion. There were no statistically significant differences in plasma levels of insulin,
glucagon, cortisol, free fatty acids, C-peptide, glycerol, or lactate in response to diazoxide versus
placebo in diabetic subjects (Table 2) or in non-diabetic controls (Table 3). While this likely
reflects a lack of difference, we cannot rule out Type II error in light of the relatively small
sample sizes common to all resource-intensive physiologic studies. Of note, baseline C-peptide
levels were suppressed following overnight insulin infusion in the diabetic subjects. Average
insulin infusion rates were similar during the final hour of the clamp under both experimental
conditions in diabetic subjects (0.35 ± 0.08 mU/m2/min with diazoxide versus 0.32 ± 0.07
mU/m2/min with placebo, P=0.52) and in non-diabetic controls (0.21 ± 0.04 mU/m
2/min with
diazoxide versus 0.16 ± 0.02 mU/m2/min with placebo, P=0.09). Although diazoxide has the
potential to lower blood pressure at high doses, there were no differences in mean systolic blood
pressure (p=0.36 in diabetic subjects, p=0.69 in controls), mean diastolic blood pressure (p=0.17
in diabetic subjects, p=0.17 in controls), or mean heart rate (p=0.39 in diabetic subjects, p=0.44
in controls) with diazoxide versus placebo versus baseline.
Glucose Fluxes. We previously reported that oral administration of diazoxide caused a 29%
decrease in EGP in healthy human subjects (15). In the current study, we determined that oral
administration of diazoxide to diabetic subjects under fixed hormonal conditions did not affect
EGP (1.55 ± 0.08 mg kg-1
min-1
with diazoxide versus 1.59 ± 0.08 mg kg-1
min-1
with placebo,
Page 10 of 34Diabetes
Page 11
11
P=0.74) (Figure 2A and Figure 3A). This is in contrast to the 27.4% decrease in EGP after
diazoxide administration in age- and BMI-matched non-diabetic controls (1.14 ± 0.07 mg kg-1
min-1
with diazoxide versus 1.61 ± 0.14 mg kg-1
min-1
with placebo, P=0.002) (Figure 2A and
Figure 3B). Relative to basal rates of EGP, there was a 0.4+8.4% increase in EGP in the placebo
studies and a 26.4+3.0% decrease in the diazoxide studies between time -120 and 240 mins in the
non-diabetic subjects. The diazoxide-induced suppression of EGP in the non-diabetic controls
thus differed significantly from the complete lack of response in the diabetic subjects (P=0.01)
(Figure 2B). Of note, our intent in designing the current studies was to avoid over-insulinization
of the liver, and in fact it should be noted that rates of EGP remained unsuppressed throughout
the placebo studies relative to basal EGP at time -120 min, prior to the onset of the clamp.
Furthermore, among subjects in whom insulin infusion rates were unchanged after 120 mins,
there was a 32% suppression of EGP by diazoxide in the nondiabetic group and no change in the
diabetic group. However, it would be interesting to know whether diazoxide exerts an effect on
EGP in the presence of hepatic hyperinsulinemia in humans.
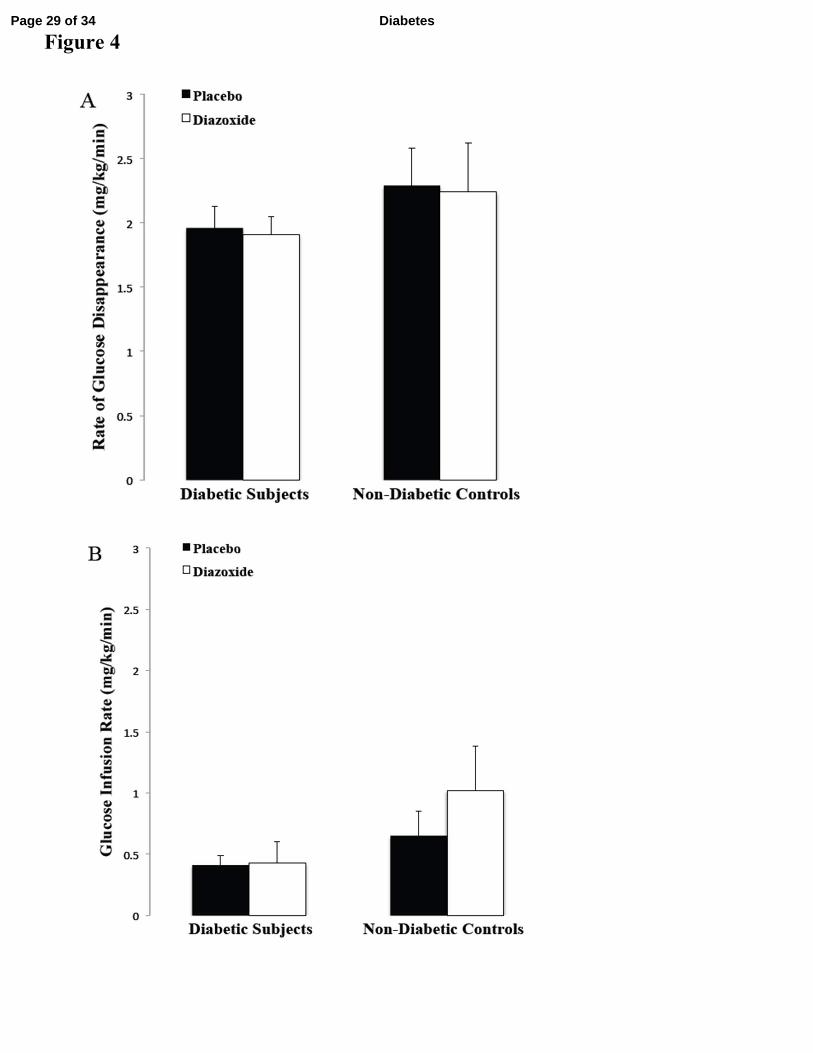
Diazoxide did not alter the rate of glucose disappearance in diabetic subjects (1.91 ±
0.14 mg kg-1
min-1
with diazoxide versus 1.96 ± 0.17 mg kg-1
min-1
with placebo, P= 0.77) or in
non-diabetic controls (2.24 ± 0.38 mg kg-1
min-1
with diazoxide versus 2.29 ± 0.29 mg kg-1
min-1
with placebo, P=0.81) (Figure 4A). Of note, since these studies were conducted under basal
insulin conditions, glucose infusion rates required to maintain euglycemia were minimal in all
groups (diabetic subjects: 0.43 ± 0.17 mg kg-1
min-1
with diazoxide versus 0.41 ± 0.08 mg kg-1
min-1
with placebo, P= 0.94; non-diabetic controls: 1.02 ± 0.36 mg kg-1
min-1
with diazoxide
versus 0.65 ± 0.20 mg kg-1
min-1
with placebo, P=0.24) (Figure 4B).
Rat Studies: Complementary rodent studies were performed in n=12 Zucker Diabetic Fatty rats
(Average weight= 354.5 ± 10.6 g). Due to limited sample volume from each rodent, pooled CSF
collected at the end of the clamp studies was analyzed and demonstrated measurable levels of
Page 11 of 34 Diabetes
Page 12
12
diazoxide 6 hours after administration (1µg/mL, with a reporting limit of 0.5µg/mL) by LCMS,
comparable with CSF diazoxide levels reported in our studies in Sprague Dawley rats (15). Tail
stick blood glucose levels the night before the clamp studies were elevated in both groups of
ZDF rats prior to treatment with NPH insulin (blood glucose= 409.5 ± 50.3 mg/dL in the
diazoxide group and 474.2 ± 44.3 mg/dL in the saline group, p=NS). During the steady state
phase of the clamp studies, average plasma glucose levels were similar between the diazoxide
and saline groups (143.1 ± 1.3 mg/dL with diazoxide vs. 145.9 ± 1.0 mg/dL with saline, p=NS).
Insulin levels were also similar for the two groups during the steady state phase of the clamp
(143.0 ± 21.7 uU/mL with diazoxide vs. 130.41 ± 35.87 uU/mL with saline, p=NS). Consistent
with our findings in human subjects with diabetes, there was no significant difference in average
rates of EGP following administration of diazoxide compared with saline gavage (3.5± 0.9 mg
kg-1
min-1
with diazoxide versus 2.8± 0.8 mg kg-1
min-1
with saline, p=0.52) (Figure 5B).
Intriguingly, while these rates of EGP are lower than previously published clamp results in ZDF
rats (32), clamp studies performed in the absence of glucagon infusion were associated with EGP
rates that were similar to those observed in the current studies (M. Shiota, personal
correspondence). The reason for performing these clamp studies without glucagon infusion was
to reproduce study conditions previously used to examine the impact of diazoxide on central
regulation of EGP (12,15).
Gene expression of hepatic gluconeogenic enzymes PEPCK and G6Pase also showed no
significant differences following diazoxide versus saline administration (relative PEPCK gene
expression: 1.12 ± 0.12 with diazoxide vs. 1.04 ± 0.15 with saline, p=0.68; relative G6Pase gene
expression: 0.10 ±0.01 with diazoxide vs. 0.09 ± 0.02 with saline, p=0.72; Figure 5C).
Page 12 of 34Diabetes
Page 13
13
DISCUSSION
Endogenous glucose production (EGP) is a critical component of the homeostatic
mechanisms that maintain blood glucose at appropriate levels, and its dysregulation in type 2
diabetes contributes importantly to hyperglycemia. Given that activation of extrapancreatic KATP
channels is able to suppress EGP in both animal models and in healthy humans (12,15), the
current study examined the ability of the KATP channel activator diazoxide to regulate EGP in
ZDF rats and in humans with moderately-to-poorly controlled diabetes under fixed hormonal
conditions. Our results indicate that central regulation of EGP is impaired in both rats and
humans with type 2 diabetes.
Given the potential that age and obesity might impact central regulation of glucose
metabolism (33), we specifically recruited a group of age- and BMI-matched non-diabetic
subjects as a comparison group for this study. Of note, the EGP response to diazoxide in these
overweight, middle-aged subjects was consistent with our previous observations in younger,
leaner subjects (15). An additional methodologic point pertains to diazoxide’s ability to activate
KATP channels in the plasma membrane of pancreatic β-cells, thereby inhibiting insulin secretion
(34,35). Therefore, the current study utilized somatostatin, known to suppress insulin secretion
via G-protein coupled somatostatin receptors and inhibit intracellular calcium ion translocation
(36). The absence of any differences in plasma hormone levels confirms the adequacy of the
‘pancreatic clamp’ technique to allow us to isolate diazoxide’s extrapancreatic effects.
Furthermore, since hyperglycemia would be expected to suppress EGP in the diabetic
subjects, it was important to correct hyperglycemia prior to the onset of the clamp studies.
Indeed, the overnight insulin infusions in the diabetic group were designed to attain comparable
basal rates of EGP and plasma glucose levels in the two groups. Additionally, insulin
requirements progressively fell with correction of glucose toxicity overnight, such that insulin
Page 13 of 34 Diabetes
Page 14
14
infusion rates averaged 0.24±0.07 mU/kg/min by the final hour prior to the clamp studies
(Supplementary Figure 1) and rates of EGP were similarly unsuppressed at the onset of the
studies in both groups. Although we cannot exclude the possibility that some suppression of
basal EGP by overnight insulin might have attenuated the effect of diazoxide on EGP in the
diabetic rats and humans, since hepatic hyperinsulinemia may mask CNS effects on the liver (37-
39), it is important to note that insulin infusion rates were no greater than basal for more than 6
hours prior to the study interval when EGP was calculated. Future studies using an SGLT2
inhibitor to lower glucose levels prior to the clamp could further address this question.
Furthermore, activation and deactivation of KATP channels are very rapid phenomena (40),
making residual activating effects of insulin on KATP channels unlikely.
Of note, plasma insulin infusion rates were approximately doubled in the diabetic vs.
non-diabetic subjects in the placebo studies. This reflected mild insulin resistance despite
correction of glucose toxicity in the diabetic subjects. The comparable rates of EGP in both
subject groups demonstrated that we were successful in selecting appropriate insulin infusion
rates to study both groups under basal EGP conditions. Furthermore, attaining individualized,
basal insulin infusion rates during the clamp studies avoided the need for virtually any
exogenous glucose infusion and permitted highly sensitive measures of glucose production
without over-insulinization (15, 23).
The results of these studies in humans and rats are consistent with prior literature in
rodents, suggesting that metabolic disturbances including those present in obesity and type 2
diabetes disrupt central regulation of glucose homeostasis. Inhibiting insulin action in the arcuate
nucleus by a number of experimental approaches including insulin antibodies and inhibition of
phosphatidylinositol 3-kinase (PI3K) results in a diminished ability of insulin to suppress EGP
(41,42). Furthermore, insulin is unable to activate central KATP channels in obese rats (20),
consistent with our findings in ZDF rats. Indeed, high fat feeding of even short duration activates
Page 14 of 34Diabetes
Page 15
15
hypothalamic S6 kinase, a putative mediator of insulin resistance, which in turn impairs the
ability of circulating insulin to suppress EGP (14). Additionally, hypothalamic signaling via the
insulin receptor substrate-phosphatidylinositol 3-kinase (IRS-PI3K) pathway, an important
mediator of insulin action, is impaired in rats with streptozotocin-induced diabetes (17). Of note,
it is likely that poor metabolic control contributes to the lack of EGP response in our diabetic
subjects, since diabetic subjects in comparably poor control showed a lack of suppression of
EGP by hyperglycemia (likely mediated at least in part by cental KATP channels), while diabetic
subjects in good control showed normal suppression of EGP (43). This is also consistent with
the observation that centrally-administered diazoxide was able to modulate EGP in high-fat fed
yet normoglycemic rats (41). Furthermore, while intranasal insulin (presumably via central
mechanisms) increased hepatic energy metabolism and reduced lipid storage in healthy humans,
this effect was absent in patients with type 2 diabetes (44).
Collectively, these findings highlight the need for interventions to restore central
signaling mechanisms. Various molecular targets have been proposed that could restore the
brain’s sensitivity to nutrients in type 2 diabetes. These targets include regulators of insulin and
leptin action (such as protein tyrosine phosphatase 1B, c-Jun-N terminal kinase, and SRC
homology 2B) as well as peripheral modulators of glucose metabolism (such as glucagon-like
peptide-1) (42). A critical challenge lies in developing medications that specifically target the
brain without acting peripherally. One potential model is the established treatment for
Parkinson’s disease, L-dopa, which is delivered with a peripheral decarboxylase inhibitor to
prevent it from being metabolized prior to passing through the blood-brain barrier (45). In fact,
even short-term improvement in an individual’s metabolic state may restore the integrity of the
brain-liver pathway in type 2 diabetes (43). It will also be important to identify the critical
stage(s) at which therapies targeting restoration of the brain-liver pathway would be most
beneficial. Although delineating whether central or hepatic mechanisms are responsible for the
Page 15 of 34 Diabetes
Page 16
16
lack of response in diabetes was not the goal of the current studies, we hope to perform future
studies specifically designed to delineate the central and/or peripheral site(s) at which the
response is altered.
While it has long been accepted that type 2 diabetes is associated with malfunctions of
the beta cell, muscle, and liver, growing evidence suggests that the brain also plays a key role in
the pathogenesis of type 2 diabetes. The results of the current study are also relevant to recent
work demonstrating that neurologic disorders such as Alzheimer’s disease, major depressive
disorder, Parkinson’s disease, Huntington’s disease, and vascular dementia are all associated
with metabolic derangements. Specifically, these diseases feature impaired systemic glucose
metabolism and insulin resistance, as well as poor cerebral glucose utilization, cerebral insulin
resistance, cerebral insulin deficiency, and abnormal expression of genes that are typically
regulated by insulin (46-49). Indeed, a great deal of evidence supports a role for the brain in
metabolic disease and, conversely, for metabolic derangements in the pathophysiology of
neuropsychiatric disorders. This work also highlights a potential concern with the use of
sulfonylurea agents in the longer treatment of type 2 diabetes, especially in patients with waning
beta cell reserve. Inhibition of central KATP channels by these agents could increase EGP and
hence contribute to deterioration of glycemic control in these individuals (50).
Thus, we present the first study in humans to show that regulation of EGP through
activation of extrapancreatic KATP channels is impaired in type 2 diabetes, providing further
insight into the CNS basis for the pathogenesis of metabolic disorders. Complementary rodent
studies in a rat model of type 2 diabetes support our findings in humans. Given that unrestrained
EGP is the chief source of hyperglycemia in type 2 diabetes, restoring the brain’s sensitivity to
nutrient signals would be a promising therapeutic target.
Page 16 of 34Diabetes
Page 17
17
AUTHOR CONTRIBUTIONS
Y.B.E. and M.C. wrote the manuscript, collected data, and assisted with running clamp studies.
L.B., P.K. and A.G. contributed to the manuscript, collected data, and assisted with running
clamp studies. D.M., S.Ke., P.R., S.Ko., D.F. and L.W. assisted with running clamp studies in
humans and rats and/or performing laboratory assays. K.Z. oversaw the rodent experiments in
collaboration with the Animal Physiology Core. M.H. designed the study, researched data, and
wrote the manuscript. M.H. is the guarantor of this work and, as such, had full access to all the
data in the study and takes responsibility for the integrity of the data and the accuracy of the data
and the analysis.
ACKNOWLEDGEMENTS
The authors Y.B.E., M.C., L.B., P.R., K.Z., D.M., S.Ke., S.Ko., A.G., P.K. and M.H. have no
conflict of interests. The authors thank Kevin Jordan, Amelia Starr, Sarah Reda, Laura Clintoc,
Stephen Marsh, and the staff of the Albert Einstein College of Medicine CRC and Hormone
Assay Core of Einstein’s Diabetes Research Center (P60-DK20541), Dr. Gary Schwartz of the
DRC’s Animal Physiology Core, and Drs. Jeffrey Pessin, Nir Barzilai and Richard Kitsis for
helpful discussions. This work was supported by grants from the National Institutes of Health
(DK069861 and DK48321) and the American Diabetes Association, and by the CTSA Grant
UL1 RR025750 and KL2 RR025749 and TL1 RR025748 from the National Center for Research
Resources (NCRR). Its contents are solely the responsibility of the authors and do not
necessarily represent the official view of the NCRR or NIH.
Page 17 of 34 Diabetes
Page 18
18
REFERENCES
1. Turner R, Cull C, Holman R: United Kingdom Prospective Diabetes Study 17: a 9-year update
of a randomized, controlled trial on the effect of improved metabolic control on complications in
non-insulin-dependent diabetes mellitus. Ann Intern Med 1996;124:136-145
2. Gaster B, Hirsch IB: The effects of improved glycemic control on complications in type 2
diabetes. Arch Intern Med 1998;158:134-140
3. Suh DC, Choi IS, Plauschinat C, Kwon J, Baron M: Impact of comorbid conditions and
race/ethnicity on glycemic control among the US population with type 2 diabetes, 1988-1994 to
1999-2004. J Diabetes Complications 2010;24:382-391
4. Campbell PJ, Mandarino LJ, Gerich JE: Quantification of the relative impairment in actions of
insulin on hepatic glucose production and peripheral glucose uptake in non-insulin-dependent
diabetes mellitus. Metabolism: clinical and experimental 1988;37:15-21
5. Consoli A: Role of liver in pathophysiology of NIDDM. Diabetes care 1992;15:430-441
6. Carey M, Kehlenbrink S, Hawkins M: Evidence for central regulation of glucose metabolism.
J Biol Chem 2013;288:34981-34988
7. Kokorovic A, Cheung GW, Rossetti L, Lam TK: Hypothalamic sensing of circulating lactate
regulates glucose production. J Cell Mol Med 2009;13:4403-4408
8. Lam CK, Chari M, Lam TK: CNS regulation of glucose homeostasis. Physiology (Bethesda,
Md) 2009;24:159-170
9. Lam TK, Gutierrez-Juarez R, Pocai A, Rossetti L: Regulation of blood glucose by
hypothalamic pyruvate metabolism. Science (New York, NY) 2005;309:943-947
10. Liu L, Karkanias GB, Morales JC, Hawkins M, Barzilai N, Wang J, Rossetti L:
Intracerebroventricular leptin regulates hepatic but not peripheral glucose fluxes. The Journal of
biological chemistry 1998;273:31160-31167
11. Obici S, Zhang BB, Karkanias G, Rossetti L: Hypothalamic insulin signaling is required for
inhibition of glucose production. Nat Med 2002;8:1376-1382
12. Pocai A, Lam TK, Gutierrez-Juarez R, Obici S, Schwartz GJ, Bryan J, Aguilar-Bryan L,
Rossetti L: Hypothalamic K(ATP) channels control hepatic glucose production. Nature
2005;434:1026-1031 13. Pocai A, Obici S, Schwartz GJ, Rossetti L: A brain-liver circuit regulates glucose
homeostasis. Cell metabolism 2005;1:53-61
14. Ross R, Wang PY, Chari M, Lam CK, Caspi L, Ono H, Muse ED, Li X, Gutierrez-Juarez R,
Light PE, Schwartz GJ, Rossetti L, Lam TK: Hypothalamic protein kinase C regulates glucose
production. Diabetes 2008;57:2061-2065
15. Kishore P, Boucai L, Zhang K, Li W, Koppaka S, Kehlenbrink S, Schiwek A, Esterson YB,
Mehta D, Bursheh S, Su Y, Gutierrez-Juarez R, Muzumdar R, Schwartz GJ, Hawkins M:
Activation of K(ATP) channels suppresses glucose production in humans. J Clin Invest
2011;121:4916-4920
16. Dash S, Xiao C, Morgantini C, Koulajian K, Lewis GF: Intranasal insulin suppresses
endogenous glucose production in humans compared with placebo in the presence of similar
venous insulin concentrations. Diabetes 2015;64:766-774
17. Gelling RW, Morton GJ, Morrison CD, Niswender KD, Myers MG, Jr., Rhodes CJ,
Schwartz MW: Insulin action in the brain contributes to glucose lowering during insulin
treatment of diabetes. Cell metabolism 2006;3:67-73
18. Ikeda H, West DB, Pustek JJ, Figlewicz DP, Greenwood MR, Porte D, Jr., Woods SC:
Intraventricular insulin reduces food intake and body weight of lean but not obese Zucker rats.
Appetite 1986;7:381-386
Page 18 of 34Diabetes
Page 19
19
19. Parton LE, Ye CP, Coppari R, Enriori PJ, Choi B, Zhang CY, Xu C, Vianna CR, Balthasar
N, Lee CE, Elmquist JK, Cowley MA, Lowell BB: Glucose sensing by POMC neurons regulates
glucose homeostasis and is impaired in obesity. Nature 2007;449:228-232
20. Spanswick D, Smith MA, Mirshamsi S, Routh VH, Ashford ML: Insulin activates ATP-
sensitive K+ channels in hypothalamic neurons of lean, but not obese rats. Nat Neurosci
2000;3:757-758 21. Sandoval DA, Obici S, Seeley RJ: Targeting the CNS to treat type 2 diabetes. Nat Rev Drug
Discov 2009;8:386-398
22. Esterson YB, Zhang K, Koppaka S, Kehlenbrink S, Kishore P, Raghavan P, Maginley SR,
Carey M, Hawkins M: Insulin sensitizing and anti-inflammatory effects of thiazolidinediones are
heightened in obese patients. J Investig Med 2013;61:1152-1160
23. Koppaka S, Kehlenbrink S, Carey M, Li W, Sanchez E, Lee DE, Lee H, Chen J, Carrasco E,
Kishore P, Zhang K, Hawkins M: Reduced adipose tissue macrophage content is associated with
improved insulin sensitivity in thiazolidinedione-treated diabetic humans. Diabetes
2013;62:1843-1854
24. Schiwek A, Lee DE, Saper M, Rossetti L, Kishore P, Hawkins M: Diazoxide suppresses
endogenous glucose production in humans (Abstract). Diabetes 2007;56:1538
25. Sotsky MJ, Shilo S, Shamoon H: Regulation of counterregulatory hormone secretion in man
during exercise and hypoglycemia. J Clin Endocrinol Metab 1989;68:9-16
26. Novak M: COLORIMETRIC ULTRAMICRO METHOD FOR THE DETERMINATION
OF FREE FATTY ACIDS. Journal of lipid research 1965;6:431-433
27. Pinter JK, Hayashi JA, Watson JA: Enzymic assay of glycerol, dihydroxyacetone, and
glyceraldehyde. Archives of biochemistry and biophysics 1967;121:404-414
28. Williamson JR, Corkey BE: [65] Assays of intermediates of the citric acid cycle and related
compounds by fluorometric enzyme methods. In Methods Enzymol John ML, Ed., Academic
Press, 1969, p. 434-513
29. Hovorka R, Jayatillake H, Rogatsky E, Tomuta V, Hovorka T, Stein DT: Calculating glucose
fluxes during meal tolerance test: a new computational approach. American journal of
physiology Endocrinology and metabolism 2007;293:E610-619 30. Kehlenbrink S, Koppaka S, Martin M, Relwani R, Cui MH, Hwang JH, Li Y, Basu R,
Hawkins M, Kishore P: Elevated NEFA levels impair glucose effectiveness by increasing net
hepatic glycogenolysis. Diab tologia 2012;55:3021-3028
31. Steele R: Influences of glucose loading and of injected insulin on hepatic glucose output.
Ann N Y Acad Sci 1959;82:420-430
32. Torres TP, Catlin RL, Chan R, Fujimoto Y, Sasaki N, Printz RL, Newgard CB, Shiota M:
Restoration of hepatic glucokinase expression corrects hepatic glucose flux and normalizes
plasma glucose in zucker diabetic fatty rats. Diabetes 2009;58:78-86
33. Gong Z, Muzumdar RH: Pancreatic function, type 2 diabetes, and metabolism in aging.
International journal of endocrinology 2012;2012:320482
34. Fabiano de Bruno L, Karabatas L, Cresto JC, Aparicio M, Basabe JC: A comparative study
of two insulin secretion inhibitors: somatostatin and diazoxide. Horm Metab Res 1982;14:351-
356
35. Giddings AE: Diagnosis and management of insulinoma. Proc R Soc Med 1974;67:833-836
36. Schwetz TA, Ustione A, Piston DW: Neuropeptide Y and somatostatin inhibit insulin
secretion through different mechanisms. American journal of physiology Endocrinology and
metabolism 2013;304:E211-221
37. Edgerton DS, Cherrington AD: Is brain insulin action relevant to the control of plasma
glucose in humans? Diabetes 2015;64:696-699
Page 19 of 34 Diabetes
Page 20
20
38. Ott V, Lehnert H, Staub J, Wonne K, Born J, Hallschmid M: Central nervous insulin
administration does not potentiate the acute glucoregulatory impact of concurrent mild
hyperinsulinemia. Diabetes 2015;64:760-765
39. Ramnanan CJ, Kraft G, Smith MS, Farmer B, Neal D, Williams PE, Lautz M, Farmer T,
Donahue EP, Cherrington AD, Edgerton DS: Interaction between the central and peripheral
effects of insulin in controlling hepatic glucose metabolism in the conscious dog. Diabetes
2013;62:74-84
40. Shyng S, Ferrigni T, Nichols CG: Regulation of KATP channel activity by diazoxide and
MgADP. Distinct functions of the two nucleotide binding folds of the sulfonylurea receptor. J
Gen Physiol 1997;110:643-654
41. Filippi BM, Yang CS, Tang C, Lam TK: Insulin activates Erk1/2 signaling in the dorsal
vagal complex to inhibit glucose production. Cell metabolism 2012;16:500-510
42. Prodi E, Obici S: Minireview: the brain as a molecular target for diabetic therapy.
Endocrinology 2006;147:2664-2669
43. Hawkins M, Gabriely I, Wozniak R, Reddy K, Rossetti L, Shamoon H: Glycemic control
determines hepatic and peripheral glucose effectiveness in type 2 diabetic subjects. Diabetes
2002;51:2179-2189
44. Gancheva S, Koliaki C, Bierwagen A, Nowotny P, Heni M, Fritsche A, Haring HU,
Szendroedi J, Roden M: Effects of intranasal insulin on hepatic fat accumulation and energy
metabolism in humans. Diabetes 2015;9
45. Koller WC, Rueda MG: Mechanism of action of dopaminergic agents in Parkinson's disease.
Neurology 1998;50:S11-14; discussion S44-18
46. Bruning JC, Gautam D, Burks DJ, Gillette J, Schubert M, Orban PC, Klein R, Krone W,
Muller-Wieland D, Kahn CR: Role of brain insulin receptor in control of body weight and
reproduction. Science (New York, NY) 2000;289:2122-2125
47. Campayo A, de Jonge P, Roy JF, Saz P, de la Camara C, Quintanilla MA, Marcos G,
Santabarbara J, Lobo A: Depressive disorder and incident diabetes mellitus: the effect of
characteristics of depression. The American journal of psychiatry 2010;167:580-588
48. de la Monte SM: Brain insulin resistance and deficiency as therapeutic targets in Alzheimer's
disease. Current Alzheimer research 2012;9:35-66
49. McIntyre RS, Soczynska JK, Konarski JZ, Woldeyohannes HO, Law CW, Miranda A,
Fulgosi D, Kennedy SH: Should Depressive Syndromes Be Reclassified as "Metabolic
Syndrome Type II"? Annals of clinical psychiatry : official journal of the American Academy of
Clinical Psychiatrists 2007;19:257-264
50. Gribble FM: Metabolism: a higher power for insulin. Nature 2005;434:965-966
Page 20 of 34Diabetes
Page 21
TABLE 1: Subject characteristics (N=15)
DIABETIC
SUBJECTS
(N=8)
NON-DIABETIC
SUBJECTS
(N=7)
Continuous Variables Mean (SE) Mean (SE) P-value
Age, years 49.75 (1.39) 47.14 (2.57) 0.37
BMI, kg/m2 31.04 (0.54) 30.28 (0.98) 0.49
Weight, kg 95.64 (3.40) 97.20 (3.47) 0.75
HbA1c, % 9.15 (0.44) 5.26 (0.14) <0.0001
HbA1c, mmol/mol 76.62 (4.81) 34.14 (1.58) <0.0001
Fasting plasma glucose,
mg/dL
Fasting insulin, uU/mL
Fasting C-peptide, ng/mL
199.57 (17.74)
42.61 (12.30)
0.31 (0.10)
95.6 (7.10)
12.54 (2.33)
1.41 (0.54)
<0.001
0.04
0.04
Baseline Systolic Blood
Pressure, mmHg
138.9 (6.47) 139.0 (7.90) 0.99
Baseline Diastolic Blood
Pressure, mmHg
83.63 (4.77) 81.71 (3.74) 0.76
Baseline Heart Rate, bpm 66.63 (3.71) 73.00 (3.51) 0.24
Categorical Variables N(%) N(%)
Race
Black
Hispanic
3 (37.5)
4 (50.0)
3 (42.9)
1 (14.3)
Page 21 of 34 Diabetes
Page 22
White
Other
0 (0)
1 (12.5)
2 (28.6)
1 (14.3)
Sex
Male
Female
8 (100.0)
0 (0)
7 (100.0)
0 (0)
Page 22 of 34Diabetes
Page 23
TABLE 2: Plasma hormone and substrate levels in diabetic subjects from t=180-240 min
during the clamp studies (N=8).
DIAZOXIDE PLACEBO
Mean (SE) Mean (SE) P-value
Insulin, µU/ml 35.0 (5.6) 41.1 (8.4) 0.26
Glucagon, pg/ml 61.2 (5.0) 73.6 (6.4) 0.10
Lactate, mmol/L 0.8 (0.1) 0.8 (0.1) 0.73
Glycerol, µmol/L 32.2 (4.5) 28.8 (4.8) 0.63
Free Fatty Acid, µmol/L 385.8 (64.7) 329.7 (70.1) 0.58
Cortisol, µg/dl 11.1 (1.9) 7.2 (1.1) 0.12
C-peptide, nmol/L 0.07 (0.01) 0.05 (0.01) 0.07
Page 23 of 34 Diabetes
Page 24
TABLE 3: Plasma hormone and substrate levels in non-diabetic controls from t=180-240
min during the clamp studies (N=7).
DIAZOXIDE PLACEBO
Mean (SE) Mean (SE) P-value
Insulin, µU/ml 21.0 (3.3) 17.4 (2.5) 0.14
Glucagon, pg/ml 76.8 (8.6) 77.3 (6.3) 0.90
Lactate, mmol/L 0.5 (0.06) 0.5 (0.04) 0.74
Glycerol, µmol/L 19.8 (3.6) 18.6 (5.0) 0.82
Free Fatty Acid, µmol/L 134.2 (29.7) 163.2 (41.4) 0.26
Cortisol, µg/dl 9.3 (0.7) 10.1 (1.5) 0.60
C-peptide, nmol/L 0.08 (0.02) 0.08 (0.01) 0.96
Page 24 of 34Diabetes
Page 25
Figure 1 Page 25 of 34 Diabetes
Page 26
Page 26 of 34Diabetes
Page 27
Figure 2 Page 27 of 34 Diabetes
Page 28
Figure 3
Page 28 of 34Diabetes
Page 29
Figure 4 Page 29 of 34 Diabetes
Page 30
Figure 5
A
Page 30 of 34Diabetes
Page 31
Page 31 of 34 Diabetes
Page 32
Figure 1: (A) Euglycemic pancreatic clamp protocol scheme. (B) Plasma glucose levels
for each study group throughout the clamp studies. (C) Average insulin infusion rates for
each study group throughout the clamp studies.
Figure 2: (A) The average rate of EGP during the final hour of clamp studies was
significantly suppressed with diazoxide administration relative to placebo administration
in non-diabetic controls (*p=0.002) but not in diabetic subjects. (B) The percent
suppression of EGP by diazoxide was significantly impaired in diabetic subjects relative
to non-diabetic controls (*p=0.01).
Figure 3: Time course of EGP during the clamp studies in (A) diabetic subjects and in
(B) non-diabetic controls (*p<0.05).
Figure 4: (A) The average rate of glucose disappearance during the final hour of clamp
studies did not significantly differ between placebo and diazoxide studies in either
diabetic subjects or non-diabetic controls. (B) The average glucose infusion rate during
the final hour of clamp studies did not significantly differ between placebo and diazoxide
studies in either diabetic subjects or non-diabetic controls.
Figure 5: (A) ZDF rat euglycemic pancreatic clamp protocol scheme. (B) The average
rate of EGP during the final hour (t=180-240 min) of the study. EGP was not
significantly suppressed in ZDF rats after diazoxide administration relative to saline
control. (C) Hepatic PEPCK and G6Pase gene expression levels in diazoxide-treated and
saline-treated ZDF rats.
Page 32 of 34Diabetes
Page 33
Supplementary Figure 1
Page 33 of 34 Diabetes
Page 34
Supplementary Figure Legend:
Supplementary Figure 1: (A) Overnight capillary blood glucose levels for diabetic subjects prior
to onset of the clamp studies. (B) Overnight insulin infusion rates for diabetic subjects prior to
onset of the clamp studies.
Page 34 of 34Diabetes


![11C]-Labeled Metformin Distribution - Diabetesdiabetes.diabetesjournals.org/content/diabetes/65/6/1724.full.pdf · Jonas B. Jensen,1,2 Elias I. Sundelin,1 Steen Jakobsen,2 Lars C.](https://static.documents.pub/doc/80x56/5a829be87f8b9ada388dfdad/11c-labeled-metformin-distribution-b-jensen12-elias-i-sundelin1-steen-jakobsen2.jpg)


