+ All Categories
Home > Documents > PAGER/SGML Cat. No. 12684I Per Diem M&IE) Per Diem Amount Under

PAGER/SGML Cat. No. 12684I Per Diem M&IE) Per Diem Amount Under

Date post: 09-Feb-2022
Category:
Upload: others
View: 2 times
Download: 0 times
Share this document with a friend
44
Department of the Treasury Contents Internal Revenue Service Introduction .............................. 1 How To Use Per Diem Rate Tables ............ 2 Publication 1542 The Two Substantiation Methods .............. 2 (Rev. October 2008) Transition Rules ........................... 2 Cat. No. 12684I Per Diem Rate Tables ....................... 4 Table 1. Localities Eligible for $237 ($58 M&IE) Per Diem Amount Under the Per Diem High-Low Substantiation Method (Effective October 1, 2007 – September 30, 2008) .................. 4 Rates Table 2. Localities Eligible for $256 ($58 M&IE) Per Diem Amount Under the High-Low Substantiation Method (For Travel Within the (Effective October 1, 2008) .............. 6 Table 3. Maximum Federal Per Diem Continental United Rates (Effective October 1, 2007 – September 30, 2008) .................. 8 States) Table 4. Maximum Federal Per Diem Rates (Effective October 1, 2008 – September 30, 2009) .................. 25 How To Get Tax Help ....................... 42 Introduction This publication is for employers who pay a per diem allowance to employees for business travel away from home within the continental United States (CONUS) (the 48 contiguous states), on or after October 1, 2007, and before January 1, 2010. It gives the maximum per diem rate you can use without treating part of the per diem allowance as wages for tax purposes. For a detailed dis- cussion on the tax treatment of a per diem allowance, see chapter 11 of Publication 535, Business Expenses, or Revenue Procedure 2008-59, 2008-41 I.R.B. You can find the revenue procedure in the weekly Internal Revenue Bulletin (IRB) on the Internet at www.irs.gov/irb. Per diem rates on the Internet. You will find links to per diem rates at www.gsa.gov. Click on “Per Diem Rates” for links to: CONUS per diem rates, Per diem rates for areas outside the continental United States (OCONUS), such as Alaska, Hawaii, Puerto Rico, and U.S. possessions, and Foreign per diem rates. Publication 1542 revisions. Publication 1542 is only available on the Internet at www.irs.gov. Print copies can no longer be ordered. During the year, as changes to the federal per diem Get forms and other information rates (updates) are announced by the General Services Administration (GSA), we will incorporate the changes into faster and easier by: Publication 1542. A “What’s Hot” article on the IRS website Internet www.irs.gov will alert you to which locations have updated rates. You will find the new rates in Table 4 of the revised publication. Oct 16, 2008
Transcript

Userid: CXBOHA00 DTD tipx Leadpct: 0% Pt. size: 10 ❏ Draft ❏ Ok to PrintPAGER/SGML Fileid: D:\Users\jx3db\Documents\Pub 1542\P1542-10-2008.xml (Init. & date)

Page 1 of 44 of Publication 1542 14:26 - 16-OCT-2008

The type and rule above prints on all proofs including departmental reproduction proofs. MUST be removed before printing.

Department of the Treasury ContentsInternal Revenue Service

Introduction . . . . . . . . . . . . . . . . . . . . . . . . . . . . . . 1

How To Use Per Diem Rate Tables . . . . . . . . . . . . 2Publication 1542 The Two Substantiation Methods . . . . . . . . . . . . . . 2(Rev. October 2008) Transition Rules . . . . . . . . . . . . . . . . . . . . . . . . . . . 2Cat. No. 12684I Per Diem Rate Tables . . . . . . . . . . . . . . . . . . . . . . . 4

Table 1. Localities Eligible for $237 ($58M&IE) Per Diem Amount Under thePer Diem High-Low Substantiation Method(Effective October 1, 2007 –September 30, 2008) . . . . . . . . . . . . . . . . . . 4Rates Table 2. Localities Eligible for $256 ($58M&IE) Per Diem Amount Under theHigh-Low Substantiation Method(For Travel Within the (Effective October 1, 2008) . . . . . . . . . . . . . . 6

Table 3. Maximum Federal Per DiemContinental UnitedRates (Effective October 1, 2007 –September 30, 2008) . . . . . . . . . . . . . . . . . . 8States)

Table 4. Maximum Federal Per DiemRates (Effective October 1, 2008 –September 30, 2009) . . . . . . . . . . . . . . . . . . 25

How To Get Tax Help . . . . . . . . . . . . . . . . . . . . . . . 42

IntroductionThis publication is for employers who pay a per diemallowance to employees for business travel away fromhome within the continental United States (CONUS) (the48 contiguous states), on or after October 1, 2007, andbefore January 1, 2010. It gives the maximum per diemrate you can use without treating part of the per diemallowance as wages for tax purposes. For a detailed dis-cussion on the tax treatment of a per diem allowance, seechapter 11 of Publication 535, Business Expenses, orRevenue Procedure 2008-59, 2008-41 I.R.B. You can findthe revenue procedure in the weekly Internal RevenueBulletin (IRB) on the Internet at www.irs.gov/irb.

Per diem rates on the Internet. You will find links to perdiem rates at www.gsa.gov. Click on “Per Diem Rates” forlinks to:

• CONUS per diem rates,

• Per diem rates for areas outside the continentalUnited States (OCONUS), such as Alaska, Hawaii,Puerto Rico, and U.S. possessions, and

• Foreign per diem rates.

Publication 1542 revisions. Publication 1542 is onlyavailable on the Internet at www.irs.gov. Print copies canno longer be ordered.

During the year, as changes to the federal per diemGet forms and other information rates (updates) are announced by the General Services

Administration (GSA), we will incorporate the changes intofaster and easier by:Publication 1542. A “What’s Hot” article on the IRS websiteInternet www.irs.gov will alert you to which locations have updated rates. Youwill find the new rates in Table 4 of the revised publication.

Oct 16, 2008

Page 2 of 44 of Publication 1542 14:26 - 16-OCT-2008

The type and rule above prints on all proofs including departmental reproduction proofs. MUST be removed before printing.

To reach the “What’s Hot” articles, go to www.irs.gov/ The Two Substantiation Methodsformspubs; click on What’s Hot in forms and publications;then click on the link provided under Changes to Our The tables in this publication reflect the high-low substanti-Current Tax Products. ation method and the regular federal per diem rate method.

We will also incorporate mid-year changes to theHigh-low method. The first two tables in this publicationhigh-low rates into Publication 1542. You will be alerted tolist the localities that are treated under the high-low sub-these changes by a “What’s Hot” article on the IRS web-stantiation method as high-cost localities for all or part ofsite, and find the changes in Table 2 of the revised publica-the year. Table 1 lists the localities that are eligible for $237tion.($58 meals and incidental expenses (M&IE)) per diem,

The annual changes, both federal per diem and effective October 1, 2007. For travel on or after October 1,high-low rates, will be incorporated into the publication as 2007, all other localities within CONUS are eligible forsoon as possible after being announced by GSA and the $152 ($45 M&IE) per diem under the high-low method.IRS. The annual issue of the publication should be avail- Table 2 lists the localities that are eligible for $256 ($58able each year in mid- to late-October. M&IE) per diem, effective October 1, 2008. For travel on or

after October 1, 2008, the per diem for all other localitiesComments and suggestions. We welcome your com- increases to $158 ($45 M&IE).ments about this publication and your suggestions for

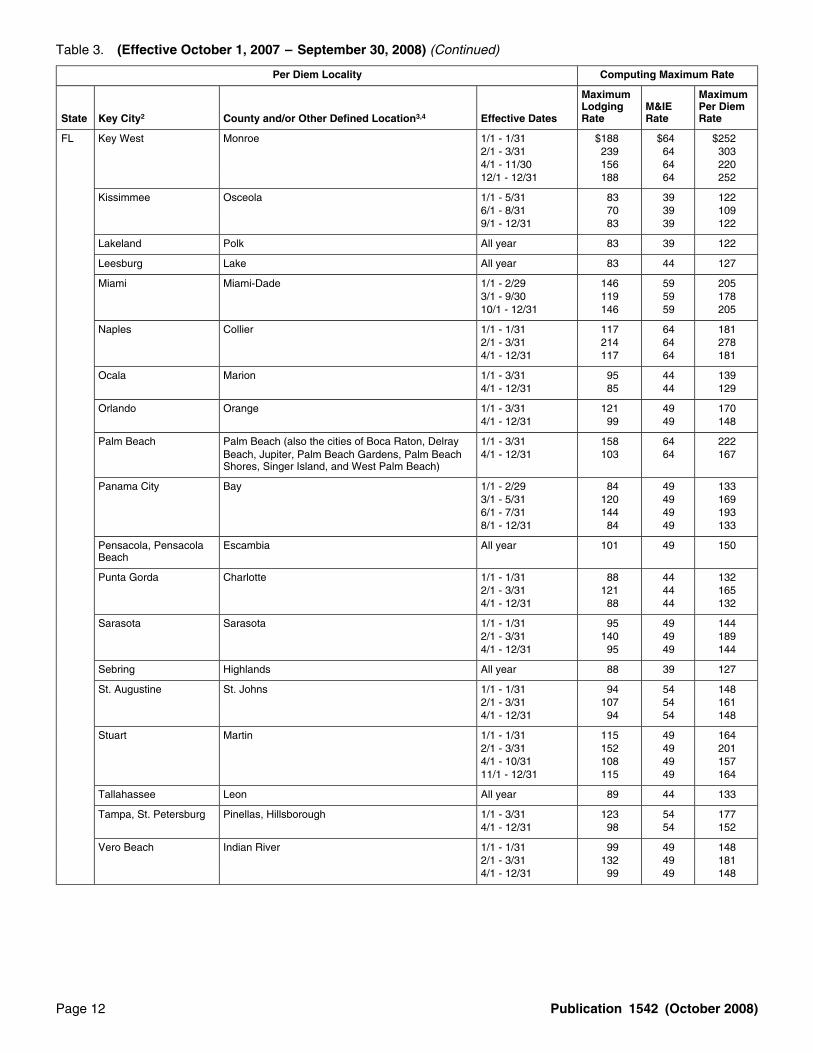
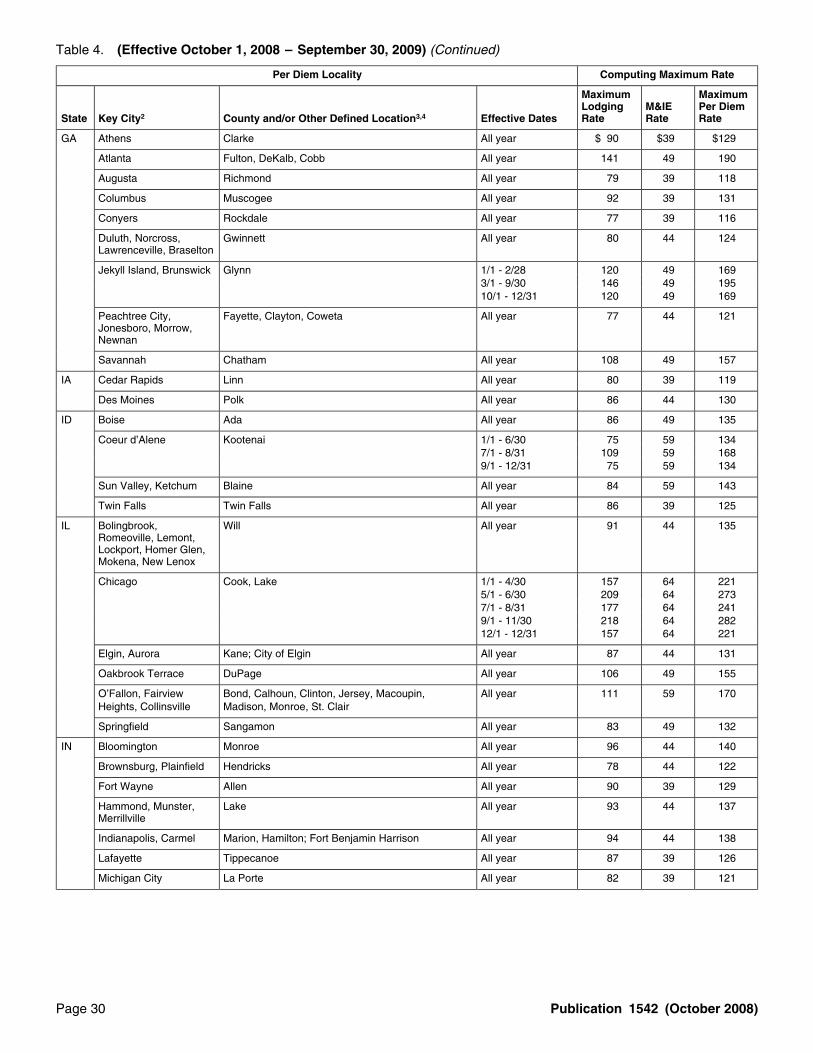
Regular federal per diem rate method. Tables 3 and 4future editions.give the regular federal per diem rates published by theYou can write to us at the following address:General Services Administration (GSA). Both tables in-clude the separate rate for meals and incidental expenses

Internal Revenue Service (M&IE) for each locality. The rates listed in Table 3 areIndividual Forms and Publications Branch effective October 1, 2007; those in Table 4 are effectiveSE:W:CAR:MP:T:I October 1, 2008. The standard rate for all locations within1111 Constitution Ave. NW, IR-6526 CONUS not specifically listed in Table 3 is $109 ($70 forWashington, DC 20224 lodging and $39 for M&IE). For Table 4, this rate is $109

($70 for lodging and $39 for M&IE).

We respond to many letters by telephone. Therefore, itTransition Ruleswould be helpful if you would include your daytime phone

number, including the area code, in your correspondence.The transition period covers the last 3 months of theYou can email us at *[email protected]. (The asteriskcalendar year, from the time that new rates are effectivemust be included in the address.) Please put “Publications(generally October 1) through December 31. During thisComment” on the subject line. Although we cannot re-period, you generally may change to the new rates or finish

spond individually to each email, we do appreciate your out the year with the rates you had been using.feedback and will consider your comments as we reviseour tax products. High-low method. If you use the high-low substantiation

method for an employee, when new rates become effec-Ordering forms and publications. Visit www.irs.gov/tive (generally October 1) you can either continue with theformspubs to download forms and publications, callrates you used for the first part of the year or change to the1-800-829-3676, or write to the address below and receivenew rates. However, you must continue using the high-lowa response within 10 days after your request is received.method for that employee for the rest of the calendar year(through December 31). Also, you must use the same

Internal Revenue Service rates for all employees reimbursed under the high-low1201 N. Mitsubishi Motorway method during that calendar year.

For example, Employee A travels extensively duringBloomington, IL 61705-6613March and April of 2009, and you determine A’s travelallowance (reimbursement) using the high-low methodTax questions. If you have a tax question, check the (Table 2). Employee A does not travel again until Novem-

information avai lable on www.irs.gov or cal l ber 2009. For A’s November trip and any others during the1-800-829-1040. We cannot answer tax questions sent to remainder of 2009, you may continue using the same seteither of the above addresses. of rates (Table 2) or change to the new rates that generally

will be effective in October. Assume that two of your otheremployees, B and C, are also reimbursed under thehigh-low method—your choice of rates must also apply toHow To Use Per Diem them.

Rate Tables For Employee A’s travel on or after January 1, 2010, youmust use the rates in effect for 2010, but may either

This section contains information about the per diem rate continue with the high-low method or choose the regularsubstantiation methods available and the choice of rates federal per diem rate method. The choice of method staysyou must make for the last 3 months of the year. in effect for the entire 2010 calendar year.

Page 2 Publication 1542 (October 2008)

Page 3 of 44 of Publication 1542 14:26 - 16-OCT-2008

The type and rule above prints on all proofs including departmental reproduction proofs. MUST be removed before printing.

The new rates and localities for the high-low method are using Table 4) and December 2009, while Employee Q’sincluded each year in a revenue procedure that is gener- only other travel occurs in October 2009. When determin-ally published in mid- to late-September. You can find the ing Q’s travel allowance for the October travel, you mustrevenue procedure in the weekly Internal Revenue Bulletin decide whether to continue with the old (Table 4) rates, or(IRB) on the Internet at www.irs.gov/irb. adopt the new ones effective October 1, 2009. Your choice

of rates will also apply to Employee P’s December travel.Federal per diem rate method. New CONUS per diemBoth employees must continue being reimbursed underrates become effective on October 1 of each year, andthe per diem rate method for travel through December 31,remain in effect through September 30 of the following2009. You can choose a new method for either or bothyear. Employees being reimbursed under the per diem rateemployees; this choice will become effective on January 1,method during the first 9 months of a year (January2010.1–September 30) must continue under the same method

The new federal CONUS per diem rates are publishedthrough the end of that calendar year (December 31).each year, generally early in September, on the Internet atHowever, for travel by these employees from October 1www.gsa.gov.through December 31, you can choose to continue using

the same per diem rates or use the new rates. Your choice Per diem rates for localities listed in Table 4 mayapplies to all employees reimbursed under the per diem change at any time during the rest of 2008 orrate method during that calendar year. Just as for the 2009. To be sure you have the most current rate,CAUTION

!high-low method, you must continue using the same check the IRS website (www.irs.gov) for an updated Publi-method for an employee for the entire calendar year. cation 1542, the other Internet website listed earlier under

For example, Employees P and Q attend an industry Per diem rates on the Internet, or call the IRS atconference in February 2009 and you reimburse their 1-800-829-1040.expenses using the per diem rate method (Table 4). Em-ployee P attends other conferences in July (reimbursed

Publication 1542 (October 2008) Page 3

Page 4 of 44 of Publication 1542 14:26 - 16-OCT-2008

The type and rule above prints on all proofs including departmental reproduction proofs. MUST be removed before printing.

Per Diem Rate Tables

Table 1. Localities Eligible for $237 ($58 M&IE) Per Diem Amount Under the High-Low Substantiation Method(Effective October 1, 2007 – September 30, 2008)1,2

Note: The standard (“low”) rate of $152 ($107 for lodging and $45 for M&IE) applies to all locations within the continental United States(CONUS) not specifically listed below or encompassed by the boundary definition of a listed point.

Per Diem Locality Effective Date of

State Key City County and/or Other Defined Location $237 Rate

AZ Phoenix, Scottsdale Maricopa 1/1 - 3/31

Sedona City limits of Sedona 3/1 - 4/30

CA Napa Napa All year

Palm Springs Riverside 1/1 - 4/30

San Diego San Diego All year

San Francisco San Francisco All year

Santa Barbara Santa Barbara All year

Santa Monica City limits of Santa Monica All year

South Lake Tahoe El Dorado 1/1 - 3/3112/1 - 12/31

Yosemite National Park Mariposa All year

CO Aspen Pitkin 1/1 - 4/3012/1 - 12/31

Crested Butte, Gunnison Gunnison 1/1 - 3/3112/1 - 12/31

Silverthorne, Breckenridge Summit 1/1 - 3/3112/1 - 12/31

Steamboat Springs Routt 1/1 - 2/2912/1 - 12/31

Telluride San Miguel 1/1 - 3/3110/1 - 12/31

Vail Eagle All year

DC Washington, DC (also the cities of All yearAlexandria, Fairfax, and Falls Church, andthe counties of Arlington and Fairfax, inVirginia; and the counties of Montgomeryand Prince George’s in Maryland)

FL Fort Lauderdale Broward 1/1 - 4/3010/1 - 12/31

Fort Walton Beach, DeFuniak Springs Okaloosa, Walton 6/1 - 7/31

Key West Monroe All year

Miami Miami-Dade 1/1 - 2/2910/1 - 12/31

Naples Collier 2/1 - 3/31

Palm Beach Palm Beach (also the cities of Boca Raton, Delray Beach, 1/1 - 3/31Jupiter, Palm Beach Gardens, Palm Beach Shores, SingerIsland, and West Palm Beach)

Stuart Martin 2/1 - 3/31

IL Chicago Cook, Lake All year

MA Boston, Cambridge Suffolk; City of Cambridge All year

Martha’s Vineyard Dukes 7/1 - 8/31

Nantucket Nantucket All year

Page 4 Publication 1542 (October 2008)

Page 5 of 44 of Publication 1542 14:26 - 16-OCT-2008

The type and rule above prints on all proofs including departmental reproduction proofs. MUST be removed before printing.

Table 1. (Effective October 1, 2007 – September 30, 2008) (Continued)

Per Diem Locality Effective Date of

State Key City County and/or Other Defined Location $237 Rate

MD Counties of Montgomery and Prince All yearGeorge’s

Baltimore Baltimore City All year

Cambridge, St. Michaels Dorchester, Talbot 4/1 - 8/31

Ocean City Worcester 6/1 - 8/31

NH Conway Carroll 7/1 - 8/31

NV Incline Village, Crystal Bay, Reno, Sparks Washoe 6/1 - 8/31

NY Floral Park, Garden City, Glen Cove, Great Nassau All yearNeck, Roslyn

Manhattan Boroughs of Manhattan, Brooklyn, the Bronx, and Staten All yearIsland

Queens Queens All year

Saratoga Springs, Schenectady Saratoga, Schenectady 7/1 - 8/31

Tarrytown, White Plains, New Rochelle, Westchester All yearYonkers

PA Philadelphia Philadelphia All year

RI Jamestown, Middletown, Newport Newport 2/1 - 11/30

Providence Providence All year

UT Park City Summit 1/1 - 3/31

VA Cities of Alexandria, Falls Church, and All yearFairfax; counties of Arlington and Fairfax

Loudon County Loudon All year

Virginia Beach City of Virginia Beach 6/1 - 8/31

WA Seattle King All year

WI Lake Geneva Walworth 6/1 - 9/30

1 Transition rule. A payor who uses the high-low substantiation method high-cost localities published in the revenue procedure that supersedesin Table 1 for an employee during the first 9 months of calendar year 2008 Revenue Procedure 2007-63, as long as those rates and localities are usedmust continue to use the high-low substantiation method for the remainder consistently during this period for all employees reimbursed under this method.of calendar year 2008 for that employee. For travel on or after October 1, See Transition Rules under How To Use Per Diem Rate Tables for an2008, and before January 1, 2009, the payor may continue to use the rates example.and high-cost localities published in Table 1 or the updated rates and

2 Revenue Procedure 2007-63 in Internal Revenue Bulletin No. 2007-42.

Publication 1542 (October 2008) Page 5

Page 6 of 44 of Publication 1542 14:26 - 16-OCT-2008

The type and rule above prints on all proofs including departmental reproduction proofs. MUST be removed before printing.

Table 2. Localities Eligible for $256 ($58 M&IE) Per Diem Amount Under the High-Low Substantiation Method(Effective October 1, 2008)1,2

Note: The standard (“low”) rate of $158 ($113 for lodging and $45 for M&IE) applies to all locations within the continental United States(CONUS) not specifically listed below or encompassed by the boundary definition of a listed point.

Per Diem Locality Effective Date of

State Key City County and/or Other Defined Location $256 Rate

AZ Phoenix, Scottsdale Maricopa 1/1 - 4/30

Sedona City limits of Sedona 3/1 - 4/30

CA Napa Napa All year

San Diego San Diego 1/1 - 8/31

San Francisco San Francisco All year

Santa Barbara Santa Barbara All year

Santa Monica City limits of Santa Monica All year

South Lake Tahoe El Dorado 1/1 - 3/3112/1 - 12/31

CO Aspen Pitkin 1/1 - 4/3012/1 - 12/31

Crested Butte, Gunnison Gunnison 1/1 - 3/3112/1 - 12/31

Silverthorne, Breckenridge Summit 1/1 - 4/3012/1 - 12/31

Steamboat Springs Routt 1/1 - 3/3112/1 - 12/31

Telluride San Miguel 1/1 - 3/3110/1 - 12/31

Vail Eagle 1/1 - 7/3112/1 - 12/31

DC Washington, DC (also the cities of All yearAlexandria, Fairfax, and Falls Church, andthe counties of Arlington and Fairfax, inVirginia; and the counties of Montgomeryand Prince George’s in Maryland)

FL Fort Lauderdale Broward 1/1 - 4/3010/1 - 12/31

Fort Walton Beach, DeFuniak Springs Okaloosa, Walton 6/1 - 7/31

Key West Monroe All year

Miami Miami-Dade 1/1 - 2/2810/1 - 12/31

Naples Collier 2/1 - 3/31

Palm Beach Palm Beach (also the cities of Boca Raton, Delray Beach, 1/1 - 4/30Jupiter, Palm Beach Gardens, Palm Beach Shores, Singer 12/1 - 12/31Island, and West Palm Beach)

IL Chicago Cook, Lake All year

MA Boston, Cambridge Suffolk; City of Cambridge All year

Martha’s Vineyard Dukes 6/1 - 8/31

Nantucket Nantucket 6/1 - 9/30

MD Counties of Montgomery and Prince All yearGeorge’s

Baltimore Baltimore City All year

Cambridge, St. Michaels Dorchester, Talbot 5/1 - 8/31

Ocean City Worcester 6/1 - 9/30

Page 6 Publication 1542 (October 2008)

Page 7 of 44 of Publication 1542 14:26 - 16-OCT-2008

The type and rule above prints on all proofs including departmental reproduction proofs. MUST be removed before printing.

Table 2. (Effective October 1, 2008) (Continued)

Per Diem Locality Effective Date of

State Key City County and/or Other Defined Location $256 Rate

NY Floral Park, Garden City, Glen Cove, Great Nassau All yearNeck, Roslyn

Manhattan (includes the boroughs of Bronx, Kings, New York, Queens, Richmond All yearManhattan, Brooklyn, the Bronx, Queens,and Staten Island)

Saratoga Springs, Schenectady Saratoga, Schenectady 7/1 - 8/31

Tarrytown, White Plains, New Rochelle, Westchester All yearYonkers

PA Philadelphia Philadelphia All year

RI Jamestown, Middletown, Newport Newport 6/1 - 9/30

UT Park City Summit 1/1 - 3/31

VA Cities of Alexandria, Falls Church, and All yearFairfax; counties of Arlington and Fairfax

WA Seattle King All year

WY Jackson, Pinedale Teton, Sublette 7/1 - 8/31

1 Transition rule. A payor who uses the high-low substantiation method high-cost localities published in the revenue procedure that supersedesin Table 2 for an employee during the first 9 months of calendar year 2009 Revenue Procedure 2008-59, as long as those rates and localities are usedmust continue to use the high-low substantiation method for the remainder consistently during this period for all employees reimbursed under this method.of calendar year 2009 for that employee. For travel on or after October 1, See Transition Rules under How To Use Per Diem Rate Tables for an2009, and before January 1, 2010, the payor may continue to use the rates example.and high-cost localities published in Table 2 or the updated rates and

2 Revenue Procedure 2008-59 in Internal Revenue Bulletin No. 2008-41.

Publication 1542 (October 2008) Page 7

Page 8 of 44 of Publication 1542 14:26 - 16-OCT-2008

The type and rule above prints on all proofs including departmental reproduction proofs. MUST be removed before printing.

Table 3. Maximum Federal Per Diem Rates (Effective October 1, 2007 – September 30, 2008)1

Note: The standard rate of $109 ($70 for lodging and $39 for M&IE) applies to all locations within the continental United States(CONUS) not specifically listed below or encompassed by the boundary definition of a listed point. However, the standard CONUS rateapplies to all locations within CONUS, including those defined below, for certain relocation allowances. (See parts 302-2, 302-4, and302-5 of 41 CFR.)

Per Diem Locality Computing Maximum Rate

Maximum Maximum Lodging M&IE Per Diem

State Key City2 County and/or Other Defined Location3,4 Effective Dates Rate Rate Rate

AL Birmingham Jefferson, Shelby All year $ 86 $44 $130

Gulf Shores Baldwin 1/1 - 2/29 100 39 1393/1 - 5/31 106 39 1456/1 - 7/31 125 39 1648/1 - 12/31 100 39 139

Huntsville Madison, Limestone All year 75 44 119

Mobile Mobile Before 3/17/08 70 39 109After 3/16/08 94 49 143

Montgomery Montgomery All year 75 39 114

AR Hot Springs Garland All year 93 49 142

Little Rock Pulaski All year 82 54 136

AZ Grand Canyon, Flagstaff Coconino (except city limits of Sedona), Yavapai 1/1 - 2/29 71 44 1153/1 - 10/31 87 44 13111/1 - 12/31 71 44 115

Kayenta Navajo All year 73 54 127

Phoenix, Scottsdale Maricopa 1/1 - 3/31 156 59 2154/1 - 5/31 122 59 1816/1 - 12/31 102 59 161

Sedona City limits of Sedona 1/1 - 2/29 119 64 1833/1 - 4/30 139 64 2035/1 - 12/31 119 64 183

Sierra Vista Cochise All year 71 39 110

Tucson Pima 1/1 - 1/31 102 49 1512/1 - 5/31 119 49 1686/1 - 8/31 75 49 1249/1 - 12/31 102 49 151

Yuma Yuma 1/1 - 3/31 84 39 1234/1 - 10/31 73 39 11211/1 - 12/31 84 39 123

CA Antioch, Brentwood, Contra Costa All year 109 49 158Concord, Lafayette,Martinez, Pleasant Hill,Richmond, San Ramon,Walnut Creek

Bakersfield, Delano Kern All year 75 44 119(Naval Weapons Centerand Ordnance TestStation, China Lake)

Barstow, Ontario, San Bernardino All year 92 59 151Victorville

Benicia, Dixon, Fairfield, Solano All year 90 44 134Vacaville, Vallejo,Hayward

Brawley, Calexico, El Imperial All year 76 39 115Centro, Imperial

Death Valley Inyo All year 82 49 131

Eureka, Arcata, Humboldt Before 3/17/08 70 39 109McKinleyville After 3/16/08 87 54 141

Page 8 Publication 1542 (October 2008)

Page 9 of 44 of Publication 1542 14:26 - 16-OCT-2008

The type and rule above prints on all proofs including departmental reproduction proofs. MUST be removed before printing.

Table 3. (Effective October 1, 2007 – September 30, 2008) (Continued)

Per Diem Locality Computing Maximum Rate

Maximum Maximum Lodging M&IE Per Diem

State Key City2 County and/or Other Defined Location3,4 Effective Dates Rate Rate Rate

CA Fresno Fresno All year $ 88 $54 $142

Los Angeles Los Angeles, Orange, Ventura; Edwards AFB All year 118 64 182

Mammoth Lakes Mono All year 111 54 165

Mill Valley, San Rafael, Marin All year 111 54 165Novato, Corte Madera,Sausalito, Tiburon,Larkspur

Modesto Stanislaus All year 84 49 133

Monterey Monterey Before 3/17/08 125 64 189After 3/16/08 133 64 197

Napa Napa All year 140 64 204

Oakhurst Madera 1/1 - 1/31 71 39 1102/1 - 8/31 78 39 1179/1 - 12/31 71 39 110

Oakland Alameda All year 99 59 158

Palm Springs Riverside 1/1 - 4/30 135 59 1945/1 - 8/31 95 59 1549/1 - 12/31 112 59 171

Point Arena, Gualala Mendocino All year 74 54 128

Redding Shasta All year 82 44 126

Sacramento Sacramento All year 111 59 170

San Diego San Diego 1/1 - 3/31 146 64 2104/1 - 12/31 139 64 203

San Francisco San Francisco 1/1 - 8/31 152 64 2169/1 - 11/30 168 64 23212/1 - 12/31 152 64 216

San Luis Obispo San Luis Obispo 1/1 - 6/30 106 54 1607/1 - 8/31 126 54 1809/1 - 12/31 106 54 160

San Mateo, Foster City, San Mateo All year 109 54 163Belmont

Santa Barbara Santa Barbara 1/1 - 6/30 141 59 2007/1 - 8/31 181 59 2409/1 - 12/31 141 59 200

Santa Cruz Santa Cruz 1/1 - 5/31 106 54 1606/1 - 8/31 134 54 1889/1 - 12/31 106 54 160

Santa Monica City limits of Santa Monica All year 192 64 256

Santa Rosa Sonoma All year 114 64 178

South Lake Tahoe El Dorado 1/1 - 3/31 149 54 2034/1 - 6/30 118 54 1727/1 - 11/30 132 54 18612/1 - 12/31 149 54 203

Stockton San Joaquin All year 78 44 122

Sunnyvale, Palo Alto, Santa Clara All year 119 59 178San Jose

Tahoe City Placer All year 101 59 160

Truckee Nevada 1/1 - 2/29 105 59 1643/1 - 11/30 86 59 14512/1 - 12/31 105 59 164

Visalia, Lemoore Tulare, Kings All year 78 49 127

Publication 1542 (October 2008) Page 9

Page 10 of 44 of Publication 1542 14:26 - 16-OCT-2008

The type and rule above prints on all proofs including departmental reproduction proofs. MUST be removed before printing.

Table 3. (Effective October 1, 2007 – September 30, 2008) (Continued)

Per Diem Locality Computing Maximum Rate

Maximum Maximum Lodging M&IE Per Diem

State Key City2 County and/or Other Defined Location3,4 Effective Dates Rate Rate Rate

CA West Sacramento Yolo All year $ 85 $44 $129

Yosemite National Park Mariposa 1/1 - 3/31 143 64 2074/1 - 8/31 134 64 1989/1 - 12/31 151 64 215

CO Aspen Pitkin 1/1 - 4/30 214 64 2785/1 - 11/30 104 64 16812/1 - 12/31 214 64 278

Boulder, Broomfield Boulder, Broomfield All year 98 54 152

Colorado Springs El Paso All year 83 44 127

Cortez Montezuma 1/1 - 5/31 75 39 1146/1 - 8/31 90 39 1299/1 - 12/31 75 39 114

Crested Butte, Gunnison Gunnison 1/1 - 3/31 237 49 2864/1 - 8/31 94 49 1439/1 - 11/30 76 49 12512/1 - 12/31 237 49 286

Denver, Aurora Denver, Adams, Arapahoe, Jefferson, and Douglas All year 140 49 189

Douglas County Douglas All year 90 54 144

Durango La Plata 1/1 - 4/30 86 49 1355/1 - 9/30 108 49 15710/1 - 12/31 86 49 135

Fort Collins, Loveland Larimer All year 85 44 129

Glenwood Springs, Garfield, Mesa All year 81 49 130Grand Junction

Montrose Montrose 1/1 - 4/30 70 39 1095/1 - 9/30 80 39 11910/1 - 12/31 70 39 109

Silverthorne, Summit 1/1 - 1/31 162 54 216Breckenridge 2/1 - 3/31 173 54 227

4/1 - 5/31 92 54 1466/1 - 11/30 101 54 15512/1 - 12/31 162 54 216

Steamboat Springs Routt 1/1 - 2/29 192 54 2463/1 - 11/30 119 54 17312/1 - 12/31 192 54 246

Telluride San Miguel 1/1 - 1/31 172 59 2312/1 - 3/31 234 59 2934/1 - 5/31 79 59 1386/1 - 9/30 128 59 18710/1 - 12/31 172 59 231

Vail Eagle 1/1 - 1/31 317 64 3812/1 - 3/31 252 64 3164/1 - 11/30 176 64 24012/1 - 12/31 317 64 381

CT Bridgeport, Danbury Fairfield All year 118 64 182

Cromwell, Old Saybrook Middlesex All year 83 44 127

Hartford Hartford All year 103 49 152

Lakeville, Salisbury Litchfield All year 89 64 153

New Haven New Haven All year 92 64 156

New London, Groton New London All year 98 64 162

Putnam, Danielson, Windham, Tolland All year 71 59 130Storrs, Mansfield

Page 10 Publication 1542 (October 2008)

Page 11 of 44 of Publication 1542 14:26 - 16-OCT-2008

The type and rule above prints on all proofs including departmental reproduction proofs. MUST be removed before printing.

Table 3. (Effective October 1, 2007 – September 30, 2008) (Continued)

Per Diem Locality Computing Maximum Rate

Maximum Maximum Lodging M&IE Per Diem

State Key City2 County and/or Other Defined Location3,4 Effective Dates Rate Rate Rate

DC Washington, DC (also 1/1 - 6/30 $201 $64 $265the cities of Alexandria, 7/1 - 8/31 154 64 218Fairfax, and Falls 9/1 - 12/31 201 64 265Church, and thecounties of Arlingtonand Fairfax, in Virginia;and the counties ofMontgomery and PrinceGeorge’s in Maryland)(see also Maryland andVirginia)

DE Dover Kent 1/1 - 5/31 81 44 1256/1 - 9/30 94 44 13810/1 - 12/31 81 44 125

Lewes Sussex 1/1 - 6/30 77 39 1167/1 - 8/31 111 39 1509/1 - 12/31 77 39 116

Wilmington New Castle All year 111 39 150

FL Altamonte Springs Seminole 1/1 - 3/31 96 39 1354/1 - 12/31 83 39 122

Bradenton Manatee 1/1 - 1/31 98 39 1372/1 - 3/31 137 39 1764/1 - 12/31 98 39 137

Cocoa Beach Brevard All year 105 44 149

Daytona Beach Volusia 1/1 - 1/31 87 39 1262/1 - 3/31 138 39 1774/1 - 5/31 93 39 1326/1 - 7/31 103 39 1428/1 - 12/31 87 39 126

Fort Lauderdale Broward 1/1 - 4/30 161 54 2155/1 - 9/30 107 54 16110/1 - 12/31 161 54 215

Fort Myers Lee 1/1 - 4/30 133 49 1825/1 - 12/31 84 49 133

Fort Pierce St. Lucie 1/1 - 1/31 101 49 1502/1 - 3/31 133 49 1824/1 - 12/31 101 49 150

Fort Walton Beach, Okaloosa, Walton 1/1 - 2/29 81 44 125DeFuniak Springs 3/1 - 5/31 132 44 176

6/1 - 7/31 169 44 2138/1 - 10/31 113 44 15711/1 - 12/31 81 44 125

Gainesville Alachua All year 88 44 132

Gulf Breeze Santa Rosa 1/1 - 2/29 97 39 1363/1 - 5/31 119 39 1586/1 - 7/31 147 39 1868/1 - 12/31 97 39 136

Jacksonville, Duval, Nassau; City of Jacksonville All year 84 49 133Jacksonville Beach,Mayport Naval Station,Fernandina Beach,Atlantic Beach

Publication 1542 (October 2008) Page 11

Page 12 of 44 of Publication 1542 14:26 - 16-OCT-2008

The type and rule above prints on all proofs including departmental reproduction proofs. MUST be removed before printing.

Table 3. (Effective October 1, 2007 – September 30, 2008) (Continued)

Per Diem Locality Computing Maximum Rate

Maximum Maximum Lodging M&IE Per Diem

State Key City2 County and/or Other Defined Location3,4 Effective Dates Rate Rate Rate

FL Key West Monroe 1/1 - 1/31 $188 $64 $2522/1 - 3/31 239 64 3034/1 - 11/30 156 64 22012/1 - 12/31 188 64 252

Kissimmee Osceola 1/1 - 5/31 83 39 1226/1 - 8/31 70 39 1099/1 - 12/31 83 39 122

Lakeland Polk All year 83 39 122

Leesburg Lake All year 83 44 127

Miami Miami-Dade 1/1 - 2/29 146 59 2053/1 - 9/30 119 59 17810/1 - 12/31 146 59 205

Naples Collier 1/1 - 1/31 117 64 1812/1 - 3/31 214 64 2784/1 - 12/31 117 64 181

Ocala Marion 1/1 - 3/31 95 44 1394/1 - 12/31 85 44 129

Orlando Orange 1/1 - 3/31 121 49 1704/1 - 12/31 99 49 148

Palm Beach Palm Beach (also the cities of Boca Raton, Delray 1/1 - 3/31 158 64 222Beach, Jupiter, Palm Beach Gardens, Palm Beach 4/1 - 12/31 103 64 167Shores, Singer Island, and West Palm Beach)

Panama City Bay 1/1 - 2/29 84 49 1333/1 - 5/31 120 49 1696/1 - 7/31 144 49 1938/1 - 12/31 84 49 133

Pensacola, Pensacola Escambia All year 101 49 150Beach

Punta Gorda Charlotte 1/1 - 1/31 88 44 1322/1 - 3/31 121 44 1654/1 - 12/31 88 44 132

Sarasota Sarasota 1/1 - 1/31 95 49 1442/1 - 3/31 140 49 1894/1 - 12/31 95 49 144

Sebring Highlands All year 88 39 127

St. Augustine St. Johns 1/1 - 1/31 94 54 1482/1 - 3/31 107 54 1614/1 - 12/31 94 54 148

Stuart Martin 1/1 - 1/31 115 49 1642/1 - 3/31 152 49 2014/1 - 10/31 108 49 15711/1 - 12/31 115 49 164

Tallahassee Leon All year 89 44 133

Tampa, St. Petersburg Pinellas, Hillsborough 1/1 - 3/31 123 54 1774/1 - 12/31 98 54 152

Vero Beach Indian River 1/1 - 1/31 99 49 1482/1 - 3/31 132 49 1814/1 - 12/31 99 49 148

Page 12 Publication 1542 (October 2008)

Page 13 of 44 of Publication 1542 14:26 - 16-OCT-2008

The type and rule above prints on all proofs including departmental reproduction proofs. MUST be removed before printing.

Table 3. (Effective October 1, 2007 – September 30, 2008) (Continued)

Per Diem Locality Computing Maximum Rate

Maximum Maximum Lodging M&IE Per Diem

State Key City2 County and/or Other Defined Location3,4 Effective Dates Rate Rate Rate

GA Athens Clarke All year $ 80 $39 $119

Atlanta Fulton, DeKalb, Cobb 1/1 - 3/31 139 49 1884/1 - 12/31 129 49 178

Augusta Richmond All year 80 39 119

Columbus Muscogee All year 84 39 123

Conyers Rockdale All year 75 39 114

Duluth, Norcross, Gwinnett All year 76 44 120Lawrenceville, Braselton

Jekyll Island, Brunswick Glynn All year 125 49 174

Peachtree City, Fayette, Clayton, Coweta All year 77 44 121Jonesboro, Morrow,Newnan

Savannah Chatham All year 104 49 153

IA Cedar Rapids Linn All year 75 39 114

Des Moines Polk All year 80 44 124

ID Boise Ada All year 85 49 134

Coeur d’Alene Kootenai 1/1 - 5/31 71 59 1306/1 - 8/31 105 59 1649/1 - 12/31 71 59 130

Sun Valley, Ketchum Blaine All year 79 59 138

Twin Falls Twin Falls All year 81 39 120

IL Bolingbrook, Will All year 80 44 124Romeoville, Lemont,Lockport, Homer Glen,Mokena, New Lenox

Chicago Cook, Lake 1/1 - 4/30 149 64 2135/1 - 6/30 188 64 2527/1 - 8/31 168 64 2329/1 - 11/30 205 64 26912/1 - 12/31 149 64 213

Elgin, Aurora Kane; City of Elgin All year 83 44 127

Oakbrook Terrace DuPage All year 104 49 153

O’Fallon, Fairview Bond, Calhoun, Clinton, Jersey, Macoupin, Before 3/17/08 70 39 109Heights, Collinsville Madison, Monroe, St. Clair After 3/16/08 111 59 170

Springfield Sangamon All year 80 49 129

IN Bloomington Monroe All year 88 44 132

Brownsburg, Plainfield Hendricks All year 75 44 119

Fort Wayne Allen All year 81 39 120

Hammond, Munster, Lake All year 85 44 129Merrillville

Indianapolis, Carmel Marion, Hamilton; Fort Benjamin Harrison All year 97 44 141

Lafayette Tippecanoe All year 81 39 120

Michigan City La Porte All year 78 39 117

Publication 1542 (October 2008) Page 13

Page 14 of 44 of Publication 1542 14:26 - 16-OCT-2008

The type and rule above prints on all proofs including departmental reproduction proofs. MUST be removed before printing.

Table 3. (Effective October 1, 2007 – September 30, 2008) (Continued)

Per Diem Locality Computing Maximum Rate

Maximum Maximum Lodging M&IE Per Diem

State Key City2 County and/or Other Defined Location3,4 Effective Dates Rate Rate Rate

IN South Bend St. Joseph All year $ 92 $44 $136

Valparaiso, Burlington Porter All year 79 49 128Beach

KS Kansas City, Overland Wyandotte, Johnson All year 103 44 147Park

Wichita Sedgwick All year 80 49 129

KY Boone County Boone All year 95 44 139

Kenton County Kenton All year 110 44 154

Lexington Fayette All year 88 49 137

Louisville Jefferson 1/1 - 5/31 97 49 1466/1 - 9/30 89 49 13810/1 - 12/31 97 49 146

LA Baton Rouge East Baton Rouge Parish All year 99 44 143

Covington, Slidell St. Tammany Parish All year 96 49 145

Lafayette Lafayette Consolidated Government All year 79 49 128

Lake Charles Calcasieu Parish All year 76 39 115

New Orleans Orleans, Jefferson, Plaquemines, and 1/1 - 6/30 131 59 190St. Bernard Parishes 7/1 - 9/30 99 59 158

10/1 - 12/31 131 59 190

MA Andover Essex All year 87 59 146

Boston, Cambridge Suffolk; City of Cambridge 1/1 - 8/31 186 64 2509/1 - 10/31 220 64 28411/1 - 12/31 186 64 250

Burlington, Woburn Middlesex All year 111 59 170

Falmouth City limits of Falmouth 1/1 - 6/30 78 49 1277/1 - 8/31 93 49 1429/1 - 12/31 78 49 127

Hyannis Barnstable 1/1 - 4/30 85 59 1445/1 - 6/30 103 59 1627/1 - 8/31 133 59 1929/1 - 12/31 85 59 144

Martha’s Vineyard Dukes 1/1 - 6/30 114 64 1787/1 - 8/31 197 64 2619/1 - 10/31 120 64 18411/1 - 12/31 114 64 178

Nantucket Nantucket 1/1 - 5/31 131 64 1956/1 - 9/30 255 64 31910/1 - 12/31 131 64 195

Northampton Hampshire All year 88 39 127

Pittsfield Berkshire All year 94 59 153

Page 14 Publication 1542 (October 2008)

Page 15 of 44 of Publication 1542 14:26 - 16-OCT-2008

The type and rule above prints on all proofs including departmental reproduction proofs. MUST be removed before printing.

Table 3. (Effective October 1, 2007 – September 30, 2008) (Continued)

Per Diem Locality Computing Maximum Rate

Maximum Maximum Lodging M&IE Per Diem

State Key City2 County and/or Other Defined Location3,4 Effective Dates Rate Rate Rate

MA Plymouth, Taunton, New Plymouth, Bristol All year $ 93 $54 $147Bedford

Quincy Norfolk All year 118 44 162

Springfield Hampden All year 93 44 137

Worcester Worcester All year 92 49 141

MD Counties of Montgomery 1/1 - 6/30 201 64 265and Prince George’s 7/1 - 8/31 154 64 218

9/1 - 12/31 201 64 265

Aberdeen, Bel Air, Harford All year 79 44 123Belcamp, Edgewood

Annapolis Anne Arundel All year 123 64 187

Baltimore Baltimore City All year 155 59 214

Baltimore County Baltimore All year 99 54 153

Cambridge, St. Michaels Dorchester, Talbot 1/1 - 3/31 115 54 1694/1 - 8/31 147 54 2019/1 - 12/31 115 54 169

Columbia Howard All year 114 49 163

Frederick Frederick All year 88 39 127

Hagerstown Washington All year 72 39 111

La Plata, Indian Head Charles All year 75 39 114

Lexington Park, St. Mary’s, Calvert All year 88 39 127Leonardtown, Lusby

Ocean City Worcester 1/1 - 5/31 85 64 1496/1 - 8/31 180 64 2449/1 - 12/31 85 64 149

ME Bar Harbor Hancock 1/1 - 6/30 83 49 1327/1 - 9/30 133 49 18210/1 - 12/31 83 49 132

Kennebunk, Kittery, York 1/1 - 3/31 70 54 124Sanford 4/1 - 6/30 77 54 131

7/1 - 8/31 115 54 1699/1 - 10/31 85 54 13911/1 - 12/31 70 54 124

Portland Cumberland 1/1 - 6/30 85 44 1297/1 - 9/30 107 44 15110/1 - 12/31 85 44 129

Rockport Knox 1/1 - 6/30 70 49 1197/1 - 8/31 76 49 1259/1 - 12/31 70 49 119

MI Ann Arbor Washtenaw All year 89 44 133

Benton Harbor, St. Berrien All year 72 49 121Joseph, Stevensville

Charlevoix Charlevoix 1/1 - 5/31 73 49 1226/1 - 8/31 85 49 1349/30 - 12/31 73 49 122

Detroit Wayne All year 105 49 154

East Lansing, Lansing Ingham, Eaton All year 78 39 117

Publication 1542 (October 2008) Page 15

Page 16 of 44 of Publication 1542 14:26 - 16-OCT-2008

The type and rule above prints on all proofs including departmental reproduction proofs. MUST be removed before printing.

Table 3. (Effective October 1, 2007 – September 30, 2008) (Continued)

Per Diem Locality Computing Maximum Rate

Maximum Maximum Lodging M&IE Per Diem

State Key City2 County and/or Other Defined Location3,4 Effective Dates Rate Rate Rate

MI Flint Genesee All year $ 79 $39 $118

Grand Rapids Kent All year 80 39 119

Holland Ottawa All year 74 44 118

Kalamazoo, Battle Kalamazoo, Calhoun All year 81 44 125Creek

Mackinac Island Mackinac 1/1 - 6/30 70 49 1197/1 - 8/31 84 49 1339/1 - 12/31 70 49 119

Midland Midland All year 90 39 129

Mount Pleasant Isabella All year 71 44 115

Muskegon Muskegon 1/1 - 5/31 70 39 1096/1 - 8/31 81 39 1209/1 - 12/31 70 39 109

Ontonagon, Baraga, Ontonagon, Baraga, Houghton All year 72 39 111Houghton

Petoskey Emmet 1/1 - 6/30 71 54 1257/1 - 8/31 91 54 1459/1 - 12/31 71 54 125

Pontiac, Auburn Hills Oakland All year 100 44 144

South Haven Van Buren 1/1 - 5/31 70 39 1096/1 - 8/31 82 39 1219/1 - 12/31 70 39 109

Traverse City, Leland Grand Traverse, Leelanau 1/1 - 6/30 70 44 1147/1 - 8/31 109 44 1539/1 - 12/31 70 44 114

Warren Macomb All year 77 39 116

MN Coon Rapids, Ramsey Anoka All year 75 44 119

Duluth St. Louis 1/1 - 5/31 74 49 1236/1 - 9/30 94 49 14310/1 - 12/31 74 49 123

Eagan, Burnsville, Dakota All year 87 49 136Mendota Heights,Lakeville, Inver GroveHeights

Minneapolis, St. Paul Hennepin, Ramsey All year 121 64 185

Rochester Olmsted All year 93 44 137

MO Columbia Boone All Year 72 39 111

Kansas City Jackson, Clay, Cass, Platte All year 103 49 152

Springfield Greene All year 73 39 112

St. Louis St. Louis, St. Charles; St. Louis City Before 3/17/08 106 59 165

St. Louis St. Louis, St. Charles, Crawford, Franklin, Jefferson, After 3/16/08 111 59 170Lincoln, Warren, Washington; St. Louis City

MS Grenada Grenada All year 72 44 116

Gulfport, Biloxi Harrison All year 86 44 130

Page 16 Publication 1542 (October 2008)

Page 17 of 44 of Publication 1542 14:26 - 16-OCT-2008

The type and rule above prints on all proofs including departmental reproduction proofs. MUST be removed before printing.

Table 3. (Effective October 1, 2007 – September 30, 2008) (Continued)

Per Diem Locality Computing Maximum Rate

Maximum Maximum Lodging M&IE Per Diem

State Key City2 County and/or Other Defined Location3,4 Effective Dates Rate Rate Rate

MS Hattiesburg Forrest, Lamar All year $ 75 $49 $124

Robinsonville Tunica All year 75 44 119

Southaven Desoto All year 86 44 130

Starkville Oktibbeha All year 73 44 117

MT Big Sky, West Gallatin 1/1 - 6/30 76 49 125Yellowstone 7/1 - 8/31 101 49 150

9/1 - 12/31 76 49 125

Butte Silver Bow All year 72 44 116

Helena Lewis and Clark All year 73 44 117

Missoula, Polson, Missoula, Lake, Flathead 1/1 - 5/31 78 44 122Kalispell 6/1 - 8/31 96 44 140

9/1 - 12/31 78 44 122

NC Asheville Buncombe 1/1 - 6/30 76 49 1257/1 - 10/31 89 49 13811/1 - 12/31 76 49 125

Atlantic Beach, Carteret 1/1 - 5/31 70 49 119Morehead City 6/1 - 8/31 106 49 155

9/1 - 12/31 70 49 119

Chapel Hill Orange All year 89 49 138

Charlotte Mecklenburg All year 88 49 137

Durham Durham All year 97 49 146

Greensboro Guilford 1/1 - 4/30 100 44 1445/1 - 9/30 87 44 13110/1 - 12/31 100 44 144

Greenville Pitt All year 74 39 113

Kill Devil Dare 1/1 - 3/31 70 54 1244/1 - 9/30 102 54 15610/1 - 12/31 70 54 124

New Bern, Havelock Craven All year 82 44 126

Raleigh Wake All year 88 54 142

Wilmington New Hanover All year 82 49 131

Winston-Salem Forsyth All year 87 44 131

ND The standard CONUS rate of $109 ($70 for lodging and $39 for M&IE) applies to all per diem localities in North Dakota.

NE Omaha Douglas All year 93 49 142

NH Concord Merrimack 1/1 - 4/30 76 44 1205/1 - 10/31 90 44 13411/1 - 12/31 76 44 120

Conway Carroll 1/1 - 2/29 117 49 1663/1 - 6/30 99 49 1487/1 - 8/31 147 49 1969/1 - 12/31 117 49 166

Durham Strafford All year 87 44 131

Laconia Belknap 1/1 - 5/31 79 39 1186/1 - 10/31 95 39 13411/1 - 12/31 79 39 118

Publication 1542 (October 2008) Page 17

Page 18 of 44 of Publication 1542 14:26 - 16-OCT-2008

The type and rule above prints on all proofs including departmental reproduction proofs. MUST be removed before printing.

Table 3. (Effective October 1, 2007 – September 30, 2008) (Continued)

Per Diem Locality Computing Maximum Rate

Maximum Maximum Lodging M&IE Per Diem

State Key City2 County and/or Other Defined Location3,4 Effective Dates Rate Rate Rate

NH Lebanon, Lincoln, West Grafton, Sullivan All year $ 92 $49 $141Lebanon, Franconia,Hanover, Holderness,Sunapee, WatervilleValley, NorthWoodstock, Plymouth

Manchester Hillsborough All year 92 44 136

Portsmouth Rockingham 1/1 - 6/30 96 44 1407/1 - 9/30 125 44 16910/1 - 12/31 96 44 140

NJ Atlantic City, Cape May, Atlantic, Cape May 1/1 - 4/30 96 54 150Ocean City 5/1 - 10/31 117 54 171

11/1 - 12/31 96 54 150

Belle Mead Somerset All year 126 44 170

Cherry Hill, Moorestown Camden, Burlington All year 91 44 135

Eatontown, Freehold Monmouth All year 119 49 168

Edison, Piscataway Middlesex All year 112 44 156

Flemington Hunterdon All year 104 39 143

Newark Bergen, Essex, Hudson, Passaic All year 124 49 173

Parsippany Morris All year 134 49 183

Princeton, Trenton Mercer All year 137 44 181(excluding Comfort Inn)

Springfield, Cranford, Union All year 103 49 152New Providence,Westfield, Clark,Summit, Linden

Toms River Ocean 1/1 - 6/30 85 39 1247/1 - 8/31 113 39 1529/1 - 12/31 85 39 124

NM Albuquerque Bernalillo All year 75 49 124

Los Alamos Los Alamos All year 78 49 127

Santa Fe Santa Fe 1/1 - 8/31 85 59 1449/1 - 10/31 91 59 15011/1 - 12/31 85 59 144

Taos Taos All year 71 59 130

NV Incline Village, Crystal Washoe 1/1 - 5/31 104 49 153Bay, Reno, Sparks 6/1 - 8/31 152 49 201

9/1 - 12/31 104 49 153

Las Vegas Clark 1/1 - 5/31 124 64 1886/1 - 8/31 93 64 1579/1 - 12/31 108 64 172

Stateline, Carson City Douglas, Carson City All year 91 64 155

Page 18 Publication 1542 (October 2008)

Page 19 of 44 of Publication 1542 14:26 - 16-OCT-2008

The type and rule above prints on all proofs including departmental reproduction proofs. MUST be removed before printing.

Table 3. (Effective October 1, 2007 – September 30, 2008) (Continued)

Per Diem Locality Computing Maximum Rate

Maximum Maximum Lodging M&IE Per Diem

State Key City2 County and/or Other Defined Location3,4 Effective Dates Rate Rate Rate

NY Albany Albany All year $105 $49 $154

Binghamton, Owego Broome, Tioga All year 81 39 120

Buffalo Erie All year 86 54 140

Floral Park, Garden Nassau All year 159 64 223City, Glen Cove, GreatNeck, Roslyn

Glens Falls Warren 1/1 - 6/30 90 49 1397/1 - 8/31 133 49 1829/1 - 12/31 90 49 139

Ithaca, Waterloo, Tompkins, Seneca All year 94 44 138Romulus

Kingston Ulster All year 92 49 141

Lake Placid Essex 1/1 - 5/31 103 54 1576/1 - 8/31 135 54 1899/1 - 12/31 103 54 157

Manhattan The boroughs of Manhattan, Brooklyn, 1/1 - 6/30 244 64 308the Bronx, and Staten Island 7/1 - 8/31 220 64 284

9/1 - 12/31 311 64 375

Niagara Falls Niagara 1/1 - 6/30 70 44 1147/1 - 8/31 93 44 1379/1 - 12/31 70 44 114

Nyack, Palisades Rockland All year 108 49 157

Poughkeepsie Dutchess All year 106 54 160

Queens Queens Before 3/17/08 135 59 194After 3/16/08:

3/17 - 6/30 244 64 3087/1 - 8/31 220 64 2849/1 - 9/30 311 64 375

Riverhead, Suffolk All year 127 64 191Ronkonkoma, Melville,Smithtown, HuntingtonStation, Amagansett,East Hampton,Montauk, Southampton,Islandia, Commack,Medford, Stony Brook,Hauppauge, Centereach

Rochester Monroe All year 95 44 139

Saratoga Springs, Saratoga, Schenectady 1/1 - 6/30 105 44 149Schenectady 7/1 - 8/31 168 44 212

9/1 - 12/31 105 44 149

Syracuse Onondaga All year 85 44 129

Tarrytown, White Plains, Westchester All year 154 59 213New Rochelle, Yonkers

Troy Rensselaer All year 84 39 123

West Point Orange All year 108 44 152

OH Akron Summit All year 83 49 132

Canton Stark All year 77 44 121

Cincinnati Hamilton, Clermont All year 104 54 158

Publication 1542 (October 2008) Page 19

Page 20 of 44 of Publication 1542 14:26 - 16-OCT-2008

The type and rule above prints on all proofs including departmental reproduction proofs. MUST be removed before printing.

Table 3. (Effective October 1, 2007 – September 30, 2008) (Continued)

Per Diem Locality Computing Maximum Rate

Maximum Maximum Lodging M&IE Per Diem

State Key City2 County and/or Other Defined Location3,4 Effective Dates Rate Rate Rate

OH Cleveland Cuyahoga All year $107 $54 $161

Columbus Franklin All year 101 49 150

Dayton, Fairborn Greene, Darke, Montgomery All year 84 44 128

Hamilton Butler, Warren All year 86 49 135

Mentor Lake All year 84 44 128

Rittman Wayne, Medina All year 78 39 117

Sandusky, Bellevue Erie, Huron All year 95 39 134

Toledo Lucas All year 78 44 122

Youngstown Mahoning, Trumbull All year 75 39 114

OK Oklahoma City Oklahoma All year 81 49 130

Tulsa Tulsa, Creek, Osage, Rogers All year 73 44 117

OR Ashland, Crater Lake Jackson, Klamath 1/1 - 5/31 77 44 1216/1 - 8/31 85 44 1299/1 - 12/31 77 44 121

Beaverton Washington All year 90 44 134

Bend Deschutes All year 81 44 125

Clackamas Clackamas All year 77 39 116

Eugene, Florence Lane All year 92 44 136

Lincoln City Lincoln 1/1 - 6/30 81 49 1307/1 - 8/31 105 49 1549/1 - 12/31 81 49 130

Portland Multnomah All year 106 49 155

Seaside Clatsop 1/1 - 6/30 85 54 1397/1 - 8/31 123 54 1779/1 - 12/31 85 54 139

PA Allentown, Easton, Lehigh, Northampton All year 87 44 131Bethlehem

Bucks County Bucks All year 101 59 160

Chester, Radnor, Delaware All year 99 44 143Essington

Erie Erie All year 85 39 124

Gettysburg Adams 1/1 - 3/31 75 54 1294/1 - 10/31 98 54 15211/1 - 12/31 75 54 129

Harrisburg Dauphin (except City of Hershey) All year 89 44 133

Hershey City limits of Hershey 1/1 - 5/31 86 44 1306/1 - 9/30 141 44 18510/1 - 12/31 86 44 130

Page 20 Publication 1542 (October 2008)

Page 21 of 44 of Publication 1542 14:26 - 16-OCT-2008

The type and rule above prints on all proofs including departmental reproduction proofs. MUST be removed before printing.

Table 3. (Effective October 1, 2007 – September 30, 2008) (Continued)

Per Diem Locality Computing Maximum Rate

Maximum Maximum Lodging M&IE Per Diem

State Key City2 County and/or Other Defined Location3,4 Effective Dates Rate Rate Rate

PA Lancaster Lancaster All year $ 89 $49 $138

Malvern, Frazer, Chester All year 112 49 161Berwyn, Phoenixville

Mechanicsburg Cumberland All year 79 54 133

Montgomery County Montgomery All year 123 59 182

Philadelphia Philadelphia All year 149 64 213

Pittsburgh Allegheny All year 108 54 162

Reading Berks All year 83 44 127

Scranton Lackawanna All year 73 39 112

State College Centre All year 79 44 123

RI East Greenwich, Kent, Washington All year 103 49 152Warwick, NorthKingstown

Jamestown, Middletown, Newport 1/1 - 1/31 82 64 146Newport 2/1 - 11/30 139 64 203

12/1 - 12/31 82 64 146

Providence Providence All year 146 54 200

SC Aiken Aiken All year 77 39 116

Charleston Charleston, Berkeley, Dorchester All year 137 54 191

Columbia Richland All year 87 44 131

Greenville Greenville All year 85 49 134

Hilton Head Beaufort 1/1 - 3/31 94 54 1484/1 - 9/30 136 54 19010/1 - 12/31 94 54 148

Myrtle Beach Horry 1/1 - 8/31 95 54 1499/1 - 10/31 82 54 13611/1 - 12/31 95 54 149

SD Hot Springs Fall River, Custer 1/1 - 6/30 70 39 1097/1 - 8/31 96 39 1359/1 - 12/31 70 39 109

Rapid City Pennington 1/1 - 5/31 70 44 1146/1 - 8/31 107 44 1519/1 - 12/31 70 44 114

Sturgis, Spearfish Meade, Butte, Lawrence 1/1 - 4/30 70 44 1145/1 - 8/31 93 44 1379/1 - 12/31 70 44 114

TN Brentwood, Franklin Williamson All year 91 49 140

Chattanooga Hamilton All year 85 44 129

Knoxville Knox All year 77 49 126

Memphis Shelby All year 90 49 139

Nashville Davidson All year 107 54 161

Oak Ridge Anderson All year 79 39 118

Publication 1542 (October 2008) Page 21

Page 22 of 44 of Publication 1542 14:26 - 16-OCT-2008

The type and rule above prints on all proofs including departmental reproduction proofs. MUST be removed before printing.

Table 3. (Effective October 1, 2007 – September 30, 2008) (Continued)

Per Diem Locality Computing Maximum Rate

Maximum Maximum Lodging M&IE Per Diem

State Key City2 County and/or Other Defined Location3,4 Effective Dates Rate Rate Rate

TX Arlington, Fort Worth, Tarrant; City limits of Grapevine All year $134 $44 $178Grapevine

Austin Travis All year 97 54 151

Beaumont Jefferson Before 3/17/08 70 39 109After 3/16/08 81 49 130

College Station Brazos All year 78 39 117

Corpus Christi Nueces All year 83 44 127

Dallas Dallas; City limits of Dallas 1/1 - 3/31 123 59 1824/1 - 12/31 109 59 168

El Paso El Paso All year 87 44 131

Galveston Galveston 1/1 - 5/31 95 49 1446/1 - 7/31 120 49 1698/1 - 12/31 95 49 144

Houston Montgomery, Fort Bend, Harris; L.B. Johnson Space All year 102 59 161Center

Hunt County Hunt All year 71 39 110

Laredo Webb All year 85 44 129

McAllen Hidalgo All year 79 44 123

Plano Collin All year 87 49 136

Round Rock Williamson All year 86 44 130

San Antonio Bexar All year 112 54 166

South Padre Island Cameron 1/1 - 2/29 73 44 1173/1 - 8/31 99 44 1439/1 - 12/31 73 44 117

Waco McLennan All year 79 39 118

UT Park City Summit 1/1 - 3/31 150 64 2144/1 - 12/31 80 64 144

Provo Utah All year 78 49 127

Salt Lake City Salt Lake, Tooele 1/1 - 3/31 107 54 1614/1 - 12/31 94 54 148

VA Cities of Alexandria, 1/1 - 6/30 201 64 265Fairfax, and Falls 7/1 - 8/31 154 64 218Church, and the 9/1 - 12/31 201 64 265counties of Arlingtonand Fairfax

Abington Washington All year 72 49 121

Blacksburg Montgomery All year 77 54 131

Charlottesville City of Charlottesville; Albemarle, Greene All year 93 44 137

Chesapeake, Suffolk Cities of Chesapeake, Suffolk 1/1 - 3/31 81 44 1254/1 - 5/31 88 44 1326/1 - 8/31 109 44 1539/1 - 12/31 81 44 125

Chesterfield, Henrico Chesterfield, Henrico All year 89 49 138Counties

Hampton City, Newport Cities of Hampton City, Newport News All year 75 44 119News

James City and York James City and York Counties; City of Williamsburg 1/1 - 3/31 70 54 124Counties; Williamsburg 4/1 - 8/31 89 54 143

9/1 - 12/31 70 54 124

Page 22 Publication 1542 (October 2008)

Page 23 of 44 of Publication 1542 14:26 - 16-OCT-2008

The type and rule above prints on all proofs including departmental reproduction proofs. MUST be removed before printing.

Table 3. (Effective October 1, 2007 – September 30, 2008) (Continued)

Per Diem Locality Computing Maximum Rate

Maximum Maximum Lodging M&IE Per Diem

State Key City2 County and/or Other Defined Location3,4 Effective Dates Rate Rate Rate

VA Loudon County Loudon All year $141 $59 $200

Lynchburg Campbell; City of Lynchburg All year 72 44 116

Manassas City of Manassas All year 93 39 132

Norfolk, Portsmouth Cities of Norfolk, Portsmouth All year 94 59 153

Richmond City City of Richmond All year 115 54 169

Roanoke City limits of Roanoke All year 84 44 128

Stafford, Prince William Stafford, Prince William All year 88 44 132Counties

Virginia Beach City of Virginia Beach 1/1 - 3/31 79 54 1334/1 - 5/31 87 54 1416/1 - 8/31 140 54 1949/1 - 12/31 79 54 133

Wallops Island Accomack 1/1 - 6/30 82 49 1317/1 - 8/31 119 49 1689/1 - 12/31 82 49 131

Warrenton Fauquier All year 91 44 135

VT Burlington, St. Albans Chittenden, Franklin 1/1 - 4/30 86 49 1355/1 - 10/31 102 49 15111/1 - 12/31 86 49 135

Manchester Bennington All year 86 59 145

Montpelier Washington All year 83 54 137

Stowe Lamoille 1/1 - 2/29 127 64 1913/1 - 11/30 111 64 17512/1 - 12/31 127 64 191

White River Junction Windsor 1/1 - 2/29 92 54 1463/1 - 8/31 82 54 1369/1 - 12/31 92 54 146

WA Anacortes, Camano San Juan, Skagit, Island 1/1 - 5/31 80 59 139Island, Coupeville,Mount Vernon, La 6/1 - 8/31 94 59 153Connor, Burlington,Friday Harbor, Oak 9/1 - 12/31 80 59 139Harbor

Bremerton Kitsap All year 79 59 138

Everett, Lynnwood Snohomish All year 90 54 144

Ocean Shores Grays Harbor 1/1 - 5/31 89 44 1336/1 - 8/31 112 44 1569/1 - 12/31 89 44 133

Olympia, Tumwater Thurston All year 80 49 129

Port Angeles, Port Clallam, Jefferson 1/1 - 6/30 88 59 147Townsend 7/1 - 8/31 126 59 185

9/1 - 12/31 88 59 147

Seattle King All year 152 64 216

Spokane Spokane All year 77 49 126

Tacoma Pierce All year 108 59 167

Vancouver Clark, Cowlitz, Skamania All year 110 49 159

Publication 1542 (October 2008) Page 23

Page 24 of 44 of Publication 1542 14:26 - 16-OCT-2008

The type and rule above prints on all proofs including departmental reproduction proofs. MUST be removed before printing.

Table 3. (Effective October 1, 2007 – September 30, 2008) (Continued)

Per Diem Locality Computing Maximum Rate

Maximum Maximum Lodging M&IE Per Diem

State Key City2 County and/or Other Defined Location3,4 Effective Dates Rate Rate Rate

WI Appleton Outagamie All year $ 79 $44 $123

Brookfield, Racine Waukesha, Racine All year 85 44 129

Green Bay Brown All year 73 44 117

Lake Geneva Walworth 1/1 - 5/31 102 54 1566/1 - 9/30 141 54 19510/1 - 12/31 102 54 156

Madison Dane All year 89 54 143

Milwaukee Milwaukee All year 93 44 137

Sheboygan Sheboygan 1/1 - 6/30 72 44 1167/1 - 8/31 82 44 1269/1 - 12/31 72 44 116

Sturgeon Bay Door 1/1 - 6/30 70 49 1197/1 - 9/30 81 49 13010/1 - 12/31 70 49 119

Wisconsin Dells Columbia 1/1 - 6/30 70 64 1347/1 - 8/31 82 64 1469/1 - 12/31 70 64 134

WV Charleston Kanawha All year 91 44 135

Morgantown Monongalia All year 79 44 123

Shepherdstown Jefferson All year 78 44 122

Wheeling Ohio All year 74 44 118

WY Cody Park 1/1 - 4/30 70 44 1145/1 - 9/30 102 44 14610/1 - 12/31 70 44 114

Evanston, Rock Springs Uinta, Sweetwater All year 73 44 117

Gillette Campbell All year 76 49 125

Jackson, Pinedale Teton, Sublette 1/1 - 6/30 91 54 1457/1 - 8/31 132 54 1869/1 - 11/30 84 54 13812/1 - 12/31 91 54 145

Sheridan Sheridan 1/1 - 5/31 70 49 1196/1 - 8/31 83 49 1329/1 - 12/31 70 49 119

1Transition rule. In lieu of the updated GSA rates that will be effective 4When a military installation or Government-related facility (whether or notOctober 1, 2008, taxpayers may continue to use the CONUS rates in effect for specifically named) is located partially within more than one city or countythe first 9 months of 2008 (Table 3) for expenses of all CONUS travel away boundary, the applicable per diem rate for the entire installation or facility isfrom home that are paid or incurred during calendar year 2008. A taxpayer the higher of the two rates which apply to the cities and/or counties, evenmust consistently use either these rates or the updated rates for the period of though part(s) of such activities may be located outside the defined per diemOctober 1, 2008, through December 31, 2008. See Transition Rules under locality.How To Use Per Diem Rate Tables for an example.

Note: Recognizing that all locations are not incorporated cities, the term “city2Unless otherwise specified, the per diem locality is defined as “all locations limits” has been used as a general phrase to denote the commonly recognized

within, or entirely surrounded by, the corporate limits of the key city, including local boundaries of the location cited.independent entities located within those boundaries.”

3Per diem localities with county definitions shall include “all locations within,or entirely surrounded by, the corporate limits of the key city as well as theboundaries of the listed counties, including independent entities located withinthe boundaries of the key city and the listed counties (unless otherwise listedseparately).”

Page 24 Publication 1542 (October 2008)

Page 25 of 44 of Publication 1542 14:26 - 16-OCT-2008

The type and rule above prints on all proofs including departmental reproduction proofs. MUST be removed before printing.

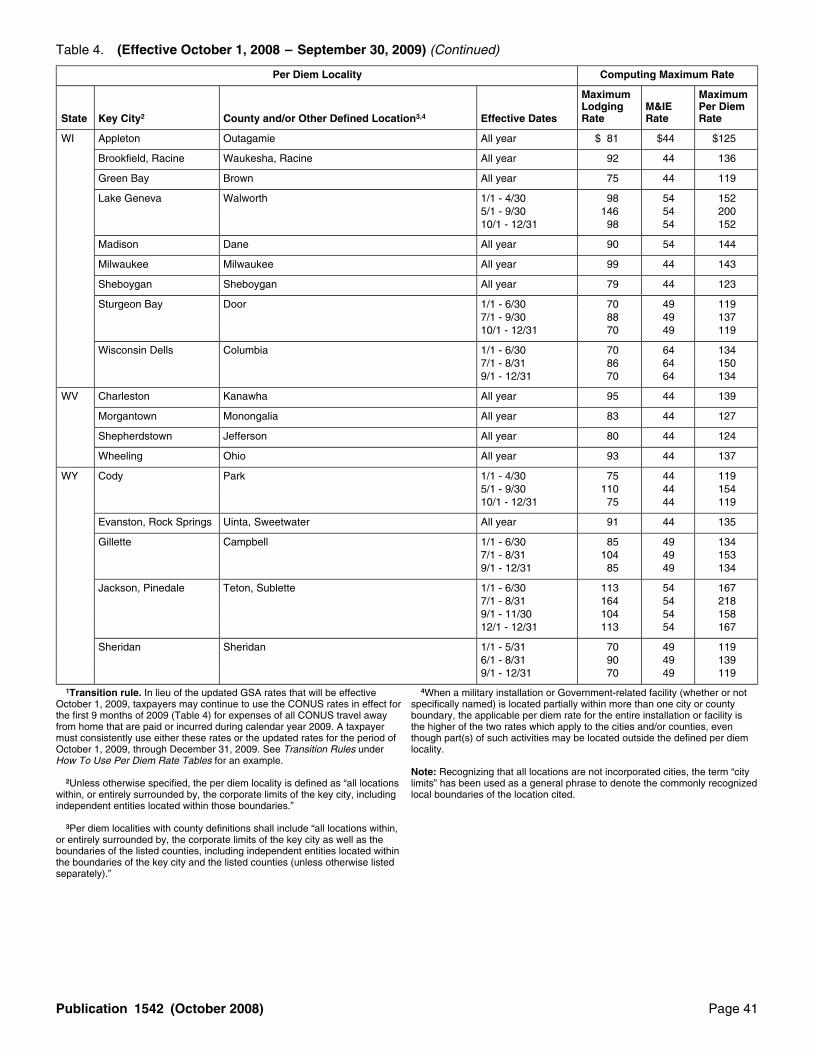
Table 4. Maximum Federal Per Diem Rates (Effective October 1, 2008 – September 30, 2009)1

Note: The standard rate of $109 ($70 for lodging and $39 for M&IE) applies to all locations within the continental United States(CONUS) not specifically listed below or encompassed by the boundary definition of a listed point. However, the standard CONUS rateapplies to all locations within CONUS, including those defined below, for certain relocation allowances. (See parts 302-2, 302-4, and302-5 of 41 CFR.)

Per Diem Locality Computing Maximum Rate

Maximum Maximum Lodging M&IE Per Diem

State Key City2 County and/or Other Defined Location3,4 Effective Dates Rate Rate Rate

AL Birmingham Jefferson, Shelby All year $ 94 $44 $138

Gulf Shores Baldwin 1/1 - 5/31 110 39 1496/1 - 7/31 139 39 1788/1 - 12/31 110 39 149

Huntsville Madison, Limestone All year 84 44 128

Mobile Mobile All year 94 49 143

Montgomery Montgomery All year 80 39 119

AR Hot Springs Garland All year 98 49 147

Little Rock Pulaski All year 88 54 142

AZ Grand Canyon, Flagstaff Coconino (except city limits of Sedona), Yavapai 1/1 - 2/28 75 44 1193/1 - 10/31 93 44 13711/1 - 12/31 75 44 119

Kayenta Navajo 1/1 - 4/30 75 54 1295/1 - 9/30 86 54 14010/1 - 12/31 75 54 129

Phoenix, Scottsdale Maricopa 1/1 - 4/30 160 59 2195/1 - 8/31 96 59 1559/1 - 12/31 122 59 181

Sedona City limits of Sedona 1/1 - 2/28 135 64 1993/1 - 4/30 157 64 2215/1 - 12/31 135 64 199

Sierra Vista Cochise All year 78 39 117

Tucson Pima 1/1 - 1/31 106 49 1552/1 - 5/31 124 49 1736/1 - 8/31 83 49 1329/1 - 12/31 106 49 155

Yuma Yuma All year 86 39 125

CA Antioch, Brentwood, Contra Costa All year 113 49 162Concord, Lafayette,Martinez, Pleasant Hill,Richmond, San Ramon,Walnut Creek

Bakersfield, Delano Kern All year 78 44 122(Naval Weapons Centerand Ordnance TestStation, China Lake)

Barstow, Ontario, San Bernardino All year 97 59 156Victorville

Benicia, Dixon, Fairfield, Solano All year 93 44 137Vacaville, Vallejo

Brawley, Calexico, El Imperial All year 76 39 115Centro, Imperial

Death Valley Inyo All year 81 49 130

Eureka, Arcata, Humboldt All year 89 54 143McKinleyville

Publication 1542 (October 2008) Page 25

Page 26 of 44 of Publication 1542 14:26 - 16-OCT-2008

The type and rule above prints on all proofs including departmental reproduction proofs. MUST be removed before printing.

Table 4. (Effective October 1, 2008 – September 30, 2009) (Continued)

Per Diem Locality Computing Maximum Rate

Maximum Maximum Lodging M&IE Per Diem

State Key City2 County and/or Other Defined Location3,4 Effective Dates Rate Rate Rate

CA Fresno Fresno All year $ 95 $54 $149

Los Angeles Los Angeles, Orange, Ventura; Edwards AFB All year 128 64 192

Mammoth Lakes Mono 1/1 - 1/31 142 54 1962/1 - 11/30 113 54 16712/1 - 12/31 142 54 196

Mill Valley, San Rafael, Marin All year 122 54 176Novato, Corte Madera,Sausalito, Tiburon,Larkspur

Modesto Stanislaus All year 89 49 138

Monterey Monterey All year 133 64 197

Napa Napa All year 146 64 210

Oakhurst Madera 1/1 - 4/30 75 39 1145/1 - 8/31 90 39 1299/1 - 12/31 75 39 114

Oakland Alameda All year 106 59 165

Palm Springs Riverside 1/1 - 4/30 139 59 1985/1 - 8/31 97 59 1569/1 - 12/31 114 59 173

Point Arena, Gualala Mendocino All year 81 54 135

Redding Shasta All year 86 44 130

Sacramento Sacramento All year 114 59 173

San Diego San Diego 1/1 - 8/31 147 64 2119/1 - 12/31 137 64 201

San Francisco San Francisco 1/1 - 8/31 164 64 2289/1 - 10/31 185 64 24911/1 - 12/31 164 64 228

San Luis Obispo San Luis Obispo 1/1 - 6/30 109 54 1637/1 - 8/31 131 54 1859/1 - 12/31 109 54 163

San Mateo, Foster City, San Mateo All year 123 54 177Belmont

Santa Barbara Santa Barbara 1/1 - 6/30 149 59 2087/1 - 8/31 194 59 2539/1 - 12/31 149 59 208

Santa Cruz Santa Cruz All year 102 54 156

Santa Monica City limits of Santa Monica All year 212 64 276

Santa Rosa Sonoma All year 118 64 182

South Lake Tahoe El Dorado 1/1 - 3/31 153 54 2074/1 - 6/30 118 54 1727/1 - 11/30 132 54 18612/1 - 12/31 153 54 207

Stockton San Joaquin All year 83 44 127

Sunnyvale, Palo Alto, Santa Clara All year 132 59 191San Jose

Tahoe City Placer All year 105 59 164

Truckee Nevada 1/1 - 3/31 109 59 1684/1 - 11/30 94 59 15312/1 - 12/31 109 59 168

Visalia, Lemoore Tulare, Kings All year 83 49 132

Page 26 Publication 1542 (October 2008)

Page 27 of 44 of Publication 1542 14:26 - 16-OCT-2008

The type and rule above prints on all proofs including departmental reproduction proofs. MUST be removed before printing.

Table 4. (Effective October 1, 2008 – September 30, 2009) (Continued)

Per Diem Locality Computing Maximum Rate

Maximum Maximum Lodging M&IE Per Diem

State Key City2 County and/or Other Defined Location3,4 Effective Dates Rate Rate Rate

CA West Sacramento Yolo All year $100 $44 $144

Yosemite National Park Mariposa 1/1 - 7/31 133 64 1978/1 - 12/31 126 64 190

CO Aspen Pitkin 1/1 - 4/30 223 64 2875/1 - 9/30 111 64 17510/1 - 11/30 85 64 14912/1 - 12/31 223 64 287

Boulder, Broomfield Boulder, Broomfield All year 105 54 159

Colorado Springs El Paso All year 88 44 132

Cortez Montezuma 1/1 - 5/31 83 39 1226/1 - 8/31 102 39 1419/1 - 12/31 83 39 122

Crested Butte, Gunnison Gunnison 1/1 - 3/31 188 49 2374/1 - 5/31 72 49 1216/1 - 8/31 96 49 1459/1 - 11/30 77 49 12612/1 - 12/31 188 49 237

Denver, Aurora Denver, Adams, Arapahoe, and Jefferson All year 149 49 198

Douglas County Douglas All year 104 54 158

Durango La Plata 1/1 - 5/31 94 49 1436/1 - 9/30 125 49 17410/1 - 12/31 94 49 143

Fort Collins, Loveland Larimer All year 93 44 137

Glenwood Springs, Garfield, Mesa All year 91 49 140Grand Junction

Montrose Montrose 1/1 - 5/31 76 39 1156/1 - 9/30 93 39 13210/1 - 12/31 76 39 115

Silverthorne, Summit 1/1 - 4/30 157 54 211Breckenridge 5/1 - 11/30 96 54 150

12/1 - 12/31 157 54 211

Steamboat Springs Routt 1/1 - 3/31 212 54 2664/1 - 11/30 103 54 15712/1 - 12/31 212 54 266

Telluride San Miguel 1/1 - 3/31 211 59 2704/1 - 5/31 99 59 1586/1 - 9/30 128 59 18710/1 - 12/31 155 59 214

Vail Eagle 1/1 - 1/31 268 64 3322/1 - 3/31 233 64 2974/1 - 7/31 225 64 2898/1 - 11/30 127 64 19112/1 - 12/31 268 64 332

CT Bridgeport, Danbury Fairfield All year 122 64 186

Cromwell, Old Saybrook Middlesex All year 88 44 132

Hartford Hartford All year 112 49 161

Lakeville, Salisbury Litchfield All year 95 64 159

New Haven New Haven All year 96 64 160

New London, Groton New London All year 105 64 169

Putnam, Danielson, Windham, Tolland All year 75 59 134Storrs, Mansfield

Publication 1542 (October 2008) Page 27

Page 28 of 44 of Publication 1542 14:26 - 16-OCT-2008

The type and rule above prints on all proofs including departmental reproduction proofs. MUST be removed before printing.

Table 4. (Effective October 1, 2008 – September 30, 2009) (Continued)

Per Diem Locality Computing Maximum Rate

Maximum Maximum Lodging M&IE Per Diem

State Key City2 County and/or Other Defined Location3,4 Effective Dates Rate Rate Rate

DC Washington, DC (also 1/1 - 6/30 $209 $64 $273the cities of Alexandria, 7/1 - 8/31 165 64 229Fairfax, and Falls 9/1 - 10/31 233 64 297Church, and the 11/1 - 12/31 209 64 273counties of Arlingtonand Fairfax, in Virginia;and the counties ofMontgomery and PrinceGeorge’s in Maryland)(see also Maryland andVirginia)

DE Dover Kent 1/1 - 5/31 83 44 1276/1 - 9/30 99 44 14310/1 - 12/31 83 44 127

Lewes Sussex 1/1 - 6/30 81 39 1207/1 - 8/31 117 39 1569/1 - 12/31 81 39 120

Wilmington New Castle All year 119 39 158

FL Altamonte Springs Seminole 1/1 - 3/31 101 39 1404/1 - 12/31 88 39 127

Boca Raton, Delray Palm Beach 1/1 - 4/30 145 64 209Beach, Jupiter, Palm 5/1 - 11/30 99 64 163Beach, Palm Beach 12/1 - 12/31 145 64 209Gardens, Palm BeachShores, Singer Island,and West Palm Beach

Bradenton Manatee 1/1 - 4/30 115 39 1545/1 - 12/31 85 39 124

Cocoa Beach Brevard All year 106 44 150

Daytona Beach Volusia 1/1 - 1/31 93 39 1322/1 - 7/31 117 39 1568/1 - 12/31 93 39 132

Fort Lauderdale Broward 1/1 - 4/30 176 54 2305/1 - 9/30 118 54 17210/1 - 12/31 176 54 230

Fort Myers Lee 1/1 - 4/30 128 49 1775/1 - 12/31 88 49 137

Fort Pierce St. Lucie 1/1 - 4/30 118 49 1675/1 - 10/31 96 49 14511/1 - 12/31 118 49 167

Fort Walton Beach, Okaloosa, Walton 1/1 - 2/28 83 44 127DeFuniak Springs 3/1 - 5/31 135 44 179

6/1 - 7/31 176 44 2208/1 - 10/31 118 44 16211/1 - 12/31 83 44 127

Gainesville Alachua All year 93 44 137

Gulf Breeze Santa Rosa 1/1 - 2/28 105 39 1443/1 - 5/31 124 39 1636/1 - 7/31 150 39 1898/1 - 12/31 105 39 144

Jacksonville, Duval, Nassau; City of Jacksonville All year 89 49 138Jacksonville Beach,Mayport Naval Station,Fernandina Beach,Atlantic Beach

Page 28 Publication 1542 (October 2008)

Page 29 of 44 of Publication 1542 14:26 - 16-OCT-2008

The type and rule above prints on all proofs including departmental reproduction proofs. MUST be removed before printing.

Table 4. (Effective October 1, 2008 – September 30, 2009) (Continued)

Per Diem Locality Computing Maximum Rate

Maximum Maximum Lodging M&IE Per Diem

State Key City2 County and/or Other Defined Location3,4 Effective Dates Rate Rate Rate

FL Key West Monroe 1/1 - 1/31 $202 $64 $2662/1 - 3/31 243 64 3074/1 - 11/30 167 64 23112/1 - 12/31 202 64 266

Kissimmee Osceola 1/1 - 7/31 85 39 1248/1 - 12/31 79 39 118

Lakeland Polk All year 87 39 126

Leesburg Lake All year 77 44 121

Miami Miami-Dade 1/1 - 2/28 149 59 2083/1 - 9/30 121 59 18010/1 - 12/31 149 59 208

Naples Collier 1/1 - 1/31 134 64 1982/1 - 3/31 221 64 2854/1 - 9/30 120 64 18410/1 - 12/31 134 64 198

Ocala Marion All year 91 44 135

Orlando Orange 1/1 - 3/31 133 49 1824/1 - 12/31 109 49 158

Panama City Bay 1/1 - 2/28 85 49 1343/1 - 5/31 125 49 1746/1 - 7/31 146 49 1958/1 - 12/31 85 49 134

Pensacola, Pensacola Escambia All year 107 49 156Beach

Punta Gorda Charlotte 1/1 - 1/31 88 44 1322/1 - 3/31 115 44 1594/1 - 12/31 88 44 132

Sarasota Sarasota 1/1 - 1/31 101 49 1502/1 - 3/31 143 49 1924/1 - 12/31 101 49 150

Sebring Highlands 1/1 - 3/31 137 39 1764/1 - 12/31 76 39 115

St. Augustine St. Johns All year 105 54 159

Stuart Martin 1/1 - 4/30 129 49 1785/1 - 12/31 93 49 142

Tallahassee Leon All year 89 44 133

Tampa, St. Petersburg Pinellas, Hillsborough 1/1 - 3/31 127 54 1814/1 - 12/31 104 54 158

Vero Beach Indian River 1/1 - 1/31 95 49 1442/1 - 3/31 127 49 1764/1 - 12/31 95 49 144

Publication 1542 (October 2008) Page 29

Page 30 of 44 of Publication 1542 14:26 - 16-OCT-2008

The type and rule above prints on all proofs including departmental reproduction proofs. MUST be removed before printing.

Table 4. (Effective October 1, 2008 – September 30, 2009) (Continued)

Per Diem Locality Computing Maximum Rate

Maximum Maximum Lodging M&IE Per Diem

State Key City2 County and/or Other Defined Location3,4 Effective Dates Rate Rate Rate

GA Athens Clarke All year $ 90 $39 $129

Atlanta Fulton, DeKalb, Cobb All year 141 49 190

Augusta Richmond All year 79 39 118

Columbus Muscogee All year 92 39 131

Conyers Rockdale All year 77 39 116

Duluth, Norcross, Gwinnett All year 80 44 124Lawrenceville, Braselton

Jekyll Island, Brunswick Glynn 1/1 - 2/28 120 49 1693/1 - 9/30 146 49 19510/1 - 12/31 120 49 169

Peachtree City, Fayette, Clayton, Coweta All year 77 44 121Jonesboro, Morrow,Newnan

Savannah Chatham All year 108 49 157

IA Cedar Rapids Linn All year 80 39 119

Des Moines Polk All year 86 44 130

ID Boise Ada All year 86 49 135

Coeur d’Alene Kootenai 1/1 - 6/30 75 59 1347/1 - 8/31 109 59 1689/1 - 12/31 75 59 134

Sun Valley, Ketchum Blaine All year 84 59 143

Twin Falls Twin Falls All year 86 39 125

IL Bolingbrook, Will All year 91 44 135Romeoville, Lemont,Lockport, Homer Glen,Mokena, New Lenox

Chicago Cook, Lake 1/1 - 4/30 157 64 2215/1 - 6/30 209 64 2737/1 - 8/31 177 64 2419/1 - 11/30 218 64 28212/1 - 12/31 157 64 221

Elgin, Aurora Kane; City of Elgin All year 87 44 131

Oakbrook Terrace DuPage All year 106 49 155

O’Fallon, Fairview Bond, Calhoun, Clinton, Jersey, Macoupin, All year 111 59 170Heights, Collinsville Madison, Monroe, St. Clair

Springfield Sangamon All year 83 49 132

IN Bloomington Monroe All year 96 44 140

Brownsburg, Plainfield Hendricks All year 78 44 122

Fort Wayne Allen All year 90 39 129

Hammond, Munster, Lake All year 93 44 137Merrillville

Indianapolis, Carmel Marion, Hamilton; Fort Benjamin Harrison All year 94 44 138

Lafayette Tippecanoe All year 87 39 126

Michigan City La Porte All year 82 39 121

Page 30 Publication 1542 (October 2008)

Page 31 of 44 of Publication 1542 14:26 - 16-OCT-2008

The type and rule above prints on all proofs including departmental reproduction proofs. MUST be removed before printing.

Table 4. (Effective October 1, 2008 – September 30, 2009) (Continued)

Per Diem Locality Computing Maximum Rate

Maximum Maximum Lodging M&IE Per Diem

State Key City2 County and/or Other Defined Location3,4 Effective Dates Rate Rate Rate

IN South Bend St. Joseph All year $ 95 $44 $139

Valparaiso, Burlington Porter All year 82 49 131Beach

KS Kansas City, Overland Wyandotte, Johnson All year 107 44 151Park

Wichita Sedgwick All year 86 49 135

KY Boone County Boone All year 98 44 142

Kenton County Kenton All year 117 44 161

Lexington Fayette All year 91 49 140

Louisville Jefferson 1/1 - 5/31 103 49 1526/1 - 9/30 94 49 14310/1 - 12/31 103 49 152

LA Baton Rouge East Baton Rouge Parish All year 101 44 145

Covington, Slidell St. Tammany Parish All year 96 49 145

Lafayette Lafayette Consolidated Government All year 86 49 135

Lake Charles Calcasieu Parish All year 80 39 119

New Orleans Orleans, Jefferson, Plaquemines, and 1/1 - 6/30 140 59 199St. Bernard Parishes 7/1 - 9/30 101 59 160

10/1 - 12/31 140 59 199

MA Andover Essex All year 90 59 149

Boston, Cambridge Suffolk; City of Cambridge 1/1 - 8/31 203 64 2679/1 - 10/31 256 64 32011/1 - 12/31 203 64 267

Burlington, Woburn Middlesex All year 119 59 178

Falmouth City limits of Falmouth 1/1 - 6/30 100 49 1497/1 - 8/31 142 49 1919/1 - 12/31 100 49 149

Hyannis Barnstable 1/1 - 6/30 85 59 1447/1 - 8/31 118 59 1779/1 - 12/31 85 59 144

Martha’s Vineyard Dukes 1/1 - 5/31 106 64 1706/1 - 8/31 186 64 2509/1 - 10/31 123 64 18711/1 - 12/31 106 64 170

Nantucket Nantucket 1/1 - 5/31 119 64 1836/1 - 9/30 206 64 27010/1 - 12/31 119 64 183

Northampton Hampshire All year 91 39 130

Pittsfield Berkshire All year 109 59 168

Publication 1542 (October 2008) Page 31

Page 32 of 44 of Publication 1542 14:26 - 16-OCT-2008

The type and rule above prints on all proofs including departmental reproduction proofs. MUST be removed before printing.

Table 4. (Effective October 1, 2008 – September 30, 2009) (Continued)

Per Diem Locality Computing Maximum Rate

Maximum Maximum Lodging M&IE Per Diem

State Key City2 County and/or Other Defined Location3,4 Effective Dates Rate Rate Rate

MA Plymouth, Taunton, New Plymouth, Bristol All year $ 95 $54 $149Bedford

Quincy Norfolk All year 123 44 167

Springfield Hampden All year 96 44 140

Worcester Worcester All year 96 49 145

MD Counties of Montgomery 1/1 - 6/30 209 64 273and Prince George’s 7/1 - 8/31 165 64 229

9/1 - 10/31 233 64 29711/1 - 12/31 209 64 273

Aberdeen, Bel Air, Harford All year 83 44 127Belcamp, Edgewood

Annapolis Anne Arundel All year 126 64 190

Baltimore Baltimore City 1/1 - 8/31 157 59 2169/1 - 10/31 172 59 23111/1 - 12/31 157 59 216

Baltimore County Baltimore All year 106 54 160

Cambridge, St. Michaels Dorchester, Talbot 1/1 - 4/30 105 54 1595/1 - 8/31 163 54 2179/1 - 10/31 140 54 19411/1 - 12/31 105 54 159

Columbia Howard All year 125 49 174

Frederick Frederick All year 89 39 128

Hagerstown Washington All year 76 39 115

La Plata, Indian Head Charles All year 90 39 129

Lexington Park, St. Mary’s, Calvert All year 97 39 136Leonardtown, Lusby

Ocean City Worcester 1/1 - 5/31 82 64 1466/1 - 9/30 181 64 24510/1 - 12/31 82 64 146

ME Bar Harbor Hancock 1/1 - 6/30 87 49 1367/1 - 9/30 143 49 19210/1 - 12/31 87 49 136

Kennebunk, Kittery, York 1/1 - 3/31 70 54 124Sanford 4/1 - 6/30 83 54 137

7/1 - 8/31 126 54 1809/1 - 10/31 93 54 14711/1 - 12/31 70 54 124

Portland Cumberland, Sagadahoc 1/1 - 6/30 89 44 1337/1 - 9/30 113 44 15710/1 - 12/31 89 44 133

Rockport Knox 1/1 - 6/30 70 49 1197/1 - 8/31 78 49 1279/1 - 12/31 70 49 119

MI Ann Arbor Washtenaw All year 91 44 135

Benton Harbor, St. Berrien All year 74 49 123Joseph, Stevensville

Charlevoix Charlevoix All year 74 49 123

Detroit Wayne All year 107 49 156

East Lansing, Lansing Ingham, Eaton All year 81 39 120

Page 32 Publication 1542 (October 2008)

Page 33 of 44 of Publication 1542 14:26 - 16-OCT-2008

The type and rule above prints on all proofs including departmental reproduction proofs. MUST be removed before printing.

Table 4. (Effective October 1, 2008 – September 30, 2009) (Continued)

Per Diem Locality Computing Maximum Rate

Maximum Maximum Lodging M&IE Per Diem

State Key City2 County and/or Other Defined Location3,4 Effective Dates Rate Rate Rate

MI Flint Genesee All year $ 80 $39 $119

Grand Rapids Kent All year 84 39 123

Holland Ottawa All year 82 44 126

Kalamazoo, Battle Kalamazoo, Calhoun All year 86 44 130Creek

Mackinac Island Mackinac 1/1 - 6/30 70 49 1197/1 - 8/31 88 49 1379/1 - 12/31 70 49 119

Midland Midland All year 78 39 117

Mount Pleasant Isabella All year 73 44 117

Muskegon Muskegon 1/1 - 5/31 72 39 1116/1 - 8/31 88 39 1279/1 - 12/31 72 39 111

Ontonagon, Baraga, Ontonagon, Baraga, Houghton All year 75 39 114Houghton

Petoskey Emmet 1/1 - 6/30 71 54 1257/1 - 8/31 94 54 1489/1 - 12/31 71 54 125

Pontiac, Auburn Hills Oakland All year 97 44 141

South Haven Van Buren 1/1 - 5/31 70 39 1096/1 - 8/31 85 39 1249/1 - 12/31 70 39 109

Traverse City, Leland Grand Traverse, Leelanau 1/1 - 6/30 70 44 1147/1 - 8/31 118 44 1629/1 - 12/31 70 44 114

Warren Macomb All year 77 39 116

MN Duluth St. Louis 1/1 - 5/31 82 49 1316/1 - 8/31 103 49 1529/1 - 12/31 82 49 131

Eagan, Burnsville, Dakota All year 90 49 139Mendota Heights,Lakeville, Inver GroveHeights

Minneapolis, St. Paul Hennepin, Ramsey All year 130 64 194

Rochester Olmsted All year 95 44 139

MO Columbia Boone All Year 79 39 118

Kansas City Jackson, Clay, Cass, Platte All year 107 49 156

Springfield Greene All year 76 39 115

St. Louis St. Louis, St. Charles, Crawford, Franklin, Jefferson, All year 111 59 170Lincoln, Warren, Washington; St. Louis City

MS Grenada Grenada All year 75 44 119

Gulfport, Biloxi Harrison All year 80 44 124

Publication 1542 (October 2008) Page 33

Page 34 of 44 of Publication 1542 14:26 - 16-OCT-2008

The type and rule above prints on all proofs including departmental reproduction proofs. MUST be removed before printing.

Table 4. (Effective October 1, 2008 – September 30, 2009) (Continued)

Per Diem Locality Computing Maximum Rate

Maximum Maximum Lodging M&IE Per Diem

State Key City2 County and/or Other Defined Location3,4 Effective Dates Rate Rate Rate

MS Hattiesburg Forrest, Lamar All year $ 76 $49 $125

Robinsonville Tunica All year 81 44 125

Southaven Desoto All year 91 44 135

Starkville Oktibbeha All year 76 44 120

MT Big Sky, West Gallatin 1/1 - 6/30 82 49 131Yellowstone 7/1 - 8/31 107 49 156

9/1 - 12/31 82 49 131

Butte Silver Bow All year 80 44 124

Helena Lewis and Clark All year 77 44 121

Missoula, Polson, Missoula, Lake, Flathead 1/1 - 5/31 84 44 128Kalispell 6/1 - 8/31 106 44 150

9/1 - 12/31 84 44 128

NC Asheville Buncombe 1/1 - 6/30 81 49 1307/1 - 10/31 94 49 14311/1 - 12/31 81 49 130

Atlantic Beach, Carteret 1/1 - 5/31 76 49 125Morehead City 6/1 - 8/31 106 49 155

9/1 - 12/31 76 49 125

Chapel Hill Orange All year 92 49 141

Charlotte Mecklenburg All year 97 49 146

Durham Durham All year 95 49 144

Fayetteville Cumberland All year 85 49 134

Greensboro Guilford All year 89 44 133

Greenville Pitt All year 80 39 119

Kill Devil Dare 1/1 - 4/30 70 54 1245/1 - 9/30 116 54 17010/1 - 12/31 70 54 124

New Bern, Havelock Craven All year 89 44 133

Raleigh Wake All year 92 54 146

Wilmington New Hanover 1/1 - 5/31 93 49 1426/1 - 7/31 109 49 1588/1 - 12/31 93 49 142

Winston-Salem Forsyth All year 89 44 133

ND The standard CONUS rate of $109 ($70 for lodging and $39 for M&IE) applies to all per diem localities in North Dakota.

NE Omaha Douglas All year 99 49 148

NH Concord Merrimack 1/1 - 4/30 85 44 1295/1 - 10/31 94 44 13811/1 - 12/31 85 44 129

Conway Carroll 1/1 - 5/31 112 49 1616/1 - 8/31 145 49 1949/1 - 12/31 112 49 161

Durham Strafford All year 94 44 138

Laconia Belknap 1/1 - 5/31 86 39 1256/1 - 10/31 99 39 13811/1 - 12/31 86 39 125

Page 34 Publication 1542 (October 2008)

Page 35 of 44 of Publication 1542 14:26 - 16-OCT-2008

The type and rule above prints on all proofs including departmental reproduction proofs. MUST be removed before printing.

Table 4. (Effective October 1, 2008 – September 30, 2009) (Continued)

Per Diem Locality Computing Maximum Rate

Maximum Maximum Lodging M&IE Per Diem

State Key City2 County and/or Other Defined Location3,4 Effective Dates Rate Rate Rate

NH Lebanon, Lincoln, West Grafton, Sullivan All year $ 99 $49 $148Lebanon, Franconia,Hanover, Holderness,Sunapee, WatervilleValley, NorthWoodstock, Plymouth

Manchester Hillsborough All year 98 44 142

Portsmouth Rockingham 1/1 - 6/30 102 44 1467/1 - 9/30 132 44 17610/1 - 12/31 102 44 146

NJ Atlantic City, Cape May, Atlantic, Cape May 1/1 - 4/30 105 54 159Ocean City 5/1 - 10/31 117 54 171

11/1 - 12/31 105 54 159

Belle Mead Somerset All year 127 44 171

Cherry Hill, Moorestown Camden, Burlington All year 94 44 138

Eatontown, Freehold Monmouth All year 125 49 174

Edison, Piscataway Middlesex All year 114 44 158

Flemington Hunterdon All year 113 39 152

Newark Bergen, Essex, Hudson, Passaic All year 133 49 182

Parsippany Morris All year 142 49 191

Princeton, Trenton Mercer All year 139 44 183

Springfield, Cranford, Union All year 106 49 155New Providence,Westfield, Clark,Summit, Linden

Toms River Ocean 1/1 - 5/31 92 39 1316/1 - 8/31 116 39 1559/1 - 12/31 92 39 131

NM Albuquerque Bernalillo All year 80 49 129

Los Alamos Los Alamos All year 82 49 131

Santa Fe Santa Fe All year 86 59 145

Taos Taos All year 75 59 134

NV Incline Village, Crystal Washoe 1/1 - 6/30 110 49 159Bay, Reno, Sparks 7/1 - 8/31 149 49 198

9/1 - 12/31 110 49 159

Las Vegas Clark 1/1 - 5/31 126 64 1906/1 - 12/31 105 64 169

Stateline, Carson City Douglas, Carson City All year 103 64 167

Publication 1542 (October 2008) Page 35

Page 36 of 44 of Publication 1542 14:26 - 16-OCT-2008

The type and rule above prints on all proofs including departmental reproduction proofs. MUST be removed before printing.

Table 4. (Effective October 1, 2008 – September 30, 2009) (Continued)

Per Diem Locality Computing Maximum Rate

Maximum Maximum Lodging M&IE Per Diem

State Key City2 County and/or Other Defined Location3,4 Effective Dates Rate Rate Rate

NY Albany Albany All year $111 $49 $160

Binghamton, Owego Broome, Tioga All year 87 39 126

Buffalo Erie All year 92 54 146

Floral Park, Garden Nassau All year 162 64 226City, Glen Cove, GreatNeck, Roslyn

Glens Falls Warren 1/1 - 6/30 98 49 1477/1 - 8/31 150 49 1999/1 - 12/31 98 49 147

Ithaca, Waterloo, Tompkins, Seneca All year 102 44 146Romulus

Kingston Ulster All year 96 49 145

Lake Placid Essex 1/1 - 5/31 111 54 1656/1 - 8/31 150 54 2049/1 - 12/31 111 54 165

Manhattan (includes Bronx, Kings, New York, Queens, Richmond 1/1 - 6/30 285 64 349the boroughs of 7/1 - 8/31 259 64 323Manhattan, Brooklyn, 9/1 - 12/31 360 64 424the Bronx, Queens, andStaten Island)

Niagara Falls Niagara 1/1 - 4/30 79 44 1235/1 - 8/31 97 44 1419/1 - 12/31 79 44 123

Nyack, Palisades Rockland All year 117 49 166

Poughkeepsie Dutchess All year 110 54 164

Riverhead, Suffolk All year 131 64 195Ronkonkoma, Melville,Smithtown, HuntingtonStation, Amagansett,East Hampton,Montauk, Southampton,Islandia, Commack,Medford, Stony Brook,Hauppauge, Centereach

Rochester Monroe All year 101 44 145

Saratoga Springs, Saratoga, Schenectady 1/1 - 6/30 106 44 150Schenectady 7/1 - 8/31 169 44 213

9/1 - 12/31 106 44 150

Syracuse Onondaga All year 94 44 138

Tarrytown, White Plains, Westchester All year 164 59 223New Rochelle, Yonkers

Troy Rensselaer All year 97 39 136

West Point Orange All year 114 44 158

OH Akron Summit All year 88 49 137

Canton Stark All year 90 44 134

Cincinnati Hamilton, Clermont All year 112 54 166

Page 36 Publication 1542 (October 2008)

Page 37 of 44 of Publication 1542 14:26 - 16-OCT-2008

The type and rule above prints on all proofs including departmental reproduction proofs. MUST be removed before printing.

Table 4. (Effective October 1, 2008 – September 30, 2009) (Continued)

Per Diem Locality Computing Maximum Rate

Maximum Maximum Lodging M&IE Per Diem

State Key City2 County and/or Other Defined Location3,4 Effective Dates Rate Rate Rate

OH Cleveland Cuyahoga All year $110 $54 $164

Columbus Franklin All year 105 49 154

Dayton, Fairborn Greene, Darke, Montgomery All year 84 44 128

Hamilton Butler, Warren All year 91 49 140

Mentor Lake All year 87 44 131

Rittman Wayne, Medina All year 82 39 121

Sandusky, Bellevue Erie, Huron All year 108 39 147

Toledo Lucas All year 81 44 125

Youngstown Mahoning, Trumbull All year 82 39 121

OK Oklahoma City Oklahoma All year 83 49 132

Tulsa Tulsa, Creek, Osage, Rogers All year 79 44 123

OR Ashland, Crater Lake Jackson, Klamath All year 87 44 131

Beaverton Washington All year 98 44 142

Bend Deschutes 1/1 - 6/30 90 44 1347/1 - 8/31 124 44 1689/1 - 12/31 90 44 134

Clackamas Clackamas All year 85 39 124

Eugene, Florence Lane All year 100 44 144

Lincoln City Lincoln 1/1 - 6/30 86 49 1357/1 - 8/31 112 49 1619/1 - 12/31 86 49 135

Portland Multnomah All year 116 49 165

Seaside Clatsop 1/1 - 6/30 89 54 1437/1 - 8/31 132 54 1869/1 - 12/31 89 54 143

PA Allentown, Easton, Lehigh, Northampton All year 91 44 135Bethlehem

Bucks County Bucks All year 102 59 161

Chester, Radnor, Delaware All year 107 44 151Essington

Erie Erie All year 92 39 131

Gettysburg Adams 1/1 - 3/31 78 54 1324/1 - 10/31 103 54 15711/1 - 12/31 78 54 132

Harrisburg Dauphin (except City of Hershey) All year 99 44 143

Hershey City limits of Hershey 1/1 - 2/28 91 44 1353/1 - 5/31 97 44 1416/1 - 9/30 159 44 20310/1 - 12/31 91 44 135

Publication 1542 (October 2008) Page 37

Page 38 of 44 of Publication 1542 14:26 - 16-OCT-2008

The type and rule above prints on all proofs including departmental reproduction proofs. MUST be removed before printing.

Table 4. (Effective October 1, 2008 – September 30, 2009) (Continued)

Per Diem Locality Computing Maximum Rate

Maximum Maximum Lodging M&IE Per Diem

State Key City2 County and/or Other Defined Location3,4 Effective Dates Rate Rate Rate

PA Lancaster Lancaster All year $ 95 $49 $144

Malvern, Frazer, Chester All year 122 49 171Berwyn, Phoenixville

Mechanicsburg Cumberland All year 84 54 138

Montgomery County Montgomery All year 128 59 187

Philadelphia Philadelphia 1/1 - 8/31 155 64 2199/1 - 11/30 166 64 23012/1 - 12/31 155 64 219

Pittsburgh Allegheny All year 114 54 168

Reading Berks All year 98 44 142

Scranton Lackawanna All year 80 39 119

State College Centre All year 88 44 132

RI East Greenwich, Kent, Washington All year 103 49 152Warwick, NorthKingstown

Jamestown, Middletown, Newport 1/1 - 5/31 120 64 184Newport 6/1 - 9/30 178 64 242

10/1 - 12/31 120 64 184

Providence Providence All year 145 54 199

SC Aiken Aiken All year 81 39 120

Charleston Charleston, Berkeley, Dorchester All year 141 54 195

Columbia Richland All year 92 44 136

Greenville Greenville All year 92 49 141

Hilton Head Beaufort 1/1 - 3/31 98 54 1524/1 - 8/31 144 54 1989/30 - 10/31 114 54 16811/1 - 12/31 98 54 152

Myrtle Beach Horry 1/1 - 2/28 70 54 1243/1 - 8/31 114 54 1689/1 - 10/31 86 54 14011/1 - 12/31 70 54 124

SD Hot Springs Fall River, Custer 1/1 - 5/31 70 39 1096/1 - 8/31 92 39 1319/1 - 12/31 70 39 109

Rapid City Pennington 1/1 - 5/31 70 44 1146/1 - 8/31 109 44 1539/1 - 12/31 70 44 114

Sturgis, Spearfish Meade, Butte, Lawrence 1/1 - 4/30 70 44 1145/1 - 8/31 95 44 1399/1 - 12/31 70 44 114

TN Brentwood, Franklin Williamson All year 101 49 150

Chattanooga Hamilton All year 87 44 131

Knoxville Knox All year 83 49 132

Memphis Shelby All year 99 49 148

Nashville Davidson All year 117 54 171

Oak Ridge Anderson All year 86 39 125

Page 38 Publication 1542 (October 2008)

Page 39 of 44 of Publication 1542 14:26 - 16-OCT-2008

The type and rule above prints on all proofs including departmental reproduction proofs. MUST be removed before printing.

Table 4. (Effective October 1, 2008 – September 30, 2009) (Continued)

Per Diem Locality Computing Maximum Rate

Maximum Maximum Lodging M&IE Per Diem

State Key City2 County and/or Other Defined Location3,4 Effective Dates Rate Rate Rate

TX Arlington, Fort Worth, Tarrant; City limits of Grapevine All year $149 $44 $193Grapevine

Austin Travis 1/1 - 3/31 114 54 1684/1 - 8/31 107 54 1619/1 - 12/31 114 54 168

Beaumont Jefferson All year 82 49 131

College Station Brazos All year 86 39 125

Corpus Christi Nueces All year 89 44 133

Dallas Dallas; City limits of Dallas 1/1 - 3/31 129 59 1884/1 - 12/31 115 59 174

El Paso El Paso All year 92 44 136

Galveston Galveston 1/1 - 5/31 99 49 1486/1 - 7/31 121 49 1708/1 - 12/31 99 49 148

Houston Montgomery, Fort Bend, Harris; L.B. Johnson Space All year 110 59 169Center

Hunt County Hunt All year 81 39 120

Laredo Webb All year 88 44 132

McAllen Hidalgo All year 84 44 128

Plano Collin All year 108 49 157

Round Rock Williamson All year 95 44 139

San Antonio Bexar All year 117 54 171

South Padre Island Cameron 1/1 - 5/31 84 44 1286/1 - 7/31 110 44 1548/1 - 12/31 84 44 128

Waco McLennan All year 85 39 124

UT Park City Summit 1/1 - 3/31 164 64 2284/1 - 12/31 91 64 155

Provo Utah All year 86 49 135

Salt Lake City Salt Lake, Tooele 1/1 - 3/31 116 54 1704/1 - 12/31 102 54 156

VA Cities of Alexandria, 1/1 - 6/30 209 64 273Fairfax, and Falls 7/1 - 8/31 165 64 229Church, and the 9/1 - 10/31 233 64 297counties of Arlington 11/1 - 12/31 209 64 273and Fairfax

Abington Washington 1/1 - 3/31 79 49 1284/1 - 5/31 72 49 1216/1 - 12/31 79 49 128

Blacksburg Montgomery All year 80 54 134

Charlottesville City of Charlottesville; Albemarle, Greene All year 100 44 144

Chesapeake, Suffolk Cities of Chesapeake, Suffolk 1/1 - 3/31 89 44 1334/1 - 5/31 97 44 1416/1 - 8/31 107 44 1519/1 - 12/31 89 44 133

Chesterfield, Henrico Chesterfield, Henrico All year 93 49 142Counties

Fredericksburg City of Fredericksburg; Spotsylvania All year 74 54 128

Hampton City, Newport Cities of Hampton City, Newport News All year 81 44 125News

Publication 1542 (October 2008) Page 39

Page 40 of 44 of Publication 1542 14:26 - 16-OCT-2008

The type and rule above prints on all proofs including departmental reproduction proofs. MUST be removed before printing.

Table 4. (Effective October 1, 2008 – September 30, 2009) (Continued)

Per Diem Locality Computing Maximum Rate

Maximum Maximum Lodging M&IE Per Diem

State Key City2 County and/or Other Defined Location3,4 Effective Dates Rate Rate Rate

VA James City and York James City and York Counties; City of Williamsburg 1/1 - 3/31 $ 75 $54 $129Counties; Williamsburg 4/1 - 8/31 97 54 151

9/1 - 12/31 75 54 129

Loudon County Loudon All year 140 59 199

Lynchburg Campbell; City of Lynchburg All year 78 44 122

Manassas City of Manassas All year 101 39 140

Norfolk, Portsmouth Cities of Norfolk, Portsmouth All year 96 59 155

Richmond City City of Richmond 1/1 - 8/31 123 54 1779/1 - 10/31 129 54 18311/1 - 12/31 123 54 177

Roanoke City limits of Roanoke All year 96 44 140

Stafford, Prince William Stafford, Prince William All year 95 44 139Counties

Virginia Beach City of Virginia Beach 1/1 - 5/31 88 54 1426/1 - 8/31 151 54 2059/1 - 12/31 88 54 142

Wallops Island Accomack 1/1 - 6/30 87 49 1367/1 - 8/31 121 49 1709/1 - 12/31 87 49 136

Warrenton Fauquier All year 99 44 143

VT Burlington, St. Albans Chittenden, Franklin 1/1 - 4/30 90 49 1395/1 - 10/31 105 49 15411/1 - 12/31 90 49 139

Manchester Bennington All year 94 59 153

Montpelier Washington All year 93 54 147

Stowe Lamoille 1/1 - 3/31 141 64 2054/1 - 11/30 121 64 18512/1 - 12/31 141 64 205

White River Junction Windsor 1/1 - 2/28 90 54 1443/1 - 5/31 82 54 1366/1 - 12/31 90 54 144

WA Anacortes, Camano San Juan, Skagit, Island 1/1 - 5/31 84 59 143Island, Coupeville, 6/1 - 8/31 94 59 153Mount Vernon, La 9/1 - 12/31 84 59 143Connor, Burlington,Friday Harbor, OakHarbor

Bremerton Kitsap All year 83 59 142

Everett, Lynnwood Snohomish All year 99 54 153

Ocean Shores Grays Harbor 1/1 - 6/30 86 44 1307/1 - 8/31 109 44 1539/1 - 12/31 86 44 130

Olympia, Tumwater Thurston All year 86 49 135

Port Angeles, Port Clallam, Jefferson 1/1 - 6/30 92 59 151Townsend 7/1 - 8/31 129 59 188

9/1 - 12/31 92 59 151

Seattle King All year 158 64 222

Spokane Spokane All year 83 49 132

Tacoma Pierce All year 118 59 177

Vancouver Clark, Cowlitz, Skamania All year 120 49 169

Page 40 Publication 1542 (October 2008)

Page 41 of 44 of Publication 1542 14:26 - 16-OCT-2008

The type and rule above prints on all proofs including departmental reproduction proofs. MUST be removed before printing.

Table 4. (Effective October 1, 2008 – September 30, 2009) (Continued)

Per Diem Locality Computing Maximum Rate

Maximum Maximum Lodging M&IE Per Diem

State Key City2 County and/or Other Defined Location3,4 Effective Dates Rate Rate Rate

WI Appleton Outagamie All year $ 81 $44 $125

Brookfield, Racine Waukesha, Racine All year 92 44 136

Green Bay Brown All year 75 44 119

Lake Geneva Walworth 1/1 - 4/30 98 54 1525/1 - 9/30 146 54 20010/1 - 12/31 98 54 152

Madison Dane All year 90 54 144

Milwaukee Milwaukee All year 99 44 143

Sheboygan Sheboygan All year 79 44 123

Sturgeon Bay Door 1/1 - 6/30 70 49 1197/1 - 9/30 88 49 13710/1 - 12/31 70 49 119

Wisconsin Dells Columbia 1/1 - 6/30 70 64 1347/1 - 8/31 86 64 1509/1 - 12/31 70 64 134

WV Charleston Kanawha All year 95 44 139

Morgantown Monongalia All year 83 44 127

Shepherdstown Jefferson All year 80 44 124

Wheeling Ohio All year 93 44 137

WY Cody Park 1/1 - 4/30 75 44 1195/1 - 9/30 110 44 15410/1 - 12/31 75 44 119

Evanston, Rock Springs Uinta, Sweetwater All year 91 44 135

Gillette Campbell 1/1 - 6/30 85 49 1347/1 - 8/31 104 49 1539/1 - 12/31 85 49 134

Jackson, Pinedale Teton, Sublette 1/1 - 6/30 113 54 1677/1 - 8/31 164 54 2189/1 - 11/30 104 54 15812/1 - 12/31 113 54 167

Sheridan Sheridan 1/1 - 5/31 70 49 1196/1 - 8/31 90 49 1399/1 - 12/31 70 49 119

1Transition rule. In lieu of the updated GSA rates that will be effective 4When a military installation or Government-related facility (whether or notOctober 1, 2009, taxpayers may continue to use the CONUS rates in effect for specifically named) is located partially within more than one city or countythe first 9 months of 2009 (Table 4) for expenses of all CONUS travel away boundary, the applicable per diem rate for the entire installation or facility isfrom home that are paid or incurred during calendar year 2009. A taxpayer the higher of the two rates which apply to the cities and/or counties, evenmust consistently use either these rates or the updated rates for the period of though part(s) of such activities may be located outside the defined per diemOctober 1, 2009, through December 31, 2009. See Transition Rules under locality.How To Use Per Diem Rate Tables for an example.

Note: Recognizing that all locations are not incorporated cities, the term “city2Unless otherwise specified, the per diem locality is defined as “all locations limits” has been used as a general phrase to denote the commonly recognized

within, or entirely surrounded by, the corporate limits of the key city, including local boundaries of the location cited.independent entities located within those boundaries.”

3Per diem localities with county definitions shall include “all locations within,or entirely surrounded by, the corporate limits of the key city as well as theboundaries of the listed counties, including independent entities located withinthe boundaries of the key city and the listed counties (unless otherwise listedseparately).”

Publication 1542 (October 2008) Page 41

Page 42 of 44 of Publication 1542 14:26 - 16-OCT-2008

The type and rule above prints on all proofs including departmental reproduction proofs. MUST be removed before printing.

For more information on these programs, go to www.irs.gov and enter keyword “VITA” in the upperHow To Get Tax Helpright-hand corner.

You can get help with unresolved tax issues, order free Internet. You can access the IRS website atpublications and forms, ask tax questions, and get informa- www.irs.gov 24 hours a day, 7 days a week to:tion from the IRS in several ways. By selecting the methodthat is best for you, you will have quick and easy access totax help. • E-file your return. Find out about commercial tax

preparation and e-file services available free to eligi-Contacting your Taxpayer Advocate. The Taxpayerble taxpayers.Advocate Service (TAS) is an independent organization

within the IRS whose employees assist taxpayers who are • Check the status of your 2008 refund. Go to www.experiencing economic harm, who are seeking help in irs.gov and click on Where’s My Refund. Wait atresolving tax problems that have not been resolved least 72 hours after the IRS acknowledges receipt ofthrough normal channels, or who believe that an IRS your e-filed return, or 3 to 4 weeks after mailing asystem or procedure is not working as it should. paper return. If you filed Form 8379 with your return,

You can contact the TAS by calling the TAS toll-freewait 14 weeks (11 weeks if you filed electronically).case intake line at 1-877-777-4778 or TTY/TDDHave your 2008 tax return available so you can1-800-829-4059 to see if you are eligible for assistance.provide your social security number, your filing sta-You can also call or write your local taxpayer advocate,tus, and the exact whole dollar amount of your re-whose phone number and address are listed in your localfund.telephone directory and in Publication 1546, Taxpayer

Advocate Service—Your Voice at the IRS. You can file • Download forms, instructions, and publications.Form 911, Request for Taxpayer Advocate Service Assis- • Order IRS products online.tance (And Application for Taxpayer Assistance Order), orask an IRS employee to complete it on your behalf. For • Research your tax questions online.more information, go to www.irs.gov/advocate. • Search publications online by topic or keyword.

Low Income Taxpayer Clinics (LITCs). LITCs are in- • View Internal Revenue Bulletins (IRBs) published independent organizations that provide low income taxpay-the last few years.ers with representation in federal tax controversies with the

IRS for free or for a nominal charge. The clinics also • Figure your withholding allowances using the with-provide tax education and outreach for taxpayers who holding calculator online at www.irs.gov/individuals.speak English as a second language. Publication 4134,

• Determine if Form 6251 must be filed by using ourLow Income Taxpayer Clinic List, provides information onAlternative Minimum Tax (AMT) Assistant.clinics in your area. It is available at www.irs.gov or your

local IRS office. • Sign up to receive local and national tax news byemail.Free tax services. To find out what services are avail-

able, get Publication 910, IRS Guide to Free Tax Services. • Get information on starting and operating a smallIt contains lists of free tax information sources, including business.publications, services, and free tax education and assis-tance programs. It also has an index of over 100 TeleTaxtopics (recorded tax information) you can listen to on your Phone. Many services are available by phone. telephone.

Accessible versions of IRS published products areavailable on request in a variety of alternative formats forpeople with disabilities. • Ordering forms, instructions, and publications. Call

1-800-829-3676 to order current-year forms, instruc-Free help with your return. Free help in preparing yourtions, and publications, and prior-year forms and in-return is available nationwide from IRS-trained volunteers.structions. You should receive your order within 10The Volunteer Income Tax Assistance (VITA) program isdays.designed to help low-income taxpayers and the Tax Coun-

seling for the Elderly (TCE) program is designed to assist • Asking tax questions. Call the IRS with your taxtaxpayers age 60 and older with their tax returns. Many questions at 1-800-829-1040.VITA sites offer free electronic filing and all volunteers will

• Solving problems. You can get face-to-face helplet you know about credits and deductions you may besolving tax problems every business day in IRS Tax-entitled to claim. To find the nearest VITA or TCE site, callpayer Assistance Centers. An employee can explain1-800-829-1040.IRS letters, request adjustments to your account, orAs part of the TCE program, AARP offers the Tax-Aidehelp you set up a payment plan. Call your localcounseling program. To find the nearest AARP Tax-AideTaxpayer Assistance Center for an appointment. Tosite, call 1-888-227-7669 or visit AARP’s website at

www.aarp.org/money/taxaide. find the number, go to www.irs.gov/localcontacts or

Page 42 Publication 1542 (October 2008)

Page 43 of 44 of Publication 1542 14:26 - 16-OCT-2008

The type and rule above prints on all proofs including departmental reproduction proofs. MUST be removed before printing.

look in the phone book under United States Govern- where you can spread out your records and talk withment, Internal Revenue Service. an IRS representative face-to-face. No appointment

is necessary—just walk in. If you prefer, you can call• TTY/TDD equipment. If you have access to TTY/your local Center and leave a message requestingTDD equipment, call 1-800-829-4059 to ask taxan appointment to resolve a tax account issue. Aquestions or to order forms and publications.representative will call you back within 2 business

• TeleTax topics. Call 1-800-829-4477 to listen to days to schedule an in-person appointment at yourpre-recorded messages covering various tax topics. convenience. If you have an ongoing, complex tax

account problem or a special need, such as a disa-• Refund information. To check the status of yourbility, an appointment can be requested. All other2008 refund, call 1-800-829-1954 during business

hours or 1-800-829-4477 (automated refund infor- issues will be handled without an appointment. Tomation 24 hours a day, 7 days a week). Wait at least find the number of your local office, go to 72 hours after the IRS acknowledges receipt of your www.irs.gov/localcontacts or look in the phone booke-filed return, or 3 to 4 weeks after mailing a paper under United States Government, Internal Revenuereturn. If you filed Form 8379 with your return, wait Service.14 weeks (11 weeks if you filed electronically). Haveyour 2008 tax return available so you can provide Mail. You can send your order for forms, instruc-your social security number, your filing status, and tions, and publications to the address below. Youthe exact whole dollar amount of your refund. Re- should receive a response within 10 days afterfunds are sent out weekly on Fridays. If you check your request is received.the status of your refund and are not given the dateit will be issued, please wait until the next week

Internal Revenue Servicebefore checking back.1201 N. Mitsubishi Motorway• Other refund information. To check the status of a Bloomington, IL 61705-6613

prior year refund or amended return refund, call1-800-829-1954. DVD for tax products. You can order Publication

1796, IRS Tax Products DVD, and obtain:

Evaluating the quality of our telephone services. Toensure IRS representatives give accurate, courteous, and • Current-year forms, instructions, and publications.professional answers, we use several methods to evaluatethe quality of our telephone services. One method is for a • Prior-year forms, instructions, and publications.second IRS representative to listen in on or record random • Tax Map: an electronic research tool and finding aid.telephone calls. Another is to ask some callers to completea short survey at the end of the call. • Tax law frequently asked questions.

• Tax Topics from the IRS telephone response sys-Walk-in. Many products and services are avail- tem.able on a walk-in basis.

• Internal Revenue Code—Title 26 of the U.S. Code.

• Fill-in, print, and save features for most tax forms.• Products. You can walk in to many post offices,libraries, and IRS offices to pick up certain forms, • Internal Revenue Bulletins.instructions, and publications. Some IRS offices, li-

• Toll-free and email technical support.braries, grocery stores, copy centers, city and countygovernment offices, credit unions, and office supply • Two releases during the year.stores have a collection of products available to print – The first release will ship the beginning of Januaryfrom a CD or photocopy from reproducible proofs. 2009.Also, some IRS offices and libraries have the Inter-

– The final release will ship the beginning of Marchnal Revenue Code, regulations, Internal Revenue2009.Bulletins, and Cumulative Bulletins available for re-

search purposes.Purchase the DVD from National Technical Information

• Services. You can walk in to your local Taxpayer Service (NTIS) at www.irs.gov/cdorders for $30 (no han-Assistance Center every business day for personal, dling fee) or call 1-877-233-6767 toll free to buy the DVDface-to-face tax help. An employee can explain IRS for $30 (plus a $6 handling fee). The price is discounted toletters, request adjustments to your tax account, or $25 for orders placed prior to December 1, 2008.help you set up a payment plan. If you need to

Small Business Resource Guide 2009. Thisresolve a tax problem, have questions about how theonline guide is a must for every small businesstax law applies to your individual tax return, or youowner or any taxpayer about to start a business.are more comfortable talking with someone in per-

This year’s guide includes:son, visit your local Taxpayer Assistance Center

Publication 1542 (October 2008) Page 43

Page 44 of 44 of Publication 1542 14:26 - 16-OCT-2008

The type and rule above prints on all proofs including departmental reproduction proofs. MUST be removed before printing.

• Helpful information, such as how to prepare a busi- • A site map of the guide to help you navigate theness plan, find financing for your business, and pages with ease.much more. • An interactive “Teens in Biz” module that gives prac-

• All the business tax forms, instructions, and publica- tical tips for teens about starting their own business,tions needed to successfully manage a business. creating a business plan, and filing taxes.

• Tax law changes for 2009. The information is updated during the year. Visit • Tax Map: an electronic research tool and finding aid. www.irs.gov and enter keyword “SBRG” in the upper

right-hand corner for more information.• Web links to various government agencies, businessassociations, and IRS organizations.

• “Rate the Product” survey—your opportunity to sug-gest changes for future editions.

Page 44 Publication 1542 (October 2008)


Recommended