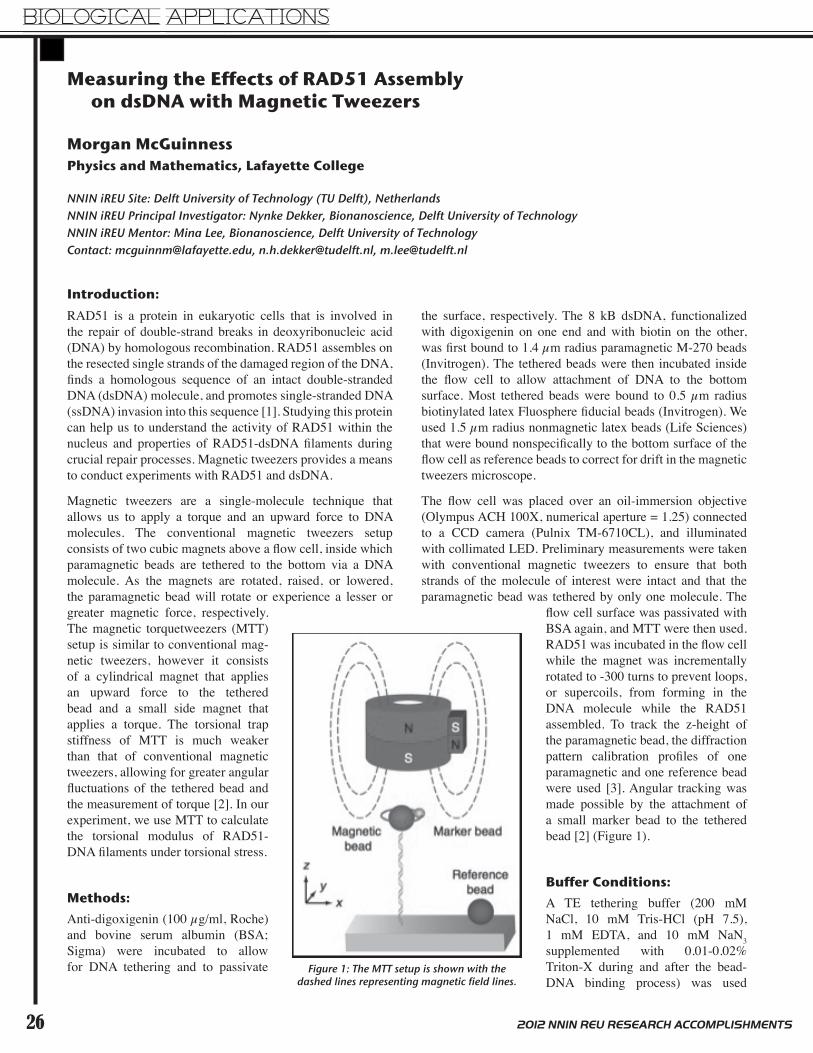
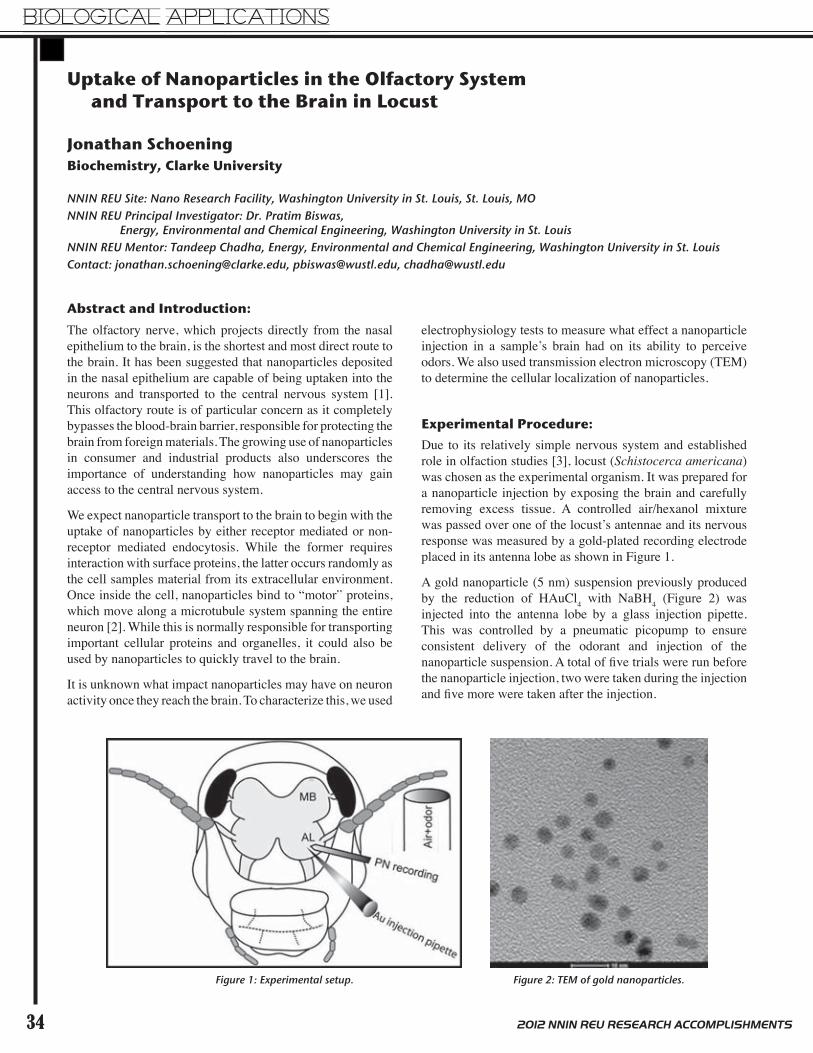
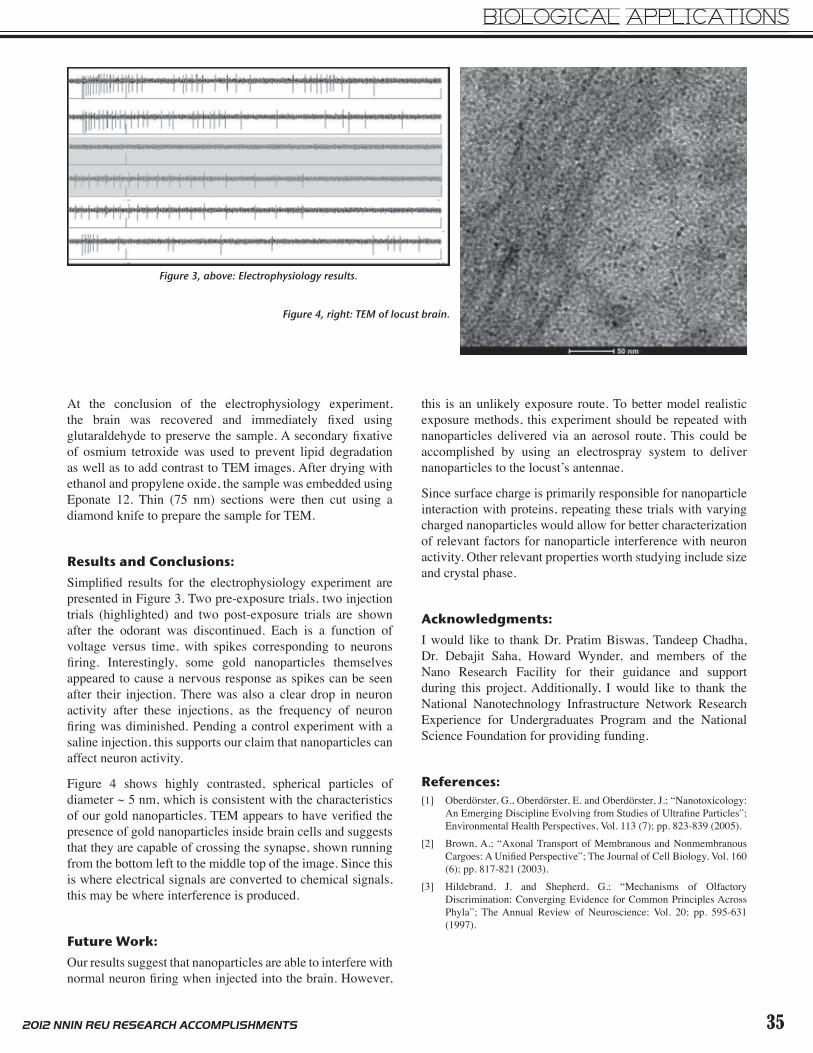
BIOLOGICAL APPLICATIONS 2 2012 NNIN REU RESEARCH ACCOMPLISHMENTS Patterning of Biomolecules Using Dip Pen Nanolithography Ali Abdallah Biomedical Engineering, Wayne State University NNIN REU Site: Lurie Nanofabrication Facility, University of Michigan, Ann Arbor, MI NNIN REU Principal Investigator: Dr. Edgar Meyofer, Mechanical Engineering, University of Michigan NNIN REU Mentor: Dr. Pilar Herrera-Fierro, Electrical Engineering and Computer Science, University of Michigan Contact: [email protected], [email protected], [email protected]Introduction: Kinesin and dynein are biomolecular motors in eukaryotic cells that transport intracellular cargoes along the cytoskeletal networks of microtubules in opposite directions. Interestingly, these proteins bind to the same cargo and are widely believed to be responsible for the bidirectional transport of cargoes [1, 2]. While the basic working principles of individual bimolecular motors are now understood in some detail, how multiple motors interact in the cells remains entirely unclear. This work’s goal was to precisely pattern motors using Dip Pen Nanolithography (DPN) such that their interactions can be studied in vitro. NanoInk’s DPN 5000 was used to carry out the patterning process. First, however, another protein, bovine serum albumin (BSA), a less costly and readily available protein, was patterned to develop the proper methodology of patterning. Subsequently, the approach developed for BSA will be translated to patterning the motors. Patterned motors will be examined for ATPase activity and microtubule gliding to ensure functionality in in vitro motility assays. Experimental Procedure: First, fluorescently labeled bovine serum albumin (BSA), a less costly and readily available protein, was patterned to develop the proper methodology of patterning. Subsequently, the approach developed for BSA will be translated to patterning the motors. BSA is in solution of concentration 2.62 g/L. A 1:10 mixture was composed of it and a mixture of 40% glycerol and 60% Brinkley reassociation buffer (BRB 80). We used an A-tip type probe from Nanoink, a probe with a single cantilever tip, and made a ten-dot, five-second dwell time per dot pattern. Using the fluorescing of the fluorescently- labeled BSA, these patterns were viewed using an Olympus BX-51 fluorescence microscope. To properly examine the proper protocol for patterning, tip loading, bleeding, and the use of different substrates were examined. We experimented with loading the tip by using ink wells provided by NanoInk, pipetting the ink directly atop the tip, and manually guiding the tip into a pipetted droplet. After we determined which loading method to use, we examined whether the tip must be pre-bled by patterning multiple patterns under known working conditions established from ink that NanoInk provided and examined results under the microscope. Finally, we prepared clean cover glasses differently ensuring the substrate was solely glass. The substrates were prepared as follows: O 2 plasma treated surface, 30 second hydroflouric acid (HF) bathed surface, supercritical CO 2 sprayed surface, and a surface with the following recipe: 30 second HF bath, eight-minute de-ionized rocker bath, two-minute annealing at 300°C, Omnicoat ® spun on surface for 10 seconds at 500 rpm and 20 seconds at 3000 rpm, one-minute annealing at 300°C, SU-8 5 spun under same conditions with a three-minute annealing time at 65°C, two-minute SU-8 developer bath, and finally an isopropanol rinse of the substrate. We examined the preferred surface by patterning on the substrates and examining the surface hydrophobicity using a goniometer from Ramé Hart Instruments Co. Results and Conclusions: When placed under the fluorescence microscope, ink was not visible from either the ink well or pipetting method. We then tried manually guiding the tip into the ink and found an abundant amount of ink on the tip (shown in Figure 1). We also found that sonicating the tip in acetone helped the Figure 1: Microscopic image of fluorescent ink atop tip when tip is manually guided.
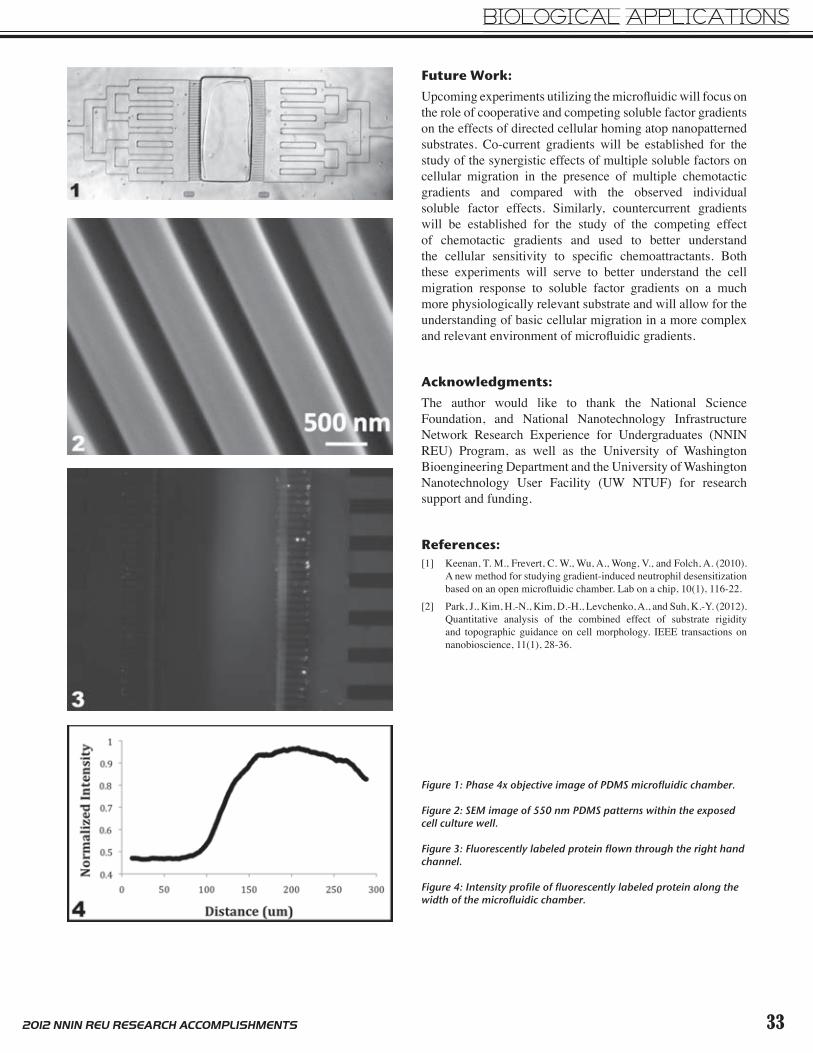
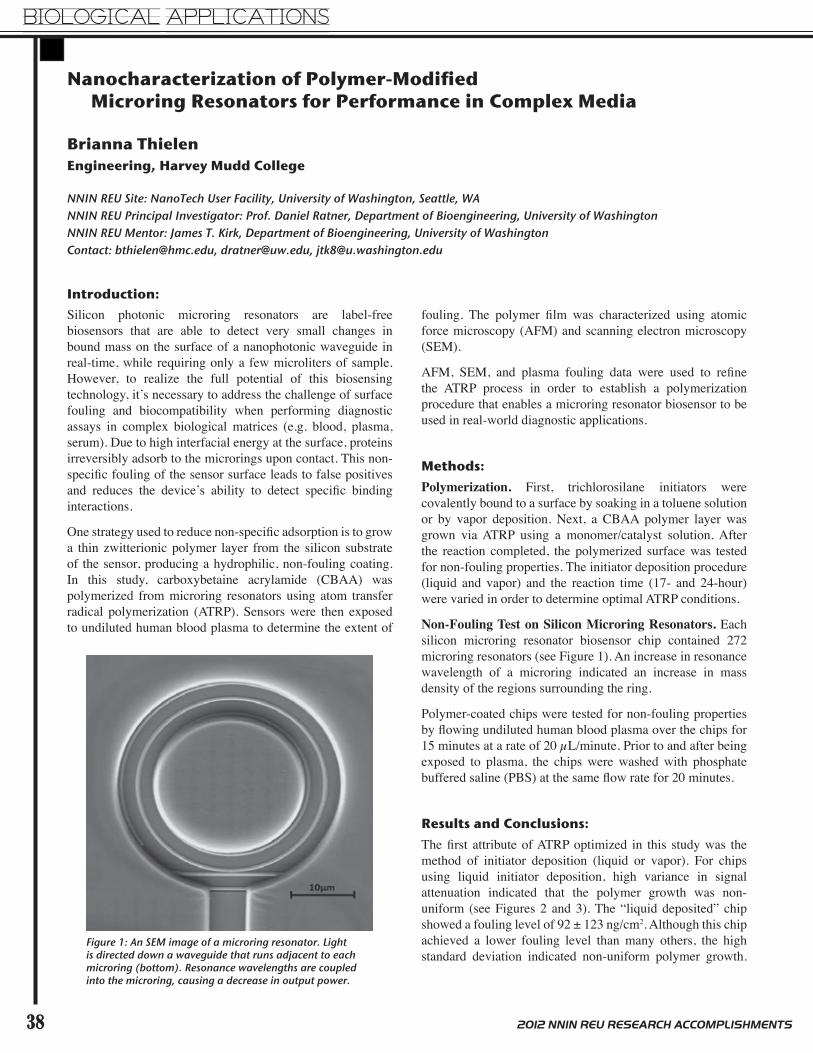
Transcript
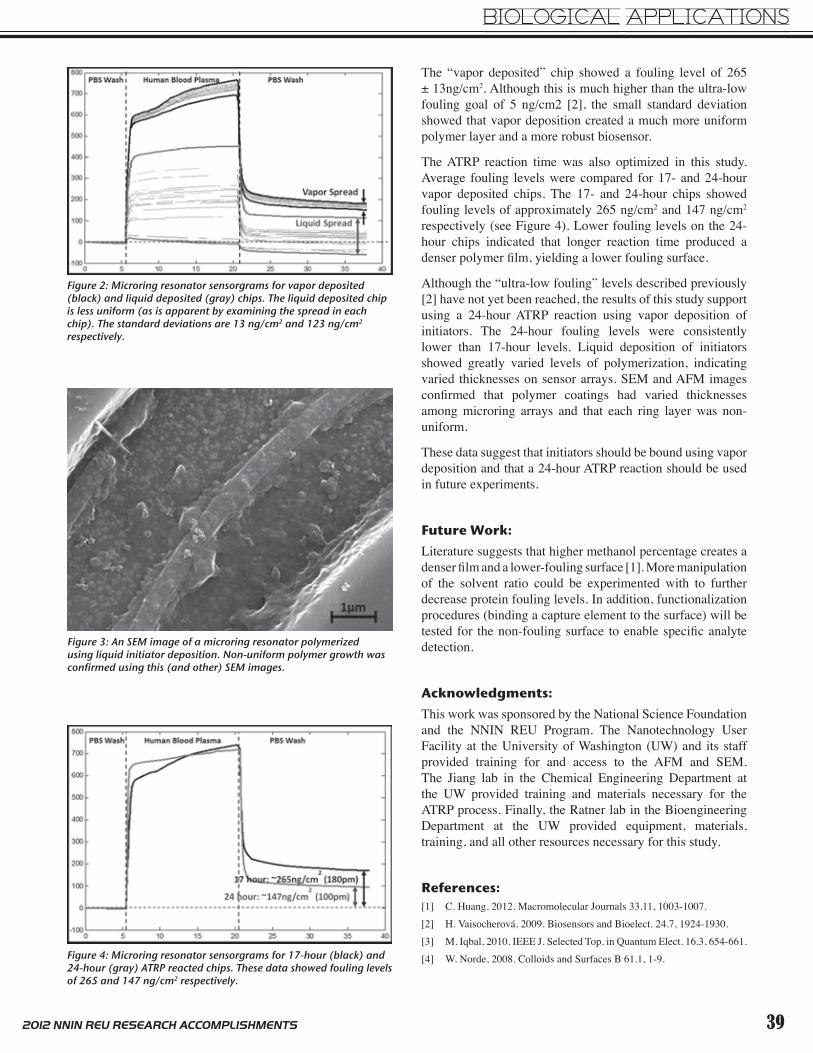
BIOLOGICAL APPLICATIONS
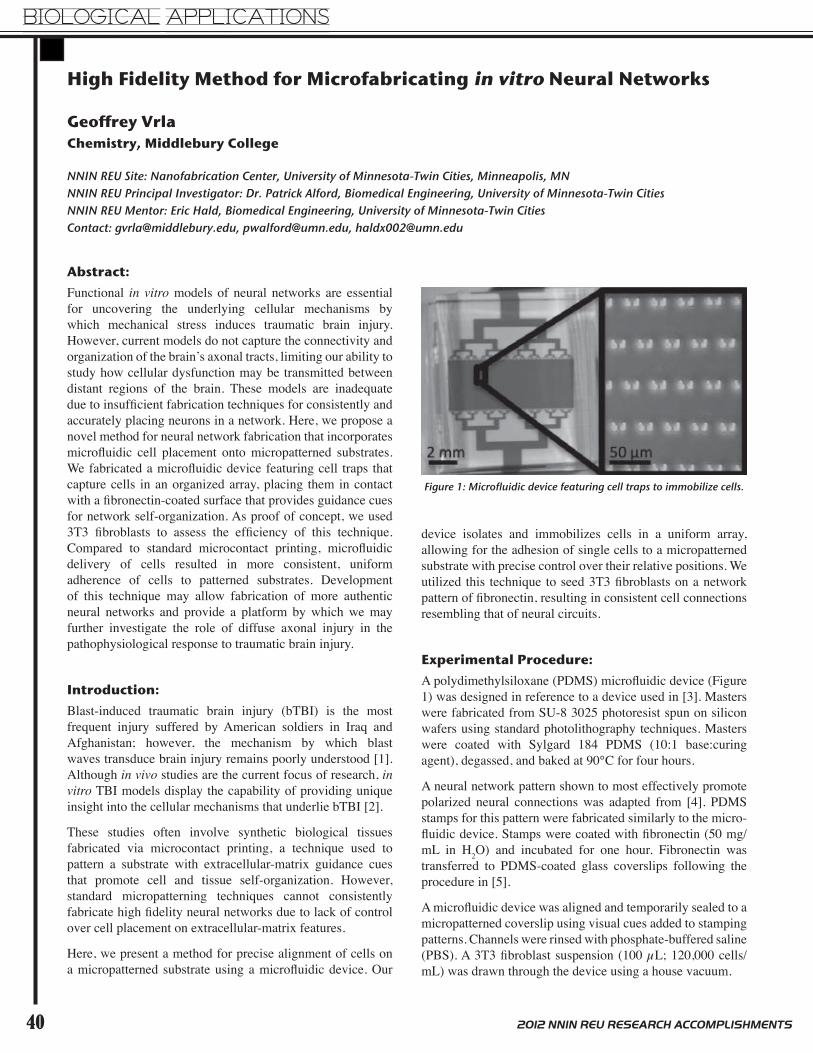
2 2012 NNIN REU RESEARCH ACCOMPLISHMENTS
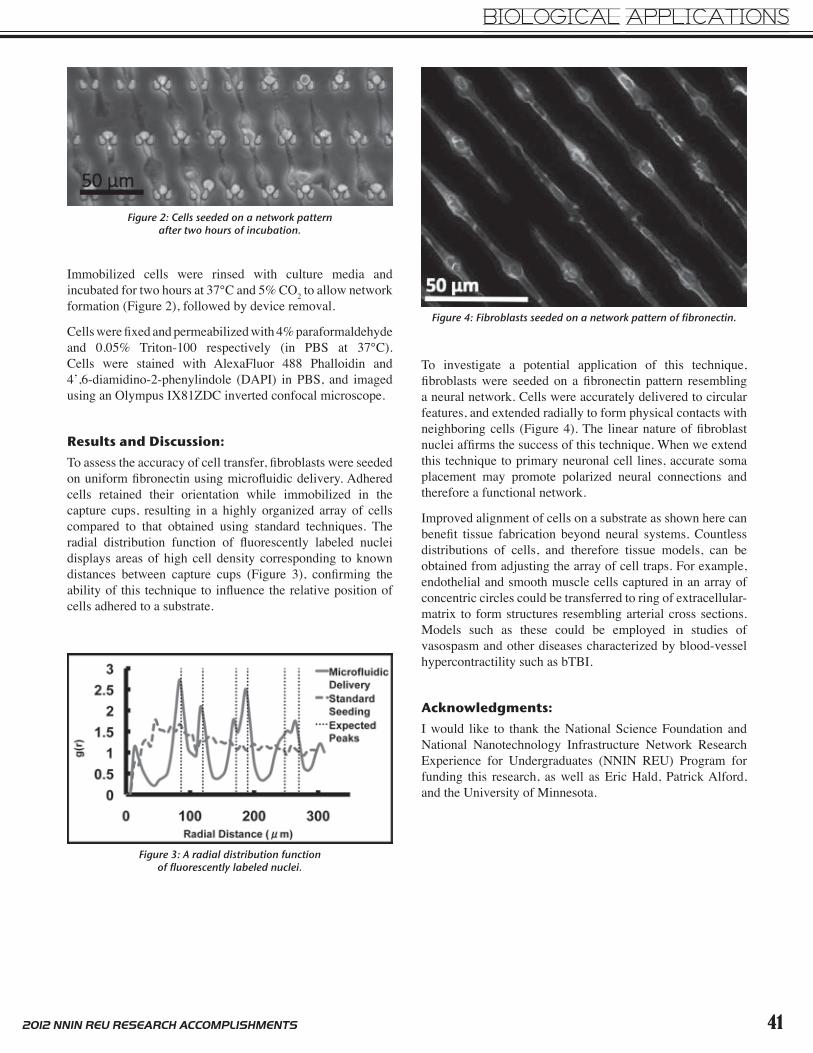
Patterning of Biomolecules Using Dip Pen Nanolithography
Ali AbdallahBiomedical Engineering, Wayne State University
NNIN REU Site: Lurie Nanofabrication Facility, University of Michigan, Ann Arbor, MI NNIN REU Principal Investigator: Dr. Edgar Meyofer, Mechanical Engineering, University of MichiganNNIN REU Mentor: Dr. Pilar Herrera-Fierro, Electrical Engineering and Computer Science, University of MichiganContact: [email protected], [email protected], [email protected]
Introduction:Kinesin and dynein are biomolecular motors in eukaryotic cells that transport intracellular cargoes along the cytoskeletal networks of microtubules in opposite directions. Interestingly, these proteins bind to the same cargo and are widely believed to be responsible for the bidirectional transport of cargoes [1, 2]. While the basic working principles of individual bimolecular motors are now understood in some detail, how multiple motors interact in the cells remains entirely unclear.
This work’s goal was to precisely pattern motors using Dip Pen Nanolithography (DPN) such that their interactions can be studied in vitro. NanoInk’s DPN 5000 was used to carry out the patterning process. First, however, another protein, bovine serum albumin (BSA), a less costly and readily available protein, was patterned to develop the proper methodology of patterning. Subsequently, the approach developed for BSA will be translated to patterning the motors. Patterned motors will be examined for ATPase activity and microtubule gliding to ensure functionality in in vitro motility assays.
Experimental Procedure:First, fluorescently labeled bovine serum albumin (BSA), a less costly and readily available protein, was patterned to develop the proper methodology of patterning. Subsequently, the approach developed for BSA will be translated to patterning the motors. BSA is in solution of concentration 2.62 g/L. A 1:10 mixture was composed of it and a mixture of 40% glycerol and 60% Brinkley reassociation buffer (BRB 80). We used an A-tip type probe from Nanoink, a probe with a single cantilever tip, and made a ten-dot, five-second dwell time per dot pattern. Using the fluorescing of the fluorescently-labeled BSA, these patterns were viewed using an Olympus BX-51 fluorescence microscope.
To properly examine the proper protocol for patterning, tip loading, bleeding, and the use of different substrates were examined. We experimented with loading the tip by using ink wells provided by NanoInk, pipetting the ink directly atop the tip, and manually guiding the tip into a pipetted droplet. After we determined which loading method to use, we examined whether the tip must be pre-bled by patterning multiple patterns under known working conditions established from ink that NanoInk provided and examined results under
the microscope. Finally, we prepared clean cover glasses differently ensuring the substrate was solely glass. The substrates were prepared as follows: O2 plasma treated surface, 30 second hydroflouric acid (HF) bathed surface, supercritical CO2 sprayed surface, and a surface with the following recipe: 30 second HF bath, eight-minute de-ionized rocker bath, two-minute annealing at 300°C, Omnicoat® spun on surface for 10 seconds at 500 rpm and 20 seconds at 3000 rpm, one-minute annealing at 300°C, SU-8 5 spun under same conditions with a three-minute annealing time at 65°C, two-minute SU-8 developer bath, and finally an isopropanol rinse of the substrate.
We examined the preferred surface by patterning on the substrates and examining the surface hydrophobicity using a goniometer from Ramé Hart Instruments Co.
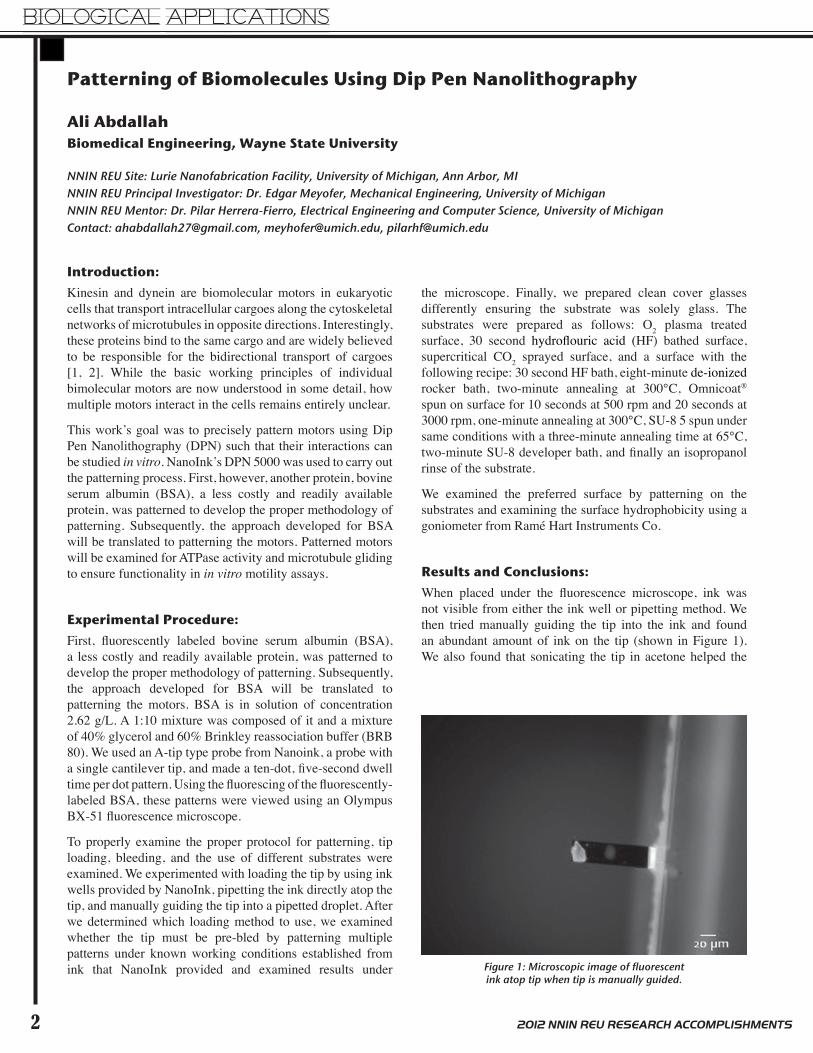
Results and Conclusions:When placed under the fluorescence microscope, ink was not visible from either the ink well or pipetting method. We then tried manually guiding the tip into the ink and found an abundant amount of ink on the tip (shown in Figure 1). We also found that sonicating the tip in acetone helped the
Figure 1: Microscopic image of fluorescentink atop tip when tip is manually guided.
BIOLOGICAL APPLICATIONS
32012 NNIN REU RESEARCH ACCOMPLISHMENTS
tip maintain ink. To further conclude the better method, patterning was conducted under each loading method and we found that the inkwell and pipetting method produced no consistent pattern while the other method did.
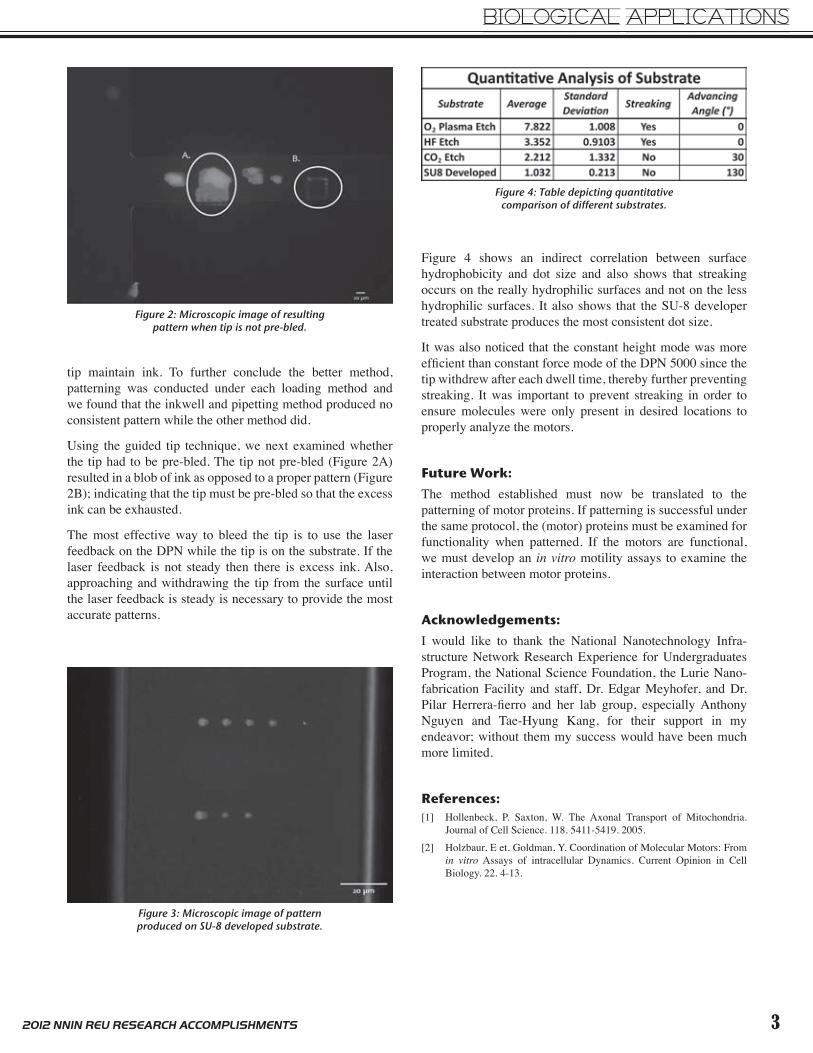
Using the guided tip technique, we next examined whether the tip had to be pre-bled. The tip not pre-bled (Figure 2A) resulted in a blob of ink as opposed to a proper pattern (Figure 2B); indicating that the tip must be pre-bled so that the excess ink can be exhausted.
The most effective way to bleed the tip is to use the laser feedback on the DPN while the tip is on the substrate. If the laser feedback is not steady then there is excess ink. Also, approaching and withdrawing the tip from the surface until the laser feedback is steady is necessary to provide the most accurate patterns.
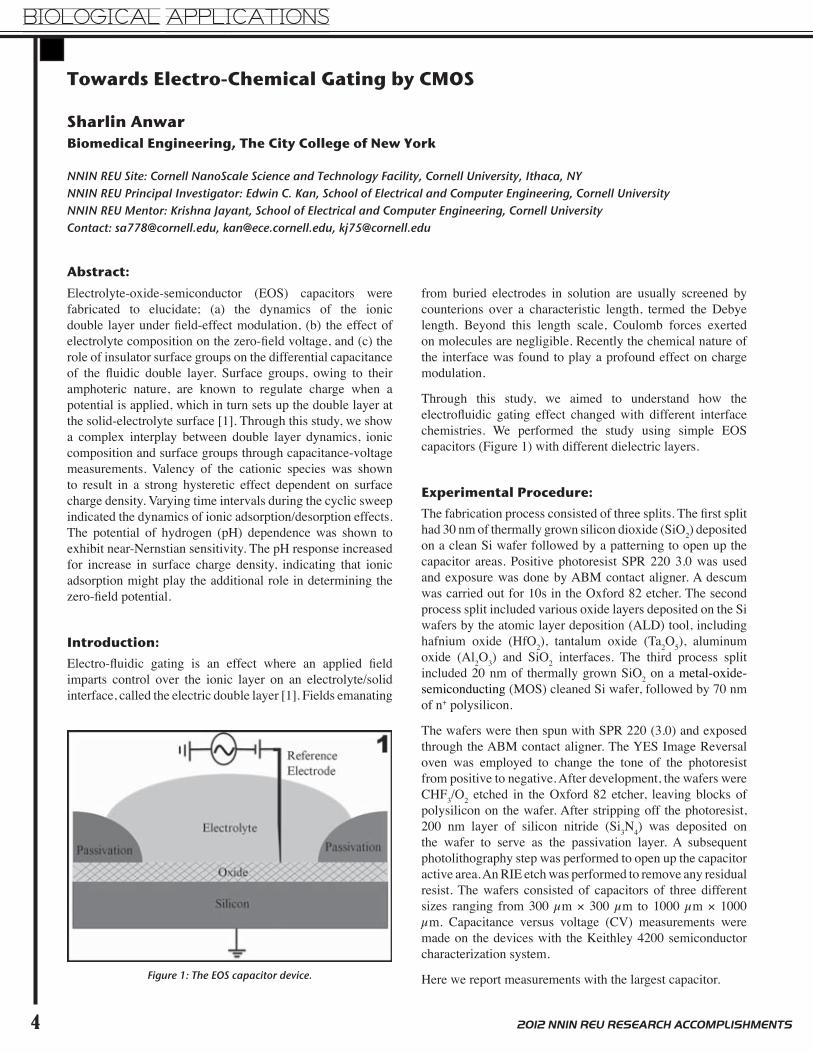
Figure 4: Table depicting quantitative comparison of different substrates.
Figure 2: Microscopic image of resulting pattern when tip is not pre-bled.
Figure 4 shows an indirect correlation between surface hydrophobicity and dot size and also shows that streaking occurs on the really hydrophilic surfaces and not on the less hydrophilic surfaces. It also shows that the SU-8 developer treated substrate produces the most consistent dot size.
It was also noticed that the constant height mode was more efficient than constant force mode of the DPN 5000 since the tip withdrew after each dwell time, thereby further preventing streaking. It was important to prevent streaking in order to ensure molecules were only present in desired locations to properly analyze the motors.
Future Work:The method established must now be translated to the patterning of motor proteins. If patterning is successful under the same protocol, the (motor) proteins must be examined for functionality when patterned. If the motors are functional, we must develop an in vitro motility assays to examine the interaction between motor proteins.
Acknowledgements:I would like to thank the National Nanotechnology Infra-structure Network Research Experience for Under graduates Program, the National Science Foundation, the Lurie Nano-fabrication Facility and staff, Dr. Edgar Meyhofer, and Dr. Pilar Herrera-fierro and her lab group, especially Anthony Nguyen and Tae-Hyung Kang, for their support in my endeavor; without them my success would have been much more limited.
References:[1] Hollenbeck, P. Saxton, W. The Axonal Transport of Mitochondria.
Journal of Cell Science. 118. 5411-5419. 2005.[2] Holzbaur, E et. Goldman, Y. Coordination of Molecular Motors: From
in vitro Assays of intracellular Dynamics. Current Opinion in Cell Biology. 22. 4-13.
Figure 3: Microscopic image of pattern produced on SU-8 developed substrate.
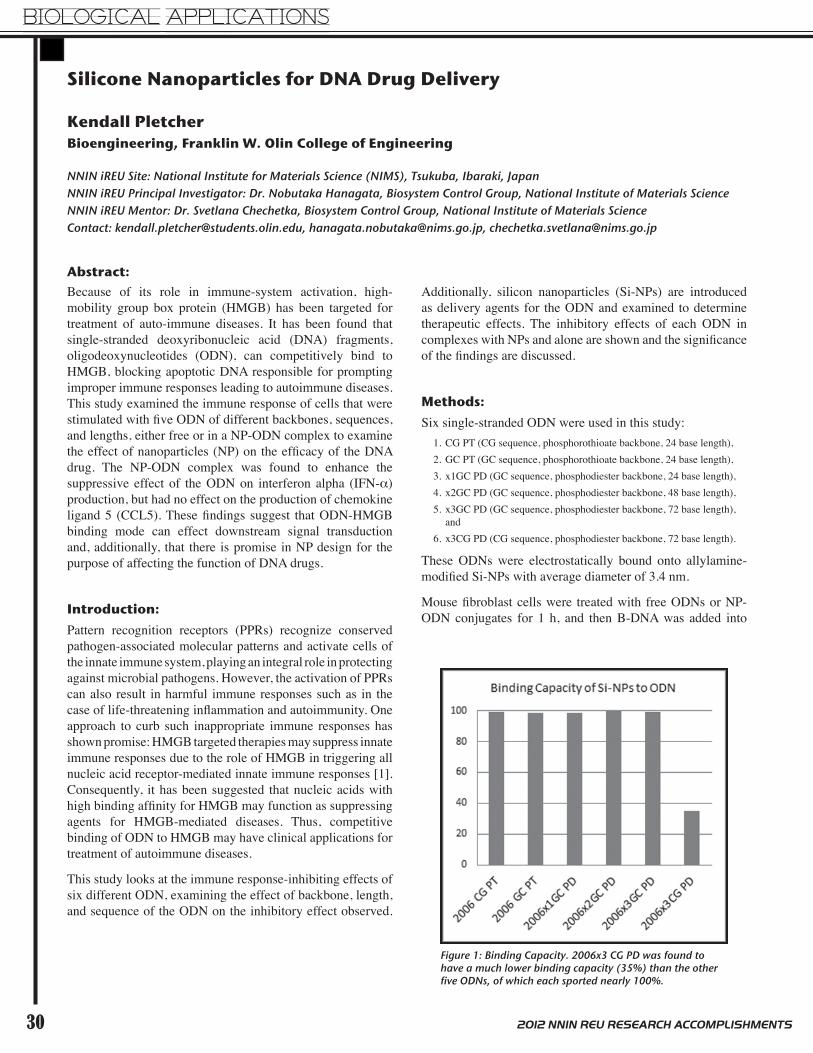
BIOLOGICAL APPLICATIONS
4 2012 NNIN REU RESEARCH ACCOMPLISHMENTS
Towards Electro-Chemical Gating by CMOS
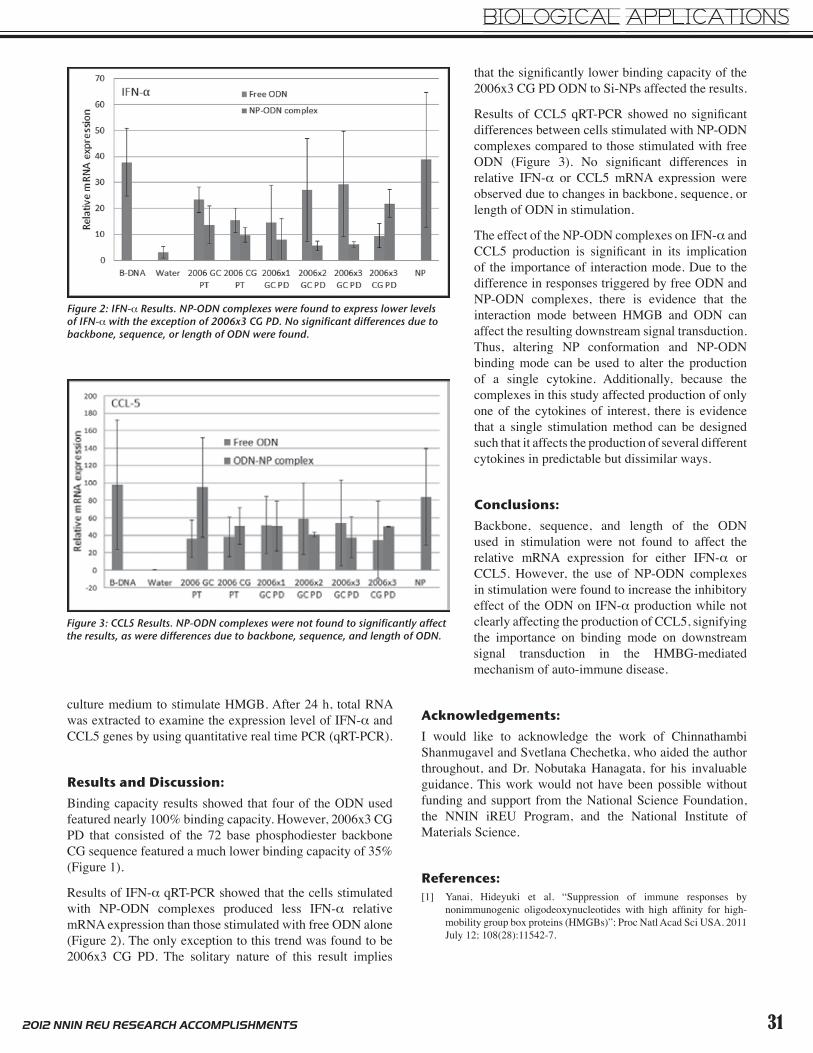
Sharlin AnwarBiomedical Engineering, The City College of New York
NNIN REU Site: Cornell NanoScale Science and Technology Facility, Cornell University, Ithaca, NY NNIN REU Principal Investigator: Edwin C. Kan, School of Electrical and Computer Engineering, Cornell UniversityNNIN REU Mentor: Krishna Jayant, School of Electrical and Computer Engineering, Cornell UniversityContact: [email protected], [email protected], [email protected]
Abstract: Electrolyte-oxide-semiconductor (EOS) capacitors were fabricated to elucidate; (a) the dynamics of the ionic double layer under field-effect modulation, (b) the effect of electrolyte composition on the zero-field voltage, and (c) the role of insulator surface groups on the differential capacitance of the fluidic double layer. Surface groups, owing to their amphoteric nature, are known to regulate charge when a potential is applied, which in turn sets up the double layer at the solid-electrolyte surface [1]. Through this study, we show a complex interplay between double layer dynamics, ionic composition and surface groups through capacitance-voltage measurements. Valency of the cationic species was shown to result in a strong hysteretic effect dependent on surface charge density. Varying time intervals during the cyclic sweep indicated the dynamics of ionic adsorption/desorption effects. The potential of hydrogen (pH) dependence was shown to exhibit near-Nernstian sensitivity. The pH response increased for increase in surface charge density, indicating that ionic adsorption might play the additional role in determining the zero-field potential.
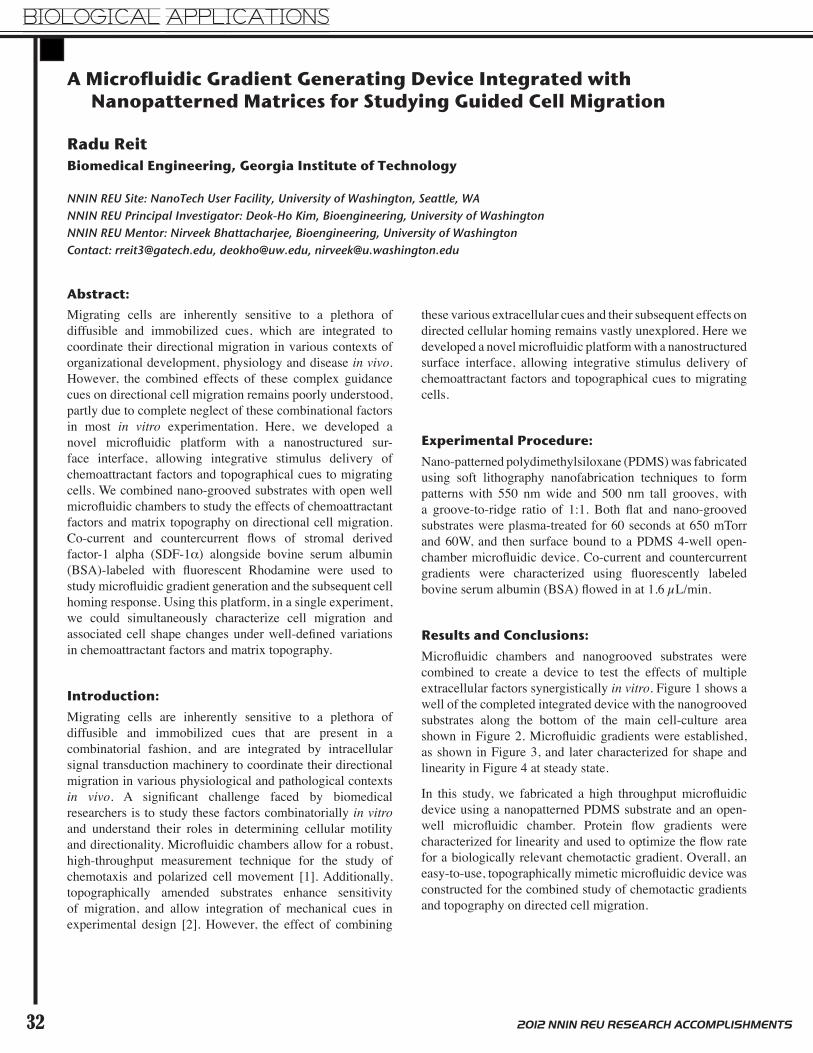
Introduction:Electro-fluidic gating is an effect where an applied field imparts control over the ionic layer on an electrolyte/solid interface, called the electric double layer [1]. Fields emanating
from buried electrodes in solution are usually screened by counterions over a characteristic length, termed the Debye length. Beyond this length scale, Coulomb forces exerted on molecules are negligible. Recently the chemical nature of the interface was found to play a profound effect on charge modulation.
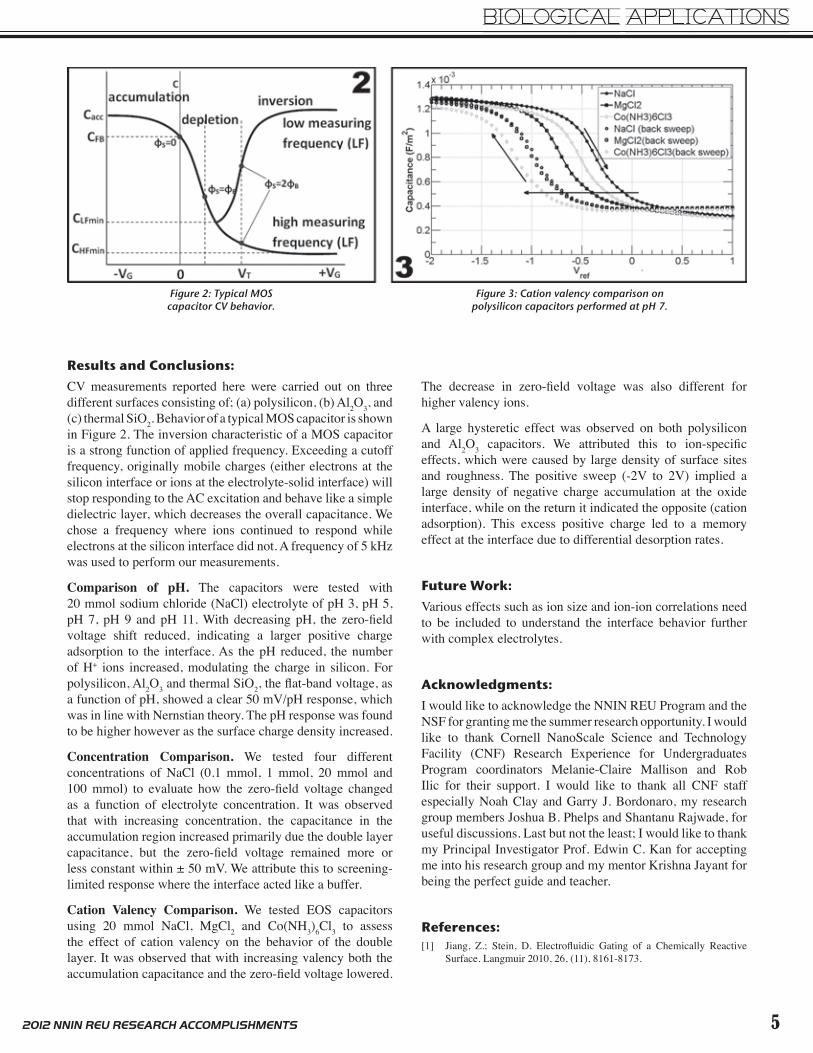
Through this study, we aimed to understand how the electrofluidic gating effect changed with different interface chemistries. We performed the study using simple EOS capacitors (Figure 1) with different dielectric layers.
Experimental Procedure:The fabrication process consisted of three splits. The first split had 30 nm of thermally grown silicon dioxide (SiO2) deposited on a clean Si wafer followed by a patterning to open up the capacitor areas. Positive photoresist SPR 220 3.0 was used and exposure was done by ABM contact aligner. A descum was carried out for 10s in the Oxford 82 etcher. The second process split included various oxide layers deposited on the Si wafers by the atomic layer deposition (ALD) tool, including hafnium oxide (HfO2), tantalum oxide (Ta2O5), aluminum oxide (Al2O3) and SiO2 interfaces. The third process split included 20 nm of thermally grown SiO2 on a metal-oxide-semiconducting (MOS) cleaned Si wafer, followed by 70 nm of n+ polysilicon.
The wafers were then spun with SPR 220 (3.0) and exposed through the ABM contact aligner. The YES Image Reversal oven was employed to change the tone of the photoresist from positive to negative. After development, the wafers were CHF3/O2 etched in the Oxford 82 etcher, leaving blocks of polysilicon on the wafer. After stripping off the photoresist, 200 nm layer of silicon nitride (Si3N4) was deposited on the wafer to serve as the passivation layer. A subsequent photolithography step was performed to open up the capacitor active area. An RIE etch was performed to remove any residual resist. The wafers consisted of capacitors of three different sizes ranging from 300 µm × 300 µm to 1000 µm × 1000 µm. Capacitance versus voltage (CV) measurements were made on the devices with the Keithley 4200 semiconductor characterization system.
Here we report measurements with the largest capacitor. Figure 1: The EOS capacitor device.
BIOLOGICAL APPLICATIONS
52012 NNIN REU RESEARCH ACCOMPLISHMENTS
Results and Conclusions:CV measurements reported here were carried out on three different surfaces consisting of; (a) polysilicon, (b) Al2O3, and (c) thermal SiO2. Behavior of a typical MOS capacitor is shown in Figure 2. The inversion characteristic of a MOS capacitor is a strong function of applied frequency. Exceeding a cutoff frequency, originally mobile charges (either electrons at the silicon interface or ions at the electrolyte-solid interface) will stop responding to the AC excitation and behave like a simple dielectric layer, which decreases the overall capacitance. We chose a frequency where ions continued to respond while electrons at the silicon interface did not. A frequency of 5 kHz was used to perform our measurements.
Comparison of pH. The capacitors were tested with 20 mmol sodium chloride (NaCl) electrolyte of pH 3, pH 5, pH 7, pH 9 and pH 11. With decreasing pH, the zero-field voltage shift reduced, indicating a larger positive charge adsorption to the interface. As the pH reduced, the number of H+ ions increased, modulating the charge in silicon. For polysilicon, Al2O3 and thermal SiO2, the flat-band voltage, as a function of pH, showed a clear 50 mV/pH response, which was in line with Nernstian theory. The pH response was found to be higher however as the surface charge density increased.
Concentration Comparison. We tested four different concentrations of NaCl (0.1 mmol, 1 mmol, 20 mmol and 100 mmol) to evaluate how the zero-field voltage changed as a function of electrolyte concentration. It was observed that with increasing concentration, the capacitance in the accumulation region increased primarily due the double layer capacitance, but the zero-field voltage remained more or less constant within ± 50 mV. We attribute this to screening-limited response where the interface acted like a buffer.
Cation Valency Comparison. We tested EOS capacitors using 20 mmol NaCl, MgCl2 and Co(NH3)6Cl3 to assess the effect of cation valency on the behavior of the double layer. It was observed that with increasing valency both the accumulation capacitance and the zero-field voltage lowered.
The decrease in zero-field voltage was also different for higher valency ions.
A large hysteretic effect was observed on both polysilicon and Al2O3 capacitors. We attributed this to ion-specific effects, which were caused by large density of surface sites and roughness. The positive sweep (-2V to 2V) implied a large density of negative charge accumulation at the oxide interface, while on the return it indicated the opposite (cation adsorption). This excess positive charge led to a memory effect at the interface due to differential desorption rates.
Future Work:Various effects such as ion size and ion-ion correlations need to be included to understand the interface behavior further with complex electrolytes.
Acknowledgments: I would like to acknowledge the NNIN REU Program and the NSF for granting me the summer research opportunity. I would like to thank Cornell NanoScale Science and Technology Facility (CNF) Research Experience for Undergraduates Program coordinators Melanie-Claire Mallison and Rob Ilic for their support. I would like to thank all CNF staff especially Noah Clay and Garry J. Bordonaro, my research group members Joshua B. Phelps and Shantanu Rajwade, for useful discussions. Last but not the least; I would like to thank my Principal Investigator Prof. Edwin C. Kan for accepting me into his research group and my mentor Krishna Jayant for being the perfect guide and teacher.
References: [1] Jiang, Z.; Stein, D. Electrofluidic Gating of a Chemically Reactive
Surface. Langmuir 2010, 26, (11), 8161-8173.
Figure 2: Typical MOS capacitor CV behavior.
Figure 3: Cation valency comparison on polysilicon capacitors performed at pH 7.
BIOLOGICAL APPLICATIONS
6 2012 NNIN REU RESEARCH ACCOMPLISHMENTS
Cellular Binding of Quantum Dots
Quachel BazileChemistry, Elizabeth City State University
NNIN REU Site: Nanotechnology Research Center, Georgia Institute of Technology, Atlanta, GA NNIN REU Principal Investigator: Professor Christine K. Payne, Chemistry, Georgia Institute of Technology NNIN REU Mentor: Candace C. Fleischer, Chemistry, Georgia Institute of Technology Contact: [email protected], [email protected], [email protected]
Introduction:
The need for new innovative treatments has led to the increase in nanoparticle (NP) research. NPs can improve treatment through drug delivery, cellular imaging and gene therapy. To properly use NPs for treatment, it is important to understand how NPs interact with the cellular environment. Recent research was done that compared cellular binding on cationic and anionic polystyrene NPs [1]. The results concluded that the cellular binding of cationic polystyrene NPs was enhanced in the presence of serum proteins and inhibited in the absence of serum proteins. The results also entailed that anionic polystyrene NPs cellular binding was inhibited in the presence of serum proteins and enhanced in the absence of serum proteins [1]. Serum proteins are a mixture of multiple proteins that are isolated from whole blood. Serum proteins may influence how NPs bind to cells because they have select sites on the cell where they bind [2]. The purpose of this research was to measure quantum dot (QD) binding to cells in the presence and absence of serum proteins and compare to prior work done with polystyrene NPs and cellular binding.
QDs are semiconductor nanocrystals that are fluorescent. QDs are fluorescent because they have a large band gap and when excited, energy is given off. QDs are used for variety of applications including imaging, solar cells, and LEDs [3]. To compare the difference between cationic and anionic QDs a coupling reaction was done to change the anionic QDs to cationic QDs.
Experimental Procedure:Characterization. The Nano-ZS Zetasizer (Malvern Instruments) was used to determine the hydrodynamic diameter and the zeta potential or effective surface charge of QDs. An 800 pM solution of QDs was used for both measurements, and all samples were measured in triplicate.
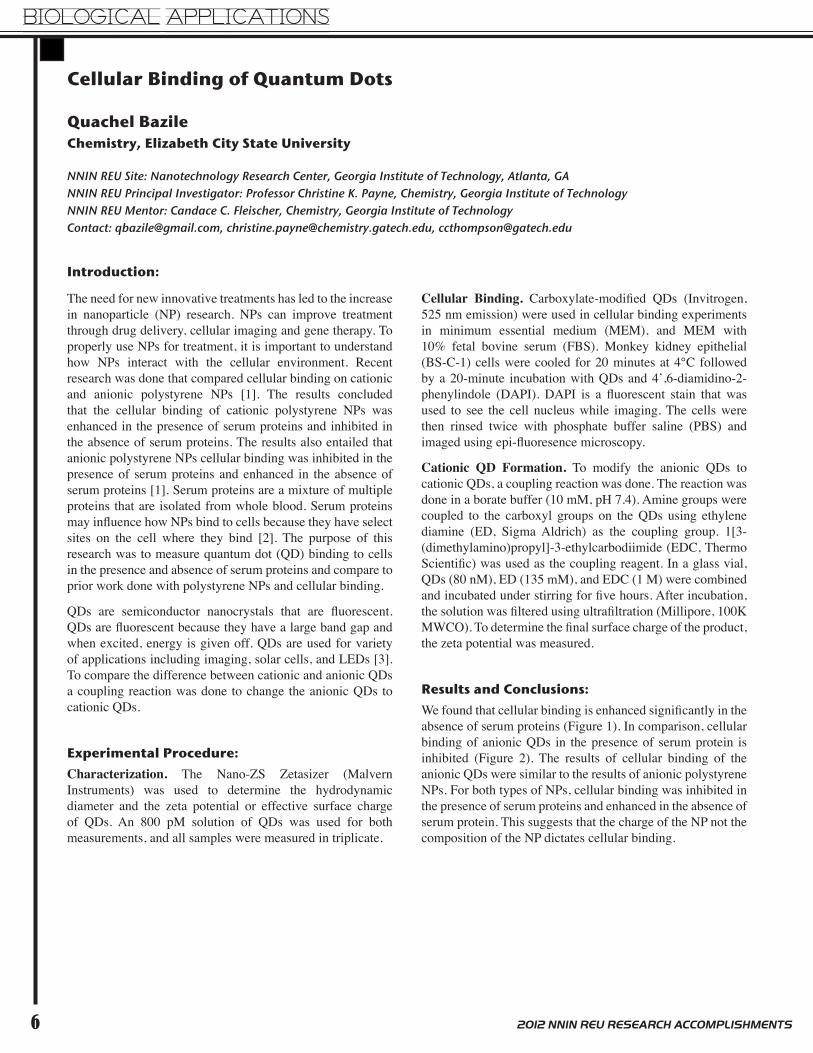
Cellular Binding. Carboxylate-modified QDs (Invitrogen, 525 nm emission) were used in cellular binding experiments in minimum essential medium (MEM), and MEM with 10% fetal bovine serum (FBS). Monkey kidney epithelial (BS-C-1) cells were cooled for 20 minutes at 4°C followed by a 20-minute incubation with QDs and 4’,6-diamidino-2-phenylindole (DAPI). DAPI is a fluorescent stain that was used to see the cell nucleus while imaging. The cells were then rinsed twice with phosphate buffer saline (PBS) and imaged using epi-fluoresence microscopy.
Cationic QD Formation. To modify the anionic QDs to cationic QDs, a coupling reaction was done. The reaction was done in a borate buffer (10 mM, pH 7.4). Amine groups were coupled to the carboxyl groups on the QDs using ethylene diamine (ED, Sigma Aldrich) as the coupling group. 1[3- (dimethylamino)propyl]-3-ethylcarbodiimide (EDC, Thermo Scientific) was used as the coupling reagent. In a glass vial, QDs (80 nM), ED (135 mM), and EDC (1 M) were combined and incubated under stirring for five hours. After incubation, the solution was filtered using ultrafiltration (Millipore, 100K MWCO). To determine the final surface charge of the product, the zeta potential was measured.
Results and Conclusions:We found that cellular binding is enhanced significantly in the absence of serum proteins (Figure 1). In comparison, cellular binding of anionic QDs in the presence of serum protein is inhibited (Figure 2). The results of cellular binding of the anionic QDs were similar to the results of anionic polystyrene NPs. For both types of NPs, cellular binding was inhibited in the presence of serum proteins and enhanced in the absence of serum protein. This suggests that the charge of the NP not the composition of the NP dictates cellular binding.
BIOLOGICAL APPLICATIONS
72012 NNIN REU RESEARCH ACCOMPLISHMENTS
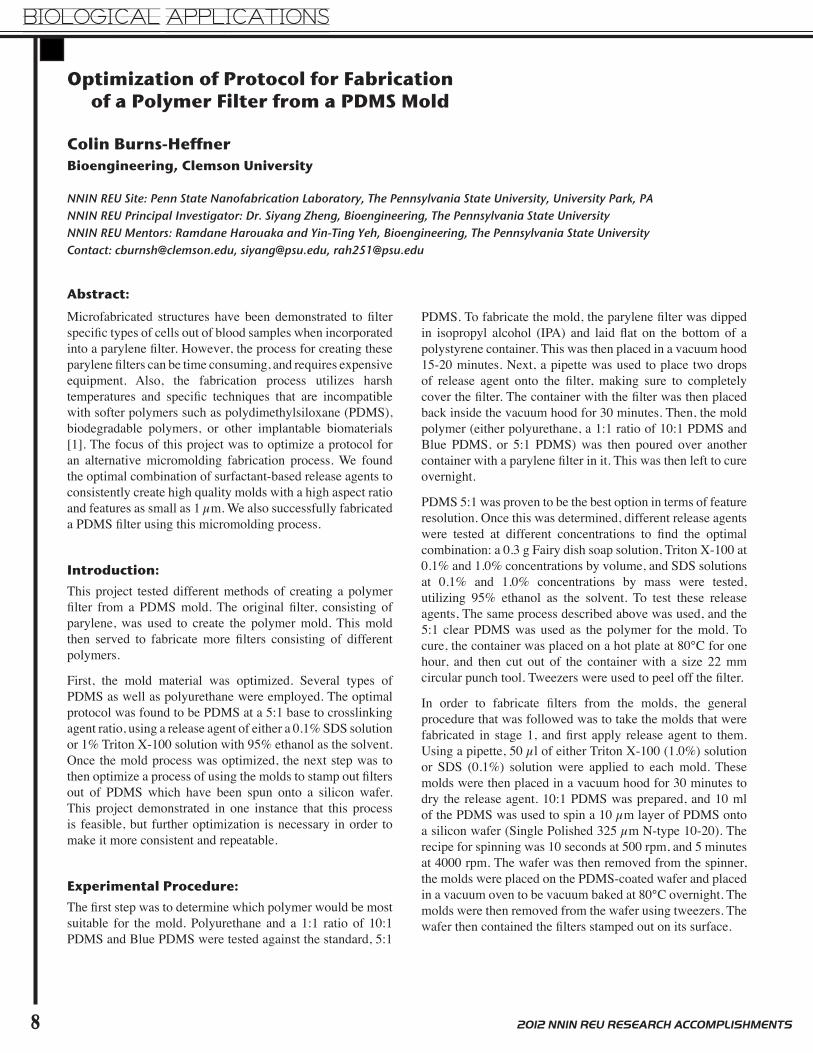
When amine groups were coupled to the carboxylate groups the QDs became more positive (Figure 3). The cellular binding of these cationic QDs were measured on BS-C-1 cells. No binding was observed. This may be due to the fact that the amine modified QDs were not as positive as expected.
Future Work:In the future, the QD coupling reaction will be optimized to yield more positive QDs. Cellular binding studies with cationic QDs will also be completed. A comparison between the cationic QDs results and polystyrene NP results will also be done. Acknowledgments:This project was funded by NSF and by the NNIN REU Program. Thanks to Candace Fleischer for the help and support on the project, as well as Professor Christine Payne and the Payne lab. Thank you also to the Georgia Institute of Technology NNIN staff.
References:[1] Fleischer, C. and Payne, C. J. Phys. Chem. B. 2012, 116,8901-8907.[2] Anderson, N., Anderson, A., Mol. Cell. Proteomics 2002, 1845-867.[3] Linda, S. Anal. Chem. 2004, 76 (23), 453A.
Figure 1, top: Cellular binding of anionic QDs to live BS-C-1 cells in minimum essential medium (MEM). Epifluoresence microscopy was used to acquire images. Arrow 1 in the image is the nuclei, stained with DAPI, and Arrow 2 indicates the QDs. QDs bind to cells in the absence of serum proteins.
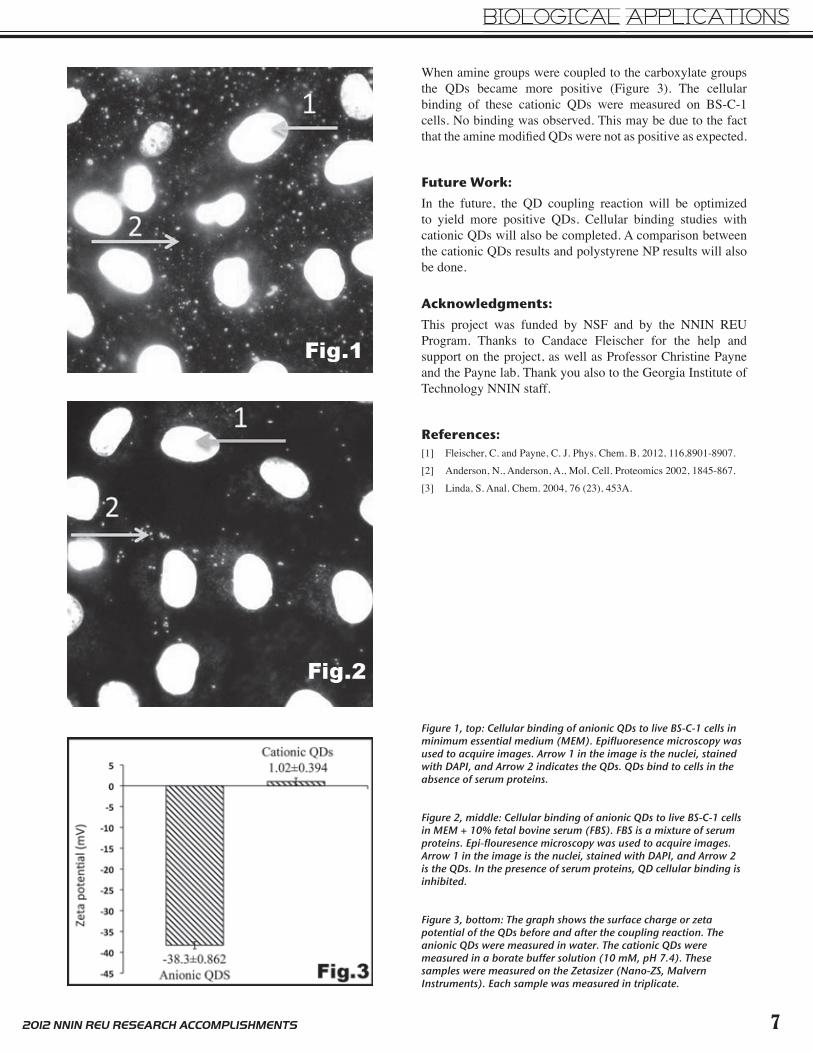
Figure 2, middle: Cellular binding of anionic QDs to live BS-C-1 cells in MEM + 10% fetal bovine serum (FBS). FBS is a mixture of serum proteins. Epi-flouresence microscopy was used to acquire images. Arrow 1 in the image is the nuclei, stained with DAPI, and Arrow 2 is the QDs. In the presence of serum proteins, QD cellular binding is inhibited.
Figure 3, bottom: The graph shows the surface charge or zeta potential of the QDs before and after the coupling reaction. The anionic QDs were measured in water. The cationic QDs were measured in a borate buffer solution (10 mM, pH 7.4). These samples were measured on the Zetasizer (Nano-ZS, Malvern Instruments). Each sample was measured in triplicate.
BIOLOGICAL APPLICATIONS
8 2012 NNIN REU RESEARCH ACCOMPLISHMENTS
Optimization of Protocol for Fabrication of a Polymer Filter from a PDMS Mold
Colin Burns-HeffnerBioengineering, Clemson University
NNIN REU Site: Penn State Nanofabrication Laboratory, The Pennsylvania State University, University Park, PA NNIN REU Principal Investigator: Dr. Siyang Zheng, Bioengineering, The Pennsylvania State UniversityNNIN REU Mentors: Ramdane Harouaka and Yin-Ting Yeh, Bioengineering, The Pennsylvania State UniversityContact: [email protected], [email protected], [email protected]
Abstract:Microfabricated structures have been demonstrated to filter specific types of cells out of blood samples when incorporated into a parylene filter. However, the process for creating these parylene filters can be time consuming, and requires expensive equipment. Also, the fabrication process utilizes harsh temperatures and specific techniques that are incompatible with softer polymers such as polydimethylsiloxane (PDMS), biodegradable polymers, or other implantable biomaterials [1]. The focus of this project was to optimize a protocol for an alternative micromolding fabrication process. We found the optimal combination of surfactant-based release agents to consistently create high quality molds with a high aspect ratio and features as small as 1 µm. We also successfully fabricated a PDMS filter using this micromolding process.
Introduction:This project tested different methods of creating a polymer filter from a PDMS mold. The original filter, consisting of parylene, was used to create the polymer mold. This mold then served to fabricate more filters consisting of different polymers.
First, the mold material was optimized. Several types of PDMS as well as polyurethane were employed. The optimal protocol was found to be PDMS at a 5:1 base to crosslinking agent ratio, using a release agent of either a 0.1% SDS solution or 1% Triton X-100 solution with 95% ethanol as the solvent. Once the mold process was optimized, the next step was to then optimize a process of using the molds to stamp out filters out of PDMS which have been spun onto a silicon wafer. This project demonstrated in one instance that this process is feasible, but further optimization is necessary in order to make it more consistent and repeatable.
Experimental Procedure:The first step was to determine which polymer would be most suitable for the mold. Polyurethane and a 1:1 ratio of 10:1 PDMS and Blue PDMS were tested against the standard, 5:1
PDMS. To fabricate the mold, the parylene filter was dipped in isopropyl alcohol (IPA) and laid flat on the bottom of a polystyrene container. This was then placed in a vacuum hood 15-20 minutes. Next, a pipette was used to place two drops of release agent onto the filter, making sure to completely cover the filter. The container with the filter was then placed back inside the vacuum hood for 30 minutes. Then, the mold polymer (either polyurethane, a 1:1 ratio of 10:1 PDMS and Blue PDMS, or 5:1 PDMS) was then poured over another container with a parylene filter in it. This was then left to cure overnight.
PDMS 5:1 was proven to be the best option in terms of feature resolution. Once this was determined, different release agents were tested at different concentrations to find the optimal combination: a 0.3 g Fairy dish soap solution, Triton X-100 at 0.1% and 1.0% concentrations by volume, and SDS solutions at 0.1% and 1.0% concentrations by mass were tested, utilizing 95% ethanol as the solvent. To test these release agents, The same process described above was used, and the 5:1 clear PDMS was used as the polymer for the mold. To cure, the container was placed on a hot plate at 80°C for one hour, and then cut out of the container with a size 22 mm circular punch tool. Tweezers were used to peel off the filter.
In order to fabricate filters from the molds, the general procedure that was followed was to take the molds that were fabricated in stage 1, and first apply release agent to them. Using a pipette, 50 µl of either Triton X-100 (1.0%) solution or SDS (0.1%) solution were applied to each mold. These molds were then placed in a vacuum hood for 30 minutes to dry the release agent. 10:1 PDMS was prepared, and 10 ml of the PDMS was used to spin a 10 µm layer of PDMS onto a silicon wafer (Single Polished 325 µm N-type 10-20). The recipe for spinning was 10 seconds at 500 rpm, and 5 minutes at 4000 rpm. The wafer was then removed from the spinner, the molds were placed on the PDMS-coated wafer and placed in a vacuum oven to be vacuum baked at 80°C overnight. The molds were then removed from the wafer using tweezers. The wafer then contained the filters stamped out on its surface.
BIOLOGICAL APPLICATIONS
92012 NNIN REU RESEARCH ACCOMPLISHMENTS
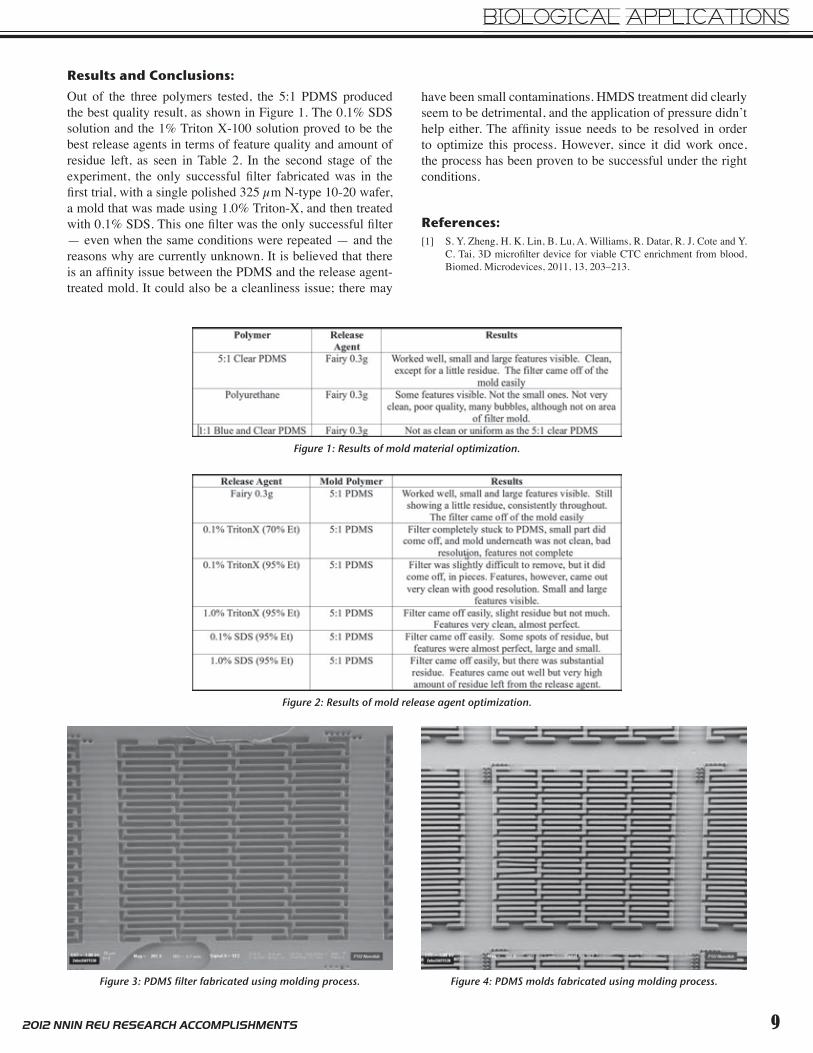
Results and Conclusions:Out of the three polymers tested, the 5:1 PDMS produced the best quality result, as shown in Figure 1. The 0.1% SDS solution and the 1% Triton X-100 solution proved to be the best release agents in terms of feature quality and amount of residue left, as seen in Table 2. In the second stage of the experiment, the only successful filter fabricated was in the first trial, with a single polished 325 µm N-type 10-20 wafer, a mold that was made using 1.0% Triton-X, and then treated with 0.1% SDS. This one filter was the only successful filter — even when the same conditions were repeated — and the reasons why are currently unknown. It is believed that there is an affinity issue between the PDMS and the release agent-treated mold. It could also be a cleanliness issue; there may
Figure 4: PDMS molds fabricated using molding process.
Figure 1: Results of mold material optimization.
Figure 2: Results of mold release agent optimization.
Figure 3: PDMS filter fabricated using molding process.
have been small contaminations. HMDS treatment did clearly seem to be detrimental, and the application of pressure didn’t help either. The affinity issue needs to be resolved in order to optimize this process. However, since it did work once, the process has been proven to be successful under the right conditions.
References:[1] S. Y. Zheng, H. K. Lin, B. Lu, A. Williams, R. Datar, R. J. Cote and Y.
C. Tai, 3D microfilter device for viable CTC enrichment from blood, Biomed. Microdevices, 2011, 13, 203–213.
BIOLOGICAL APPLICATIONS
10 2012 NNIN REU RESEARCH ACCOMPLISHMENTS
Towards Ink-Jet Fabricated PEDOT:PSS Organic Electrochemical Transistors with Embedded Enzymes
Audrey DangChemical Engineering, Vanderbilt University
NNIN iREU Site: Centre Microélectronique de Provence, Ecole Nationale Supérieure des Mines de Saint Etienne, FranceNNIN iREU Principal Investigator: Professor George Malliaras, Department of Bioelectronics,
Centre Microélectronique de Provence, Ecole Nationale Supérieure des Mines de Saint Etienne, FranceNNIN iREU Mentor: Associate Professor Sébastien Sanaur, Department of Bioelectronics,
Abstract and Introduction:Ink-jet printing is a promising method for the low cost fabrication of electronics and sensing devices. Indeed, its ease of processing includes additive patterning, simple modification of device geometry, non-contact processing, and diverse substrate possibilities.
Commercially available as an ink for printing, poly(3,4-ethyl-ene dioxythiophene)-poly(4-styrenesulfonate) (PEDOT:PSS) is a degenerately-doped p-type organic semiconductor polymer which has been investigated extensively for the fabrication of organic electrochemical transistors (OECTs). Like other transistors, OECTs benefit from inherent signal amplification [1]. In contrast to traditional transistors, OECTs operate at biocompatible working voltages in electrolyte. OECTs are thus excellent candidates for biosensing and integration into in vitro and in vivo applications. In addition, a planar monolayer geometry is possible allowing simple fabrication by inkjet printing.
In the operation of an OECT, application of positive gate voltage increases cation concentration in the channel, which results in dedoping of the conducting polymer. The dedoped channel is less conductive resulting in a lower drain current. Thus, the change in gate voltage results in an amplified change in drain current.
Glucose sensing with an all-PEDOT:PSS OECT has been previously demonstrated with glucose oxidase (GOx) located in the electrolyte [2]. In this device design, electrons were shuttled by a mediator from the enzyme in solution to the PEDOT:PSS gate. Thus, the effective gate voltage and in result the drain current were modulated in response to changes in glucose concentration. Limitations of this device include the presence of reagents in the electrolyte. In contrast, Yun, et al., embedded GOx and horseradish peroxidase enzyme in a PEDOT:PSS electrode by inkjet printing a single bioelectronic ink consisting of the enzymes in an aqueous dispersion of PEDOT:PSS [3]. The aim of this project was to ink-jet print an OECT with GOx embedded in its PEDOT:PSS electrodes for glucose sensing. We report progress in the development of the fabrication of such devices.
Methods and Results:Devices were printed with a Dimatix Materials Printer 2800 (DMP 2800). The DMP 2800 is a piezoelectric printer with a disposable cartridge that dispenses 10 pL drops of ink from 16 nozzles. Four layers were printed on glass slides coated in a vapor-deposited layer of Parylene-C that was treated with oxygen plasma just prior to printing (Figure 1).
The ink used in this project was a 1.8 wt.% dispersion of PEDOT:PSS in water with ethylene glycol and ethanol (Agfa Orgacon IJ-1005). Normal processing of this commercial ink entailed steps such as sonication and high-temperature annealing which would denature enzymes. Thus, modifications were necessary to preserve the activity of the enzyme while maintaining the desired electrical and mechanical properties of the conducting polymer.
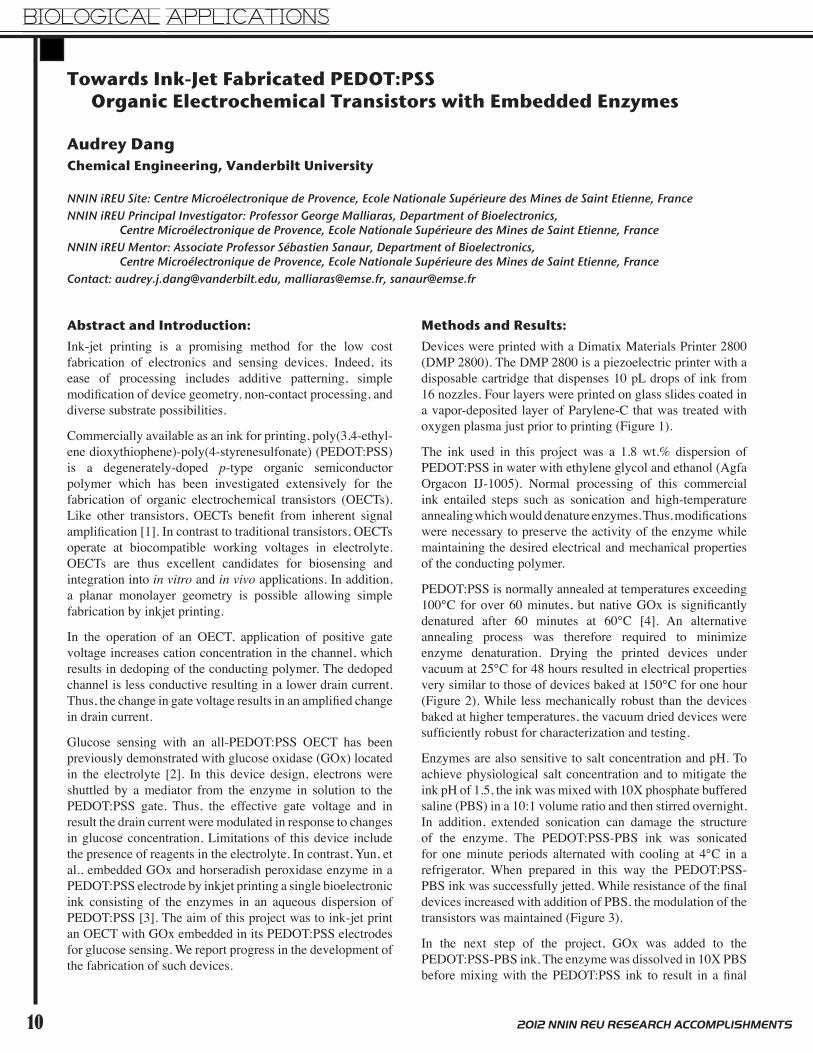
PEDOT:PSS is normally annealed at temperatures exceeding 100°C for over 60 minutes, but native GOx is significantly denatured after 60 minutes at 60°C [4]. An alternative annealing process was therefore required to minimize enzyme denaturation. Drying the printed devices under vacuum at 25°C for 48 hours resulted in electrical properties very similar to those of devices baked at 150°C for one hour (Figure 2). While less mechanically robust than the devices baked at higher temperatures, the vacuum dried devices were sufficiently robust for characterization and testing.
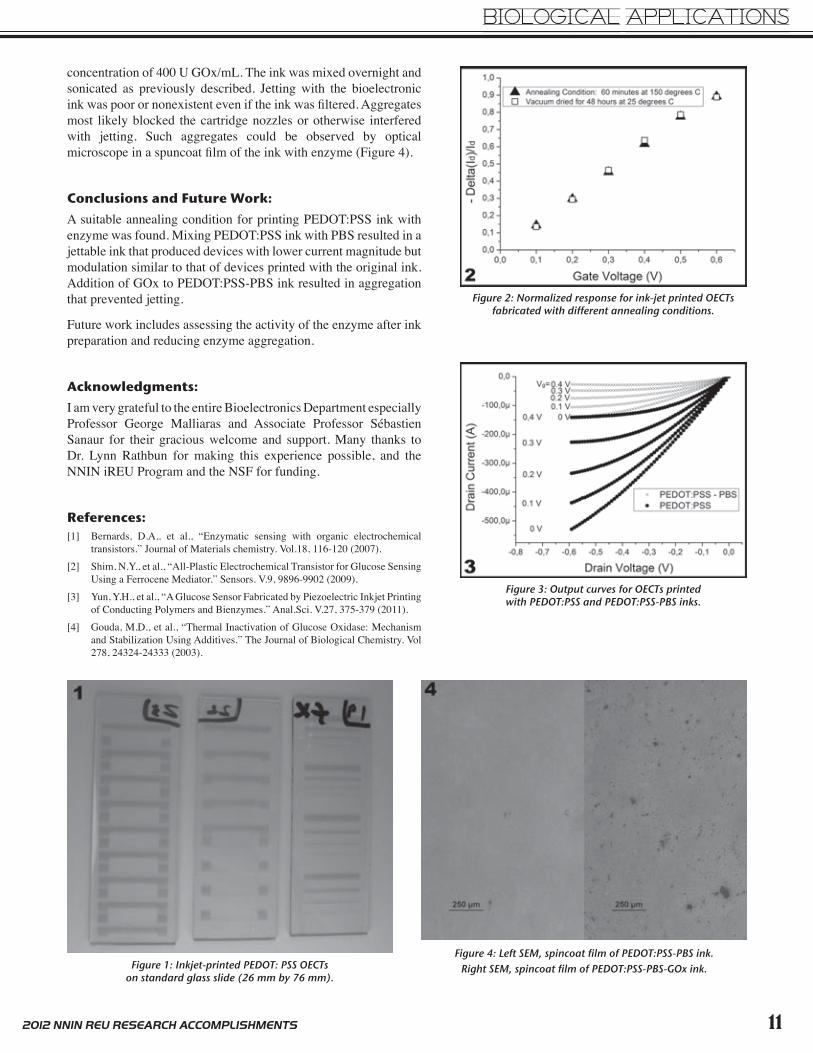
Enzymes are also sensitive to salt concentration and pH. To achieve physiological salt concentration and to mitigate the ink pH of 1.5, the ink was mixed with 10X phosphate buffered saline (PBS) in a 10:1 volume ratio and then stirred overnight. In addition, extended sonication can damage the structure of the enzyme. The PEDOT:PSS-PBS ink was sonicated for one minute periods alternated with cooling at 4°C in a refrigerator. When prepared in this way the PEDOT:PSS-PBS ink was successfully jetted. While resistance of the final devices increased with addition of PBS, the modulation of the transistors was maintained (Figure 3).
In the next step of the project, GOx was added to the PEDOT:PSS-PBS ink. The enzyme was dissolved in 10X PBS before mixing with the PEDOT:PSS ink to result in a final
BIOLOGICAL APPLICATIONS
112012 NNIN REU RESEARCH ACCOMPLISHMENTS
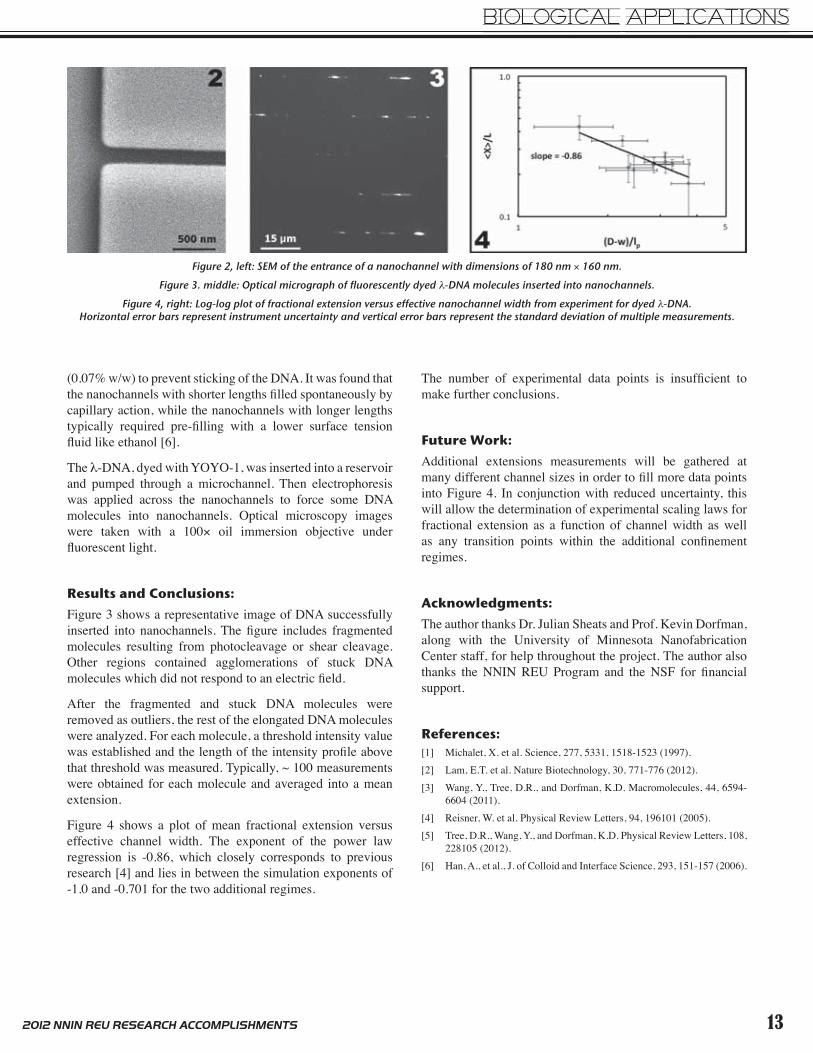
concentration of 400 U GOx/mL. The ink was mixed overnight and sonicated as previously described. Jetting with the bioelectronic ink was poor or nonexistent even if the ink was filtered. Aggregates most likely blocked the cartridge nozzles or otherwise interfered with jetting. Such aggregates could be observed by optical microscope in a spuncoat film of the ink with enzyme (Figure 4).
Conclusions and Future Work:A suitable annealing condition for printing PEDOT:PSS ink with enzyme was found. Mixing PEDOT:PSS ink with PBS resulted in a jettable ink that produced devices with lower current magnitude but modulation similar to that of devices printed with the original ink. Addition of GOx to PEDOT:PSS-PBS ink resulted in aggregation that prevented jetting.
Future work includes assessing the activity of the enzyme after ink preparation and reducing enzyme aggregation.
Acknowledgments:I am very grateful to the entire Bioelectronics Department especially Professor George Malliaras and Associate Professor Sébastien Sanaur for their gracious welcome and support. Many thanks to Dr. Lynn Rathbun for making this experience possible, and the NNIN iREU Program and the NSF for funding.
References:[1] Bernards, D.A,. et al., “Enzymatic sensing with organic electrochemical
transistors.” Journal of Materials chemistry. Vol.18, 116-120 (2007).[2] Shim, N.Y., et al., “All-Plastic Electrochemical Transistor for Glucose Sensing
Using a Ferrocene Mediator.” Sensors. V.9, 9896-9902 (2009).[3] Yun, Y.H., et al., “A Glucose Sensor Fabricated by Piezoelectric Inkjet Printing
of Conducting Polymers and Bienzymes.” Anal.Sci. V.27, 375-379 (2011).[4] Gouda, M.D., et al., “Thermal Inactivation of Glucose Oxidase: Mechanism
and Stabilization Using Additives.” The Journal of Biological Chemistry. Vol 278, 24324-24333 (2003).
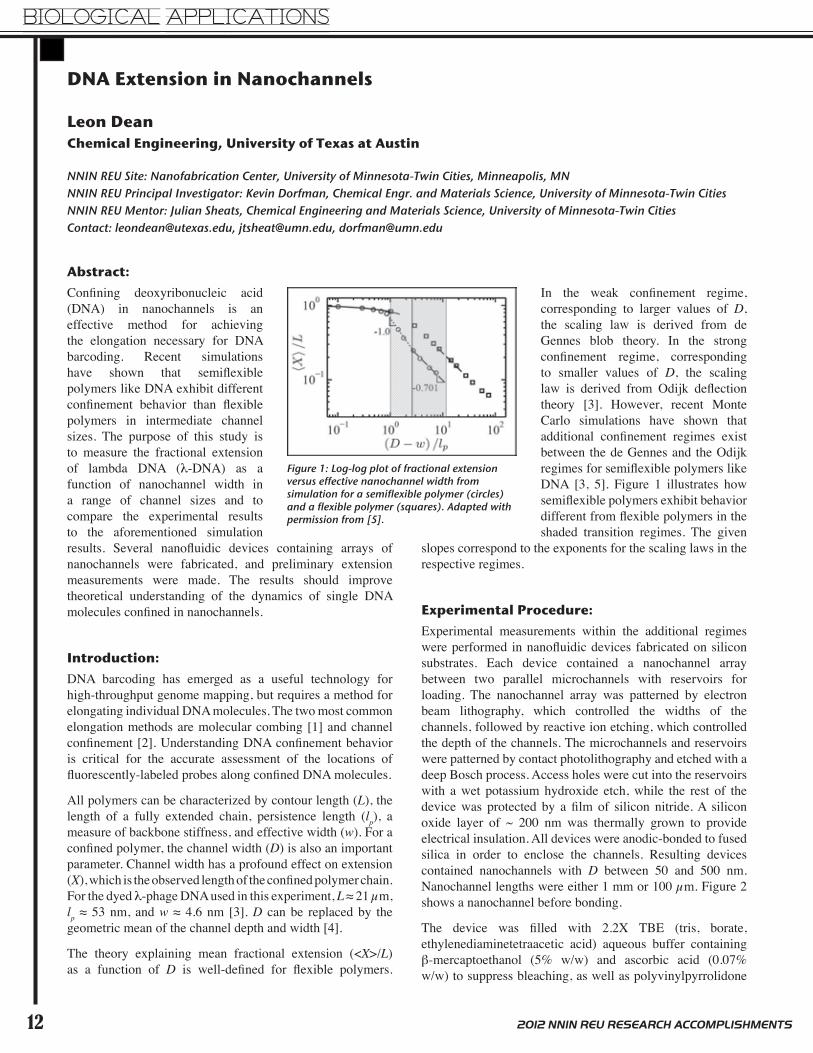
Figure 1: Inkjet-printed PEDOT: PSS OECTs on standard glass slide (26 mm by 76 mm).
Figure 2: Normalized response for ink-jet printed OECTs fabricated with different annealing conditions.
Figure 3: Output curves for OECTs printed with PEDOT:PSS and PEDOT:PSS-PBS inks.
Figure 4: Left SEM, spincoat film of PEDOT:PSS-PBS ink. Right SEM, spincoat film of PEDOT:PSS-PBS-GOx ink.
BIOLOGICAL APPLICATIONS
12 2012 NNIN REU RESEARCH ACCOMPLISHMENTS
DNA Extension in Nanochannels
Leon DeanChemical Engineering, University of Texas at Austin
NNIN REU Site: Nanofabrication Center, University of Minnesota-Twin Cities, Minneapolis, MNNNIN REU Principal Investigator: Kevin Dorfman, Chemical Engr. and Materials Science, University of Minnesota-Twin CitiesNNIN REU Mentor: Julian Sheats, Chemical Engineering and Materials Science, University of Minnesota-Twin CitiesContact: [email protected], [email protected], [email protected]
Abstract:Confining deoxyribonucleic acid (DNA) in nanochannels is an effective method for achieving the elongation necessary for DNA barcoding. Recent simulations have shown that semiflexible polymers like DNA exhibit different confinement behavior than flexible polymers in intermediate channel sizes. The purpose of this study is to measure the fractional extension of lambda DNA (l-DNA) as a function of nanochannel width in a range of channel sizes and to compare the experimental results to the aforementioned simulation results. Several nanofluidic devices containing arrays of nanochannels were fabricated, and preliminary extension measurements were made. The results should improve theoretical understanding of the dynamics of single DNA molecules confined in nanochannels.
Introduction:DNA barcoding has emerged as a useful technology for high-throughput genome mapping, but requires a method for elongating individual DNA molecules. The two most common elongation methods are molecular combing [1] and channel confinement [2]. Understanding DNA confinement behavior is critical for the accurate assessment of the locations of fluorescently-labeled probes along confined DNA molecules.
All polymers can be characterized by contour length (L), the length of a fully extended chain, persistence length (lp), a measure of backbone stiffness, and effective width (w). For a confined polymer, the channel width (D) is also an important parameter. Channel width has a profound effect on extension (X), which is the observed length of the confined polymer chain. For the dyed l-phage DNA used in this experiment, L ≈ 21 µm, lp ≈ 53 nm, and w ≈ 4.6 nm [3]. D can be replaced by the geometric mean of the channel depth and width [4].
The theory explaining mean fractional extension (<X>/L) as a function of D is well-defined for flexible polymers.
In the weak confinement regime, corresponding to larger values of D, the scaling law is derived from de Gennes blob theory. In the strong confinement regime, corresponding to smaller values of D, the scaling law is derived from Odijk deflection theory [3]. However, recent Monte Carlo simulations have shown that additional confinement regimes exist between the de Gennes and the Odijk regimes for semiflexible polymers like DNA [3, 5]. Figure 1 illustrates how semiflexible polymers exhibit behavior different from flexible polymers in the shaded transition regimes. The given
slopes correspond to the exponents for the scaling laws in the respective regimes.
Experimental Procedure:Experimental measurements within the additional regimes were performed in nanofluidic devices fabricated on silicon substrates. Each device contained a nanochannel array between two parallel microchannels with reservoirs for loading. The nanochannel array was patterned by electron beam lithography, which controlled the widths of the channels, followed by reactive ion etching, which controlled the depth of the channels. The microchannels and reservoirs were patterned by contact photolithography and etched with a deep Bosch process. Access holes were cut into the reservoirs with a wet potassium hydroxide etch, while the rest of the device was protected by a film of silicon nitride. A silicon oxide layer of ~ 200 nm was thermally grown to provide electrical insulation. All devices were anodic-bonded to fused silica in order to enclose the channels. Resulting devices contained nanochannels with D between 50 and 500 nm. Nanochannel lengths were either 1 mm or 100 µm. Figure 2 shows a nanochannel before bonding.
The device was filled with 2.2X TBE (tris, borate, ethylenediaminetetraacetic acid) aqueous buffer containing β-mercaptoethanol (5% w/w) and ascorbic acid (0.07% w/w) to suppress bleaching, as well as polyvinylpyrrolidone
Figure 1: Log-log plot of fractional extension versus effective nanochannel width from simulation for a semiflexible polymer (circles) and a flexible polymer (squares). Adapted with permission from [5].
BIOLOGICAL APPLICATIONS
132012 NNIN REU RESEARCH ACCOMPLISHMENTS
(0.07% w/w) to prevent sticking of the DNA. It was found that the nanochannels with shorter lengths filled spontaneously by capillary action, while the nanochannels with longer lengths typically required pre-filling with a lower surface tension fluid like ethanol [6].
The l-DNA, dyed with YOYO-1, was inserted into a reservoir and pumped through a microchannel. Then electrophoresis was applied across the nanochannels to force some DNA molecules into nanochannels. Optical microscopy images were taken with a 100× oil immersion objective under fluorescent light.
Results and Conclusions:Figure 3 shows a representative image of DNA successfully inserted into nanochannels. The figure includes fragmented molecules resulting from photocleavage or shear cleavage. Other regions contained agglomerations of stuck DNA molecules which did not respond to an electric field.
After the fragmented and stuck DNA molecules were removed as outliers, the rest of the elongated DNA molecules were analyzed. For each molecule, a threshold intensity value was established and the length of the intensity profile above that threshold was measured. Typically, ~ 100 measurements were obtained for each molecule and averaged into a mean extension.
Figure 4 shows a plot of mean fractional extension versus effective channel width. The exponent of the power law regression is -0.86, which closely corresponds to previous research [4] and lies in between the simulation exponents of -1.0 and -0.701 for the two additional regimes.
The number of experimental data points is insufficient to make further conclusions.
Future Work:Additional extensions measurements will be gathered at many different channel sizes in order to fill more data points into Figure 4. In conjunction with reduced uncertainty, this will allow the determination of experimental scaling laws for fractional extension as a function of channel width as well as any transition points within the additional confinement regimes.
Acknowledgments:The author thanks Dr. Julian Sheats and Prof. Kevin Dorfman, along with the University of Minnesota Nanofabrication Center staff, for help throughout the project. The author also thanks the NNIN REU Program and the NSF for financial support.
References:[1] Michalet, X. et al. Science, 277, 5331, 1518-1523 (1997).[2] Lam, E.T. et al. Nature Biotechnology, 30, 771-776 (2012).[3] Wang, Y., Tree, D.R., and Dorfman, K.D. Macromolecules, 44, 6594-
6604 (2011).[4] Reisner, W. et al. Physical Review Letters, 94, 196101 (2005).[5] Tree, D.R., Wang, Y., and Dorfman, K.D. Physical Review Letters, 108,
228105 (2012).[6] Han, A., et al., J. of Colloid and Interface Science, 293, 151-157 (2006).
Figure 2, left: SEM of the entrance of a nanochannel with dimensions of 180 nm × 160 nm.Figure 3. middle: Optical micrograph of fluorescently dyed l-DNA molecules inserted into nanochannels.
Figure 4, right: Log-log plot of fractional extension versus effective nanochannel width from experiment for dyed l-DNA. Horizontal error bars represent instrument uncertainty and vertical error bars represent the standard deviation of multiple measurements.
BIOLOGICAL APPLICATIONS
14 2012 NNIN REU RESEARCH ACCOMPLISHMENTS
Biocompatible Dry Adhesives Mimicking Gecko Spatulae for EEG Electrodes
Jennifer GilbertsonChemistry, Beloit College
NNIN iREU Site: Centre Microélectronique de Provence, Ecole Nationale Supérieure des Mines de Saint Etienne, FranceNNIN iREU Principal Investigator: Professor George G. Malliaras, Department of Bioelectronics,
Centre Microélectronique de Provence, Ecole Nationale Supérieur des Mines de Saint Etienne, FranceNNIN iREU Mentor: Pierre Leleux, Department of Bioelectronics, Centre Microélectronique de Provence,
Introduction:Electroencephalography (EEG) electrodes record the electrical activity along the scalp, rendering them important tools in diagnosing the cerebral origins of neurological disorders such as epilepsy. Compared to other methods of monitoring neural activity, EEG is noninvasive and inexpensive, but suffers from a low signal-to-noise ratio and poor long-term skin adherence.
This project developed a polydimethylsiloxane (PDMS) dry adhesive which was coated in a conducting polymer, poly (3,4-ethylenedioxythiophene) doped with poly(styrene sulfonate) (PEDOT:PSS) to increase the accuracy and durability of the electrodes. The PDMS polymer was cast onto a patterned photoresist mold.
Modeled after naturally occurring adhesives such as gecko foot pads, the synthetic micro-pillars are reusable, less irritating than current adhesive pads, and can stay on the skin for longer periods of time. The presence of microstructures on the surface of the electrodes increases the effective area of the electrodes, increasing the conductivity and lowering the electrode impedance.
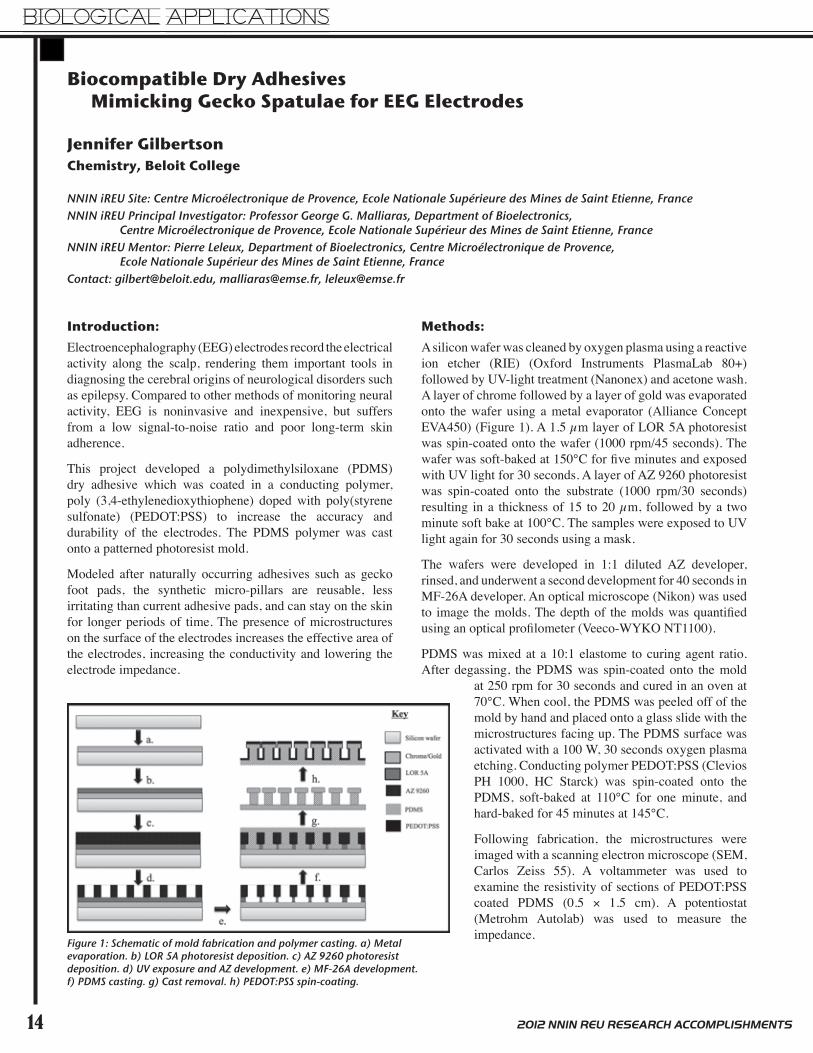
Figure 1: Schematic of mold fabrication and polymer casting. a) Metal evaporation. b) LOR 5A photoresist deposition. c) AZ 9260 photoresist deposition. d) UV exposure and AZ development. e) MF-26A development. f) PDMS casting. g) Cast removal. h) PEDOT:PSS spin-coating.
Methods:A silicon wafer was cleaned by oxygen plasma using a reactive ion etcher (RIE) (Oxford Instruments PlasmaLab 80+) followed by UV-light treatment (Nanonex) and acetone wash. A layer of chrome followed by a layer of gold was evaporated onto the wafer using a metal evaporator (Alliance Concept EVA450) (Figure 1). A 1.5 µm layer of LOR 5A photoresist was spin-coated onto the wafer (1000 rpm/45 seconds). The wafer was soft-baked at 150°C for five minutes and exposed with UV light for 30 seconds. A layer of AZ 9260 photoresist was spin-coated onto the substrate (1000 rpm/30 seconds) resulting in a thickness of 15 to 20 µm, followed by a two minute soft bake at 100°C. The samples were exposed to UV light again for 30 seconds using a mask.
The wafers were developed in 1:1 diluted AZ developer, rinsed, and underwent a second development for 40 seconds in MF-26A developer. An optical microscope (Nikon) was used to image the molds. The depth of the molds was quantified using an optical profilometer (Veeco-WYKO NT1100).
PDMS was mixed at a 10:1 elastome to curing agent ratio. After degassing, the PDMS was spin-coated onto the mold
at 250 rpm for 30 seconds and cured in an oven at 70°C. When cool, the PDMS was peeled off of the mold by hand and placed onto a glass slide with the microstructures facing up. The PDMS surface was activated with a 100 W, 30 seconds oxygen plasma etching. Conducting polymer PEDOT:PSS (Clevios PH 1000, HC Starck) was spin-coated onto the PDMS, soft-baked at 110°C for one minute, and hard-baked for 45 minutes at 145°C.
Following fabrication, the microstructures were imaged with a scanning electron microscope (SEM, Carlos Zeiss 55). A voltammeter was used to examine the resistivity of sections of PEDOT:PSS coated PDMS (0.5 × 1.5 cm). A potentiostat (Metrohm Autolab) was used to measure the impedance.
BIOLOGICAL APPLICATIONS
152012 NNIN REU RESEARCH ACCOMPLISHMENTS
A goniometer (Apollo OCA 200) was used to calculate the contact angle for structured and flat PDMS with four different substances (water, ethylene glycol, 40% ethylene glycol by volume, and diiodomethane).
Results:An adhesive comprised of 40 µm pillars with a spacing of 20 µm was successfully fabricated. An optical surface profiler /profilometer was used to determine that the depth of the molds was 14 µm on average. The mold and resulting PDMS cast had identical topography.
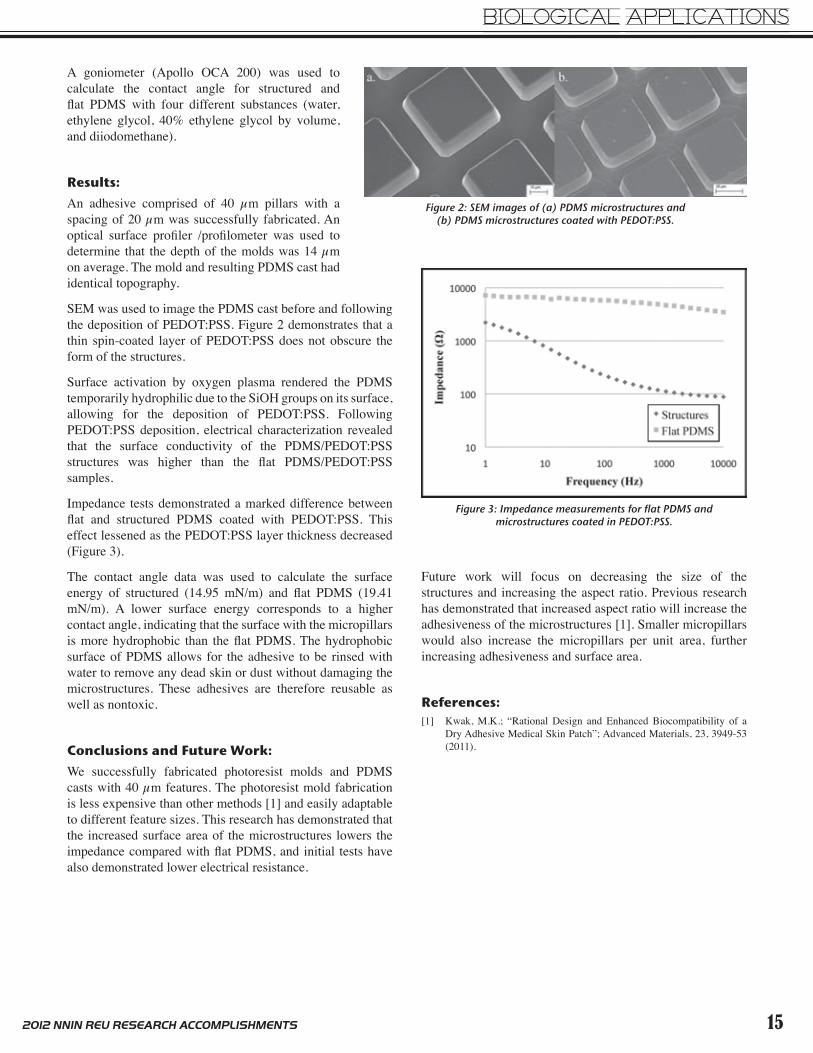
SEM was used to image the PDMS cast before and following the deposition of PEDOT:PSS. Figure 2 demonstrates that a thin spin-coated layer of PEDOT:PSS does not obscure the form of the structures.
Surface activation by oxygen plasma rendered the PDMS temporarily hydrophilic due to the SiOH groups on its surface, allowing for the deposition of PEDOT:PSS. Following PEDOT:PSS deposition, electrical characterization revealed that the surface conductivity of the PDMS/PEDOT:PSS structures was higher than the flat PDMS/PEDOT:PSS samples.
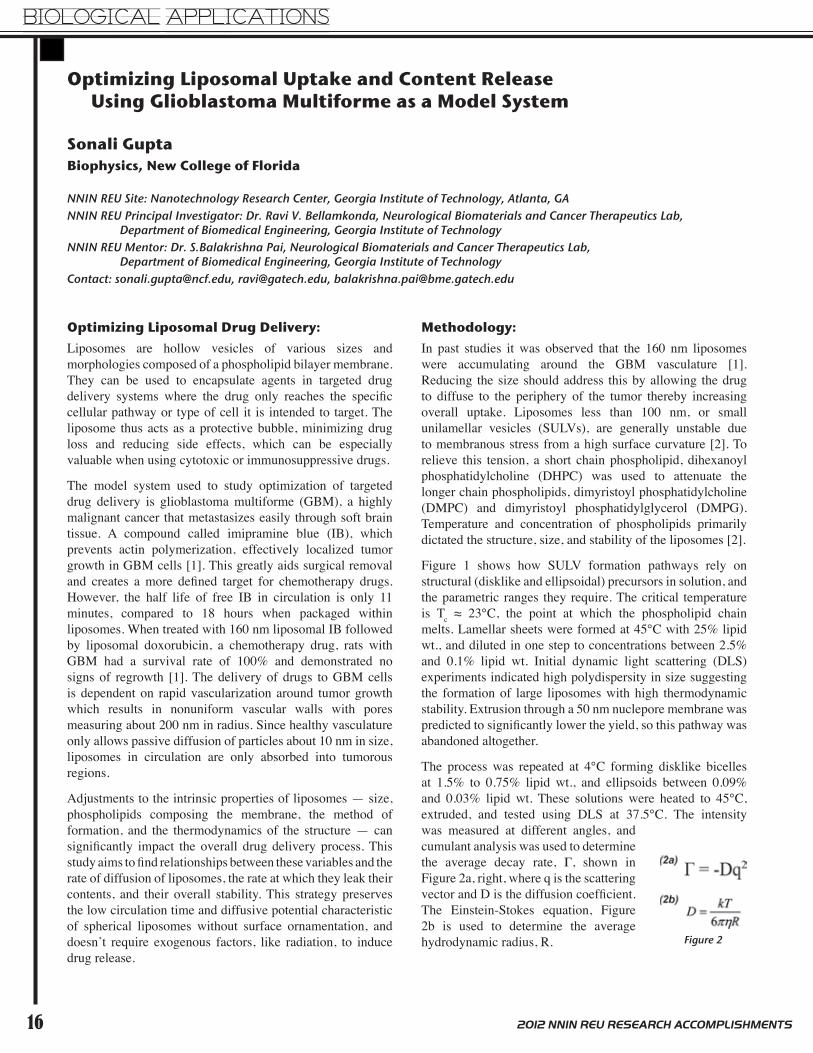
Impedance tests demonstrated a marked difference between flat and structured PDMS coated with PEDOT:PSS. This effect lessened as the PEDOT:PSS layer thickness decreased (Figure 3).
The contact angle data was used to calculate the surface energy of structured (14.95 mN/m) and flat PDMS (19.41 mN/m). A lower surface energy corresponds to a higher contact angle, indicating that the surface with the micro pillars is more hydrophobic than the flat PDMS. The hydrophobic surface of PDMS allows for the adhesive to be rinsed with water to remove any dead skin or dust without damaging the microstructures. These adhesives are therefore reusable as well as nontoxic.
Conclusions and Future Work:We successfully fabricated photoresist molds and PDMS casts with 40 µm features. The photoresist mold fabrication is less expensive than other methods [1] and easily adaptable to different feature sizes. This research has demonstrated that the increased surface area of the microstructures lowers the impedance compared with flat PDMS, and initial tests have also demonstrated lower electrical resistance.
Future work will focus on decreasing the size of the structures and increasing the aspect ratio. Previous research has demonstrated that increased aspect ratio will increase the adhesiveness of the microstructures [1]. Smaller micropillars would also increase the micropillars per unit area, further increasing adhesiveness and surface area.
References:[1] Kwak, M.K.; “Rational Design and Enhanced Biocompatibility of a
Dry Adhesive Medical Skin Patch”; Advanced Materials, 23, 3949-53 (2011).
Figure 3: Impedance measurements for flat PDMS and microstructures coated in PEDOT:PSS.
Figure 2: SEM images of (a) PDMS microstructures and (b) PDMS microstructures coated with PEDOT:PSS.
BIOLOGICAL APPLICATIONS
16 2012 NNIN REU RESEARCH ACCOMPLISHMENTS
Optimizing Liposomal Uptake and Content Release Using Glioblastoma Multiforme as a Model System
Sonali GuptaBiophysics, New College of Florida
NNIN REU Site: Nanotechnology Research Center, Georgia Institute of Technology, Atlanta, GANNIN REU Principal Investigator: Dr. Ravi V. Bellamkonda, Neurological Biomaterials and Cancer Therapeutics Lab,
Department of Biomedical Engineering, Georgia Institute of TechnologyNNIN REU Mentor: Dr. S.Balakrishna Pai, Neurological Biomaterials and Cancer Therapeutics Lab,
Optimizing Liposomal Drug Delivery:Liposomes are hollow vesicles of various sizes and morphologies composed of a phospholipid bilayer membrane. They can be used to encapsulate agents in targeted drug delivery systems where the drug only reaches the specific cellular pathway or type of cell it is intended to target. The liposome thus acts as a protective bubble, minimizing drug loss and reducing side effects, which can be especially valuable when using cytotoxic or immunosuppressive drugs.
The model system used to study optimization of targeted drug delivery is glioblastoma multiforme (GBM), a highly malignant cancer that metastasizes easily through soft brain tissue. A compound called imipramine blue (IB), which prevents actin polymerization, effectively localized tumor growth in GBM cells [1]. This greatly aids surgical removal and creates a more defined target for chemotherapy drugs. However, the half life of free IB in circulation is only 11 minutes, compared to 18 hours when packaged within liposomes. When treated with 160 nm liposomal IB followed by liposomal doxorubicin, a chemotherapy drug, rats with GBM had a survival rate of 100% and demonstrated no signs of regrowth [1]. The delivery of drugs to GBM cells is dependent on rapid vascularization around tumor growth which results in nonuniform vascular walls with pores measuring about 200 nm in radius. Since healthy vasculature only allows passive diffusion of particles about 10 nm in size, liposomes in circulation are only absorbed into tumorous regions.
Adjustments to the intrinsic properties of liposomes — size, phospholipids composing the membrane, the method of formation, and the thermodynamics of the structure — can significantly impact the overall drug delivery process. This study aims to find relationships between these variables and the rate of diffusion of liposomes, the rate at which they leak their contents, and their overall stability. This strategy preserves the low circulation time and diffusive potential characteristic of spherical liposomes without surface ornamentation, and doesn’t require exogenous factors, like radiation, to induce drug release.
Methodology:In past studies it was observed that the 160 nm liposomes were accumulating around the GBM vasculature [1]. Reducing the size should address this by allowing the drug to diffuse to the periphery of the tumor thereby increasing overall uptake. Liposomes less than 100 nm, or small unilamellar vesicles (SULVs), are generally unstable due to membranous stress from a high surface curvature [2]. To relieve this tension, a short chain phospholipid, dihexanoyl phosphatidylcholine (DHPC) was used to attenuate the longer chain phospholipids, dimyristoyl phosphatidylcholine (DMPC) and dimyristoyl phosphatidylglycerol (DMPG). Temperature and concentration of phospholipids primarily dictated the structure, size, and stability of the liposomes [2].
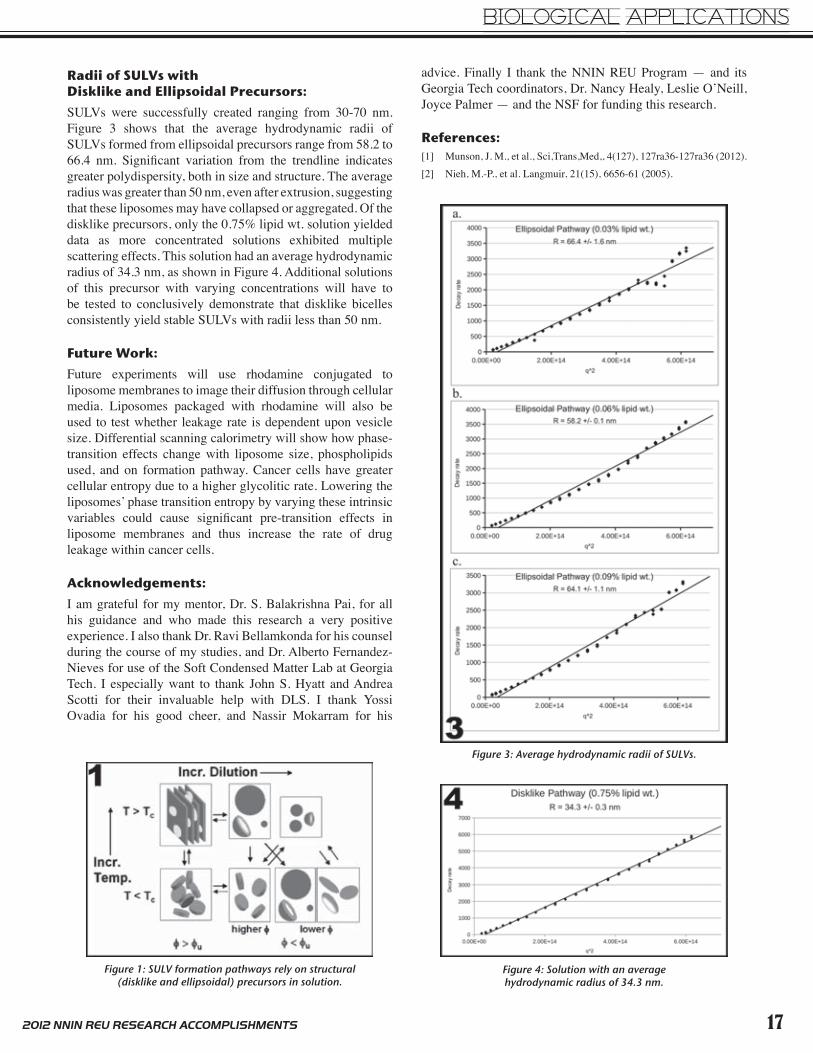
Figure 1 shows how SULV formation pathways rely on structural (disklike and ellipsoidal) precursors in solution, and the parametric ranges they require. The critical temperature is Tc ≈ 23°C, the point at which the phospholipid chain melts. Lamellar sheets were formed at 45°C with 25% lipid wt., and diluted in one step to concentrations between 2.5% and 0.1% lipid wt. Initial dynamic light scattering (DLS) experiments indicated high polydispersity in size suggesting the formation of large liposomes with high thermodynamic stability. Extrusion through a 50 nm nuclepore membrane was predicted to significantly lower the yield, so this pathway was abandoned altogether.
The process was repeated at 4°C forming disklike bicelles at 1.5% to 0.75% lipid wt., and ellipsoids between 0.09% and 0.03% lipid wt. These solutions were heated to 45°C, extruded, and tested using DLS at 37.5°C. The intensity was measured at different angles, and cumulant analysis was used to determine the average decay rate, Γ, shown in Figure 2a, right, where q is the scattering vector and D is the diffusion coefficient. The Einstein-Stokes equation, Figure 2b is used to determine the average hydrodynamic radius, R. Figure 2
BIOLOGICAL APPLICATIONS
172012 NNIN REU RESEARCH ACCOMPLISHMENTS
Radii of SULVs with Disklike and Ellipsoidal Precursors:SULVs were successfully created ranging from 30-70 nm. Figure 3 shows that the average hydrodynamic radii of SULVs formed from ellipsoidal precursors range from 58.2 to 66.4 nm. Significant variation from the trendline indicates greater polydispersity, both in size and structure. The average radius was greater than 50 nm, even after extrusion, suggesting that these liposomes may have collapsed or aggregated. Of the disklike precursors, only the 0.75% lipid wt. solution yielded data as more concentrated solutions exhibited multiple scattering effects. This solution had an average hydrodynamic radius of 34.3 nm, as shown in Figure 4. Additional solutions of this precursor with varying concentrations will have to be tested to conclusively demonstrate that disklike bicelles consistently yield stable SULVs with radii less than 50 nm.
Future Work:Future experiments will use rhodamine conjugated to liposome membranes to image their diffusion through cellular media. Liposomes packaged with rhodamine will also be used to test whether leakage rate is dependent upon vesicle size. Differential scanning calorimetry will show how phase-transition effects change with liposome size, phospholipids used, and on formation pathway. Cancer cells have greater cellular entropy due to a higher glycolitic rate. Lowering the liposomes’ phase transition entropy by varying these intrinsic variables could cause significant pre-transition effects in liposome membranes and thus increase the rate of drug leakage within cancer cells.
Acknowledgements:I am grateful for my mentor, Dr. S. Balakrishna Pai, for all his guidance and who made this research a very positive experience. I also thank Dr. Ravi Bellamkonda for his counsel during the course of my studies, and Dr. Alberto Fernandez-Nieves for use of the Soft Condensed Matter Lab at Georgia Tech. I especially want to thank John S. Hyatt and Andrea Scotti for their invaluable help with DLS. I thank Yossi Ovadia for his good cheer, and Nassir Mokarram for his
advice. Finally I thank the NNIN REU Program — and its Georgia Tech coordinators, Dr. Nancy Healy, Leslie O’Neill, Joyce Palmer — and the NSF for funding this research.
References:[1] Munson, J. M., et al., Sci,Trans,Med,, 4(127), 127ra36-127ra36 (2012).[2] Nieh, M.-P., et al. Langmuir, 21(15), 6656-61 (2005).
Figure 4: Solution with an average hydrodynamic radius of 34.3 nm.
Figure 3: Average hydrodynamic radii of SULVs.
Figure 1: SULV formation pathways rely on structural (disklike and ellipsoidal) precursors in solution.
BIOLOGICAL APPLICATIONS
18 2012 NNIN REU RESEARCH ACCOMPLISHMENTS
Development of an in vitro Muscle Regeneration Model using a Combination of Microfluidics and Micropatterning
Camryn JohnsonBiological Engineering, Louisiana State University at Baton Rouge
NNIN REU Site: Cornell NanoScale Science and Technology Facility, Cornell University, Ithaca, NYNNIN REU Principal Investigator: Dr. Jan Lammerding, Department of Biomedical Engineering
and the Weill Institute for Cell and Molecular Biology, Cornell UniversityNNIN REU Mentor: Dr. Patricia Davidson, Department of Biomedical Engineering
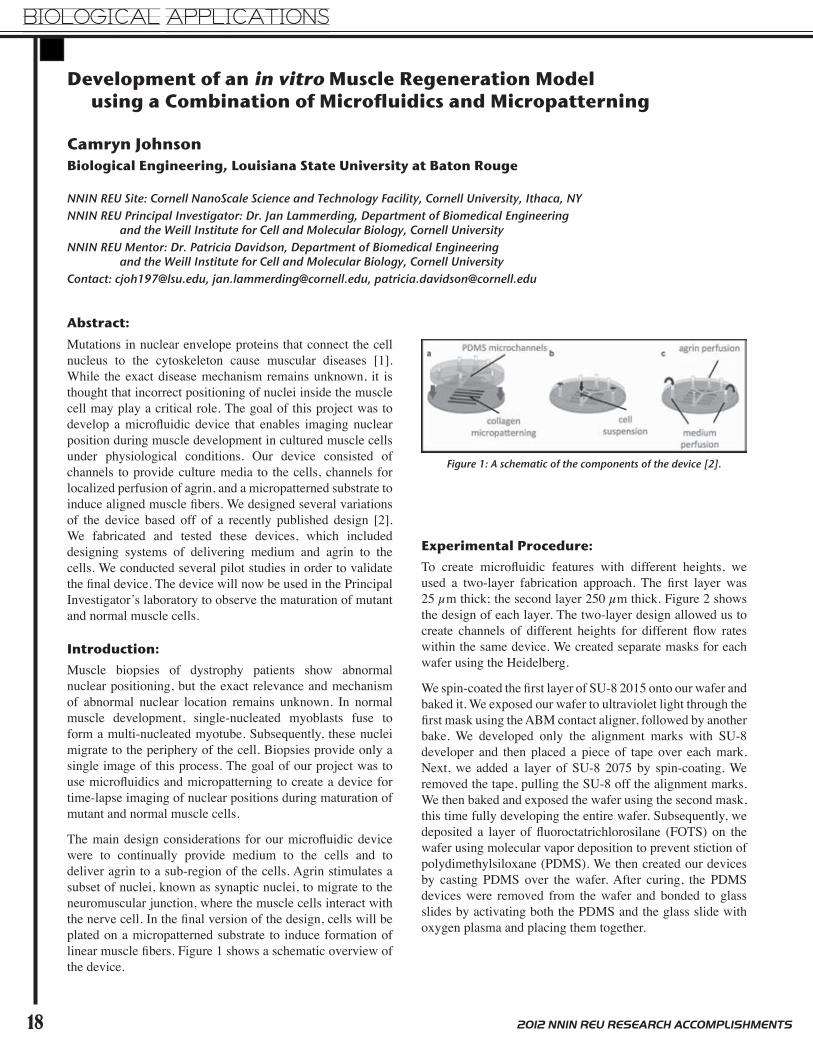
Abstract:Mutations in nuclear envelope proteins that connect the cell nucleus to the cytoskeleton cause muscular diseases [1]. While the exact disease mechanism remains unknown, it is thought that incorrect positioning of nuclei inside the muscle cell may play a critical role. The goal of this project was to develop a microfluidic device that enables imaging nuclear position during muscle development in cultured muscle cells under physiological conditions. Our device consisted of channels to provide culture media to the cells, channels for localized perfusion of agrin, and a micropatterned substrate to induce aligned muscle fibers. We designed several variations of the device based off of a recently published design [2]. We fabricated and tested these devices, which included designing systems of delivering medium and agrin to the cells. We conducted several pilot studies in order to validate the final device. The device will now be used in the Principal Investigator’s laboratory to observe the maturation of mutant and normal muscle cells.
Introduction:Muscle biopsies of dystrophy patients show abnormal nuclear positioning, but the exact relevance and mechanism of abnormal nuclear location remains unknown. In normal muscle development, single-nucleated myoblasts fuse to form a multi-nucleated myotube. Subsequently, these nuclei migrate to the periphery of the cell. Biopsies provide only a single image of this process. The goal of our project was to use microfluidics and micropatterning to create a device for time-lapse imaging of nuclear positions during maturation of mutant and normal muscle cells.
The main design considerations for our microfluidic device were to continually provide medium to the cells and to deliver agrin to a sub-region of the cells. Agrin stimulates a subset of nuclei, known as synaptic nuclei, to migrate to the neuromuscular junction, where the muscle cells interact with the nerve cell. In the final version of the design, cells will be plated on a micropatterned substrate to induce formation of linear muscle fibers. Figure 1 shows a schematic overview of the device.
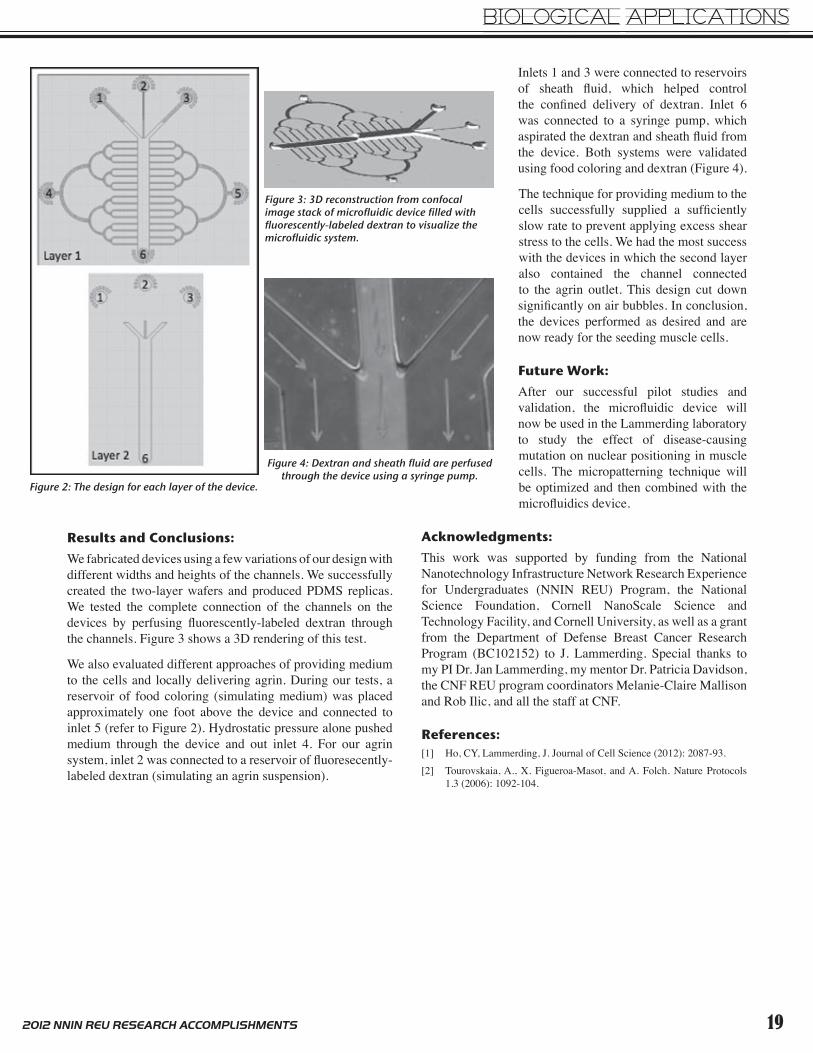
Experimental Procedure:To create microfluidic features with different heights, we used a two-layer fabrication approach. The first layer was 25 µm thick; the second layer 250 µm thick. Figure 2 shows the design of each layer. The two-layer design allowed us to create channels of different heights for different flow rates within the same device. We created separate masks for each wafer using the Heidelberg.
We spin-coated the first layer of SU-8 2015 onto our wafer and baked it. We exposed our wafer to ultraviolet light through the first mask using the ABM contact aligner, followed by another bake. We developed only the alignment marks with SU-8 developer and then placed a piece of tape over each mark. Next, we added a layer of SU-8 2075 by spin-coating. We removed the tape, pulling the SU-8 off the alignment marks. We then baked and exposed the wafer using the second mask, this time fully developing the entire wafer. Subsequently, we deposited a layer of fluoroctatri chlorosilane (FOTS) on the wafer using molecular vapor deposition to prevent stiction of polydimethyl siloxane (PDMS). We then created our devices by casting PDMS over the wafer. After curing, the PDMS devices were removed from the wafer and bonded to glass slides by activating both the PDMS and the glass slide with oxygen plasma and placing them together.
Figure 1: A schematic of the components of the device [2].
BIOLOGICAL APPLICATIONS
192012 NNIN REU RESEARCH ACCOMPLISHMENTS
Figure 4: Dextran and sheath fluid are perfused through the device using a syringe pump.
Figure 3: 3D reconstruction from confocal image stack of microfluidic device filled with fluorescently-labeled dextran to visualize the microfluidic system.
Results and Conclusions:We fabricated devices using a few variations of our design with different widths and heights of the channels. We successfully created the two-layer wafers and produced PDMS replicas. We tested the complete connection of the channels on the devices by perfusing fluorescently-labeled dextran through the channels. Figure 3 shows a 3D rendering of this test.
We also evaluated different approaches of providing medium to the cells and locally delivering agrin. During our tests, a reservoir of food coloring (simulating medium) was placed approximately one foot above the device and connected to inlet 5 (refer to Figure 2). Hydrostatic pressure alone pushed medium through the device and out inlet 4. For our agrin system, inlet 2 was connected to a reservoir of fluoresecently-labeled dextran (simulating an agrin suspension).
Inlets 1 and 3 were connected to reservoirs of sheath fluid, which helped control the confined delivery of dextran. Inlet 6 was connected to a syringe pump, which aspirated the dextran and sheath fluid from the device. Both systems were validated using food coloring and dextran (Figure 4).
The technique for providing medium to the cells successfully supplied a sufficiently slow rate to prevent applying excess shear stress to the cells. We had the most success with the devices in which the second layer also contained the channel connected to the agrin outlet. This design cut down significantly on air bubbles. In conclusion, the devices performed as desired and are now ready for the seeding muscle cells.
Future Work:After our successful pilot studies and validation, the microfluidic device will now be used in the Lammerding laboratory to study the effect of disease-causing mutation on nuclear positioning in muscle cells. The micropatterning technique will be optimized and then combined with the microfluidics device.
Acknowledgments:This work was supported by funding from the National Nanotechnology Infrastructure Network Research Experience for Undergraduates (NNIN REU) Program, the National Science Foundation, Cornell NanoScale Science and Technology Facility, and Cornell University, as well as a grant from the Department of Defense Breast Cancer Research Program (BC102152) to J. Lammerding. Special thanks to my PI Dr. Jan Lammerding, my mentor Dr. Patricia Davidson, the CNF REU program coordinators Melanie-Claire Mallison and Rob Ilic, and all the staff at CNF.
References:[1] Ho, CY, Lammerding, J. Journal of Cell Science (2012): 2087-93.[2] Tourovskaia, A., X. Figueroa-Masot, and A. Folch. Nature Protocols
1.3 (2006): 1092-104.
Figure 2: The design for each layer of the device.
BIOLOGICAL APPLICATIONS
20 2012 NNIN REU RESEARCH ACCOMPLISHMENTS
A Novel, Photoswitchable Poly(ethylene glycol) Biosurface with Applications for High-Throughput Cell Migration Assays
Olivia LambdinBiological Systems Engineering, University of Nebraska - Lincoln
NNIN iREU Site: National Institute for Materials Science (NIMS), Tsukuba, Ibaraki, JapanNNIN iREU Principal Investigator: Dr. Yukio Nagasaki, International Center for
Materials Nanoarchitectonics, National Institute for Material ScienceNNIN iREU Mentor: Dr. Jun Nakanishi, International Center for Materials
Introduction:Mimicking in vivo conditions in vitro is of great importance to a wide range of disciplines. Biologists who wish to conduct more accurate studies of biological processes, tissue engineers who aspire to reconstruct organs, and pharmacologists who aim to better understand the effect of drugs on biological systems all depend on model systems that replicate the native microstructure of the human body. Various approaches have been developed to achieve this, including soft lithography and microfluidic devices. Novel biosurfaces that change cell adhesiveness via external stimuli (heat, voltage, light, etc.) – labeled “dynamic substrates” – have also attracted much attention as a viable option [1]. This summer, we investigated the latter, a novel photoswitchable poly(ethylene glycol) (PEG) biosurface that is responsive to UV light, which has also been tailored towards glass- bottom, 96-well plates. The surface shows promise for cell migration studies and other biological applications.
Material and Methods:Surface Functionalization. Three types of photocleavable PEG polymers were synthesized as previously described [2]. In short, PEG-azides with molecular weights of 2000 Da, 5000 Da, and 11,000 Da were each combined with a photocleavable linker, 1-(5-methoxy-2-nitro-4-prop-2-ynyloxyphenyl)ethyl N-succinimidyl carbonate, in a 1 to 1.1 molar ratio under a copper catalyst and acetonitrile solvent. Compounds were purified by recrystallization and then analyzed with NMR.
Surface Functionalization. The functionalization of glass-bottom wells in 96-well plates required three steps. After washing with methanol, 50 µL of a 1 mg/mL poly-d-lysine (PDL) solution in 0.15 M NaCl was allowed to adsorb onto the glass surface. Following washing with H2O, 50 µL of 1 mg/mL photocleavable PEG in 0.1 M sodium phosphate (pH = 7) and 0.6 M potassium sulfate was added to induce overnight PEGylation of the PDL surface. For mixed-chain tethered surfaces, PEGylation was repeated with a photocleavable PEG of lower molecular weight.
Photopatterning. A photomask was placed in the field diaphragm of an inverted microscope, and a mercury arc lamp exposed individual wells to a 10 J/cm2 dose of UV light (l = 365 nm) through a 10X objective.
Cell Deposition. Madin-Darby canine kidney cells (MDCK) were deposited onto the photopatterned surfaces at 15,000 cells per well. One hour later, the surfaces were washed with medium three times. Cells were incubated overnight before further studies were conducted.
Cell Migration Studies. Various concentrations of cytochalasin d were added to cell-patterned wells. A flood exposure of 10 J/cm2 initiated cell migration to previously uninhabited areas. Cell migration was monitored at approximately two-hour intervals and MetaMorph software was used to calculate change in cell-pattern area.
Results and Discussion:Our project focused on the functionalization, characterization, and application of a novel, photoswitchable surface to glass-bottom, 96-well plates, an inexpensive platform for high-throughput bioassays. The platform we investigated was a photocleavable, mixed-chain-tethered PEG surface grafted to PDL (PDL-g-PEG).
Both PEG and PDL have attracted much attention in literature. Because PDL is a cationic polyelectrolyte, it can easily adsorb onto negatively charged surfaces and is commonly used to enhance cell adhesion. On the other hand, PEG-tethered surfaces are anti-biofouling, where the effectiveness of repelling cells and proteins depends on the chain length and density of the PEG brush. However, a tradeoff exists between PEG length and brush density. In order to achieve both, a shorter PEG brush was introduced to a longer PEG-tethered surface. This mixed-chain-tethered PEG surface retained the long chain length while having increased density [3].
BIOLOGICAL APPLICATIONS
212012 NNIN REU RESEARCH ACCOMPLISHMENTS
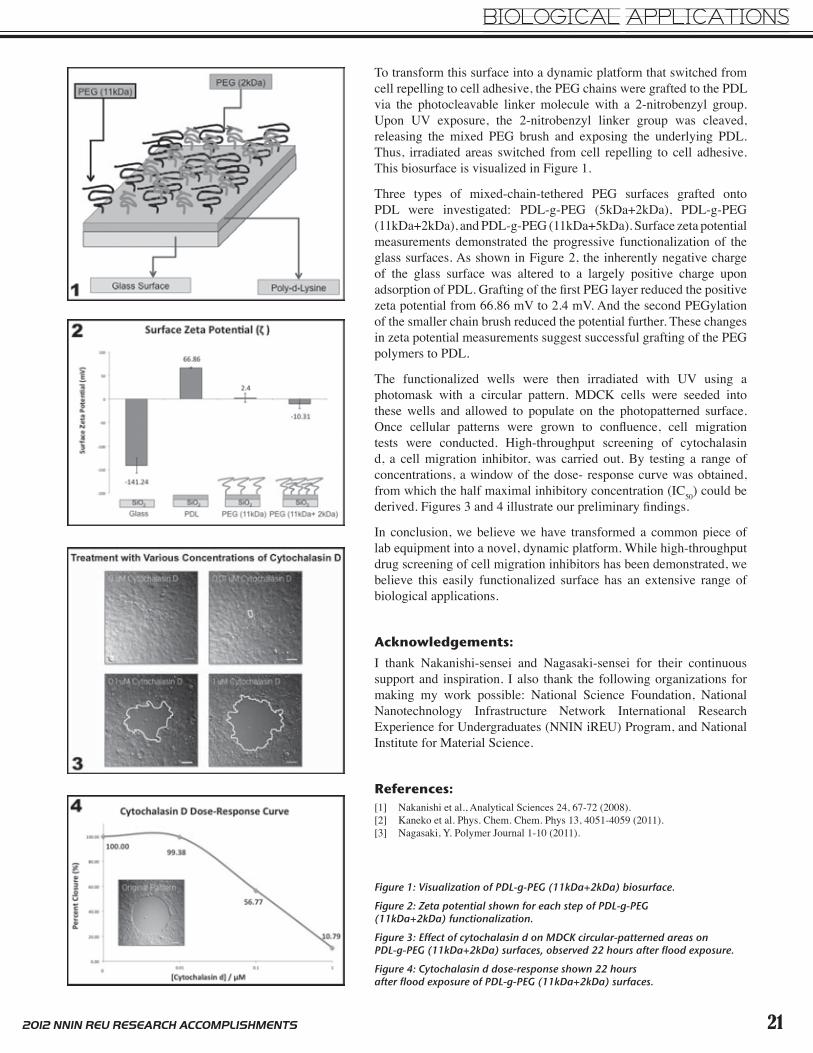
To transform this surface into a dynamic platform that switched from cell repelling to cell adhesive, the PEG chains were grafted to the PDL via the photocleavable linker molecule with a 2-nitrobenzyl group. Upon UV exposure, the 2-nitrobenzyl linker group was cleaved, releasing the mixed PEG brush and exposing the underlying PDL. Thus, irradiated areas switched from cell repelling to cell adhesive. This biosurface is visualized in Figure 1.
Three types of mixed-chain-tethered PEG surfaces grafted onto PDL were investigated: PDL-g-PEG (5kDa+2kDa), PDL-g-PEG (11kDa+2kDa), and PDL-g-PEG (11kDa+5kDa). Surface zeta potential measurements demonstrated the progressive functionalization of the glass surfaces. As shown in Figure 2, the inherently negative charge of the glass surface was altered to a largely positive charge upon adsorption of PDL. Grafting of the first PEG layer reduced the positive zeta potential from 66.86 mV to 2.4 mV. And the second PEGylation of the smaller chain brush reduced the potential further. These changes in zeta potential measurements suggest successful grafting of the PEG polymers to PDL.
The functionalized wells were then irradiated with UV using a photomask with a circular pattern. MDCK cells were seeded into these wells and allowed to populate on the photopatterned surface. Once cellular patterns were grown to confluence, cell migration tests were conducted. High-throughput screening of cytochalasin d, a cell migration inhibitor, was carried out. By testing a range of concentrations, a window of the dose- response curve was obtained, from which the half maximal inhibitory concentration (IC50) could be derived. Figures 3 and 4 illustrate our preliminary findings.
In conclusion, we believe we have transformed a common piece of lab equipment into a novel, dynamic platform. While high-throughput drug screening of cell migration inhibitors has been demonstrated, we believe this easily functionalized surface has an extensive range of biological applications.
Acknowledgements:I thank Nakanishi-sensei and Nagasaki-sensei for their continuous support and inspiration. I also thank the following organizations for making my work possible: National Science Foundation, National Nanotechnology Infrastructure Network International Research Experience for Undergraduates (NNIN iREU) Program, and National Institute for Material Science.
References:[1] Nakanishi et al., Analytical Sciences 24, 67-72 (2008). [2] Kaneko et al. Phys. Chem. Chem. Phys 13, 4051-4059 (2011). [3] Nagasaki, Y. Polymer Journal 1-10 (2011).
Figure 1: Visualization of PDL-g-PEG (11kDa+2kDa) biosurface.Figure 2: Zeta potential shown for each step of PDL-g-PEG (11kDa+2kDa) functionalization.Figure 3: Effect of cytochalasin d on MDCK circular-patterned areas on PDL-g-PEG (11kDa+2kDa) surfaces, observed 22 hours after flood exposure.Figure 4: Cytochalasin d dose-response shown 22 hours after flood exposure of PDL-g-PEG (11kDa+2kDa) surfaces.
BIOLOGICAL APPLICATIONS
22 2012 NNIN REU RESEARCH ACCOMPLISHMENTS
The Effectiveness of Physical Sunscreens in Preventing UVB-Induced Mechanical Damage to the Stratum Corneum
Corinne LampeBiomedical Engineering, University of Rochester
NNIN REU Site: Stanford Nanofabrication Facility, Stanford University, Stanford, CA NNIN REU Principal Investigator: Prof. Reinhold Dauskardt, Materials Science, Stanford UniversityNNIN REU Mentor: Krysta Biniek, Materials Science, Stanford UniversityContact: [email protected], [email protected], [email protected]
Introduction:The stratum corneum (SC) is the outermost layer of skin and the body’s first line of defense against environmental exposures such as ultraviolet (UV) radiation [1]. The SC consists of cells, called corneocytes, held together by corneodesmosomes and intercellular lipids [1]. Previous research in the Dauskardt lab has shown that medium wave UV (UVB) decreases the cohesion of corneocytes, quantified by a decrease in delamination energy, by affecting the properties of intercellular lipids and corneodesmosomes. The focus of this project was to investigate whether physical sunscreens, whose active ingredients are zinc oxide (ZnO) and titanium dioxide (TiO2), prevent UVB-induced damage to the mechanical properties of the SC.
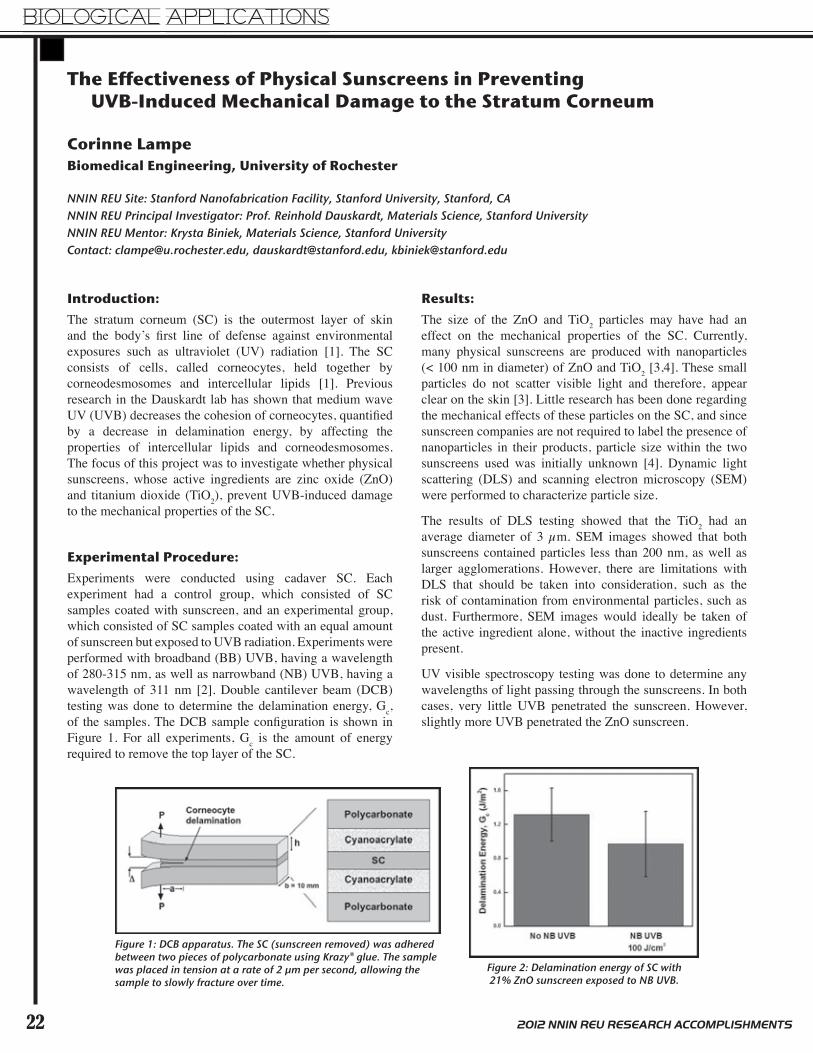
Experimental Procedure: Experiments were conducted using cadaver SC. Each experiment had a control group, which consisted of SC samples coated with sunscreen, and an experimental group, which consisted of SC samples coated with an equal amount of sunscreen but exposed to UVB radiation. Experiments were performed with broadband (BB) UVB, having a wavelength of 280-315 nm, as well as narrowband (NB) UVB, having a wavelength of 311 nm [2]. Double cantilever beam (DCB) testing was done to determine the delamination energy, Gc, of the samples. The DCB sample configuration is shown in Figure 1. For all experiments, Gc is the amount of energy required to remove the top layer of the SC.
Results:The size of the ZnO and TiO2 particles may have had an effect on the mechanical properties of the SC. Currently, many physical sunscreens are produced with nanoparticles (< 100 nm in diameter) of ZnO and TiO2 [3,4]. These small particles do not scatter visible light and therefore, appear clear on the skin [3]. Little research has been done regarding the mechanical effects of these particles on the SC, and since sunscreen companies are not required to label the presence of nanoparticles in their products, particle size within the two sunscreens used was initially unknown [4]. Dynamic light scattering (DLS) and scanning electron microscopy (SEM) were performed to characterize particle size.
The results of DLS testing showed that the TiO2 had an average diameter of 3 µm. SEM images showed that both sunscreens contained particles less than 200 nm, as well as larger agglomerations. However, there are limitations with DLS that should be taken into consideration, such as the risk of contamination from environmental particles, such as dust. Furthermore, SEM images would ideally be taken of the active ingredient alone, without the inactive ingredients present.
UV visible spectroscopy testing was done to determine any wavelengths of light passing through the sunscreens. In both cases, very little UVB penetrated the sunscreen. However, slightly more UVB penetrated the ZnO sunscreen.
Figure 1: DCB apparatus. The SC (sunscreen removed) was adhered between two pieces of polycarbonate using Krazy® glue. The sample was placed in tension at a rate of 2 µm per second, allowing the sample to slowly fracture over time.
Figure 2: Delamination energy of SC with 21% ZnO sunscreen exposed to NB UVB.
BIOLOGICAL APPLICATIONS
232012 NNIN REU RESEARCH ACCOMPLISHMENTS
When samples with a sunscreen of SPF 30 and an active ingredient of 21% ZnO were exposed to UVB, Gc slightly decreased, although it was within statistical error (Figure 2). Based on previous data revealing a significant decrease in Gc with increased UVB exposure, the slight difference in Gc between the radiated and non-radiated samples suggests that the sunscreen was effective in maintaining the mechanical structure of the SC.
Like the zinc oxide sunscreen, the TiO2 sunscreen (SPF 30, 9.1% TiO2) was relatively effective in maintaining the mechanical structure of the SC. The sunscreen appeared to be effective regardless of the dosage and type of radiation (BB versus NB).
Conclusions:DLS and SEM testing showed that the TiO2 and ZnO sun-screens contained micron-and nano-sized particles. The micron-sized particles may have resulted from agglomerations of nanoparticles.
The two sunscreens were effective in preventing mechanical damage to the SC when exposed to UVB. However, the Gc of the control group was not identical to the Gc of the radiated samples. Radiated samples coated with ZnO had a slightly lower Gc when compared to the control, suggesting that slightly more UVB was penetrating the sunscreen than was ideal. In contrast, radiated samples coated with TiO2 had a slightly higher Gc when compared to the control, suggesting that there is a unique interaction between UVB and TiO2 that may slightly increase the cohesion of corneocytes.
Future Work:We would like to perform further experiments to verify the slight increase in Gc observed with the radiated samples
coated with TiO2. Additionally, particle size within more sunscreens should be characterized, and the UV exposure experiments should be repeated using sunscreens found to have nanoparticles to determine any mechanical effects on the SC caused by nanoparticles in combination with UV. Finally, we would like to look at the effects of UVA on the Gc of the SC. It is important to understand what affects the mechanical structure of the SC because with a loss of structure comes a loss of barrier function.
Acknowledgements:I would like to thank Prof. Reinhold Dauskardt, Krysta Biniek, the Dauskardt lab, Dr. Michael Deal, Maureen Baran, James Conway, Stanford Nanofabrication Facility, Stanford’s Center for Integrated Systems, National Science Foundation and National Nanotechnology Infrastructure Network Research Experience for Undergraduates Program.
References:[1] Harding, Clive R. “The Stratum Corneum: Structure and Function in
Health and Disease.” Dermatologic Therapy 17 (2004): 6-15. Blackwell Publishing, Inc.
[2] Svobodova, Alena, Daniela Walterova, and Jitka Vostalova. “Ultraviolet Light Induced Alteration to the Skin.” Biomed Pap Med Fac Univ Palacky Olomouc Czech Repub. 150.1 (2006): 25-38.
[3] “Clear Sunscreen: How Light Interacts with Matter.” NanoSense Activities. SRI International, 2008. <http://nanosense.org/activities/clearsunscreen/index.html>.
[4] Burnett, M.E., and S.Q. Wang. “Current Sunscreen Controversies: a Critical Review.” Photodermatology, Photo immunology and Photomedicine 27 (2011): 58-67. John Wiley & Sons A/S.
Figure 3, above: Delamination energy of SC with 9.1% TiO2 sunscreen exposed to BB UVB.
Figure 4, right: Delamination energy of SC with 9.1% TiO2 sunscreen exposed to NB UVB.
BIOLOGICAL APPLICATIONS
24 2012 NNIN REU RESEARCH ACCOMPLISHMENTS
Monitoring and Imaging Hypoxic Cells using Perfluorinated Near-Infrared Fluorescent Micelles
Kaleigh MargitaChemistry, Newberry College
NNIN REU Site: Nano Research Facility, Washington University in St. Louis, St. Louis, MONNIN REU Principal Investigator: Prof. Samuel Achilefu, Optical Radiology Laboratory,
Mallinckrodt Institute of Radiology, Washington University in St. Louis School of MedicineNNIN REU Mentor: Dr. Rui Tang, Optical Radiology Laboratory, Mallinckrodt Institute of Radiology,
Introduction:In the poorly formed blood vessel networks of solid tumors, hypoxic regions, or areas of low oxygen concentration, develop due to the ineffective delivery of oxygen by the cells. These hypoxic tumors are often resistant to conventional treatment methods [1]. Therefore, the development of a complementary strategy to detect and deliver oxygen to hypoxic tumors would improve treatment response. This could be achieved with multifunctional nanoparticles that are designed to report hypoxia and deliver oxygen to the target tissue. Specifically, quantum dots (Qdots), nanometer semiconductor particles, are used in optical imaging because of their near infrared florescence properties, brightness, photostability and potential for multivalent functionalization. In this study, we functionalized Qdots with perfluorocarbons to form novel micelles. We chose perfluorocarbons because of their oxygen carrying abilities [2]. To solubilize the nanoparticle in aqueous solution, an amphiphilic molecule was also prepared and used to formulate the micelle construct [3]. Thus, we developed new perfluorocarbon-coated quantum dots that are capable of monitoring and imaging hypoxic cells. In addition, the materials can effectively deliver oxygen to hypoxic tissues, which will improve the treatment of these difficult tumors.
Materials:PbS Quantum Evidot was acquired from Evident Technology (Troy, NY). Perfluorodecane-thiol, perfluoroctylbromide, toluene, and hexane were purchased from Sigma Aldrich (St. Louis, MO). Oxygen UHP was obtained from Airgas (St. Louis, MO) and deionized water was obtained from MillQ System (Billerica, MA).
Synthesis of the Micelle:Lead sulfide quantum dots (Qdots, 10 mg/mL) were functionalized with multiple perfluorocarbon surfactants. First, perfluorodecane (PFC) thiol was added to Qdots based on a previous research patent, resulting in a 0.05 volume ratio of Qdots in PFC-thiol [4]. The trioctylphosphine oxide (TOPO) ligands originally coating the Qdots were replaced by the PFC-thiol surfactant. Second, polyethylene glycol–perfluorocarbon (PFC-PEG, 16 mg) was synthesized and added to 20 µl of the 0.05 concentrated sample PFC-thiol Qdot solution, based on concentration calculations ensuring that each individual quantum dot would be completely coated with PFC-PEG instead of forming large aggregates.
After centrifugation, the suspension of the micelle in deionized water (200 µL) illustrated that the PFC-PEG
efficiently made the Qdots hydrophilic. To a new solution, with a similar approach, 20 µl of PFOB saturated the solution according to surface area calculations. The final Qdot construct formed is shown in Figure 1.
The novel micelle construct was then saturated in an oxygenated environment for two hours. Fluorescent quenching was observed, due to PFOB’s ligand structure, which effectively holds oxygen molecules. An attempt at restoring the fluorescence was completed by displacing the oxygen molecules with nitrogen, but to prove the PFOB containing the oxygen was the cause of the quenching, the Qdots and samples functionalized with each surfactant addition were also submitted to the oxygenated environment for comparison of fluorescent emission.
Figure 1: Micelle construct.
BIOLOGICAL APPLICATIONS
252012 NNIN REU RESEARCH ACCOMPLISHMENTS
Characterization:The size of the initial PbS Qdots and Qdots with each surfactant coating addition was confirmed by transmission electron microscopy (TEM) images taken on the FEI Tecnai Spirit 120KV, and the hydrodynamic diameter measurements from the dynamic light scattering (DLS) information obtained from the Malvern Zetasizer Nano ZS. The change in size after each surfactant layer addition and of the final micelle (with and without PFOB) was compared. Fluorescence emission data was recorded from the Fluorolog-3 spectrophotometer (Horiba Jobin Yvon). An optimized concentration was determined via the emission efficiency comparison. The quenching effect was also observed via the emission measurement of the micelle construct.
Results and Conclusions:The TEM images (Figure 2-A) for the PbS Qdots in toluene collaborated with the DLS (Figure 3) measurement of the
hydrodynamic diameter including the TOPO ligands, proving the 2 nm size. As hypothesized, the replacement of the Qdot TOPO ligands in the addition of the relatively smaller PFC-thiol ligand was shown by the slight decrease in the DLS size. The production of varying concentrations of PFC-thiol and Qdots showed that low amounts of PFC-thiol or high amounts of Qdots can cause the unsuccessful coating and Qdot precipitation. A temporal evolution of the florescence of the remaining concentrations of 0.05 and 0.2 volumes of Qdots in PFC-thiol proved that emission was not concentration dependent after 10 µl of Qdot. The 0.05 and 0.1 concentrated samples were observed over five days and the 0.05 sample had a fairly high florescence, for a less concentrated sample, making it the feasible choice.
With the next surfactant addition, DLS data (Figure 3) showed an increase in size indicating the PFC-PEG surfactant successfully coated the Qdots. After centrifugation, the brown pellets formed were suspended in water demonstrating that the successful formation of hydrophilic micelle. TEM images of the micelle are shown in Figure 2-B. Micelles containing PFOB were successfully created via similar procedure and DLS (Figure 3) and TEM (Figure 2-C) information obtained showed no size increase compared to the micelle without PFOB. The fluorescence of the micelle containing PFOB showed improved emission efficiency due to the better coating of Qdots in this construct.
Oxygenation of the micelle construct was successful and quenched fluorescence was observed. De-oxygenation with nitrogen and restoring the fluorescence of this construct need to be further investigated.
Conclusions:Qdots were successfully functionalized with perfluorocarbons compounds and solubilized in an aqueous solution for the monitoring and imaging of hypoxic cells. The micelle construct was also proven capable of containing oxygen to be delivered to hypoxic cell regions.
Acknowledgements:Thank you to Professor Samuel Achilefu, Dr. Rui Tang, and the National Nanotechnology Infrastructure Network REU Program for this opportunity.
References:[1] Brown, J.M. Bruce F. Cain Memorial Award Lecture. Cancer Res.
1999, 59 pp 5863-5870.[2] Caruthers, S; etc. Proceedings of the IEEE. 2008, 96, (3), pp 397-415.[3] Maibaum, L.; etc. J. Phys. Chem, 2004, 108, 6778-6781.[4] Chung, B.H.; etc. U.S. Patent 20100233094, Sep. 16, 2010.
Figure 2, top: TEM images; A) Qdot in toluene, B) Micelle without PFOB, and C) Micelle with PFOB.
Figure 3, middle: DLS for each surfactant addition.
Figure 4, bottom: Fluorescence of micelles compared to surfactant additions.
BIOLOGICAL APPLICATIONS
26 2012 NNIN REU RESEARCH ACCOMPLISHMENTS
Measuring the Effects of RAD51 Assembly on dsDNA with Magnetic Tweezers
Morgan McGuinnessPhysics and Mathematics, Lafayette College
NNIN iREU Site: Delft University of Technology (TU Delft), NetherlandsNNIN iREU Principal Investigator: Nynke Dekker, Bionanoscience, Delft University of TechnologyNNIN iREU Mentor: Mina Lee, Bionanoscience, Delft University of TechnologyContact: [email protected], [email protected], [email protected]
Introduction:RAD51 is a protein in eukaryotic cells that is involved in the repair of double-strand breaks in deoxyribonucleic acid (DNA) by homologous recombination. RAD51 assembles on the resected single strands of the damaged region of the DNA, finds a homologous sequence of an intact double-stranded DNA (dsDNA) molecule, and promotes single-stranded DNA (ssDNA) invasion into this sequence [1]. Studying this protein can help us to understand the activity of RAD51 within the nucleus and properties of RAD51-dsDNA filaments during crucial repair processes. Magnetic tweezers provides a means to conduct experiments with RAD51 and dsDNA.
Magnetic tweezers are a single-molecule technique that allows us to apply a torque and an upward force to DNA molecules. The conventional magnetic tweezers setup consists of two cubic magnets above a flow cell, inside which paramagnetic beads are tethered to the bottom via a DNA molecule. As the magnets are rotated, raised, or lowered, the paramagnetic bead will rotate or experience a lesser or greater magnetic force, respectively. The magnetic torquetweezers (MTT) setup is similar to conventional mag-netic tweezers, however it consists of a cylindrical magnet that applies an upward force to the tethered bead and a small side magnet that applies a torque. The torsional trap stiffness of MTT is much weaker than that of conventional magnetic tweezers, allowing for greater angular fluctuations of the tethered bead and the measurement of torque [2]. In our experiment, we use MTT to calculate the torsional modulus of RAD51-DNA filaments under torsional stress.
Methods:Anti-digoxigenin (100 µg/ml, Roche) and bovine serum albumin (BSA; Sigma) were incubated to allow for DNA tethering and to passivate
the surface, respectively. The 8 kB dsDNA, functionalized with digoxigenin on one end and with biotin on the other, was first bound to 1.4 µm radius paramagnetic M-270 beads (Invitrogen). The tethered beads were then incubated inside the flow cell to allow attachment of DNA to the bottom surface. Most tethered beads were bound to 0.5 µm radius biotinylated latex Fluosphere fiducial beads (Invitrogen). We used 1.5 µm radius nonmagnetic latex beads (Life Sciences) that were bound nonspecifically to the bottom surface of the flow cell as reference beads to correct for drift in the magnetic tweezers microscope.
The flow cell was placed over an oil-immersion objective (Olympus ACH 100X, numerical aperture = 1.25) connected to a CCD camera (Pulnix TM-6710CL), and illuminated with collimated LED. Preliminary measurements were taken with conventional magnetic tweezers to ensure that both strands of the molecule of interest were intact and that the paramagnetic bead was tethered by only one molecule. The
flow cell surface was passivated with BSA again, and MTT were then used. RAD51 was incubated in the flow cell while the magnet was incrementally rotated to -300 turns to prevent loops, or supercoils, from forming in the DNA molecule while the RAD51 assembled. To track the z-height of the paramagnetic bead, the diffraction pattern calibration profiles of one paramagnetic and one reference bead were used [3]. Angular tracking was made possible by the attachment of a small marker bead to the tethered bead [2] (Figure 1).
Buffer Conditions:A TE tethering buffer (200 mM NaCl, 10 mM Tris-HCl (pH 7.5), 1 mM EDTA, and 10 mM NaN3 supplemented with 0.01-0.02% Triton-X during and after the bead-DNA binding process) was used
Figure 1: The MTT setup is shown with the dashed lines representing magnetic field lines.
BIOLOGICAL APPLICATIONS
272012 NNIN REU RESEARCH ACCOMPLISHMENTS
during flow cell preparation. Preliminary measurements were carried out in 100 mM NaCl buffer (100 mM NaCl, 10 mM Tris-HCl (pH 7.5), 1 mM EDTA, 10 mM NaN3 supplemented with 0.01-0.02% Triton-X). The binding of RAD51 to DNA and measurements with MTT were carried out in Ca2+ Assembly buffer (25 mM Tris-HCl (pH 7.5), 25 mM KCl, 2 mM CaCl2, 1 mM DTT, 1 mM ATP, 0.5 mg/ml BSA, and 0.02-0.05% Triton-X).
Results:We derived the torsional modulus from the torque build-up of the RAD51-dsDNA filament after N turns, which was equal to 2πNkBTC/LC [2]. Here, kB was the Boltzmann constant, T was temperature, and C and LC were the torsional modulus and contour lengths of the RAD51-dsDNA molecule, respectively, which were derived from a force-extension curve.
Figure 2 shows the force-extension curve for bare dsDNA, and Figure 3 shows the force-extension curve for a RAD51-dsDNAfilament. LC is a function of force, and from these figures we see that LC of the bare dsDNA was 2.88 µm and LC of the RAD51-dsDNA filament was 4.09 µm. Figure 4 shows the mean angle of the filament versus N, determined by angular tracking of the paramagnetic bead. The torsional modulus was 553 ± 80.2 nm at 3.5 pN.
Discussion:Previous studies have found that RAD51 assembly results in a ~ 50% increase in LC of the dsDNA filament [1]. This is consistent with our measurements, which showed a 42.01% increase in LC. Lipfert, et al. [2], measured the torsional modulus of bare 8 kB dsDNA and RecA-dsDNA (RecA is a protein in bacteria homologous to RAD51) to be ~ 95 nm and 173 ± 5 nm at 3.5 pN, respectfully. Comparing this with our results, we see that RAD51 assembly increased the torsional modulus of bare dsDNA by ~ 580%, in contrast to a 180% increase caused by RecA assembly.
Acknowledgements:This research was supported by the National Nanotechnology Infrastructure Network International Research Experience for Undergraduates (NNIN iREU) Program and the National Science Foundation. I would also like to thank the Nynke Dekker Lab at the Delft University of Technology for their valuable guidance and support.
References:[1] Hilario, J., Amitani, I., et al. Dutch PNAS. 2009, 106, 361-368.[2] Lipfert, J., Kerssemakers, J., et al. Nat. Methods. 2010, 7, 977-980.[3] Vilfan, I. D., Lipfert, J., et al. Handbook of Single-Molecule Biophysics.
2009, 371-395.
Figure 4: The torsional modulus is derived from the mean angle of the filament versus N.
Figure 2: The force-extension curve of the bare dsDNA filament gives LC of that filament.
Figure 3: The force-extension curve of the RAD51-dsDNA filament gives LC of that filament.
BIOLOGICAL APPLICATIONS
28 2012 NNIN REU RESEARCH ACCOMPLISHMENTS
Fabrication of a Selective Ion Pump: Anodization of an Aluminum Oxide Membrane
Christopher NakamotoChemistry, Beloit College
NNIN REU Site: Nanotech, University of California, Santa Barbara, CANNIN REU Principal Investigator: Dr. Luke Theogarajan, Electrical and Computer Engr., University of California, Santa BarbaraNNIN REU Mentor: Samuel Beach, Electrical and Computer Engineering, University of California, Santa BarbaraContact: [email protected], [email protected], [email protected]
Figure 1: An outline of the fabrication process.
Abstract:Anodized aluminum oxide nanoporous membranes show great potential for biological interfaces due to their controllable pore size, pore regularity, and biological stability. In this study, anodized aluminum oxide was investigated for use in a through silicon selective neural ion pump. A thin layer of aluminum and silicon nitride was suspended over a 120 µm by 120 µm window in a silicon wafer. The anodization of the aluminum layer was achieved using sulfuric or oxalic acid at voltages between 12.5 and 40 V at 1°C, to form pores between 12.5 and 27.5 nm. The silicon nitride and alumina barrier layer formed were then etched using reactive ion etching and phosphoric acid etching to form a suspended aluminum oxide nanopore membrane.
Introduction:Electronically interfacing with nervous systems holds immense potential for restoring function to damaged sensory organs [1]. Neural network interfacing, however, has thus
far been limited by dangers and inefficiencies in electrode stimulation of neurons [2]. Implementing a selective neural ion pump to stimulate a neural response instead can stimulate neurons more safely and efficiently, but for this method to be practical, pumps would have to be small enough to reference individual or small groups of neurons and quickly deliver sufficient amounts of K+ [3]. This can be achieved by decreasing the path length the K+ would have to travel by fabricating a three dimensional stack device with a thin rigid membrane, in contrast to planar ion pumps demonstrated by Richter-Dahlforsm et al. [4].
In this study, nanoporous anodized aluminum oxide (AAO) was tested as a membrane material, because it demonstrates controllable pore size, pore regularity, and biocompatibility [5]. Anodization is also a scalable process making the move from single pumps to an array of pumps relatively easy. For these reasons, AAO membranes were fabricated and suspended over through silicon (Si) windows in preparation for use in a selective neural ion pump.
Experimental Procedure:Using plasma enhanced chemical vapor deposition, 100 nm of silicon nitride (SixNy) and 1.5 µm of silicon oxide (SiO2) were deposited on opposite sides of a 0.5 mm thick double-side polished Si wafer. Then 100 to 1000 nm of aluminum (Al) was deposited onto the SixNy layer using electron beam evaporation. Using photo-lithography, a hard mask was etched into the SiO2 layer for Bosch etching. Four hours and thirty-seven m i n u t e s of Bosch Figure 2: A diagram of the anodization setup.
BIOLOGICAL APPLICATIONS
292012 NNIN REU RESEARCH ACCOMPLISHMENTS
etching separated the wafer into 15 by 15 mm squares with 120 by 120 µm windows through the Si in the center. Across the windows a thin layer of SixNy and Al was left suspended. The SixNy layer was then removed using ICP etching leaving the Al layer. This was then anodized using the setup shown in Figure 2. 3M insulating tape was used to protect the SiO2 side so that pore formation occurred only on the side exposed to solution.
Anodizations took place at 1°C in 0.3 M oxalic acid or 5% (w) sulfuric acid using a graphite counter electrode. A constant voltage set between 12.5 and 40 V with a maximum current of 100 mA was applied for 2 to 60 minutes producing AAO nanopores with a thin barrier layer of alumina at the bottom of each pore. The 3M tape was removed and SPR220-3.0 photoresist was applied to the opposite side protecting the AAO except where exposed by the Si window. This allowed the barrier layer to then be etched using 5% (w) o-phosphoric acid, keeping pores intact. The nanoporous membranes were then characterized by field emission scanning electron microscopy (FESEM) to determine pore diameter, uniformity, and depth.
Results:FESEM images of the resulting pores showed a linear relationship between average pore diameter and applied anodization voltage. Pores formed at a ratio of 0.59 nm/V and 0.68 nm/V for oxalic acid and sulfuric acid respectively, as shown in Figure 3. Irregularities in the Al surface during pore nucleation and an insufficient anodization length resulted in pores with lower regularity than those formed in other two-step processes as described by Wood and O’Sullivan [6]. The pores did, however, form completely through the Al as seen in the cross sectional image in Figure 4.
Backlit optical microscopy was used to evaluate the completed suspended membrane and the successful anodization of the Al. Unanodized Al or unremoved Si and SixNy would show up as shadows on the optical microscope image. The absence of these shadows confirmed the suspension of a thin AAO membrane.
Future Work:The next step in this project is to use these membranes in fabricating a selective ion pump similar to the pumps fabricated by Richter-Dahlfors, et al., and test the ion pump’s ability to deliver K+.
Acknowledgements:I would like to thank Dr. Theogarajan, Samuel Beach, Steven Wienecke, Samantha Cruz, the UCSB Nanofab staff, and the Theogarajan group for their help. And the National Nanotechnology Infrastructure Network Research Experience for Undergraduates (NNIN REU) Program and National Science Foundation for this research experience.
Figure 4: FESEM images of a cross section of AAO nanopores.
References:[1] Wolfrum, B.; Mourzina, Y.; Sommerhage, F.; Offenhäusser, A. Nano
and Visual Science 2004, 45, 4215.[4] Isaksson, J.; Kjäkk, P.; Nilsson, D.; Robinson, N.D.; Berggren, M.;
Richter-Dahlfors, A. Nature Mater. 2007, 6, 673.[5] Lee, W.; Ji, R.; Gösele, U.; Nielsch, K. Nature Mater. 2006, 5, 741.[6] O’Sullivan, J. P.; Wood, G. C. Proc. R. Soc. London 1970, A317, 511.
Figure 3: A plot of the average pore diameter against anodization voltage base on FESEM images.
BIOLOGICAL APPLICATIONS
30 2012 NNIN REU RESEARCH ACCOMPLISHMENTS
Silicone Nanoparticles for DNA Drug Delivery
Kendall PletcherBioengineering, Franklin W. Olin College of Engineering
NNIN iREU Site: National Institute for Materials Science (NIMS), Tsukuba, Ibaraki, JapanNNIN iREU Principal Investigator: Dr. Nobutaka Hanagata, Biosystem Control Group, National Institute of Materials ScienceNNIN iREU Mentor: Dr. Svetlana Chechetka, Biosystem Control Group, National Institute of Materials ScienceContact: [email protected], [email protected], [email protected]
Abstract:Because of its role in immune-system activation, high-mobility group box protein (HMGB) has been targeted for treatment of auto-immune diseases. It has been found that single-stranded deoxyribonucleic acid (DNA) fragments, oligodeoxynucleotides (ODN), can competitively bind to HMGB, blocking apoptotic DNA responsible for prompting improper immune responses leading to autoimmune diseases. This study examined the immune response of cells that were stimulated with five ODN of different backbones, sequences, and lengths, either free or in a NP-ODN complex to examine the effect of nanoparticles (NP) on the efficacy of the DNA drug. The NP-ODN complex was found to enhance the suppressive effect of the ODN on interferon alpha (IFN-α) production, but had no effect on the production of chemokine ligand 5 (CCL5). These findings suggest that ODN-HMGB binding mode can effect downstream signal transduction and, additionally, that there is promise in NP design for the purpose of affecting the function of DNA drugs.
Introduction:Pattern recognition receptors (PPRs) recognize conserved pathogen-associated molecular patterns and activate cells of the innate immune system, playing an integral role in protecting against microbial pathogens. However, the activation of PPRs can also result in harmful immune responses such as in the case of life-threatening inflammation and autoimmunity. One approach to curb such inappropriate immune responses has shown promise: HMGB targeted therapies may suppress innate immune responses due to the role of HMGB in triggering all nucleic acid receptor-mediated innate immune responses [1]. Consequently, it has been suggested that nucleic acids with high binding affinity for HMGB may function as suppressing agents for HMGB-mediated diseases. Thus, competitive binding of ODN to HMGB may have clinical applications for treatment of autoimmune diseases.
This study looks at the immune response-inhibiting effects of six different ODN, examining the effect of backbone, length, and sequence of the ODN on the inhibitory effect observed.
Additionally, silicon nanoparticles (Si-NPs) are introduced as delivery agents for the ODN and examined to determine therapeutic effects. The inhibitory effects of each ODN in complexes with NPs and alone are shown and the significance of the findings are discussed.
Methods:Six single-stranded ODN were used in this study:
1. CG PT (CG sequence, phosphorothioate backbone, 24 base length), 2. GC PT (GC sequence, phosphorothioate backbone, 24 base length), 3. x1GC PD (GC sequence, phosphodiester backbone, 24 base length), 4. x2GC PD (GC sequence, phosphodiester backbone, 48 base length), 5. x3GC PD (GC sequence, phosphodiester backbone, 72 base length),
and 6. x3CG PD (CG sequence, phosphodiester backbone, 72 base length).
These ODNs were electrostatically bound onto allylamine-modified Si-NPs with average diameter of 3.4 nm.
Mouse fibroblast cells were treated with free ODNs or NP-ODN conjugates for 1 h, and then B-DNA was added into
Figure 1: Binding Capacity. 2006x3 CG PD was found to have a much lower binding capacity (35%) than the other five ODNs, of which each sported nearly 100%.
BIOLOGICAL APPLICATIONS
312012 NNIN REU RESEARCH ACCOMPLISHMENTS
culture medium to stimulate HMGB. After 24 h, total RNA was extracted to examine the expression level of IFN-α and CCL5 genes by using quantitative real time PCR (qRT-PCR).
Results and Discussion:Binding capacity results showed that four of the ODN used featured nearly 100% binding capacity. However, 2006x3 CG PD that consisted of the 72 base phosphodiester backbone CG sequence featured a much lower binding capacity of 35% (Figure 1).
Results of IFN-α qRT-PCR showed that the cells stimulated with NP-ODN complexes produced less IFN-α relative mRNA expression than those stimulated with free ODN alone (Figure 2). The only exception to this trend was found to be 2006x3 CG PD. The solitary nature of this result implies
that the significantly lower binding capacity of the 2006x3 CG PD ODN to Si-NPs affected the results.
Results of CCL5 qRT-PCR showed no significant differences between cells stimulated with NP-ODN complexes compared to those stimulated with free ODN (Figure 3). No significant differences in relative IFN-α or CCL5 mRNA expression were observed due to changes in backbone, sequence, or length of ODN in stimulation.
The effect of the NP-ODN complexes on IFN-α and CCL5 production is significant in its implication of the importance of interaction mode. Due to the difference in responses triggered by free ODN and NP-ODN complexes, there is evidence that the interaction mode between HMGB and ODN can affect the resulting downstream signal transduction. Thus, altering NP conformation and NP-ODN binding mode can be used to alter the production of a single cytokine. Additionally, because the complexes in this study affected production of only one of the cytokines of interest, there is evidence that a single stimulation method can be designed such that it affects the production of several different cytokines in predictable but dissimilar ways.
Conclusions:Backbone, sequence, and length of the ODN used in stimulation were not found to affect the relative mRNA expression for either IFN-α or CCL5. However, the use of NP-ODN complexes in stimulation were found to increase the inhibitory effect of the ODN on IFN-α production while not clearly affecting the production of CCL5, signifying the importance on binding mode on downstream signal transduction in the HMBG-mediated mechanism of auto-immune disease.
Acknowledgements:I would like to acknowledge the work of Chinnathambi Shanmugavel and Svetlana Chechetka, who aided the author throughout, and Dr. Nobutaka Hanagata, for his invaluable guidance. This work would not have been possible without funding and support from the National Science Foundation, the NNIN iREU Program, and the National Institute of Materials Science.
References:[1] Yanai, Hideyuki et al. “Suppression of immune responses by
nonimmunogenic oligodeoxynucleotides with high affinity for high-mobility group box proteins (HMGBs)”; Proc Natl Acad Sci USA. 2011 July 12; 108(28):11542-7.
Figure 3: CCL5 Results. NP-ODN complexes were not found to significantly affect the results, as were differences due to backbone, sequence, and length of ODN.
Figure 2: IFN-α Results. NP-ODN complexes were found to express lower levels of IFN-α with the exception of 2006x3 CG PD. No significant differences due to backbone, sequence, or length of ODN were found.
BIOLOGICAL APPLICATIONS
32 2012 NNIN REU RESEARCH ACCOMPLISHMENTS
A Microfluidic Gradient Generating Device Integrated with Nanopatterned Matrices for Studying Guided Cell Migration
Radu ReitBiomedical Engineering, Georgia Institute of Technology
NNIN REU Site: NanoTech User Facility, University of Washington, Seattle, WANNIN REU Principal Investigator: Deok-Ho Kim, Bioengineering, University of WashingtonNNIN REU Mentor: Nirveek Bhattacharjee, Bioengineering, University of WashingtonContact: [email protected], [email protected], [email protected]
Abstract:Migrating cells are inherently sensitive to a plethora of diffusible and immobilized cues, which are integrated to coordinate their directional migration in various contexts of organizational development, physiology and disease in vivo. However, the combined effects of these complex guidance cues on directional cell migration remains poorly understood, partly due to complete neglect of these combinational factors in most in vitro experimentation. Here, we developed a novel microfluidic platform with a nanostructured sur-face interface, allowing integrative stimulus delivery of chemoattractant factors and topographical cues to migrating cells. We combined nano-grooved substrates with open well microfluidic chambers to study the effects of chemoattractant factors and matrix topography on directional cell migration. Co-current and countercurrent flows of stromal derived factor-1 alpha (SDF-1α) alongside bovine serum albumin (BSA)-labeled with fluorescent Rhodamine were used to study microfluidic gradient generation and the subsequent cell homing response. Using this platform, in a single experiment, we could simultaneously characterize cell migration and associated cell shape changes under well-defined variations in chemoattractant factors and matrix topography.
Introduction:Migrating cells are inherently sensitive to a plethora of diffusible and immobilized cues that are present in a combinatorial fashion, and are integrated by intracellular signal transduction machinery to coordinate their directional migration in various physiological and pathological contexts in vivo. A significant challenge faced by biomedical researchers is to study these factors combinatorially in vitro and understand their roles in determining cellular motility and directionality. Microfluidic chambers allow for a robust, high-throughput measurement technique for the study of chemotaxis and polarized cell movement [1]. Additionally, topographically amended substrates enhance sensitivity of migration, and allow integration of mechanical cues in experimental design [2]. However, the effect of combining
these various extracellular cues and their subsequent effects on directed cellular homing remains vastly unexplored. Here we developed a novel microfluidic platform with a nanostructured surface interface, allowing integrative stimulus delivery of chemoattractant factors and topographical cues to migrating cells.
Experimental Procedure:Nano-patterned polydimethylsiloxane (PDMS) was fabricated using soft lithography nanofabrication techniques to form patterns with 550 nm wide and 500 nm tall grooves, with a groove-to-ridge ratio of 1:1. Both flat and nano-grooved substrates were plasma-treated for 60 seconds at 650 mTorr and 60W, and then surface bound to a PDMS 4-well open-chamber microfluidic device. Co-current and countercurrent gradients were characterized using fluorescently labeled bovine serum albumin (BSA) flowed in at 1.6 µL/min.
Results and Conclusions:Microfluidic chambers and nanogrooved substrates were combined to create a device to test the effects of multiple extracellular factors synergistically in vitro. Figure 1 shows a well of the completed integrated device with the nanogrooved substrates along the bottom of the main cell-culture area shown in Figure 2. Microfluidic gradients were established, as shown in Figure 3, and later characterized for shape and linearity in Figure 4 at steady state.
In this study, we fabricated a high throughput microfluidic device using a nanopatterned PDMS substrate and an open-well microfluidic chamber. Protein flow gradients were characterized for linearity and used to optimize the flow rate for a biologically relevant chemotactic gradient. Overall, an easy-to-use, topographically mimetic microfluidic device was constructed for the combined study of chemotactic gradients and topography on directed cell migration.
BIOLOGICAL APPLICATIONS
332012 NNIN REU RESEARCH ACCOMPLISHMENTS
Future Work:Upcoming experiments utilizing the microfluidic will focus on the role of cooperative and competing soluble factor gradients on the effects of directed cellular homing atop nanopatterned substrates. Co-current gradients will be established for the study of the synergistic effects of multiple soluble factors on cellular migration in the presence of multiple chemotactic gradients and compared with the observed individual soluble factor effects. Similarly, countercurrent gradients will be established for the study of the competing effect of chemotactic gradients and used to better understand the cellular sensitivity to specific chemoattractants. Both these experiments will serve to better understand the cell migration response to soluble factor gradients on a much more physiologically relevant substrate and will allow for the understanding of basic cellular migration in a more complex and relevant environment of microfluidic gradients.
Acknowledgments:The author would like to thank the National Science Foundation, and National Nanotechnology Infrastructure Network Research Experience for Undergraduates (NNIN REU) Program, as well as the University of Washington Bioengineering Department and the University of Washington Nanotechnology User Facility (UW NTUF) for research support and funding.
References:[1] Keenan, T. M., Frevert, C. W., Wu, A., Wong, V., and Folch, A. (2010).
A new method for studying gradient-induced neutrophil desensitization based on an open microfluidic chamber. Lab on a chip, 10(1), 116-22.
[2] Park, J., Kim, H.-N., Kim, D.-H., Levchenko, A., and Suh, K.-Y. (2012). Quantitative analysis of the combined effect of substrate rigidity and topographic guidance on cell morphology. IEEE transactions on nanobioscience, 11(1), 28-36.
Figure 1: Phase 4x objective image of PDMS microfluidic chamber.
Figure 2: SEM image of 550 nm PDMS patterns within the exposed cell culture well.
Figure 3: Fluorescently labeled protein flown through the right hand channel.
Figure 4: Intensity profile of fluorescently labeled protein along the width of the microfluidic chamber.
BIOLOGICAL APPLICATIONS
34 2012 NNIN REU RESEARCH ACCOMPLISHMENTS
Uptake of Nanoparticles in the Olfactory System and Transport to the Brain in Locust
Jonathan SchoeningBiochemistry, Clarke University
NNIN REU Site: Nano Research Facility, Washington University in St. Louis, St. Louis, MONNIN REU Principal Investigator: Dr. Pratim Biswas,
Energy, Environmental and Chemical Engineering, Washington University in St. LouisNNIN REU Mentor: Tandeep Chadha, Energy, Environmental and Chemical Engineering, Washington University in St. LouisContact: [email protected], [email protected], [email protected]
Abstract and Introduction:The olfactory nerve, which projects directly from the nasal epithelium to the brain, is the shortest and most direct route to the brain. It has been suggested that nanoparticles deposited in the nasal epithelium are capable of being uptaken into the neurons and transported to the central nervous system [1]. This olfactory route is of particular concern as it completely bypasses the blood-brain barrier, responsible for protecting the brain from foreign materials. The growing use of nanoparticles in consumer and industrial products also underscores the importance of understanding how nanoparticles may gain access to the central nervous system.
We expect nanoparticle transport to the brain to begin with the uptake of nanoparticles by either receptor mediated or non-receptor mediated endocytosis. While the former requires interaction with surface proteins, the latter occurs randomly as the cell samples material from its extracellular environment. Once inside the cell, nanoparticles bind to “motor” proteins, which move along a microtubule system spanning the entire neuron [2]. While this is normally responsible for transporting important cellular proteins and organelles, it could also be used by nanoparticles to quickly travel to the brain.
It is unknown what impact nanoparticles may have on neuron activity once they reach the brain. To characterize this, we used
Figure 1: Experimental setup.
electrophysiology tests to measure what effect a nanoparticle injection in a sample’s brain had on its ability to perceive odors. We also used transmission electron microscopy (TEM) to determine the cellular localization of nanoparticles.
Experimental Procedure:Due to its relatively simple nervous system and established role in olfaction studies [3], locust (Schistocerca americana) was chosen as the experimental organism. It was prepared for a nanoparticle injection by exposing the brain and carefully removing excess tissue. A controlled air/hexanol mixture was passed over one of the locust’s antennae and its nervous response was measured by a gold-plated recording electrode placed in its antenna lobe as shown in Figure 1.
A gold nanoparticle (5 nm) suspension previously produced by the reduction of HAuCl4 with NaBH4 (Figure 2) was injected into the antenna lobe by a glass injection pipette. This was controlled by a pneumatic picopump to ensure consistent delivery of the odorant and injection of the nanoparticle suspension. A total of five trials were run before the nanoparticle injection, two were taken during the injection and five more were taken after the injection.
Figure 2: TEM of gold nanoparticles.
BIOLOGICAL APPLICATIONS
352012 NNIN REU RESEARCH ACCOMPLISHMENTS
At the conclusion of the electrophysiology experiment, the brain was recovered and immediately fixed using glutaraldehyde to preserve the sample. A secondary fixative of osmium tetroxide was used to prevent lipid degradation as well as to add contrast to TEM images. After drying with ethanol and propylene oxide, the sample was embedded using Eponate 12. Thin (75 nm) sections were then cut using a diamond knife to prepare the sample for TEM.
Results and Conclusions:Simplified results for the electrophysiology experiment are presented in Figure 3. Two pre-exposure trials, two injection trials (highlighted) and two post-exposure trials are shown after the odorant was discontinued. Each is a function of voltage versus time, with spikes corresponding to neurons firing. Interestingly, some gold nanoparticles themselves appeared to cause a nervous response as spikes can be seen after their injection. There was also a clear drop in neuron activity after these injections, as the frequency of neuron firing was diminished. Pending a control experiment with a saline injection, this supports our claim that nanoparticles can affect neuron activity.
Figure 4 shows highly contrasted, spherical particles of diameter ~ 5 nm, which is consistent with the characteristics of our gold nanoparticles. TEM appears to have verified the presence of gold nanoparticles inside brain cells and suggests that they are capable of crossing the synapse, shown running from the bottom left to the middle top of the image. Since this is where electrical signals are converted to chemical signals, this may be where interference is produced.
Future Work:Our results suggest that nanoparticles are able to interfere with normal neuron firing when injected into the brain. However,
this is an unlikely exposure route. To better model realistic exposure methods, this experiment should be repeated with nanoparticles delivered via an aerosol route. This could be accomplished by using an electrospray system to deliver nanoparticles to the locust’s antennae.
Since surface charge is primarily responsible for nanoparticle interaction with proteins, repeating these trials with varying charged nanoparticles would allow for better characterization of relevant factors for nanoparticle interference with neuron activity. Other relevant properties worth studying include size and crystal phase.
Acknowledgments:I would like to thank Dr. Pratim Biswas, Tandeep Chadha, Dr. Debajit Saha, Howard Wynder, and members of the Nano Research Facility for their guidance and support during this project. Additionally, I would like to thank the National Nanotechnology Infrastructure Network Research Experience for Undergraduates Program and the National Science Foundation for providing funding.
References:[1] Oberdörster, G., Oberdörster, E. and Oberdörster, J.; “Nanotoxicology:
An Emerging Discipline Evolving from Studies of Ultrafine Particles”; Environmental Health Perspectives, Vol. 113 (7); pp. 823-839 (2005).
[2] Brown, A.; “Axonal Transport of Membranous and Nonmembranous Cargoes: A Unified Perspective”; The Journal of Cell Biology, Vol. 160 (6); pp. 817-821 (2003).
[3] Hildebrand, J. and Shepherd, G.; “Mechanisms of Olfactory Discrimination: Converging Evidence for Common Principles Across Phyla”; The Annual Review of Neuroscience; Vol. 20; pp. 595-631 (1997).
Figure 3, above: Electrophysiology results.
Figure 4, right: TEM of locust brain.
BIOLOGICAL APPLICATIONS
36 2012 NNIN REU RESEARCH ACCOMPLISHMENTS
Progress Towards Electrical Interface Chips for BioMEMS
Stephanie SwartzPhysics, University of Rochester
NNIN REU Site: Colorado Nanofabrication Laboratory, University of Colorado, Boulder, CONNIN REU Principal Investigator: Professor Robert McLeod, Electrical Computer
and Energy Engineering, University of Colorado at BoulderNNIN REU Mentors: Martha Bodine and Callie Fiedler, Electrical Computer and Energy Eng., University of Colorado at Boulder
Abstract and Introduction:The conjunction of biology and nanolithography has allowed for the development of many unusual devices—unique hybrids of biological cells and man-made structures. Here, we describe the development of one such device, designed to characterize the contraction force of a skeletal muscle cell. Shimizu, et al. [1] measured the force of a single C2C12 myotube by anchoring it to a silicon cantilever and base, electrically stimulating the cell, observing the cantilever movement using an optical microscope, and calculating the resulting force of contraction. Building upon their work, we fabricated micron-scale cantilevers made of the non-cytotoxic photoresist SU-8 3050. In addition to developing the fabrication process for the SU-8 cantilevers, we characterized them using optical microscopy and profilometry. Currently, we are investigating optical frequency domain reflectometry (OFDR) as a method for more accurately measuring the movement of the cantilevers. Accurate characterization of cantilever movement as the cell contracts will allow for a more precise measurement of the force exerted by an individual skeletal muscle cell.
Fabrication:We used photolithography to fabricate SU-8 cantilevers onto glass slides. Following several cleaning steps, we spun on OmniCoat™ first for five seconds at a speed of 500 rpm and an acceleration of 100 rpm/s, and then 30 seconds at 3000 rpm and 255 rpm/s. We baked the OmniCoat™ for one minute at 200°C. Next, we spun on SU-8 3050 using the same spin parameters at the OmniCoat. Subsequently, we soft-baked the SU-8 on a hotplate at 95°C for 25 minutes. Using the MJB-4 mask aligner, we exposed the SU-8 through a chrome-coated glass mask for 31-34 seconds. We did a post-exposure bake (PEB) on the hotplate at 95°C for 3-5 minutes. Then, we developed the SU-8 while agitating the developer by hand for ~ 6 minutes. We cured the SU-8 on a hotplate at 200°C for five minutes and consequently developed the OmniCoat for ~ 30 seconds. We descumed for 600 seconds before etching the slides in agitated buffered oxide etchant (BOE). This step released the cantilevers. After each step requiring rinsing, we rinsed the glass slides in a water bath and dried them on a hotplate at 100°C.
Characterization:Profilometry. Although the data is not shown here, we determined the height of the cantilevers to be 40-50 µm prior to etching using profilometry. Additionally, we measured the etch rate of the BOE to be ~ 0.46 µm/min.
Optical Microscopy. We used optical microscopy to examine the quality of the cantilevers. After development, the cantilevers, shown in the bright field image in Figure 1, Panel A, were straight and totally developed. The dark field image in Panel B reveals that the cantilevers were adhered to the glass slide and the sidewalls were vertical. Conversely, the dark field image in Panel C reveals that the cantilever was no longer adhered to the slide after development. After etching, there was an unknown residue on the cantilever as shown in Panel D, which we were able to remove using a combination of solvents.
Optical Frequency Domain Reflectometry (OFDR). OFDR works on the following principle: a tunable laser couples light into SMF-28 optical fibers set up as a Mach-Zehnder interferometer, where at one end the fiber points at structures on the sample. Due to the Fresnel reflections off these structures, a frequency is detected and then Fourier transformed so that it corresponds to the round trip times of the light from the fiber tip to structures on the sample.
In order to detect a 15 µm wide cantilever, we etched channels into the glass using a commercial glass-etching cream so that the center of the fiber tip points at the cantilever, as shown in Figure 2. Figure 3 shows what we believe to be peaks from the fiber tip and the cantilever. The black curve is the raw data. Using Igor Pro for data analysis, we mirrored the data to the left of the fiber peak and plotted it to the right of the fiber peak. We then subtracted the light-grey “mirrored data” from the black raw data to obtain the dark-grey curve for the cantilever peak only. Data analysis revealed that the cantilever was located ~ 0.885 mm away from the fiber, which is plausible given that the fiber was attached to the glass slide by hand using a stereoscope.
BIOLOGICAL APPLICATIONS
372012 NNIN REU RESEARCH ACCOMPLISHMENTS
Conclusions:As a result of optical microscopy, we were able to determine which cantilever dimensions allowed for better adhesion to the glass before etching, and the proper exposure and development times. In general, wider cantilevers (~ 15 µm) with lengths of 500 to 900 µm adhered better to the glass. OFDR has been successful so far at detecting a stationary cantilever, although a more precise setup will be required in order to test a moving cantilever. Particular attention should be paid to the noise, which affects OFDR measurements.
Acknowledgements:The author would like to thank her mentors, Martha Bodine and Callie Fiedler, and her Principal Investigator, Robert McLeod. Additionally, the author would like to thank Christopher Roath, Ben Kowalski, Eric Moore, Bart van Zeghbroeck, Jan van Zeghbroeck, Tomoko Borsa, Zefram Marks, Tzu-Min Ou, Ian Haygood, Bounkeanha Chhun, Carol Higgins, Julie Robinson, Melanie-Claire Mallison, the National Science Foundation and the NNIN REU Program for making this research possible.
References:[1] K. Shimizu et al., Biomedical Microdevices, Volume 12,
Number 2 (2010), 247-252.
Figure 3: OFDR determined that the stationary 15 µm wide cantilever is located ~ 0.885 mm away from the fiber tip.
Figure 1: A) Bright field image of a good cantilever after development. B) Dark field image of a good cantilever after development. C) Dark field image of a bad cantilever after development. D) Bright field image of a good cantilever after etching with BOE.
Figure 2: An optical fiber to be used with the OFDR system is glued to the glass slide so that it points at the cantilever.
BIOLOGICAL APPLICATIONS
38 2012 NNIN REU RESEARCH ACCOMPLISHMENTS
Nanocharacterization of Polymer-Modified Microring Resonators for Performance in Complex Media
Brianna ThielenEngineering, Harvey Mudd College
NNIN REU Site: NanoTech User Facility, University of Washington, Seattle, WANNIN REU Principal Investigator: Prof. Daniel Ratner, Department of Bioengineering, University of WashingtonNNIN REU Mentor: James T. Kirk, Department of Bioengineering, University of WashingtonContact: [email protected], [email protected], [email protected]
Introduction:Silicon photonic microring resonators are label-free biosensors that are able to detect very small changes in bound mass on the surface of a nanophotonic waveguide in real-time, while requiring only a few microliters of sample. However, to realize the full potential of this biosensing technology, it’s necessary to address the challenge of surface fouling and biocompatibility when performing diagnostic assays in complex biological matrices (e.g. blood, plasma, serum). Due to high interfacial energy at the surface, proteins irreversibly adsorb to the microrings upon contact. This non-specific fouling of the sensor surface leads to false positives and reduces the device’s ability to detect specific binding interactions.
One strategy used to reduce non-specific adsorption is to grow a thin zwitterionic polymer layer from the silicon substrate of the sensor, producing a hydrophilic, non-fouling coating. In this study, carboxybetaine acrylamide (CBAA) was polymerized from microring resonators using atom transfer radical polymerization (ATRP). Sensors were then exposed to undiluted human blood plasma to determine the extent of
fouling. The polymer film was characterized using atomic force microscopy (AFM) and scanning electron microscopy (SEM).
AFM, SEM, and plasma fouling data were used to refine the ATRP process in order to establish a polymerization procedure that enables a microring resonator biosensor to be used in real-world diagnostic applications.
Methods:Polymerization. First, trichlorosilane initiators were covalently bound to a surface by soaking in a toluene solution or by vapor deposition. Next, a CBAA polymer layer was grown via ATRP using a monomer/catalyst solution. After the reaction completed, the polymerized surface was tested for non-fouling properties. The initiator deposition procedure (liquid and vapor) and the reaction time (17- and 24-hour) were varied in order to determine optimal ATRP conditions.
Non-Fouling Test on Silicon Microring Resonators. Each silicon microring resonator biosensor chip contained 272 microring resonators (see Figure 1). An increase in resonance wavelength of a microring indicated an increase in mass density of the regions surrounding the ring.
Polymer-coated chips were tested for non-fouling properties by flowing undiluted human blood plasma over the chips for 15 minutes at a rate of 20 µL/minute. Prior to and after being exposed to plasma, the chips were washed with phosphate buffered saline (PBS) at the same flow rate for 20 minutes.
Results and Conclusions:The first attribute of ATRP optimized in this study was the method of initiator deposition (liquid or vapor). For chips using liquid initiator deposition, high variance in signal attenuation indicated that the polymer growth was non-uniform (see Figures 2 and 3). The “liquid deposited” chip showed a fouling level of 92 ± 123 ng/cm2. Although this chip achieved a lower fouling level than many others, the high standard deviation indicated non-uniform polymer growth.
Figure 1: An SEM image of a microring resonator. Light is directed down a waveguide that runs adjacent to each microring (bottom). Resonance wavelengths are coupled into the microring, causing a decrease in output power.
BIOLOGICAL APPLICATIONS
392012 NNIN REU RESEARCH ACCOMPLISHMENTS
The “vapor deposited” chip showed a fouling level of 265 ± 13ng/cm2. Although this is much higher than the ultra-low fouling goal of 5 ng/cm2 [2], the small standard deviation showed that vapor deposition created a much more uniform polymer layer and a more robust biosensor.
The ATRP reaction time was also optimized in this study. Average fouling levels were compared for 17- and 24-hour vapor deposited chips. The 17- and 24-hour chips showed fouling levels of approximately 265 ng/cm2 and 147 ng/cm2
respectively (see Figure 4). Lower fouling levels on the 24-hour chips indicated that longer reaction time produced a denser polymer film, yielding a lower fouling surface.
Although the “ultra-low fouling” levels described previously [2] have not yet been reached, the results of this study support using a 24-hour ATRP reaction using vapor deposition of initiators. The 24-hour fouling levels were consistently lower than 17-hour levels. Liquid deposition of initiators showed greatly varied levels of polymerization, indicating varied thicknesses on sensor arrays. SEM and AFM images confirmed that polymer coatings had varied thicknesses among microring arrays and that each ring layer was non-uniform.
These data suggest that initiators should be bound using vapor deposition and that a 24-hour ATRP reaction should be used in future experiments.
Future Work:Literature suggests that higher methanol percentage creates a denser film and a lower-fouling surface [1]. More manipulation of the solvent ratio could be experimented with to further decrease protein fouling levels. In addition, functionalization procedures (binding a capture element to the surface) will be tested for the non-fouling surface to enable specific analyte detection.
Acknowledgments:This work was sponsored by the National Science Foundation and the NNIN REU Program. The Nanotechnology User Facility at the University of Washington (UW) and its staff provided training for and access to the AFM and SEM. The Jiang lab in the Chemical Engineering Department at the UW provided training and materials necessary for the ATRP process. Finally, the Ratner lab in the Bioengineering Department at the UW provided equipment, materials, training, and all other resources necessary for this study.
References:[1] C. Huang, 2012. Macromolecular Journals 33.11, 1003-1007.[2] H. Vaisocherová, 2009. Biosensors and Bioelect. 24.7, 1924-1930.[3] M. Iqbal, 2010. IEEE J. Selected Top. in Quantum Elect. 16.3, 654-661.[4] W. Norde, 2008. Colloids and Surfaces B 61.1, 1-9.Figure 4: Microring resonator sensorgrams for 17-hour (black) and
24-hour (gray) ATRP reacted chips. These data showed fouling levels of 265 and 147 ng/cm2 respectively.
Figure 2: Microring resonator sensorgrams for vapor deposited (black) and liquid deposited (gray) chips. The liquid deposited chip is less uniform (as is apparent by examining the spread in each chip). The standard deviations are 13 ng/cm2 and 123 ng/cm2 respectively.
Figure 3: An SEM image of a microring resonator polymerized using liquid initiator deposition. Non-uniform polymer growth was confirmed using this (and other) SEM images.
BIOLOGICAL APPLICATIONS
40 2012 NNIN REU RESEARCH ACCOMPLISHMENTS
High Fidelity Method for Microfabricating in vitro Neural Networks
Geoffrey VrlaChemistry, Middlebury College
NNIN REU Site: Nanofabrication Center, University of Minnesota-Twin Cities, Minneapolis, MNNNIN REU Principal Investigator: Dr. Patrick Alford, Biomedical Engineering, University of Minnesota-Twin CitiesNNIN REU Mentor: Eric Hald, Biomedical Engineering, University of Minnesota-Twin CitiesContact: [email protected], [email protected], [email protected]
Abstract:Functional in vitro models of neural networks are essential for uncovering the underlying cellular mechanisms by which mechanical stress induces traumatic brain injury. However, current models do not capture the connectivity and organization of the brain’s axonal tracts, limiting our ability to study how cellular dysfunction may be transmitted between distant regions of the brain. These models are inadequate due to insufficient fabrication techniques for consistently and accurately placing neurons in a network. Here, we propose a novel method for neural network fabrication that incorporates microfluidic cell placement onto micropatterned substrates. We fabricated a microfluidic device featuring cell traps that capture cells in an organized array, placing them in contact with a fibronectin-coated surface that provides guidance cues for network self-organization. As proof of concept, we used 3T3 fibroblasts to assess the efficiency of this technique. Compared to standard microcontact printing, microfluidic delivery of cells resulted in more consistent, uniform adherence of cells to patterned substrates. Development of this technique may allow fabrication of more authentic neural networks and provide a platform by which we may further investigate the role of diffuse axonal injury in the pathophysiological response to traumatic brain injury.
Introduction:Blast-induced traumatic brain injury (bTBI) is the most frequent injury suffered by American soldiers in Iraq and Afghanistan; however, the mechanism by which blast waves transduce brain injury remains poorly understood [1]. Although in vivo studies are the current focus of research, in vitro TBI models display the capability of providing unique insight into the cellular mechanisms that underlie bTBI [2].
These studies often involve synthetic biological tissues fabricated via microcontact printing, a technique used to pattern a substrate with extracellular-matrix guidance cues that promote cell and tissue self-organization. However, standard micropatterning techniques cannot consistently fabricate high fidelity neural networks due to lack of control over cell placement on extracellular-matrix features.
Here, we present a method for precise alignment of cells on a micropatterned substrate using a microfluidic device. Our
device isolates and immobilizes cells in a uniform array, allowing for the adhesion of single cells to a micropatterned substrate with precise control over their relative positions. We utilized this technique to seed 3T3 fibroblasts on a network pattern of fibronectin, resulting in consistent cell connections resembling that of neural circuits.
Experimental Procedure:A polydimethylsiloxane (PDMS) microfluidic device (Figure 1) was designed in reference to a device used in [3]. Masters were fabricated from SU-8 3025 photoresist spun on silicon wafers using standard photolithography techniques. Masters were coated with Sylgard 184 PDMS (10:1 base:curing agent), degassed, and baked at 90°C for four hours.
A neural network pattern shown to most effectively promote polarized neural connections was adapted from [4]. PDMS stamps for this pattern were fabricated similarly to the micro-fluidic device. Stamps were coated with fibronectin (50 mg/mL in H2O) and incubated for one hour. Fibronectin was transferred to PDMS-coated glass coverslips following the procedure in [5].
A microfluidic device was aligned and temporarily sealed to a micropatterned coverslip using visual cues added to stamping patterns. Channels were rinsed with phosphate-buffered saline (PBS). A 3T3 fibroblast suspension (100 µL; 120,000 cells/mL) was drawn through the device using a house vacuum.
Figure 1: Microfluidic device featuring cell traps to immobilize cells.
BIOLOGICAL APPLICATIONS
412012 NNIN REU RESEARCH ACCOMPLISHMENTS
Immobilized cells were rinsed with culture media and incubated for two hours at 37°C and 5% CO2 to allow network formation (Figure 2), followed by device removal.
Cells were fixed and permeabilized with 4% paraformaldehyde and 0.05% Triton-100 respectively (in PBS at 37°C). Cells were stained with AlexaFluor 488 Phalloidin and 4’,6-diamidino-2-phenylindole (DAPI) in PBS, and imaged using an Olympus IX81ZDC inverted confocal microscope.
Results and Discussion:To assess the accuracy of cell transfer, fibroblasts were seeded on uniform fibronectin using microfluidic delivery. Adhered cells retained their orientation while immobilized in the capture cups, resulting in a highly organized array of cells compared to that obtained using standard techniques. The radial distribution function of fluorescently labeled nuclei displays areas of high cell density corresponding to known distances between capture cups (Figure 3), confirming the ability of this technique to influence the relative position of cells adhered to a substrate.
To investigate a potential application of this technique, fibroblasts were seeded on a fibronectin pattern resembling a neural network. Cells were accurately delivered to circular features, and extended radially to form physical contacts with neighboring cells (Figure 4). The linear nature of fibroblast nuclei affirms the success of this technique. When we extend this technique to primary neuronal cell lines, accurate soma placement may promote polarized neural connections and therefore a functional network.
Improved alignment of cells on a substrate as shown here can benefit tissue fabrication beyond neural systems. Countless distributions of cells, and therefore tissue models, can be obtained from adjusting the array of cell traps. For example, endothelial and smooth muscle cells captured in an array of concentric circles could be transferred to ring of extracellular-matrix to form structures resembling arterial cross sections. Models such as these could be employed in studies of vasospasm and other diseases characterized by blood-vessel hypercontractility such as bTBI.
Acknowledgments:I would like to thank the National Science Foundation and National Nanotechnology Infrastructure Network Research Experience for Undergraduates (NNIN REU) Program for funding this research, as well as Eric Hald, Patrick Alford, and the University of Minnesota.
Figure 4: Fibroblasts seeded on a network pattern of fibronectin.
Figure 2: Cells seeded on a network pattern after two hours of incubation.
Figure 3: A radial distribution function of fluorescently labeled nuclei.