33
May 15, 2018 Investor Update

May 15, 2018
Investor Update

Why we do what we do…
2
We believe:
• world demand for clean and reliable source of energy is rapidly growing
• technological advancements makes our energy cost competitive on a world scale
• in developing our world-class resource using the highest standards, environmentally and socially
• The world trusts doing business with Canada
PONY is developing a world-class resource of clean natural gas in Canada
Source: BP Global Energy Outlook, 2017*Renewables includes wind, solar, geothermal, biomass, and biofuels
Billion Toe (tonnes of oil equivalent)

Increases in Canadian natural gas demand is expected to be significant
Estimated 50% potential growth in demand for Canadian natural gas in the next 5 years.
Canadian Natural Gas MarketFuture Growth
Source: RBC Capital Markets; January 2018 3
50%
0.0
1.0
2.0
3.0
4.0
5.0
6.0
2017 2018 2019 2020 2021 2022 2023 2024 2025 2026
Gas
Dem
and
Gro
wth
(B
cf/d
)
PotentialCanadian LNG
Projects
Coal to Gas Switching
Oil Sands Demand Growth
NGTL
Alliance
T-South
~2 Bcf/d of high confidence demand growth in the next 5 years; potential for 8+ Bcf/d of growth if LNG potential is realized

Proposed West Coast LNG ProjectsGame Changer
Proposed LNG Projects Capacity
Exxon – ImperialWCC LNG ~4.0 Bcf/d
Shell & Partners - LNG Canada(FID expected in 2018) ~3.8 Bcf/d
Pembina Pipeline Corp.Jordan Cove LNG ~1.4 Bcf/d
Chevron / ApacheKM LNG ~1.3 Bcf/d
Pacific Oil & Gas / Woodfibre LNG(FID expected in 2018) ~0.3 Bcf/d
TOTAL ~10.8 Bcf/d
4
AltaGas Ridley
Island Propane
Export Terminal
T-North Enbridge
Mainline
Proposed Canada
LNG (Shell)
Export Facility
T-South Enbridge
Mainline
36” and 38”
Proposed
Woodfibre LNG
Export Facility
AltaGas Propane
Export Terminal
Ferndale, WA

5
Corporate ProfileTSX: PONY
OurGrowth
38% forecasted annual average daily production volume growth (2018 vs. 2017)
46% forecasted annual average daily liquids production growth (2018 vs. 2017)
24% forecasted cash flow per share growth (2018 vs. 2017)
Trading Metrics
1.1 mm shares trade per day
$430 mm market capitalization
161 mm shares outstanding
Balance Sheet
$142 mm term debt maturing 2022; $45 mm convertible debentures maturing 2021
$351 mm total debt as at March 31, 2018
Production364 MMcfe/d (60,703 boe/d) Q1 2018, up 69% over Q1 2017
5,614 bbls/day Q1 2018 liquids production, up 78% over Q1 2017
348 MMcfe/d (58,000 boe/d) to 360 MMcfe/d (60,000 boe/d) 2018 Production Guidance
$164 mm senior debt as at March 31, 2018

World Class ResourceMontney Pure Play
(1) As at December 31, 2017; see Advisories Section(2) RLI (Reserve Life Index) is calculated using 2017 reserves divided by annualized Q1 2018 production volumes of 364 MMcfe/d (60,703 boe/d)
Asset• The Montney is the most economic natural gas liquids play
in Canada
• 314 net sections (201,009 net acres) of Montney lands
• 6.9 Tcfe (1,148 MMboe) Proved Plus Probable Reserves(1)
with a Proved Plus Probable RLI(2) of 52 years
• 797 Bcfe of Proved Developed Producing reserves
Strategic Advantages• Firm transportation and processing facilities in-place to
meet production growth targets
Sustainable Capital Investment• Cash flow 2018 capital budget provides production volume
and cash flow per share growth without additional leverage
6

Montney Pure PlayLocation, Location, Location
LEGEND
Painted Pony Lands
Painted Pony / AltaGas Facilities
Third-Party Facilities
Enbridge T-North Pipeline
Secondary Pipelines
PONY’s Montney Sweet Spot is:
• 4x thicker than the Marcellus at greater than 300 meters (approximately 1,000 ft.) thick
• a continuous sweet natural gas-saturated zone with no associated or underlying water
• in an area with up to 1.8x over-pressured reservoir
• liquids cut average of approximately 9% during first quarter 2018
• high liquids production at Townsend with potential at Beg and Jedney (drilled and tested first well at Beg in Q1 2018)
• liquids production over a total of approximately 100,000 acres or 50% of land base
Townsend
Kobes
Blair
Daiber
Beg
West Blair
Cypress
LEGEND
Painted Pony Lands
Painted Pony / AltaGas Facilities
Third-Party Facilities
Enbridge T-North Pipeline
Secondary Pipelines
Dry Liquids
38 sections
36 sections
39 sections
Blair 45 sections
7
Drilled first well at liquids-rich Beg during Q1 2018

-
250,000
500,000
750,000
1,000,000
1,250,000
1,500,000
1,750,000
2,000,000
2,250,000
Painted PonyOther Producers
Source: GeoScout; As at Jan 31, 2018
Based on cumulative
volumes, PONY
has 19 of the top
20 wells in the Northern Montney
47 of top 100 wells are PONY
wells!
Top 100 Wells - Northern Montney Field (sample set of 1,220 wells)
North Montney 6-Month Cumulative Production Volumes
Cu
mu
lati
ve N
atu
ral G
as (
Mcf
)
The Sweet SpotTop Decile Well Performance PONY has best well in North
Montney with 6-month average daily production rate
of more than 11 MMcf/d
8

Beg Test WellSignificant Untapped Value in Liquids-Rich Block
• 6.6 day production test
• Final 8 hours of test
• 2,000 boe/d consisting of:
• 10 MMcf/d natural gas
• 360 bbls/d liquids including wellhead and facility recovered liquids; 60% condensate
• Well was still cleaning up
• Flowing pressure at end of test was 1,625 psi through a 5/8 inch choke
• Will require a 12 kilometer (7.5 mile) pipeline to existing infrastructure
3 km
Beg
Blair
Jedney
Black Swan - Beg 20-H2 Upper Montney wells5.5 MMcf/d7 bbls/MMcf Free Condensate
PONY Beg 65-BUpper Montney well10 MMcf/d360 bbls/d liquids / 36 bbls/MMcf(60% Condensate)
9
Black Swan - Beg 80-G3 Upper Montney wells6 - 8.5 MMcf/d5 - 17.5 bbls/MMcf Free Condensate
Progress - Beg 27-B3 Upper Montney wells9.5 - 11 MMcf/d10 - 16.5 bbls/mmcf Free Condensate
Progress - Beg 84-J3 Upper Montney wells9 - 11 MMcf/d11 - 32 bbls/MMcf Free Condensate
Black Swan - Beg 97-IUpper Montney well8 MMcf/d20 bbls/MMcf Free Condensate

0
10
20
30
40
50
60
70
80Ja
n-1
5
Feb
-15
Mar
-15
Ap
r-1
5
May
-15
Jun
-15
Jul-
15
Au
g-1
5
Sep
-15
Oct
-15
No
v-1
5
Dec
-15
Jan
-16
Feb
-16
Mar
-16
Ap
r-1
6
May
-16
Jun
-16
Jul-
16
Au
g-1
6
Sep
-16
Oct
-16
No
v-1
6
Dec
-16
Jan
-17
Feb
-17
Mar
-17
Ap
r-1
7
May
-17
Jun
-17
Jul-
17
Au
g-1
7
Sep
-17
Oct
-17
No
v-1
7
Dec
-17
Jan
-18
Feb
-18
Mar
-18
Ap
r-1
8
May
-18
Jun
-18
Jul-
18
Au
g-1
8
Sep
-18
Oct
-18
No
v-1
8
Dec
-18
Pro
du
ctio
n V
olu
mes
(m
boe/
d)
Production ProfileImpressive Growth
2017
2016
2015 (base)
2018
94 MMcfe/d(15,604 boe/d)
139 MMcfe/d(23,204 boe/d)
Annual Average Daily Production
257 MMcfe/d(42,882 boe/d)
Annual Average Daily Production
348-360 MMcfe/d(58,000-60,000 boe/d)
Annual Average Daily Production ForecastYE 2017 AltaGas Townsend Facility
Commitment of 270 MMcf/d(45,000 boe/d)
PONY is expecting 38% annual average daily production growth from 2017 to 2018
Annual Average Daily Production
10

$0
$2,000,000
$4,000,000
$6,000,000
$8,000,000
$10,000,000
$12,000,000
$14,000,000
Dri
ll an
d C
om
plet
ion
Co
st (
$)
Perf & Plug Systems21 wells
D&C cost $7.7 million
2011 2012 2013 2014 2015 2016 2017
1st Generation Open Hole Ball Drop System
33 wellsD&C cost $6.9 million
Current Generation Open Hole Ball Drop System
94 wellsD&C cost $4.0 million
$4.0 mm
As capital well costs fell, production type curves dramatically improved
Management Type Curve
increased 50%
PONY Well Cost (Drill + Complete Cost)
Historical CostsDrilling & Completions Efficiency
Continued type curve improvement with average well booking of 9 Bcfe/well
11

-
1,000
2,000
3,000
4,000
5,000
6,000
7,000
8,000
Single Well Economics IRR NPV10
Daiber (dry)
54% $4.7 mm
Blair (lean; 15 bbls/MMcf)
64% $6.2 mm
Townsend (liquids-rich; 36 bbls/MMcf)
39% $2.9 mm
Capital Costs
Drilling $1.9 million
Completions $2.1 million
Equip / Tie-in $0.55 million
TOTAL $4.55 million
9 months 18 months0 months
Townsend (liquids-rich)
Daiber (dry)
Blair (lean)
Management Type Curves
Single Well Economics by Area2018 Management Type Curves
Cal
end
ar D
ay G
as E
qu
ival
ent
(Mcf
e/d
)
Based on: $65/bbl WTI; $2.00/Mcf AECO; USD/CAD $0.79
3 months 6 months 12 months 15 months
12

0%
20%
40%
60%
80%
100%
120%
$1.75 $2.00 $2.25 $2.50
Rat
e o
f R
etu
rn (
% B
T)
AECO
Townsend (liquids-rich) Blair (lean) Daiber (dry)
Pricing Flat at: $65/bbl WTI; USD/CAD $0.79
Single Well Development Economics Price Sensitivity (Half Cycle)
High-rate Daiber wells provide natural
gas pricing torque
Liquids-enhanced, Blair wells provide exposure to stronger Condensate, NGL
and natural gas pricing
13

0
2
4
6
8
10
12
TOU CNQ PONY ECA BIR VII ARX PEY CVE AAV POU BNP CR NVA BXE KEL SRX PMT PNE PRQ LXE
Total Proved Probable
6.5
9.5
6.2
5.0 4.9
3.8 3.8
3.3
2.3 2.21.9
1.71.4
1.00.8 0.6
0.4 0.3 0.2 0.2
Nat
ura
l Gas
Res
erve
s (T
cf)
Canadian Natural Gas ReservesAs at Dec 31, 2017
10.7
PONY’s Proved plus Probable natural gas reserves of 6.5 Tcf (excludes liquids) positions PONY with the third-largest natural gas reserves of any publicly traded company in Canada
Assuming Enterprise Value@ $4.85/sh
($2.67/sh equity + $2.17/sh debt) on 6.9 Tcfe of 2P Reserves
$4.85/sh
42.9 Mcfe/shor
7.14 boe/sh
=$0.11/Mcfe
or
$0.66/boe
73 MMbbls of Proved plus Probable liquids
$4.85/sh (EV)
0.45 bbls/sh= $10.78/2P bbl
14

PDP0.8 Tcfe
Proved Undeveloped
2.3 Tcfe
Probable3.8 Tcfe • 64% increase in Proved Developed Producing reserves
• 26% of Total Proved reserves are Proved Developed Producing
• 41% increase in Proved Plus Probable reserves
• 45% of Proved Plus Probable reserves are Total Proved
• Proved Plus Probable reserves include 73 MMbbls of liquids
• Reserve Life Index of:
• 7 years - Proved Developed Producing
• 27 years - Total Proved
• 52 years - Proved Plus Probable
NPV10 $905 MM
NPV10 $1.7 billion NPV10
$740 MM
*Note: NPV calculated using 10% discount rate; GLJ Pricing as of January 2018; 2018 AECO $2.20/MMbtu; 2019 AECO $2.54/MMbtu
Proved Plus ProbableTotal Proved
Reserve Information As at Dec 31, 2017
2017 Reserves Highlights
6.9 Tcfe of Proved Plus Probable reserves with an NPV10 of $3.3 billion* ($20.53/share)
Tcfe
0.0
1.0
2.0
3.0
4.0
5.0
6.0
7.0
8.0
2011 2012 2013 2014 2015 2016 2017
0.8 1.11.7
2.9
4.64.9
6.9
Probable Proved Undeveloped Proved Developed Producing
PONY Reserve Growth
15

Proved Developed Producing Total Proved Proved plus Probable
2017 Recycle Ratios (FD&A - incl changes in FDC) 3-Year Average - Recycle Ratios (FD&A - incl changes in FDC) 2017 Recycle Ratio
1.0x
2.0x
3.0x
0.0x
1.1x1.3x
1.6x1.8x
1.9x
3.2x
20
17
Rec
ycle
Rat
ios
4.0x
1.6x
Note: FD&A – Finding, Development & Acquisition costsF&D – Finding and Development costs
Recycle RatiosLow Cost Reserve Additions in 2017
1.6x Proved Developed Producing 2017 F&D Recycle Ratio
16

$29 $107 $56 $204 $108 $303 $155
$220
0
100
200
300
400
500
$0
$50
$100
$150
$200
$250
$300
$350
$400
$145
2018 Sustainable Capital SpendingCash Flow Budget
2015 20175.7x 2.6x 2.7x
2018e20162.0xYear-End Net
Debt to Q4 Annualized Cash Flow
$0.56/share $0.76/share $0.97/share
$0.29/share
139 MMcfe/d(23,204 boe/d)
257 MMcfe/d(42,882 boe/d) 348 – 360 MMcfe/d
(58,000 – 60,000 boe/d)
94 MMcfe/d(15,604 boe/d)
At $2.00 AECO, PONY grows year-over-year cash flow per share by 28% in 2018
36%CFPS
Growth
80%CFPS
Growth
Annual Average Daily Production (forecast)
Annual Average Daily Production (actual)
Capital Development Program
Cash Flow (actuals)
2018 Cash Flow (forecast)
Net of Interest Expense, G&A, and Capital Lease Expense
(2018 pricing based on WTI US$65/bbl, NYMEX USD$3.00, AECO CAD$2.00/Mcf, F/X CAD$0.79)
28%CFPS
Growth
$165
2018 capital development program to be $145 - $165 million, matching 2018 cash flow
17

2018 Corporate Cash Flow SensitivityCash Flow Budget
AECO Price ($/Mcf)
Cas
h F
low
($
/Mcf
e)
USD$65/bblFX CAD $0.79
Cash Flow (including hedges)
Cash Flow (excluding hedges)
$-
$0.25
$0.50
$0.75
$1.00
$1.25
$1.50
$1.75 $2.00 $2.25 $2.50 $2.75 $3.00 $3.25
Physical and financial fixed price hedges provide significant protection from natural gas price volatility, stabilizing annual cash flow
18

$0.00
$0.50
$1.00
$1.50
$2.00
$2.50
$3.00
$3.50
$0.00
$0.50
$1.00
$1.50
2018f
Pre-Tax Earnings
$0.25
Non-cash Items* ($0.96)
*Non-cash items include stock based compensation, accretion expense, and DD&A (does not include unrealized gain/loss on risk management contracts)
$3.35/Mcfe
Top Line Revenue (including Hedging)
($0.14)
($0.20)
($0.42)
Hedging Gain $0.23
2018f2018 pricing at:
$65/bbl WTI; $2.00/Mcf AECO; USD/CAD $0.79
Solid Margins Drive EarningsCost Efficiencies Drive Higher Cash Flow per Mcfe
Royalties ($0.06)
Operating Cost ($0.59)
Transportation ($0.72)
G&A ($0.14)
Interest ($0.19)
Capital Lease ($0.44)
Cash Flow $0.98 (before hedging)
PONY can deliver earnings despite low AECO prices due to very low DD&A driven by strong capital efficiencies
Diverse fixed-price contracts and financial hedges deliver strong netbacks despite low
AECO pricing
$1.21/Mcfe
Cash Flow
19

Return on Average Capital Employed (ROACE) Illustrates Operational Sustainability
Source: Scotiabank Global Banking and Markets – “The Valuation Book” February 2018; ROACE = earnings before interest & taxes (EBIT) / (average total assets – average current liabilities)
11%
-25%
-20%
-15%
-10%
-5%
0%
5%
10%
15%
20%
25%
-25%
-20%
-15%
-10%
-5%
0%
5%
10%
15%
20%
25%
VII
CV
E
ERF
ECA
PO
U
AR
X
PO
NY
NV
A
DEE
PEY SU
CN
Q
AA
V
CR
BN
P
RR
X
MEG
TOU
VET
IMO
PSK
WC
P
CO
NA
FRU
ATH
BN
E
SGY
PX
X
BTE
CP
G CJ
TOG
HSE
SPE
BIR
KEL
OB
E
BX
E
PM
T
PG
F
IBR
-25%
-20%
-15%
-10%
-5%
0%
5%
10%
15%
20%
25%
XEC
NFX
VN
OM LP
I
CH
K
SRC
I
JAG
FAN
G
CR
ZO
EOG
GP
OR
CO
G
DV
N
SWN
CP
E
AR
MTD
R
CX
O
WR
D
RSP
P PE
CLR
PXD
OXY
AP
A
CD
EV
EQT
RR
C
EGN
HK
EPE
NB
L
ECR
PD
CE
MU
R
BB
G
MR
O
QEP SM WLL
WP
X
AP
C
KO
S
HES
Average US
4.3%Average Canada
4.2%
2017 Canadian ROACE2017 US ROACE
North American Producers 2017 ROACE
-98
%
-98
%
PONY’s returns rank amongst the highest by North America E&Ps
11%
20

Market DiversificationNatural Gas Sales Points
Chicago
LNG Export
Dawn
NYMEXMexico Export
PONY Sales / Pricing Exposure
Medicine Hat
AECO
1 GMP FirstEnergy Forecast – January 2018
Current US Exports 3.8 Bcf/d2019 Additions 2.7 Bcf/d 2020 Additions 3.0 Bcf/d1Total (end 2020) 9.5 Bcf/d
AECO Markets152 161 MMcf/d end of 2018 (fixed price & spot)
MEDICINE HAT14-year contract to initially deliver 10 MMcf/d to Methanex’s methanol plant in Medicine Hat, Alberta increasing to 50 MMcf/d by 2023
Map here
Current 4.5 Bcf/d1End 2019 5.2 Bcf/d
Enbridge
Station CS2
CS16
Sunset Creek
BR
ITIS
H C
OL
UM
BIA
Malin
DAWN Market36 MMcf/d (Current) 44 MMcf/d (Nov 2018)76 MMcf/d (Nov 2019) (fixed price & spot)
21
SUMAS Market28 32MMcf/dEnd of 2018(spot)
NYMEX Market40 26 MMcf/d end of 2018 (basis contracts)
Station 2
Sumas

Fixed Price Contract Pricing
Exposures
Station 2
$2.62/Mcf27%
AECO$3.13/Mcf
37%
Liquids
$66.06/bbl29%
DAWN
$3.99/Mcf7%
Total Expected 2018 Production
Revenue by Source
NGL & Condensate
5%
Volumes not under contract are presumed to be sold at index pricing as at May 1, 2018
2018 Production RevenueManaging Volatility
65% of PONY’s Q2 – Q4 2018 production volumes are protected
through a combination of physical and financial contracts at a volume-
weighted average price of $3.88/Mcfe
Fixed Price Contracts
65% DAWN 6%
SUMAS 5%
AECO 7%
NYMEX9%
NGL & Condensate
5%
22

Percentage on Fixed Price Contract (Financial and Physical)
Hedging ProfilePrudent Risk Management
63%
50%
44%
57%
88%
94%
98%
93%
22% 24% 24% 23%
0%
25%
50%
75%
100%
Q2 2018 Q3 2018 Q4 2018 AverageRemaining
2018Natural Gas Hedges Condensate Hedges Propane Hedges
Perc
enta
ge F
ore
cast
Pro
du
ctio
n H
edge
d
$3.06Mcf
$3.02Mcf
$2.97Mcf
$72.24bbl
$72.69bbl
$72.70bbl $72.56
bbl
$38.82bbl
$38.82bbl
$38.82bbl
$38.82bbl
$3.00Mcf
105
61
31 18
56
97
115
115
121
112
0
50
100
150
200
250
300
Q1 2019 Q2 2019 Q3 2019 Q4 2019 2019Average
Basis Contracts Fixed Price Contratcs
Nat
ura
l Gas
Vo
lum
e H
edge
d (
Mcf
)
Volume of Product on Contract (Financial / Physical Fixed Price and Basis)
2,750 2,750
2,250 2,2502,500
0
2,000
4,000
6,000
8,000
Liqu
ids V
olu
me
Hed
ged (b
bls/d
)
AECO Basis 46%
SUMAS Basis17%
AECO FP$3.2712%
St 2 FP $2.7415%
Dawn FP $3.77
5%
NYMEX Basis 5%
$3.02Mcf
$2.97Mcf
$2.93Mcf
$3.13Mcf
$3.01Mcf
$74.22bbl
$74.22bbl
$72.90bbl
$72.90bbl
$73.56bbl
Liquids Hedges
23
8,000
6,000
2,000
0
4,000

Massive reserves base
Top well performance with increasing liquids cut
Low well costs
Firm transportation to diverse pricing hubs
Attractive relative valuation
Well situated to supply Canadian west coast LNG projects
Pony PointsChecking Off All of the Boxes
24

Appendices and Advisories

Diversified Market Exposure2018 / 2019 Sales Contracts Support Strong Netbacks
Reflective of PONY’s heat content, natural gas volumes converted from GJ to Mcf at a conversion ratio of 1 : 1.15
Index pricing as of May 1, 2018; All currency CAD$Painted Pony actively markets the majority of natural gas volumes into a diversity of sales points and accessing a diversity of pricing
27

TownsendLEGEND
Painted Pony Lands
Painted Pony / AltaGas Facilities
Third-Party Facilities
Enbridge T-North Pipeline
Secondary Pipelines
Daiber (50 MMcf/d)
AltaGas Townsend
(297 MMcf/d)
Kobes(30 MMcf/d)
KanataRich Gas
(27 MMcf/d)
AltaGas Blair Creek Plant
(75 MMcf/d)
Kobes
Blair
Daiber
Beg
West Blair
West Blair (25 MMcf/d)
DaiberFacilities
(60 MMcf/d)
Jedney(13 MMcf/d)
Processing & Market AccessFirm Transportation & Processing Capacity Supports Production
All current processing requirements in-place while firm transportation supports market diversification strategy
(increases to 90 MMcf/d Nov 2019)
28

Financial Strength Term Debt and Credit Facility Provide Flexibility
$400 Million Syndicated Credit Facility• Secured, Reserve Based Lending• Matures May 2020• $164 million drawn as at March 31, 2018• $40 million in Letters of Credit
$142 Million Senior Unsecured Notes• Held by Magnetar Capital• 8.5% Coupon • Mature in 2022• Not callable for 3 years
$45 Million Subordinated Convertible Debentures• Held by Magnetar Capital• 6.5% Coupon • $5.60 Conversion Price• Mature in 2021 (subject to any conversion)• ‘No Shorting’ Provision included
Debt Capital Diversification
Syndicated Credit Facility
Undrawn
Drawn
Letters of Credit
Drawn on Credit Facility
Senior Notes
Convertible Debentures
$196
$164
$40
$164
$142
$45
28
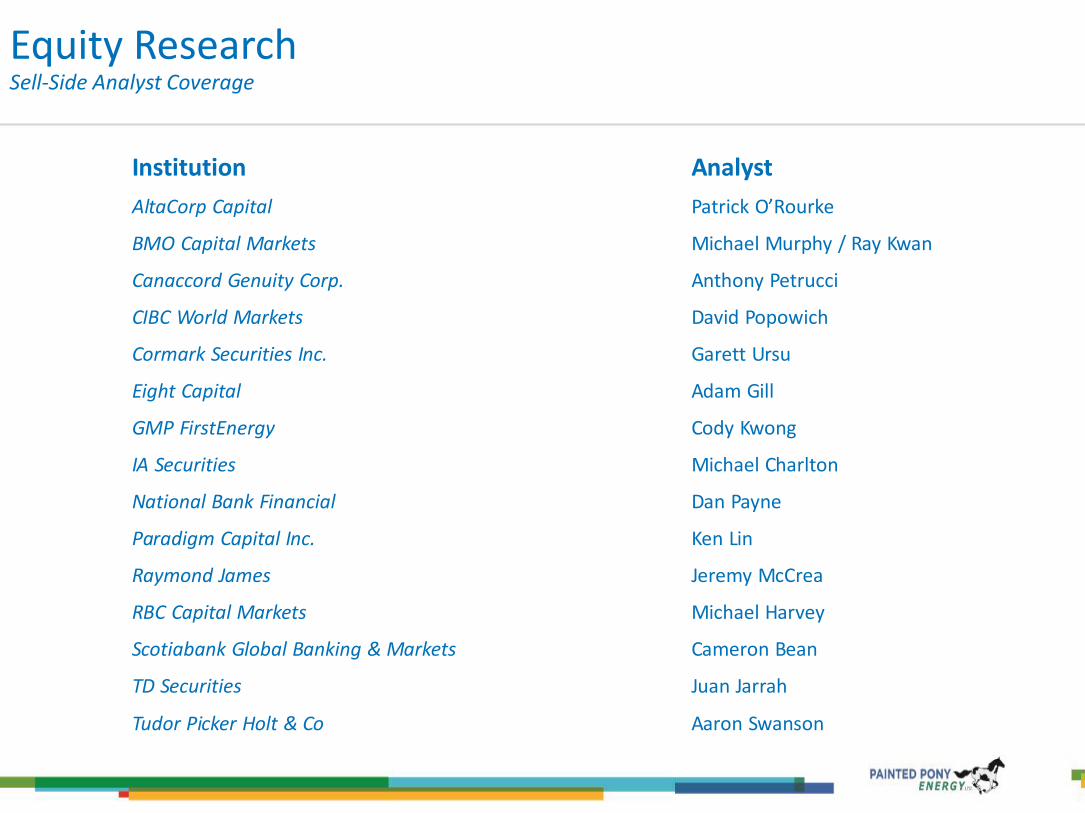
Institution Analyst
AltaCorp Capital Patrick O’Rourke
BMO Capital Markets Michael Murphy / Ray Kwan
Canaccord Genuity Corp. Anthony Petrucci
CIBC World Markets David Popowich
Cormark Securities Inc. Garett Ursu
Eight Capital Adam Gill
GMP FirstEnergy Cody Kwong
IA Securities Michael Charlton
National Bank Financial Dan Payne
Paradigm Capital Inc. Ken Lin
Raymond James Jeremy McCrea
RBC Capital Markets Michael Harvey
Scotiabank Global Banking & Markets Cameron Bean
TD Securities Juan Jarrah
Tudor Picker Holt & Co Aaron Swanson
Equity ResearchSell-Side Analyst Coverage

Auditor KPMG LLP
Evaluation Engineers GLJ Petroleum Consultants Ltd.
Banks
Transfer Agent
The Toronto-Dominion Bank
The Bank of Nova Scotia
Alberta Treasury Branches
Canadian Imperial Bank of Commerce
Royal Bank of Canada
HSBC Bank Canada
Wells Fargo Bank
TSX Trust Company
Corporate Office
1800, 736 – 6th Avenue SW, Calgary, AB T2P 3T7
Toll Free Investor 1 (866) 975-0440
Tel (403) 475-0440 Fax (403) 238-1487
Email: [email protected]
www.paintedpony.ca
Corporate Overview

This presentation contains a summary of management’s assessment of results and should be read in conjunction with the Consolidated Financial Statements and related Management’s Discussion and Analysis for the quarter ended March 31,2018, as filed on SEDAR. This presentation contains certain forward-looking statements, which include assumptions with respect to (i) drilling success; (ii) commodity prices; (iii) production; (iv) reserves; (v) future capital expenditures; (vi)future operating costs; (vii) availability of gas processing facilities; (viii) cash flow; (ix) potential markets for the Corporation’s production; and (x) the availability of LNG export facilities. The reader is cautioned that assumptions used in thepreparation of such information may prove to be incorrect.
Certain information regarding the Corporation set forth in this presentation, including statements regarding management’s assessment of the Corporation’s future plans and operations, the planning and development of certain prospects,production estimates, reserve estimates, productive capacity and economics of new wells, undeveloped land holdings and values, capital expenditures and the timing and allocation thereof (including the number, location and costs of plannedwells), facility expansion plans, the total future capital required to bring undeveloped proved and probable reserves onto production, and expected production growth, may constitute forward-looking statements under applicable securitieslaws and necessarily involve substantial known and unknown risks and uncertainties. These forward-looking statements are subject to numerous risks and uncertainties, certain of which are beyond the Corporation’s control, including withoutlimitation, risks associated with oil and gas exploration, development, exploitation, production, marketing and transportation, loss of markets, failure of foreign markets to become accessible, the impact of general economic conditions,industry conditions, volatility of commodity prices, currency fluctuations, environmental risks, competition, the lack of availability of qualified personnel or management, inability to obtain drilling rigs or other services, capital expenditurecosts, including drilling, completion and facility costs, unexpected decline rates in wells, wells not performing as expected, stock market volatility, delays resulting from or inability to obtain required regulatory approvals and ability to accesssufficient capital from internal and external sources, the impact of general economic conditions in Canada, the United States and overseas, industry conditions, changes in laws and regulations (including the adoption of new environmentallaws and regulations) and changes in how they are interpreted and enforced, increased competition, fluctuations in foreign exchange or interest rates and market valuations of companies with respect to announced transactions and the finalvaluations thereof. Readers are cautioned that the foregoing list of factors is not exhaustive. The Corporation’s actual results, performance or achievement could differ materially from those expressed in, or implied by, these forward-lookingstatements and, accordingly, no assurance can be given that any of the events anticipated by the forward-looking statements will transpire or occur, or if any of them do so, what benefits the Corporation will derive therefrom. All subsequentforward-looking statements, whether written or oral, attributable to the Corporation or persons acting on its behalf are expressly qualified in their entirety by these cautionary statements. Additional information on these and other factorsthat could affect the Corporation’s operations and financial results are included in reports on file with Canadian securities regulatory authorities and may be accessed through the SEDAR website (www.sedar.com) or the Corporation’s website(www.paintedpony.ca), including the Corporation’s MD&A for the quarter March 31, 2018.
The forward-looking statements contained in this presentation are made as of the date on the front page and the Corporation assumes no obligation to update publicly or to revise any of the included forward-looking statements, whether as aresult of new information, future events or otherwise, except as may be required by applicable securities laws. Certain information contained herein is based on, or derived from, information provided by independent third-party sources. TheCorporation believes that such information is accurate and that the sources from which it has been obtained are reliable. The Corporation cannot guarantee the accuracy of such information, however, and has not independently verified theassumptions on which such information is based. The Corporation does not assume any responsibility for the accuracy or completeness of such information.
This presentation also contains future-oriented financial information and financial outlook information (collectively, "FOFI") about prospective results of operations, future net revenue, share capital, cash flow, capital expenditures, net debtand components thereof, all of which are subject to the same assumptions, risk factors, limitations, and qualifications as set forth in the above paragraphs. FOFI contained in this presentation was made as of the date of this presentation andwas provided for the purpose of providing information about management's current expectations and plans relating to the future, including with respect to the Corporation’s ability to fund its expenditures. The Corporation disclaims anyintention or obligation to update or revise any forward looking statements or FOFI contained in this presentation, whether as a result of new information, future events or otherwise, unless required pursuant to applicable securities law.Readers are cautioned that the forward looking statements and FOFI contained in this presentation should not be used for purposes other than for which it is disclosed herein. The forward looking statements and FOFI contained in thispresentation are expressly qualified by this cautionary statement.
NON-GAAP MEASURES This presentation contains references to measures used in the oil and gas industry such as “cash flow” and “net debt’” These measures do not have any standardized meanings within International Financial Reporting Standards (“IFRS”) and, therefore, reported amounts may not be comparable to similarly titled measures reported by other companies. These measures have been described and presented in this presentation in order to provide shareholders and potential investors with additional information regarding the Corporation’s liquidity and its ability to generate funds to finance its operations. Cash flow should not be considered an alternative to, or more meaningful than cash flows from operating activities as determined in accordance with IFRS as an indicator of the Corporation’s performance. Cash flow denotes cash flow from operating activities before the effects of changes in non-cash working capital, share unit expense and decommissioning expenditures. Cash flow is used by the Corporation to evaluate operating results and the Corporation’s ability to fund capital expenditures and repay debt. The Corporation uses net debt as a measure to assess its financial position. Net debt is a non-GAAP measure calculated as bank debt, senior notes, liability portion of convertible debentures, and working capital deficiency, adjusted for the net current portion of fair value of risk management contracts and current portion of finance lease obligation. Included in this presentation are estimates of the Corporation's 2018 cash flow which are based on various assumptions as to production levels, commodity prices and other assumptions, are provided for illustration only and are based on budgets and forecasts that have not been finalized and are subject to a variety of contingencies including prior years’ results. To the extent such estimates constitute a financial outlook, they were approved by management of the Corporation in Dec 2017 and are included to provide readers with an understanding of the Corporation's anticipated cash flow based on the capital expenditures and other assumptions described and readers are cautioned that the information may not be appropriate for other purposes.
Advisory
31

NOTE REGARDING RESERVES DISCLOSURE
The securities regulatory authorities in Canada have adopted National Instrument 51-101 – Standards of Disclosure for Oil and Gas Activities (“NI 51-101”), which imposes oil and gas disclosure standards for Canadian public issuers engaged in oil and gas activities. NI 51-101 permits oil and gas issuers, in their filings with Canadian securities regulatory authorities, to disclose proved, probable and possible reserves, and to disclose reserves and production on a gross basis before deducting royalties. Probable and possible reserves are progressively less certain estimates than proved reserves.
All reserves information in this presentation are presented on a gross basis. Gross reserves are the total working interest reserves before the deduction of any royalties and including any royalty interests receivable. Reserves estimates set forth herein with respect to the Corporation are based on the independent engineering evaluation of the Corporation’s oil, natural gas liquids and natural gas reserves (the “GLJ Report”) prepared by GLJ Petroleum Consultants Ltd. (“GLJ”) effective December 31, 2017 and dated March 6, 2018, and reserves estimates set forth herein with respect to the Target are based on an independent engineering evaluation of the Target’s oil, natural gas liquids and natural gas reserves (the “McDaniel Report”) prepared by McDaniel & Associates Consultants Ltd. (“McDaniel”) effective December 31, 2017 and dated March 6, 2018. Before tax net present values set forth herein are based on a 10 percent discount rate and GLJ’s January 1, 2018 forecast prices as applicable.
All estimates of future revenue in this presentation and in the documents incorporated herein by reference are, unless otherwise noted, after the deduction of royalties, development costs, production costs and well abandonment costs but before deduction of future income tax expenses and before consideration of indirect costs such as administrative, overhead and other miscellaneous expenses. The estimated future net revenues contained in this presentation and in the documents incorporated herein by reference do not represent the fair market value of the applicable reserves.
In this presentation: a) the discounted and undiscounted net present value of future net revenues attributable to reserves do not represent the fair market value of reserves; b) there is no assurance that the forecast prices and costs assumptions will be attained and variances could be material. The recovery and reserve estimates of natural gas and liquids reserves provided in this presentation are
estimates only and there is no guarantee that the estimated reserves will be recovered. Actual natural gas and liquids reserves may be greater than or less than the estimates provided in this presentation; c) the estimates of reserves and future net revenue for individual properties may not reflect the same confidence level as estimates of reserves and future net revenue for all properties, due to the effects of aggregation; d) boe amounts may be misleading, particularly if used in isolation. Boe amounts have been calculated using the conversion ratio of six thousand cubic feet (6 Mcf) to one barrel of oil (1 bbl). A conversion ratio of 6 Mcf to 1 bbl is
based on an energy equivalency conversion method primarily applicable at the burner tip and does not represent a value equivalency at the wellhead. Given that the value ratio based on the current price of crude oil as compared to natural gas is significantly different from the energy equivalency of 6:1, utilizing a conversion on a 6:1 basis may be misleading as an indication of value; and
e) Mcfe amounts may be misleading, particularly if used in isolation. Mcfe amounts have been calculated by using the conversion ratio of 1 bbl to 6 Mcf. A conversion ratio of 1 bbl to 6 Mcfs based on an energy equivalency conversion method primarily applicable at the burner tip and does not represent a value equivalency at the wellhead. Given that the value ratio based on the current price of crude oil as compared to natural gas is significantly different from the energy equivalency of 1:6, utilizing a conversion on a 1:6 basis may be misleading as an indication of value.
Reserves are the estimated remaining quantities of conventional natural gas, shale gas and natural gas liquids anticipated to be recoverable from known accumulations, from a given date forward, based on: (i) analysis of drilling, geological, geophysical and engineering data; (ii) the use of established technology; and (iii) specified economic conditions which are generally accepted as reasonable.
Reserves are classified according to the degree of certainty associated with the estimates.
a) Proved reserves are those reserves that can be estimated with a high degree of certainty to be recoverable. It is likely that the actual remaining quantities recovered will exceed the estimated proved reserves.
b) Probable reserves are those additional reserves that are less certain to be recovered than proved reserves. It is equally likely that the actual remaining quantities recovered will be greater or less than the sum of the estimated proved plus probable reserves.
Other criteria that must also be met for the categorization of reserves are provided in the Canadian Oil and Gas Evaluation (“COGE”) Handbook.
Each of the reserves categories (proved and probable) may be divided into developed and undeveloped categories. (a) Developed reserves are those reserves that are expected to be recovered from existing wells and installed facilities or, if facilities have not been installed, that would involve a low expenditure (for example, when compared to the cost of drilling a well) to put the reserves on production. The developed category may be subdivided into producing and non-producing.
(i) Developed producing reserves are those reserves that are expected to be recovered from completion intervals open at the time of the estimate. These reserves may be currently producing or, if shut-in, they must have previously been on production, and the date of resumption of production must be known with reasonable certainly.
(ii) Developed non-producing reserves are those reserves that either have not been on production, or have previously been on production, but are shut-in, and the date of resumption of production is unknown.
Advisory
32
Advisory

(b) Undeveloped reserves are those reserves expected to be recovered from known accumulations where a significant expenditure (for example, when compared to the cost of drilling a well) is required to renderthem capable of production. They must fully meet the requirements of the reserves classification (proved, probable) to which they are assigned.
In multi-well pools it may be appropriate to allocate total pool reserves between the developed and undeveloped categories or to subdivide the developed reserves for the pool between developed producing and developed non-producing. This allocation should be based on the estimator’s assessment as to the reserves that will be recovered from specific wells, facilities and completion intervals in the pool and their respective development and productionstatus.
The qualitative certainty levels referred to in the definitions above are applicable to individual reserves entities (which refers to the lowest level at which reserves calculations are performed) and to reported reserves (which refersto the highest level sum of individual entity estimates for which reserve estimates are prepared). Reported reserves should target the following levels of certainty under a specific set of economic conditions:
(a) at least a 90 percent probability that the quantities actually recovered will equal or exceed the estimated proved reserves; and(b) at least a 50 percent probability that the quantities actually recovered will equal or exceed the sum of the estimated proved plus probable reserves.
A quantitative measure of the certainty levels pertaining to estimates prepared for the various reserves categories is desirable to provide a clearer understanding of the associated risks and uncertainties. However, the majority ofreserves estimates will be prepared using deterministic methods that do not provide a mathematically derived quantitative measure of probability. In principle, there should be no difference between estimates prepared usingprobabilistic or deterministic methods.
Additional clarification of certainty levels associated with reserves estimates and the effect of aggregation is provided in the COGE Handbook.
For additional information regarding the presentation of the Corporation’s reserves and other oil and gas information, see the Corporation’s Form 51-101F1, which may be accessed through the SEDAR website (www.sedar.com)or the Corporation’s website (www.paintedpony.ca).
Advisory
33
Advisory


