114
PAKISTAN DISTRICT EDUCATION RANKINGS 2016
PAKISTAN DISTRICT EDUCATION RANKINGS2016
PA
KIS
TAN
DIS
TRIC
T ED
UC
ATIO
N R
AN
KIN
GS
2016

Saman NazAsif Saeed MemonMinhaj ul HaqueUmar NadeemGhamae JamalAleena Khan
PAKISTANDISTRICTEDUCATIONRANKINGS

ii
Citation
Alif Ailaan and SDPI. 2016. Alif Ailaan Pakistan District Education Rankings 2016. Islamabad: Alif Ailaan. vi-109 pp.
ISBN 978-969-7624-01-0

iii
Acronyms vi
Foreword and Acknowledgements vii
1. Introduction 1
2. Methodology 2
3. Education Score 15
4. School Infrastructure Score 30
5. School Facilities Completeness Score 44
6. Other metrics 52
7. Alternative rankings 55
8. How to improve a district score 59
9. Holding our elected representatives accountable 60
10. The road to achieving SDG 4 62
11. Conclusions 70
Annex 1: Provincial Rankings 73
Annex 2: Regional Profiles 84
Contents

iv
List of tablesTable 1: List of secondary data sources used in the calculation of district rankings 4
Table 2: Components of the Education Score (primary school) 5
Table 3: Components of the Education Score (middle school) 6
Table 4: Components of the School Infrastructure Index (government schools) 9
Table 5: Provincial and national Education Scores (primary school) 15
Table 6: District Education Scores (primary school) 16
Table 7: Historical comparison of provinces and territories for education ranks 24
Table 8: District Education Scores (middle schools) 24
Table 9: Provincial and national School Infrastructure Scores (primary school) 30
Table 10: District School Infrastructure Score (primary school) 31
Table 11: District School Infrastructure Scores (middle schools) 38
Table 12: Provincial and national school facility completeness score 44
Table 13: School Facilities Completeness Score at district level 45
Table 14: Province and national level proportion of primary schools as percentage of all schools 52
Table 15: Province and national level percentage of primary schools with single- teacher 53
Table 16: Province and national level percentage of primary schools with single classroom 54
Table 17: District Education Scores (primary schools) with SAT 56
Table 18: District Education Scores (primary schools) with PEC 57
Table 19: Provincial and regional Education Scores (primary schools) with NAT 58
Table 20: Ranks of districts of national representatives 60
Table 21: Ranks of districts of provincial representatives 61
Table 22: Progress on MDG and EFA goals 63
Table 23: SDG 4 targets, monitoring indicators and proposed solutions 65

v
List of figures
List of maps
Figure 1: Change in Education Score (compared to 2015) 16
Figure 2: Change in School Infrastructure Scores (compared to 2015) 30
Map 1: Education Score (primary school) 22
Map 2: District School Infrastructure Scores 37
Map 3: School Completeness Score 51
Map 4: Primary schools as percentage of all schools 53
Map 5: Percentage of single-teacher schools 54
Map 6: Percentage of single-classroom schools 55

vi
AEPAM Academy for Educational Planning and Management AJK Azad Jammu and Kashmir ANP Awami National Party ASER Annual Status of Education Report BOC Bureau of Curriculum DSD Directorate of Staff Development EDI Education for All Development Index EFA Education for All FATA Federally Administered Tribal Areas GB Gilgit-Baltistan GER Gross Enrolment Rate GPS Gender Parity Score HEC Higher Education Commission HIV Human Immunodeficiency Virus IAEG -SDG Inter-agency and Expert Group on SDG indicators ICT Islamabad Capital Territory ICT skills Information & Communication Technology ITA Idara-e-Taleem-o-Aagahi JI Jamaat-e-Islami JUI-F Jamiat-e-Ulama-e-Islam - Fazl-ur-Rahman KP Khyber Pakhtunkhwa MDG Millennium Development Goals MQM Muttahida Qaumi Movement NAT National Achievement Test NAVTT National Vocational & Technical Training Commission NEAS National Education Assessment System NEMIS National Education Management Information System NER Net Enrolment Rate PBS Pakistan Bureau of Statistics PEC Punjab Examination Commission PIFRA Project to Improve Financial Reporting and Auditing PITE Provincial Institute of Teacher Education PMAP Pakhtunkhwa Milli Awami Party PML-N Pakistan Muslim League – Nawaz PML-Q Pakistan Muslim League – Quaid-i-Azam PPPP Pakistan Peoples Party Parliamentarians PSLMS Pakistan Social and Living Standards Measurement Survey PTI Pakistan Tehreek-e-Insaf RSU Reform Support Unit SAT Standardized Assessment Test – Sindh SDG Sustainable Development Goals STEDA Sindh Teachers Education Development Authority UN United Nations UNESCO United Nations Educational, Scientific and Cultural Organization
Acronyms
vii
Bismillah irr Rahman irr Raheem.
This is the fourth annual district education rankings report. In February 2013, when we first set out to execute a political campaign for education, we had hoped that we would be able to spur a meaningful set of conversations about the urgent needs of Pakistani children, and the solutions available to deal with the challenges at hand. One of the tools we have sought to develop in this effort are these rankings.
At one level, these district rankings tell us what we already know – yet it bears repeating until it is no longer true. One, Pakistan has a severe education crisis. Two, Pakistan’s education crisis affects different parts of the country in different ways, with a disproportionate severity of the crisis focused on already marginalised parts of the country. Three, the disproportionality of the crisis means that children at a disadvantage are less likely to grow out of their position of disadvantage through the education system.
There are no dramatic changes to the overall ranks or the overall scores. A steady improvement in some areas, particularly access, is offset by less impressive performance in other areas, particularly in learning outcomes.
In this year’s rankings we have introduced three innovations. First, we have added an index of school completeness. The original format of the national government school census through the NEMIS database was framed in the 1990s. Since then, remarkably, no effort has been made to cohere and consolidate what the data means. In the school completeness index we take the four markers of school infrastructure or school facilities (toilets, boundary walls, electricity and drinking water) and we measure what percentage of schools actually have all four facilities concurrently. It gives us a richer picture of the simplest of education inputs: functional and respectable school buildings. We also examine the state of schools from the perspective of what share of all government schools are primary schools (over 80 percent nationwide), what share of all government schools are single-room schools (almost 16 percent), and what share of all government schools are single-teacher schools (almost 30 percent).
Second, we have used net enrolment ratio instead of gross enrolment ratio. This has been made possible through the availability of raw data that was previously unavailable. It allows for a more precise assessment of access.
Third, we have added a section on the Sustainable Development Goal 4. SDG 4 is the education SDG and without an urgent effort by government to first collect and collate, and then act on the data for the SDG 4 targets, Pakistan will fail to deliver the SDGs, as it failed to deliver the MDGs. This report includes a table that can act as a guide for government on how to go about identifying, collecting and reporting on SDG 4 targets.
Finally, we have calculated a number of alternative rankings using test scores from various sources. Perhaps the greatest challenge this poses to policymakers is the question as to why there is no standardised measure of learning outcomes across the entire country, for each district.
Taken as a whole, the district rankings offer a stark commentary on the state of education. Education is nominally a provincial matter under the Constitution, and the private sector has an unmeasured but enormous impact on the education sector as a whole. Yet, both constitutionally and morally, education continues to be government’s responsibility, starting from the Prime Minister of Pakistan down to the primary school teacher in a village in Awaran.
Foreword and Acknowledgements

viii
The rankings are a subjective tool developed through objective data. Since no part of Pakistan has truly devolved decision-making or authority, the effort to link district performance to political actors may be seen to be tenuous. It is not.
People that are elected to office at the national assembly, the provincial assembly or to the senate, as well as those that take up executive offices at either the federal and provincial level, all have a responsibility to answer questions about the state of the people that live in their respective constituencies. Districts are distinct, unique, identifiable markers of administrative authority, and if a prime minister, chief minister, federal or provincial minister, MNA, MPA or senator claim ignorance or a lack of control or a lack of responsibility, then this is a failure on the part of those elected or unelected representatives – not those who ask the questions.
Among those that have helped ask the questions are a long list of academics and researchers that have helped establish the district rankings as a part of the education conversation. It is imperative for Pakistanis to know and understand the incredible contributions these individuals are making to better education outcomes in Pakistan’s future.
First and foremost are Nasir Amin and Bilal Kakli from the Academy for Education Planning and Management (AEPAM). Without their support, as government officials, no national level education data of any significance would ever reach policymakers or citizens. Alif Ailaan and SDPI are in their debt, and the debt of Director General AEPAM Dr. Dawood Shah.
The district rankings methodology is entirely the responsibility of the authors and the Alif Ailaan and SDPI teams, however any credit for them is due to a range of supporters that have helped establish and improve the methodology over the years. Among those that have helped us improve are Dr. Faisal Bari of LUMS and IDEAS, Baela Raza Jamil of ITA and the ASER survey, Dr. Salman Humayun of I-SAPS, Abbas Rashid of SAHE, Dr. Muhammad Memon of Aga Khan University’s IED, Umbreen Arif of the World Bank, Dr. Mariam Chughtai of LUMS and Harvard University, and Sami Khan Sadozai. The report was edited by Maliha Umar and Zainab Iqbal.
In the first three years of publishing these rankings, Alif Ailaan and SDPI sought to establish a consistent methodology. In this edition, the improvements and tweaks we have made represent a quantum shift in our understanding and confidence in what the data is telling us. Above all, the data is screaming out for attention. Pakistan’s education statistics regime requires urgent and highly sophisticated attention.
The government has given indication that it is listening. In February 2016, for the first-time ever, official government data on out of school children was published by AEPAM, the institutional national home of NEMIS, which is a compendium of the respective provincial education management information systems. It concludes that a full 24 million children between the ages of five and sixteen are out of school. This represents a substantial decrease in this figure of over one million. It also represents a continuing national calamity.
As a donor-funded campaign, Alif Ailaan can and will continue to point to this calamity, and try to call attention to it. The onus for addressing it, however, lies squarely with Pakistan’s leaders. Every national issue of significance is informed, at least in part, by how the country deals with the education crisis, especially for the poor and the marginalised. We hope to write a foreword filled with better news and a more positive prognosis next year, inshaAllah.
Mosharraf Zaidi Campaign DirectorAlif Ailaan
1
Introduction Pakistan failed to meet the Millennium Development Goals targets for universal primary school access, improving retention in schools and increasing adult literacy. We do not know whether Pakistan will be able to meet the education targets of the Sustainable Development Goals (SDGs), but to have any hope of succeeding, an urgent course correction is required. Since the SDGs were agreed in 2015, there has been almost no concerted effort to establish a narrative of these new international commitments or of the renewed efforts required to be undertaken by state and society in Pakistan.
Why should we begin a discussion of the state of education at the district, province/region and national level in Pakistan with a reminder of the SDGs? Because it has become clear that Pakistani state institutions are more responsive to the country’s international obligations than they are to the needs of the poorest and most vulnerable. Nothing else explains the extremely slow progress on the very basic indicators that Alif Ailaan compiles annually in this set of indices.
The Alif Ailaan – SDPI District Education Rankings aim to help understand the state of education in Pakistan and call attention to the evidence of a deep and persistent national crisis. In this fourth annual iteration of the rankings, we attempt to not only continue presenting the two indices for education and schools, but also to offer added analysis of trends that have emerged over four years for each district and province/region. The 2016 edition uses updated statistics to generate a snapshot of the state of education in every district of the country. The districts are ranked according to their performance on educational outcomes and inputs. The purposes of this exercise are:
n to produce a measure of education standards in Pakistan that covers important policy areas for which data is available, including access, retention, learning outcomes, gender parity and school facilities and infrastructure;
n to establish a basis for comparison, across time and administrative units of different parts of the country, to track education sector performance, especially in government schools;
n to instigate debate and competition in the national political discourse across districts and provinces (and/or regions);
n to increase the use of evidence, especially official government data, in assessing the state of education and promotion of evidence-based decision-making in education; and
n to make robust policy recommendations for improving the national data regime for education statistics.
2 Pakistan District Education Rankings 2016
MethodologyThis document presents two measures to gauge the state of education. The first measure is called the Education Score, which is based on outcomes in education. It shows the educational achievement and participation across the entire population of the relevant cohort of children. Specifically, the Education Score is an index of educational outcome indicators covering access, learning, retention, and gender parity.
The second measure is called the School Infrastructure Score, which is based on the facilities available in government schools. It shows the degree to which government schools are equipped to serve the communities and children they are meant for. Specifically, the School Infrastructure Score is an index based on five indicators, the overall condition of school buildings, the availability of schools with boundary walls, the availability of schools with working electricity connections, the availability of schools with functional toilets, and the availability of schools with drinking water.
Both indices have been prepared separately for primary and middle level schools and presented at the national, provincial/regional and district levels.
Once the indices are calculated for each district and province/region, they are then ranked with highest score getting the top rank starting from one. Districts with at least one missing value are not ranked. This section describes in detail how each of these indices is constructed.
ScopeHistorically, the Alif Ailaan – SDPI District Education Rankings are based on primary education mainly due to the availability of a richer expanse of data at the primary school level. However, separate rankings of all districts using data from middle schools (ages 11 to 13 and Classes 6 through 81) are also included to provide a snapshot of the state of education at the middle level. For the 2016 edition, we approach this task in three ways. First, employing the same methodology as the past three editions2, we update the ranking using the most recently released statistics. This allows us to track the performance of individual districts and chart their progress (or the lack thereof) in education standards over a period of one year. Second, we calculate multiple alternative versions of the rankings using alternative indicators. Third, we introduce a new index to assess completeness of the availability of basic facilities in schools. A list of different kinds of rankings included in this report are as follows:
1. Education Rankings (primary school level)2. School Infrastructure Rankings (primary school level)3. Education Rankings (middle school level)4. School Infrastructure Rankings (middle school level)5. School Facility Completeness Score 6. Alternative rankings: with SAT scores (for Sindh only)7. Alternative rankings: with PEC scores (for the Punjab only)8. Alternative rankings: with NAT (at provincial level only)
1 Our age bracket definitions (6-10 year olds for primary children and 11-13 for middle school children) are based on the headline data from the PSLMS report.2 Pakistan District Education Rankings 2013, 2014 and 2015

3Methodology
Geographic coverage
The Pakistan District Education Rankings endeavours to include data from every province, region and territory across the country. There are currently a total of 151 districts and agencies in Pakistan covering the provinces of Balochistan, Khyber Pakhtunkhwa (KP), the Punjab and Sindh, the regions of Azad Jammu and Kashmir (AJK), the Federally Administered Tribal Areas (FATA), Gilgit-Baltistan (GB), and the Islamabad Capital Territory (ICT).
Complete data however, is not available for all districts. This year’s primary school Education Score ranking includes complete data for 145 districts, while the School Infrastructure Ranking covers 146 districts. Complete data required for the calculation of district rankings is not available for the following districts/agencies: Lehri, North Waziristan Agency, South Waziristan Agency, Kharmang, Shigar and Nagar3.
Data sources
The statistics used to develop the rankings come from three national datasets, two of which are official government statistics: the official National Education Management Information System (NEMIS), the official Pakistan Social and Living Standards Measurement Survey (PSLMS), and the Annual Status of Education Report (ASER), which is produced through the efforts of volunteers and non-profits across the country (led by the Idara-e-Taleem-o-Agahi).
NEMIS produces education service delivery statistics and covers all public sector educational institutions through an annual census which has been conducted every year since 1992. PSLMS is a population-based survey of households which is conducted alternatively at the district and provincial levels each year by the Pakistan Bureau of Statistics (PBS). The ITA, a non-governmental organisation, has been publishing the Annual Status of Education Report (ASER) since 2008. One of the key merits of ASER is that it covers all regions of Pakistan, including the agencies and districts of FATA, AJK and GB. Detailed information about the data extracted from these sources is given in Table 1.
3 The combined data for District Hunza and newly formed District Nagar is available under Hunza Nagar.

4 Pakistan District Education Rankings 2016
Table 1: List of secondary data sources used in the calculation of district rankings
Source Organisation Type YearDate of official release
(publication)Indicators
Number of
districts covered
National Education Management Information System (NEMIS)
Academy of Educational Planning and Management (AEPAM)
Government conducted census of government schools
2014-15February 2016
Survival rate, school infrastructure, gender parity (retention)
147
Pakistan Social & Living Standard Measurement Survey Report (PSLMS)
Pakistan Bureau of Statistics (PBS)
Government conducted survey of households
2014-15 April 2016Net Enrolment Rate, literacy rate
114
Annual Status of Education Report (ASER)
Idara-e-Taleem-o-Aagahi (ITA)
Not-for-profit non-governmental survey of households
2015December 2015
Net Enrolment Rate,Student learning outcomes
145
Standardized Achievement Test – Sindh (SAT)
Reform Support Unit (RSU), Department of Education and Literacy, Government of Sindh
Government conducted test of students
2014-15December 2015
Average achievement scores
24
National Achievement Testing (NAT)
National Education Assessment System (NEAS)
Government conducted test of students
2014September 2015
Scaled mean achievement scores
4 provinces
Punjab Examination Commission (PEC) Report
Punjab Examination Commission, Government of Punjab
Government conducted test of students
2015December 2015
Average achievement scores
36
Education Score
The Education Score produced for the calculation of these district rankings follows the methodology of Education for All Development Index (EDI) from the Global Monitoring Report4 of UNESCO which includes indicators for access, attainment, literacy and gender parity. The Education Score, however, has been modified based on the local context and the availability of data therefore it is a composite score based on four sets of indicators namely: access, retention, learning outcomes and gender parity.
To calculate the Education Score, the arithmetic average of enrolment, learning outcomes, retention (survival) and gender parity scores is used, giving equal weight to each indicator. This methodology is based on the assumption that each constituent variable—access, retention, learning outcomes
4 UNESCO (2012) EFA-GMR report 2012 available at: http://www.unesco.org/new/fileadmin/MULTIMEDIA/HQ/ED/pdf/gmr2012-report-edi.pdf

5Methodology
and gender parity—is equally important when it comes to educating all of Pakistan’s children. The Education Score is computed separately for primary and middle level schools. The components of the Education Score are provided in Table 2 and Table 3.
Table 2: Components of the Education Score (primary school)
Component Weight Indicator Sub indicator Weight
Access score 25% Net Enrolment Rate NER at primary level for age 6-10 years 25.0%
Retention score 25% Survival rate(to Class 5)
Proportion of children enrolled in Class 1 who are able to reach Class 5 25.0%
Learning score 25%
Literacy rateProportion of the population over the age of 10 years that can read a newspaper article
6.25%
Basic competence in reading and arithmetic
Percentage of Class 5 students who are able to read a story in Urdu 6.25%
Percentage of Class 5 students who are able to read a sentence in English 6.25%
Percentage of Class 5 students who are able to perform two-digit division 6.25%
Gender parity score 25%
Net Enrolment Rate of boys and girls
Ratio of girls NER and boys NER 12.5%
Survival rate of girls and boys
Ratio of girls survival rate and boys survival rate 12.5%

6 Pakistan District Education Rankings 2016
Table 3: Components of the Education Score (middle school)
Component Weight Indicator Sub indicator Weight
Access score 33.3% Net Enrolment Rate NER at middle level for age 11-13 years 33.3%
Learning score 33.3%
Literacy rateProportion of the population over the age of 10 that can read a newspaper article
8.3%
Basic competence in reading and arithmetic
Percentage of Class 8 students who are able to read a story in Urdu 8.3%
Percentage of Class 8 students who are able to read a sentence in English 8.3%
Percentage of Class 8 students who are able to perform two-digit division 8.3%
Gender parity score 33.3% Net Enrolment Rate of
boys and girls Ratio of girls NER and boys NER 33.3%
Note: Data not available for effective transition rates from middle to secondary level
It is important to note differences in the methodology of primary and middle school Education Scores:
1. Required data to calculate the retention score beyond the middle school level is not available therefore the middle school Education Score is based on three indicators (enrolment, learning and gender parity) instead of four.
2. The gender parity score is based on the comparison of enrolment rates between boys and girls only. The required data to capture the gender differences in retention is not available.
Access
Access to primary schooling at the district level is captured through Net Enrolment Rates (NER), a widely used population-based measure of the participation of children in schools. It is expressed as the ratio of number of children in the primary school age group who are currently enrolled in primary classes to the overall population of children in primary age group (primary NER). The PSLM survey reports NER by different age groups and for both genders. Class 1-5 and the corresponding age group of 6-10 years are used for the primary NER; and Class 6-8 with the corresponding age group of 11-13 years for the middle NER. Net Enrolment Rate is used for the calculation of access score and is allotted a weightage of 25 percent for the primary and 33 percent for the middle Education Score. Since the PSLM survey does not cover AJK, FATA and GB, NER for these regions has been computed using raw data from ASER. Due to the wide discrepancies in the enrolments rates from ASER and PSLMS, the NER for AJK, FATA and GB was normalised by comparing ASER and PSLMS data.
7Methodology
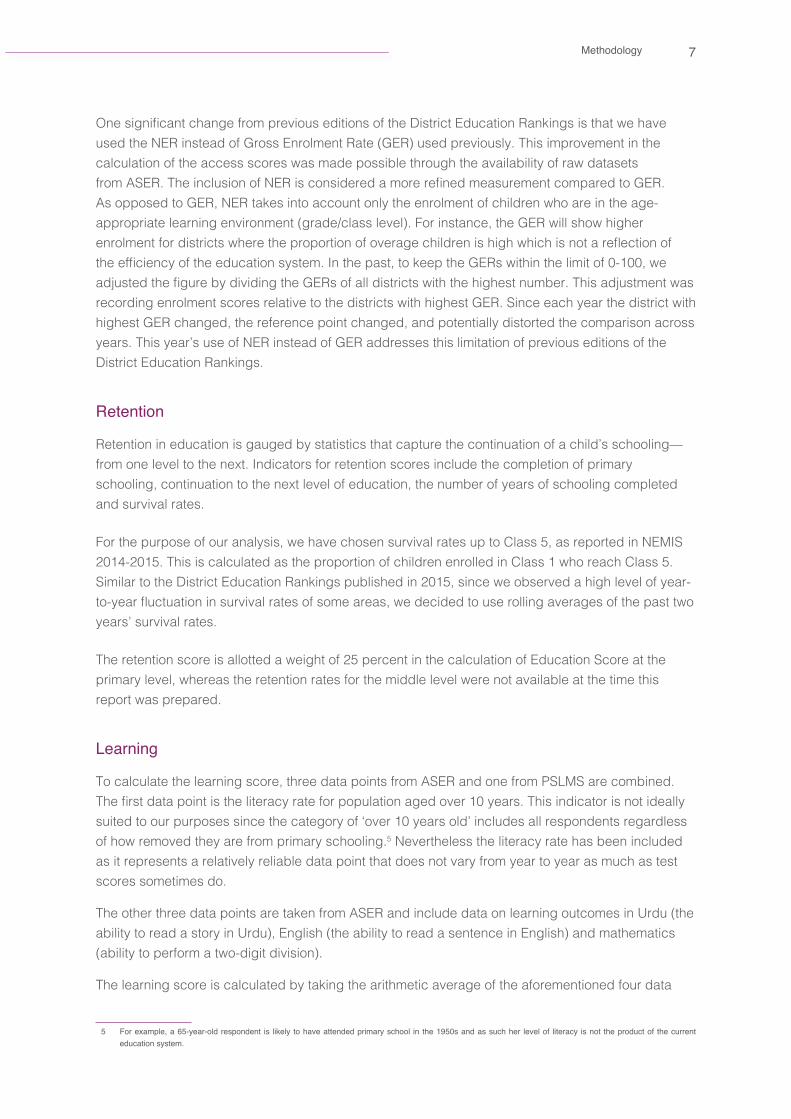
One significant change from previous editions of the District Education Rankings is that we have used the NER instead of Gross Enrolment Rate (GER) used previously. This improvement in the calculation of the access scores was made possible through the availability of raw datasets from ASER. The inclusion of NER is considered a more refined measurement compared to GER. As opposed to GER, NER takes into account only the enrolment of children who are in the age-appropriate learning environment (grade/class level). For instance, the GER will show higher enrolment for districts where the proportion of overage children is high which is not a reflection of the efficiency of the education system. In the past, to keep the GERs within the limit of 0-100, we adjusted the figure by dividing the GERs of all districts with the highest number. This adjustment was recording enrolment scores relative to the districts with highest GER. Since each year the district with highest GER changed, the reference point changed, and potentially distorted the comparison across years. This year’s use of NER instead of GER addresses this limitation of previous editions of the District Education Rankings.
Retention
Retention in education is gauged by statistics that capture the continuation of a child’s schooling—from one level to the next. Indicators for retention scores include the completion of primary schooling, continuation to the next level of education, the number of years of schooling completed and survival rates.
For the purpose of our analysis, we have chosen survival rates up to Class 5, as reported in NEMIS 2014-2015. This is calculated as the proportion of children enrolled in Class 1 who reach Class 5. Similar to the District Education Rankings published in 2015, since we observed a high level of year-to-year fluctuation in survival rates of some areas, we decided to use rolling averages of the past two years’ survival rates.
The retention score is allotted a weight of 25 percent in the calculation of Education Score at the primary level, whereas the retention rates for the middle level were not available at the time this report was prepared.
Learning
To calculate the learning score, three data points from ASER and one from PSLMS are combined. The first data point is the literacy rate for population aged over 10 years. This indicator is not ideally suited to our purposes since the category of ‘over 10 years old’ includes all respondents regardless of how removed they are from primary schooling.5 Nevertheless the literacy rate has been included as it represents a relatively reliable data point that does not vary from year to year as much as test scores sometimes do.
The other three data points are taken from ASER and include data on learning outcomes in Urdu (the ability to read a story in Urdu), English (the ability to read a sentence in English) and mathematics (ability to perform a two-digit division).
The learning score is calculated by taking the arithmetic average of the aforementioned four data
5 For example, a 65-year-old respondent is likely to have attended primary school in the 1950s and as such her level of literacy is not the product of the current education system.
8 Pakistan District Education Rankings 2016
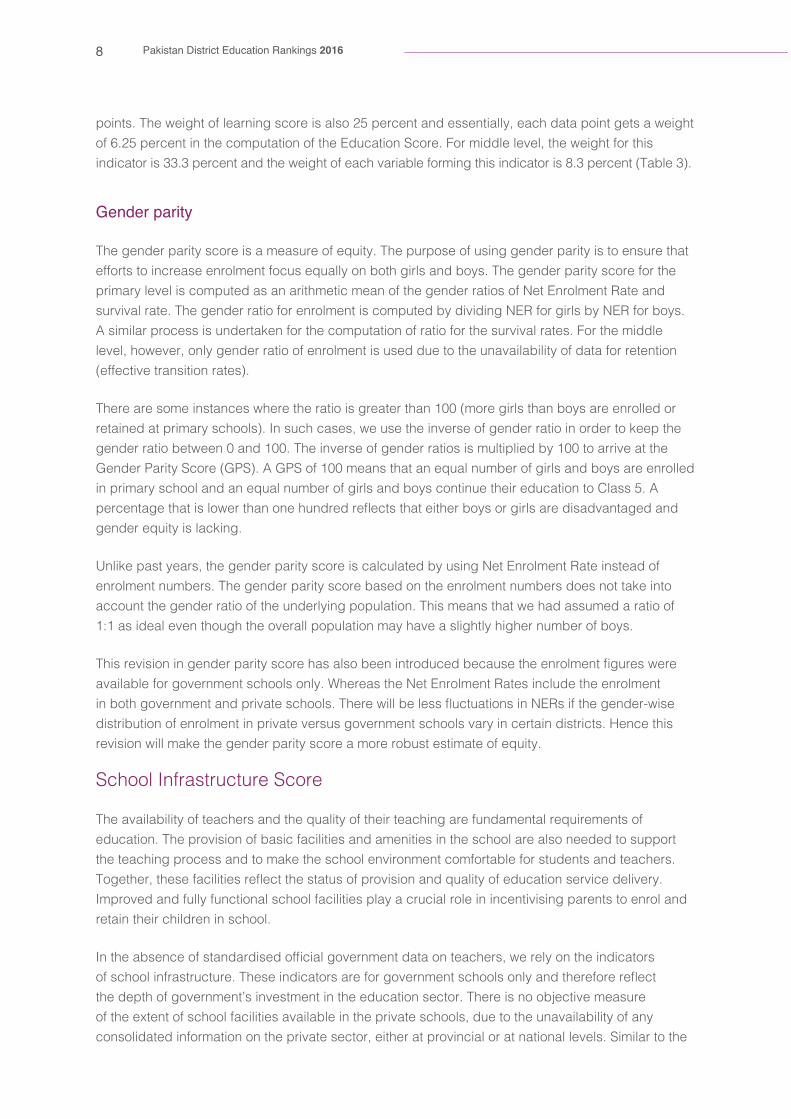
points. The weight of learning score is also 25 percent and essentially, each data point gets a weight of 6.25 percent in the computation of the Education Score. For middle level, the weight for this indicator is 33.3 percent and the weight of each variable forming this indicator is 8.3 percent (Table 3).
Gender parity
The gender parity score is a measure of equity. The purpose of using gender parity is to ensure that efforts to increase enrolment focus equally on both girls and boys. The gender parity score for the primary level is computed as an arithmetic mean of the gender ratios of Net Enrolment Rate and survival rate. The gender ratio for enrolment is computed by dividing NER for girls by NER for boys. A similar process is undertaken for the computation of ratio for the survival rates. For the middle level, however, only gender ratio of enrolment is used due to the unavailability of data for retention (effective transition rates).
There are some instances where the ratio is greater than 100 (more girls than boys are enrolled or retained at primary schools). In such cases, we use the inverse of gender ratio in order to keep the gender ratio between 0 and 100. The inverse of gender ratios is multiplied by 100 to arrive at the Gender Parity Score (GPS). A GPS of 100 means that an equal number of girls and boys are enrolled in primary school and an equal number of girls and boys continue their education to Class 5. A percentage that is lower than one hundred reflects that either boys or girls are disadvantaged and gender equity is lacking.
Unlike past years, the gender parity score is calculated by using Net Enrolment Rate instead of enrolment numbers. The gender parity score based on the enrolment numbers does not take into account the gender ratio of the underlying population. This means that we had assumed a ratio of 1:1 as ideal even though the overall population may have a slightly higher number of boys.
This revision in gender parity score has also been introduced because the enrolment figures were available for government schools only. Whereas the Net Enrolment Rates include the enrolment in both government and private schools. There will be less fluctuations in NERs if the gender-wise distribution of enrolment in private versus government schools vary in certain districts. Hence this revision will make the gender parity score a more robust estimate of equity.
School Infrastructure Score
The availability of teachers and the quality of their teaching are fundamental requirements of education. The provision of basic facilities and amenities in the school are also needed to support the teaching process and to make the school environment comfortable for students and teachers. Together, these facilities reflect the status of provision and quality of education service delivery. Improved and fully functional school facilities play a crucial role in incentivising parents to enrol and retain their children in school.
In the absence of standardised official government data on teachers, we rely on the indicators of school infrastructure. These indicators are for government schools only and therefore reflect the depth of government’s investment in the education sector. There is no objective measure of the extent of school facilities available in the private schools, due to the unavailability of any consolidated information on the private sector, either at provincial or at national levels. Similar to the
9Methodology
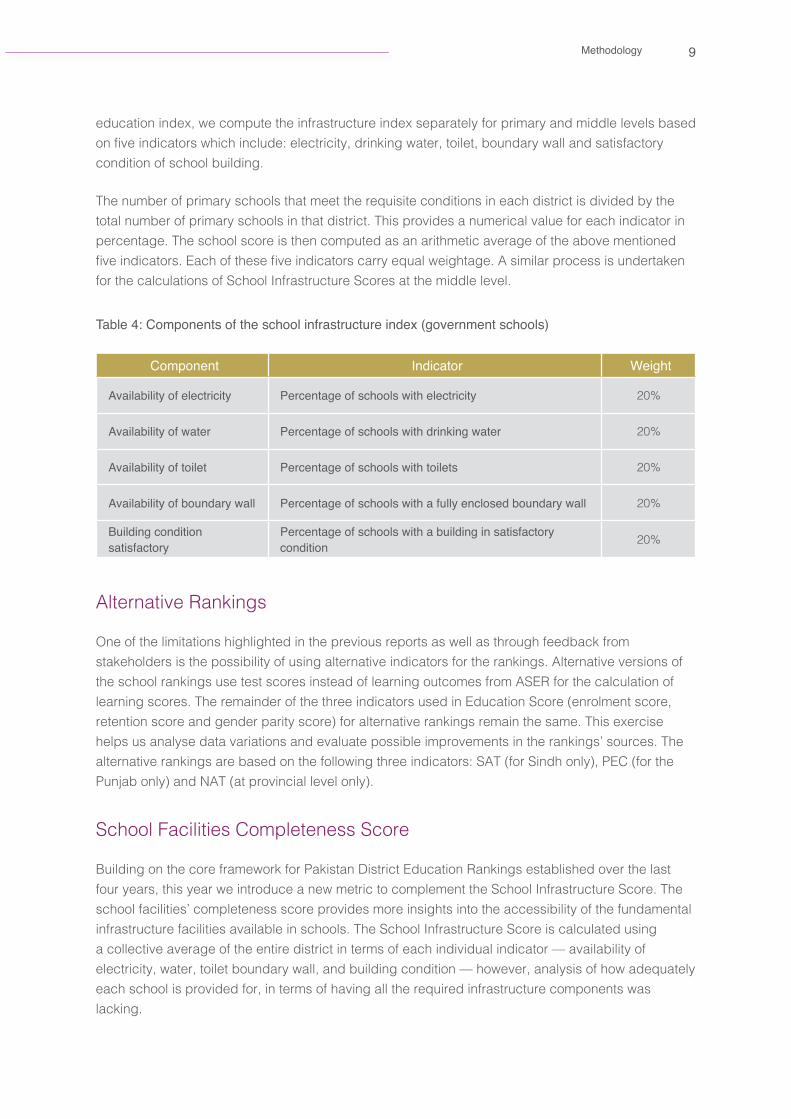
education index, we compute the infrastructure index separately for primary and middle levels based on five indicators which include: electricity, drinking water, toilet, boundary wall and satisfactory condition of school building.
The number of primary schools that meet the requisite conditions in each district is divided by the total number of primary schools in that district. This provides a numerical value for each indicator in percentage. The school score is then computed as an arithmetic average of the above mentioned five indicators. Each of these five indicators carry equal weightage. A similar process is undertaken for the calculations of School Infrastructure Scores at the middle level.
Table 4: Components of the school infrastructure index (government schools)
Component Indicator Weight
Availability of electricity Percentage of schools with electricity 20%
Availability of water Percentage of schools with drinking water 20%
Availability of toilet Percentage of schools with toilets 20%
Availability of boundary wall Percentage of schools with a fully enclosed boundary wall 20%
Building condition satisfactory
Percentage of schools with a building in satisfactory condition 20%
Alternative Rankings
One of the limitations highlighted in the previous reports as well as through feedback from stakeholders is the possibility of using alternative indicators for the rankings. Alternative versions of the school rankings use test scores instead of learning outcomes from ASER for the calculation of learning scores. The remainder of the three indicators used in Education Score (enrolment score, retention score and gender parity score) for alternative rankings remain the same. This exercise helps us analyse data variations and evaluate possible improvements in the rankings’ sources. The alternative rankings are based on the following three indicators: SAT (for Sindh only), PEC (for the Punjab only) and NAT (at provincial level only).
School Facilities Completeness Score
Building on the core framework for Pakistan District Education Rankings established over the last four years, this year we introduce a new metric to complement the School Infrastructure Score. The school facilities’ completeness score provides more insights into the accessibility of the fundamental infrastructure facilities available in schools. The School Infrastructure Score is calculated using a collective average of the entire district in terms of each individual indicator — availability of electricity, water, toilet boundary wall, and building condition — however, analysis of how adequately each school is provided for, in terms of having all the required infrastructure components was lacking.
10 Pakistan District Education Rankings 2016
The School Facilities Completeness Score uses school level data from NEMIS 2014-15 and assigns schools to one of the five categories. Each category corresponds to the extent of availability of infrastructure components – only one, two, three or all four facilities.
Once each school is scored on the infrastructure components available, arithmetic summation is used to calculate district wise total number of schools in each category. Category totals are then divided by the district total to calculate the score category percentage. The district with the highest percentage of schools in score category four (highest percentage of schools with all facilities available) ranks number one. The same calculations are applied for provincial/regional ranking.
LimitationsWhile data availability in Pakistan has improved slightly in the last few years, constructing a ranking based on an index using multiple datasets is fraught with challenges. The three secondary data sources used to compile the rankings are released relatively regularly, but the indicators used and methods employed to collect data have changed subtly from year to year. As such, there are a number of limitations that must be noted.
Availability of data
Enrolment rates
The PSLMS data covers districts located in the four provinces, ignoring AJK, FATA and GB. This bears implications on the enrolment score which uses NER from PSLMS and the learning score which uses the literacy rate from PSLMS.
In order to address the missing values, Net Enrolment Rates from ASER were calculated as a substitute for the districts from AJK, GB and FATA where PSLMS data was not available. However, for literacy rates, no substitute from any other source was available. Therefore, the learning scores for the districts from AJK, GB and FATA regions have been computed without literacy rates.
Student learning outcomes
ASER’s household survey draws its sample both from rural and urban areas and the findings from each are compiled and published separately. For ASER 2015, 145 rural districts and 17 urban districts were surveyed. For the districts where the household sample had been taken both from rural and urban areas, we calculated a weighted average for each of the three learning indicators. Weights to rural and urban indicators were assigned based on the percentage shares of the respective population of each, as computed from PSLMS 2014-15.
It is important to mention here that while weighted averages have been computed for districts with urban household samples, at the provincial level, learning indicators for only rural households have been used due to the non-availability of data at the time of compilation of this report. At the national level, however, data for both rural and urban sample households have been taken into account.
11Methodology
ASER provides the segregated data from the five districts of Karachi6 whereas both PSLMS and NEMIS provide aggregated statistics for Karachi. For the purpose of consistency, we merged the ASER indicators for all six districts of Karachi into one by taking arithmetic mean. In the absence of any figures on the population share of each of these districts, equal weights were assigned to the five districts.
Building condition
For the year 2014-15, information about the school building condition was not available for North Waziristan Agency and all ten districts of AJK. This was redressed by using the past year’s values for AJK districts. For North Waziristan Agency, however, we reported the building condition indicator as unavailable because similar issues were faced in last year’s data.
Retention scores
Historical comparison of available survival rates show wide variations over time specially for smaller regions (AJK, FATA and GB). This pattern and the fluctuations could be due to data collection and computation issues rather than the actual movements in the dropouts. However, in the absence of any stable measure of school retention we used the available data.
Traditionally, we have used effective transition rates from the middle to the secondary level from NEMIS for computing the retention scores at the middle level. However, this year’s transition rates exhibited wide variations when they were compared with the last year’s values. Due to non-availability of sufficient historic data, no statistical solution could be proposed. Therefore, the Education Scores at the middle level in this year’s edition are based on only three indicators (enrolment score, learning score and gender parity) as opposed to four in the previous year’s rankings.
Representation of private schools
The indicators for the calculation of School Infrastructure Score and retention score are collected from NEMIS which is based on the census of government schools only. The recent PSLMS 2014-15 shows that 38 percent of all currently enrolled students attend private schools, this shows that a significant proportion of schools is missing from the NEMIS.
Quality of data
Data variations between provinces and the federation
One of the biggest challenges in dealing with datasets like NEMIS is that they are a collation of data from different provinces and regions. As such, there is greater scope for error in data aggregations and calculations. While we use NEMIS data for all the provinces, some of the provinces release their own data which contradicts the NEMIS results (also collated from the provinces). We experienced this challenge during the production of the District Education Rankings in past years as some of the numbers (specifically survival rate calculations) varied between the data released by the provincial education departments and the federal government. Similar issues were faced during the production of this year’s edition. It is for this reason that we are forced to add yet another layer of selection to the calculation of the Education Score. Inevitably, this makes establishing the robustness of the final rankings even more difficult.
6 These five districts include: Karachi Central, Karachi East, Karachi Malir, Karachi South, and Karachi West.

12 Pakistan District Education Rankings 2016
Temporal variations in the data
Indicators such as survival rates from NEMIS and learning scores from ASER show significant year-on-year variations. This has caused some districts to drastically move up or down the rankings. In order to minimise the impact of these variations, both of these indicators have been normalised with statistical methods arrived at after careful evaluation of merits and demerits of each alternative. The normalisation of variations has been a two-step process. First, a condition to identify variations that need to be treated was developed. Second, the method for normalising the variation was determined by using rolling averages for selected districts.
Variations between datasets
As mentioned previously, NERs from ASER have been used for districts where PSLMS data is not available. However, ASER enrolment figures vary drastically from PSLMS enrolment rates for districts where data is available from both the sources. This not only makes comparison between the two difficult but also poses a challenge for merging them into one index. In order to make both the datasets comparable within the enrolment score, the NERs from ASER districts were normalised based on the comparison of districts where both statistics were available.
Inability to capture intra-district variation
By using aggregate numbers at the district level, intra-district variation is not captured. As a result, significant variations in education standards in large, cosmopolitan and highly urbanised districts such as Karachi, Lahore and Peshawar are ignored.
In addition to this, for districts where segregated data is not available in either of our three datasets, we have been left with no choice but to aggregate districts. This has specially been the case for Karachi which is divided into six districts. While ASER and NEMIS report segregated indicators, PSLMS reports its indicators only in aggregated form for Karachi as a whole. It is for this reason that Karachi has been treated as one district in this report.
Limitations of available literacy rate
Using the literacy rate as one of our indicators means that our rankings take into account the reading abilities of individuals who have been out of the formal schooling system for many years as well as those who have never been to school. It covers a segment of the population that may not be in direct contact with the education system now. Assessing the performance of the current system based on the literacy levels of this population segment may skew results to some extent. However, this indicator contributed only 6.25 percent in Education Score and we have reason to believe that higher literacy in a district will manifest as a positive externality for children’s education.
Limitations of the School Infrastructure Index
In the case of the School Infrastructure Index, we use school infrastructure to measure school quality. Ideally, indicators that measure teaching quality, such as teacher qualification and pupil teacher ratio would add more validity to the score, however, it is hard to establish benchmarks for the calculation of indices from such indicators.
13Methodology
Furthermore, this index is reflecting availability of facilities in government schools only as information on private schools’ infrastructure is simply not available.
Taking into account the availability of electricity to develop the school infrastructure index means that the results are inherently biased in favour of urban districts, since rural schools are less likely to have electricity connections.
Other data limitations
Limitations not covered above are outlined below:
n Since ASER and PSLMS use different sampling methodologies, there is a risk in aggregating and combining statistics from separate datasets.
n Statistics used to develop the rankings are based on datasets from multiple years (2014 and 2015) which means that certain underlying trends are not fully captured as some data will not be up-to-date.
n Due to non-availability of both current and historic data, North Waziristan, Kharmang, Nagar and, Shigar have not been ranked in the education and infrastructure scores at the primary level. South Waziristan has not been ranked in Education Scores but has been ranked in infrastructure scores. In total, 145 out of 151 districts have been ranked based on Education
Scores while 146 have been ranked on infrastructure scores at the primary level.

14 Pakistan District Education Rankings 2016
FINDINGS

15Education Score
Education ScoreFor the fourth year consecutively, Islamabad has ranked highest amongst all provinces and territories in the country. The federal capital performed better than all provinces and territories in two of the four components of the Education Score: enrolment and learning score. In second and third place are Azad Jammu and Kashmir and the Punjab, respectively. This remained similar to last year, although AJK experienced a substantial increase of 10 percentage points in its Education Score (the largest improvement amongst provinces and territories) while the Punjab’s score decreased minimally (Figure 1).
Table 5: Provincial and National Education Scores (primary school)
RankChange
Province/ Region
Education Score
Enrolment Score
Learning Score
Retention Score
Gender Parity Score
2016 2015 2016
1 1 ↔ ICT 85.74 89.52 71.13 87.50 94.82
2 2 ↔ AJK 81.68 73.42 66.60 92.00 94.70
3 3 ↔ Punjab 73.56 70.33 62.73 66.00 95.18
4 4 ↔ GB 73.21 58.55 60.30 87.00 86.99
- - - Pakistan 66.54 64.40 54.78 59.00 87.98
5 5 ↔ KP 65.32 70.85 49.48 65.00 75.96
6 6 ↔ Sindh 60.44 60.87 41.25 50.00 89.65
7 8 ↑ FATA 54.05 62.10 50.80 31.00 72.30
8 7 ↓ Balochistan 51.04 55.56 42.68 28.00 77.93
Note: “-” not ranked
Further examination of the components of the Education Score highlights interesting findings. AJK managed to score the highest in retention (survival till Class 5), with an impressive increase of 15.04 percentage points. It went on to score the second highest in enrolment and learning score. The Punjab scored the highest in gender parity at 95.18 demonstrating equal opportunities for girls and boys in the education system. The province did, however, experience a decrease in retention scores, by 6.01 points. As opposed to last year, the Punjab showcased some improvement in learning score by almost four points.
Gilgit-Baltistan remained stagnant at the 4th rank three years in a row, although its Education Score did increase by three points. This primarily seemed to be because of an increased retention score.
Khyber Pakhtunkhwa (KP) and Sindh remained at the same ranks they were last year, with KP at the fifth rank and Sindh at sixth. However, both provinces suffered a decline in their Education Score of almost two percentage points each. KP demonstrated improvements in both enrolment and gender parity scores. However the reduction in the overall Education Score of the province is mainly due to the decline in retention rates by ten points. Learning score is lowest for Sindh 41.25 (Table 5).
16 Pakistan District Education Rankings 2016
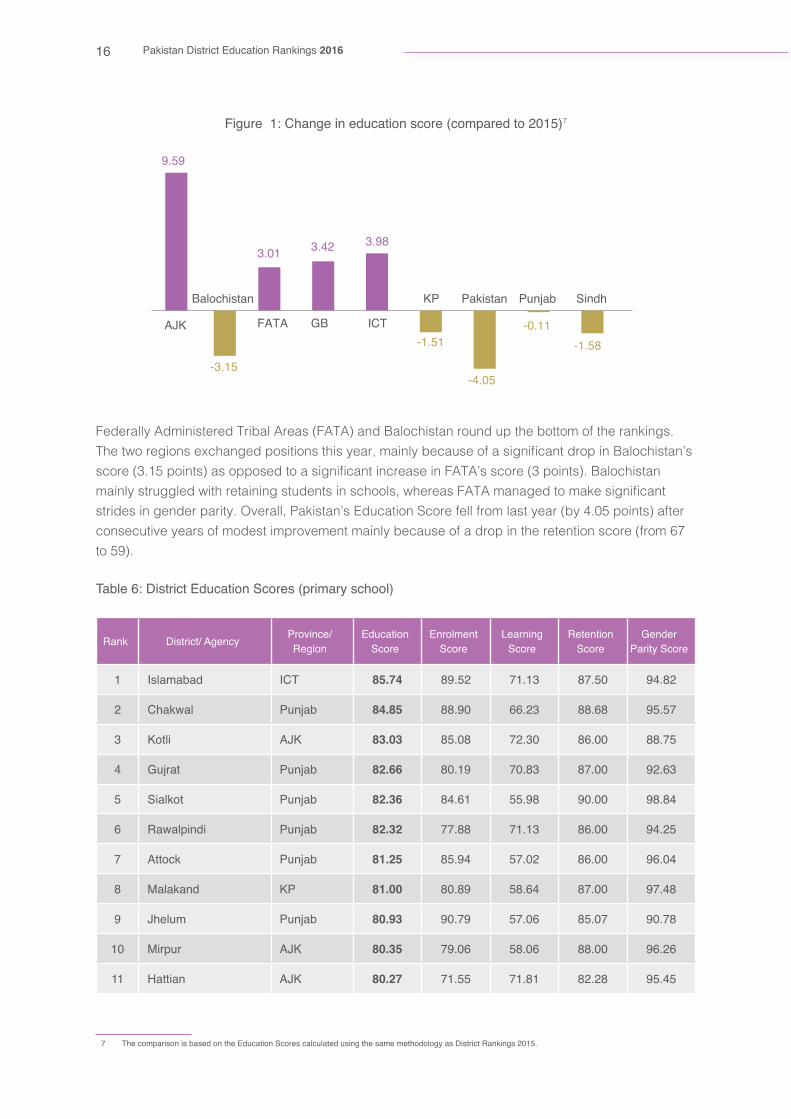
Figure 1: Change in education score (compared to 2015)7
PunjabKP Pakistan Sindh
GBFATAAJK
Balochistan
ICT
9.59
-1.58-0.11
-4.05
3.42
-1.51
-3.15
3.983.01
Federally Administered Tribal Areas (FATA) and Balochistan round up the bottom of the rankings. The two regions exchanged positions this year, mainly because of a significant drop in Balochistan’s score (3.15 points) as opposed to a significant increase in FATA’s score (3 points). Balochistan mainly struggled with retaining students in schools, whereas FATA managed to make significant strides in gender parity. Overall, Pakistan’s Education Score fell from last year (by 4.05 points) after consecutive years of modest improvement mainly because of a drop in the retention score (from 67 to 59).
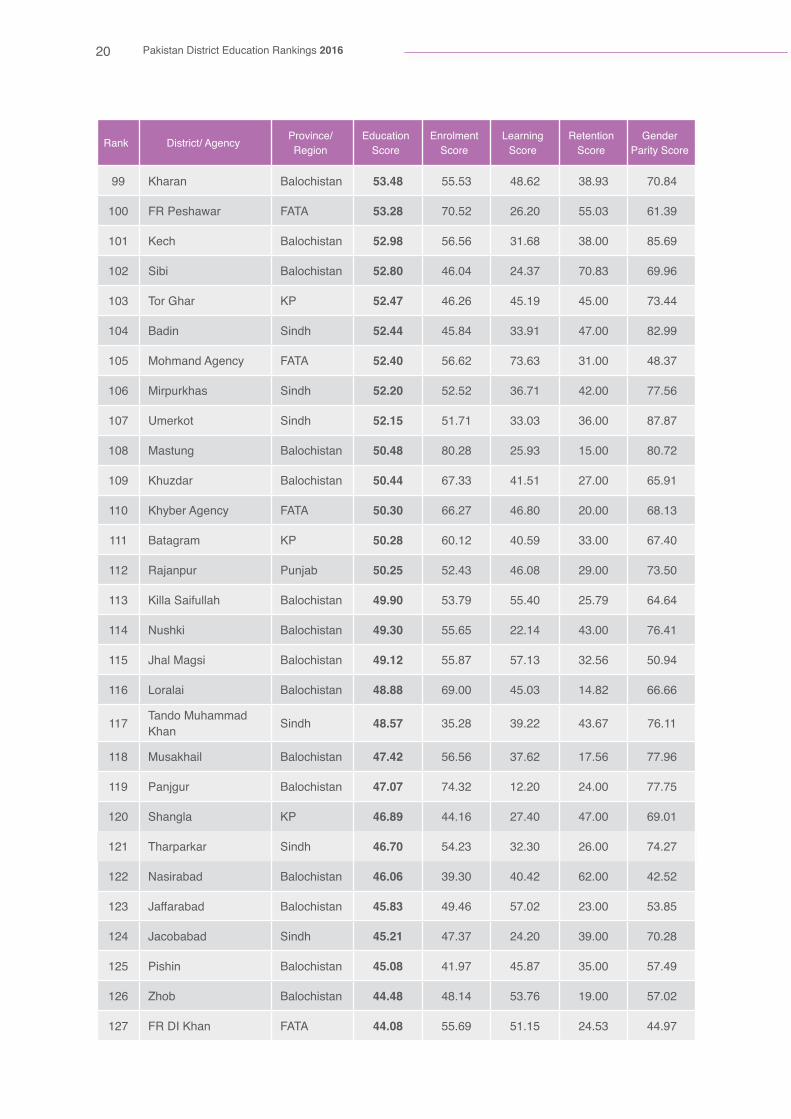
Table 6: District Education Scores (primary school)
Rank District/ Agency Province/Region
Education Score
Enrolment Score
Learning Score
Retention Score
Gender Parity Score
1 Islamabad ICT 85.74 89.52 71.13 87.50 94.82
2 Chakwal Punjab 84.85 88.90 66.23 88.68 95.57
3 Kotli AJK 83.03 85.08 72.30 86.00 88.75
4 Gujrat Punjab 82.66 80.19 70.83 87.00 92.63
5 Sialkot Punjab 82.36 84.61 55.98 90.00 98.84
6 Rawalpindi Punjab 82.32 77.88 71.13 86.00 94.25
7 Attock Punjab 81.25 85.94 57.02 86.00 96.04
8 Malakand KP 81.00 80.89 58.64 87.00 97.48
9 Jhelum Punjab 80.93 90.79 57.06 85.07 90.78
10 Mirpur AJK 80.35 79.06 58.06 88.00 96.26
11 Hattian AJK 80.27 71.55 71.81 82.28 95.45
7 The comparison is based on the Education Scores calculated using the same methodology as District Rankings 2015.
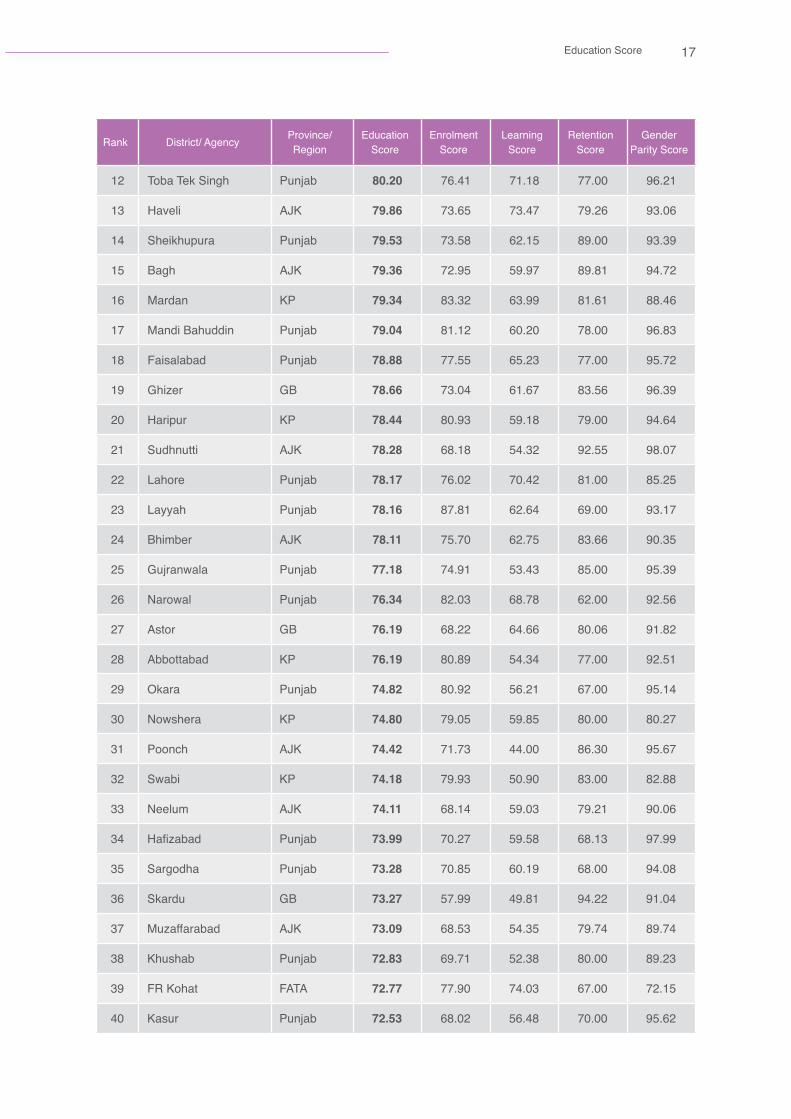
17Education Score
Rank District/ Agency Province/Region
Education Score
Enrolment Score
Learning Score
Retention Score
Gender Parity Score
12 Toba Tek Singh Punjab 80.20 76.41 71.18 77.00 96.21
13 Haveli AJK 79.86 73.65 73.47 79.26 93.06
14 Sheikhupura Punjab 79.53 73.58 62.15 89.00 93.39
15 Bagh AJK 79.36 72.95 59.97 89.81 94.72
16 Mardan KP 79.34 83.32 63.99 81.61 88.46
17 Mandi Bahuddin Punjab 79.04 81.12 60.20 78.00 96.83
18 Faisalabad Punjab 78.88 77.55 65.23 77.00 95.72
19 Ghizer GB 78.66 73.04 61.67 83.56 96.39
20 Haripur KP 78.44 80.93 59.18 79.00 94.64
21 Sudhnutti AJK 78.28 68.18 54.32 92.55 98.07
22 Lahore Punjab 78.17 76.02 70.42 81.00 85.25
23 Layyah Punjab 78.16 87.81 62.64 69.00 93.17
24 Bhimber AJK 78.11 75.70 62.75 83.66 90.35
25 Gujranwala Punjab 77.18 74.91 53.43 85.00 95.39
26 Narowal Punjab 76.34 82.03 68.78 62.00 92.56
27 Astor GB 76.19 68.22 64.66 80.06 91.82
28 Abbottabad KP 76.19 80.89 54.34 77.00 92.51
29 Okara Punjab 74.82 80.92 56.21 67.00 95.14
30 Nowshera KP 74.80 79.05 59.85 80.00 80.27
31 Poonch AJK 74.42 71.73 44.00 86.30 95.67
32 Swabi KP 74.18 79.93 50.90 83.00 82.88
33 Neelum AJK 74.11 68.14 59.03 79.21 90.06
34 Hafizabad Punjab 73.99 70.27 59.58 68.13 97.99
35 Sargodha Punjab 73.28 70.85 60.19 68.00 94.08
36 Skardu GB 73.27 57.99 49.81 94.22 91.04
37 Muzaffarabad AJK 73.09 68.53 54.35 79.74 89.74
38 Khushab Punjab 72.83 69.71 52.38 80.00 89.23
39 FR Kohat FATA 72.77 77.90 74.03 67.00 72.15
40 Kasur Punjab 72.53 68.02 56.48 70.00 95.62

18 Pakistan District Education Rankings 2016
Rank District/ Agency Province/Region
Education Score
Enrolment Score
Learning Score
Retention Score
Gender Parity Score
41 Nankana Sahib Punjab 72.39 76.82 69.45 56.00 87.29
42 Sahiwal Punjab 72.35 73.38 55.33 70.00 90.70
43 Karachi Sindh 72.18 73.70 67.90 58.00 89.13
44 Ghanchi GB 71.92 66.65 47.43 87.36 86.24
45 Mianwali Punjab 71.88 70.44 58.90 72.00 86.19
46 Bhakkar Punjab 71.66 70.29 67.20 59.00 90.17
47 Chitral KP 71.10 76.41 39.66 79.00 89.32
48 Gilgit GB 70.95 56.66 52.23 85.24 89.64
49 Khanewal Punjab 70.39 68.79 68.40 57.00 87.35
50 Charsadda KP 70.17 74.81 54.65 66.00 85.20
51 Naushehro Feroze Sindh 69.88 70.97 45.55 77.00 85.99
52 Karak KP 69.81 74.40 50.45 74.00 80.39
53 Hunza Nagar GB 69.72 69.04 53.38 71.00 85.48
54 Kohat KP 69.56 73.63 49.84 73.90 80.89
55 Jhang Punjab 69.53 68.75 65.20 58.00 86.15
56 Pakpattan Punjab 69.48 72.74 63.10 51.00 91.10
57 Vehari Punjab 69.01 69.09 54.95 59.00 93.00
58 Gwadar Balochistan 68.28 82.28 35.74 74.00 81.10
59 Quetta Balochistan 68.09 72.39 60.30 54.00 85.68
60 Mansehra KP 67.68 74.20 67.15 50.00 79.36
61 Chiniot Punjab 66.63 68.02 58.93 53.00 86.57
62 Bannu KP 66.08 64.00 57.63 64.78 77.92
63 Lodhran Punjab 65.82 59.81 64.82 46.00 92.64
64 Lower Dir KP 65.50 71.80 29.00 74.00 87.20
65 Bahawalpur Punjab 65.34 50.25 62.47 53.00 95.62
66 Bahawalnagar Punjab 65.03 59.01 57.55 54.00 89.56
67 Dadu Sindh 64.62 80.62 42.48 45.00 90.39
68 Rahim Yar Khan Punjab 64.43 49.69 64.95 53.00 90.10
69 Multan Punjab 63.89 66.81 43.78 50.00 94.95

19Education Score
Rank District/ Agency Province/Region
Education Score
Enrolment Score
Learning Score
Retention Score
Gender Parity Score
70 Larkana Sindh 63.84 65.37 41.93 62.00 86.08
71 Khairpur Sindh 63.74 66.51 30.39 74.00 84.07
72 Sukkur Sindh 63.65 63.36 47.81 61.00 82.45
73 Kurram Agency FATA 63.19 66.57 54.67 56.00 75.50
74 Shaheed Benazirabad Sindh 63.08 64.42 35.43 69.11 83.37
75 Peshawar KP 62.74 76.90 37.61 63.00 73.45
76 Sohbatpur Balochistan 62.23 67.50 57.19 35.00 89.23
77 Hyderabad Sindh 61.59 63.60 41.44 60.00 81.34
78 Dera Ghazi Khan Punjab 61.02 64.09 60.51 34.00 85.48
79 Ghotki Sindh 60.01 49.29 48.48 62.00 80.30
80 Hangu KP 59.55 69.64 30.87 72.00 65.67
81 Orakzai Agency FATA 58.98 75.29 61.13 28.00 71.50
82 Lakki Marwat KP 58.53 62.99 31.75 73.00 66.39
83 Swat KP 58.17 77.13 32.98 49.00 73.56
84 Sanghar Sindh 57.55 52.31 44.61 55.00 78.29
85 FR Bannu FATA 57.33 54.15 56.19 55.25 63.73
86 Muzaffargarh Punjab 57.19 60.73 50.73 38.00 79.31
87 Upper Dir KP 57.05 55.65 39.15 59.25 74.14
88 Buner KP 57.00 77.58 29.83 59.00 61.58
89 Tando Allah Yar Sindh 56.74 46.71 35.23 59.00 86.02
90 Dera Ismail Khan KP 55.49 51.95 37.37 54.00 78.63
91 Kashmore-Kandhkot Sindh 54.86 41.92 33.06 65.00 79.46
92 Diamir GB 54.82 27.50 82.32 56.00 53.46
93 Shikarpur Sindh 54.79 51.29 26.09 61.00 80.77
94 FR Tank FATA 54.57 70.45 26.02 51.00 70.83
95 Matiari Sindh 54.30 51.75 28.28 52.00 85.15
96 Jamshoro Sindh 54.01 61.65 30.47 43.00 80.93
97 Kambar-Shahdadkot Sindh 53.81 58.31 33.49 36.00 87.43
98 Lasbela Balochistan 53.50 46.81 36.54 50.00 80.65
20 Pakistan District Education Rankings 2016
Rank District/ Agency Province/Region
Education Score
Enrolment Score
Learning Score
Retention Score
Gender Parity Score
99 Kharan Balochistan 53.48 55.53 48.62 38.93 70.84
100 FR Peshawar FATA 53.28 70.52 26.20 55.03 61.39
101 Kech Balochistan 52.98 56.56 31.68 38.00 85.69
102 Sibi Balochistan 52.80 46.04 24.37 70.83 69.96
103 Tor Ghar KP 52.47 46.26 45.19 45.00 73.44
104 Badin Sindh 52.44 45.84 33.91 47.00 82.99
105 Mohmand Agency FATA 52.40 56.62 73.63 31.00 48.37
106 Mirpurkhas Sindh 52.20 52.52 36.71 42.00 77.56
107 Umerkot Sindh 52.15 51.71 33.03 36.00 87.87
108 Mastung Balochistan 50.48 80.28 25.93 15.00 80.72
109 Khuzdar Balochistan 50.44 67.33 41.51 27.00 65.91
110 Khyber Agency FATA 50.30 66.27 46.80 20.00 68.13
111 Batagram KP 50.28 60.12 40.59 33.00 67.40
112 Rajanpur Punjab 50.25 52.43 46.08 29.00 73.50
113 Killa Saifullah Balochistan 49.90 53.79 55.40 25.79 64.64
114 Nushki Balochistan 49.30 55.65 22.14 43.00 76.41
115 Jhal Magsi Balochistan 49.12 55.87 57.13 32.56 50.94
116 Loralai Balochistan 48.88 69.00 45.03 14.82 66.66
117 Tando Muhammad Khan Sindh 48.57 35.28 39.22 43.67 76.11
118 Musakhail Balochistan 47.42 56.56 37.62 17.56 77.96
119 Panjgur Balochistan 47.07 74.32 12.20 24.00 77.75
120 Shangla KP 46.89 44.16 27.40 47.00 69.01
121 Tharparkar Sindh 46.70 54.23 32.30 26.00 74.27
122 Nasirabad Balochistan 46.06 39.30 40.42 62.00 42.52
123 Jaffarabad Balochistan 45.83 49.46 57.02 23.00 53.85
124 Jacobabad Sindh 45.21 47.37 24.20 39.00 70.28
125 Pishin Balochistan 45.08 41.97 45.87 35.00 57.49
126 Zhob Balochistan 44.48 48.14 53.76 19.00 57.02
127 FR DI Khan FATA 44.08 55.69 51.15 24.53 44.97

21Education Score
Rank District/ Agency Province/Region
Education Score
Enrolment Score
Learning Score
Retention Score
Gender Parity Score
128 Kalat Balochistan 43.76 62.46 20.61 29.00 62.98
129 Ziarat Balochistan 43.63 56.55 46.72 21.00 50.24
130 Sujawal Sindh 43.03 47.75 34.46 20.00 69.91
131 Bajaur Agency FATA 42.42 52.80 36.57 20.00 60.32
132 Tank KP 42.41 47.55 30.42 34.00 57.68
133 Thatta Sindh 42.23 37.22 34.77 18.00 78.94
134 Kohlu Balochistan 41.93 46.14 39.66 29.00 52.90
135 Chaghi Balochistan 41.10 41.72 28.55 32.94 61.21
136 Washuk Balochistan 40.45 56.36 13.21 18.84 73.39
137 Awaran Balochistan 40.22 59.09 18.14 29.00 54.65
138 Kachhi Balochistan 39.12 44.55 37.04 16.00 58.89
139 Sherani Balochistan 37.37 43.87 40.68 25.00 39.93
140 Kohistan KP 36.70 37.10 46.63 17.50 45.58
141 Harnai Balochistan 36.57 29.90 20.88 32.00 63.50
142 Barkhan Balochistan 32.48 55.03 17.83 8.00 49.07
143 Killa Abdullah Balochistan 32.07 35.74 16.45 24.93 51.16
144 Dera Bugti Balochistan 30.36 27.76 21.80 18.00 53.88
145 FR Lakki Marwat FATA 29.44 41.60 19.17 19.80 37.20
- North Waziristan Agency FATA 49.52 - - 36.00 63.04
- South Waziristan Agency FATA 37.07 - - 17.00 57.14
- Lehri Balochistan 33.40 39.58 11.99 - 48.64
- Kharmang GB - - - - -
- Nagar GB - - - - -
- Shigar GB - - - - -
Note: “-” data not available/not ranked
Table 6 provides a breakdown of the rankings by district. At the top Islamabad (ranked 5th in 2015) climbs up four places to the first position in the 2016 rankings. Although Islamabad has appeared in the top five of the rankings every year, it managed to top both the provincial/territories ranks as well as the district rankings for the first time. This was largely due to an improvement in learning scores. Meanwhile, Rawalpindi that fell from 1st rank last year to number 6 in 2016 (mainly due to a reduction
22 Pakistan District Education Rankings 2016
in enrolment score). District Chakwal ranked number one district in 2014 remained stagnant at second, for the second consecutive year. Islamabad, Rawalpindi and Chakwal have ranked in the top ten since the start of this exercise.
Six of the top ten districts are from the Punjab, all from the northern part of the province. AJK has two districts in the top ten: Kotli and Mirpur, as opposed to last year when it had none. The highest ranking district in this edition of the District Education Rankings in Khyber Pakhtunkhwa is Malakand (replacing Haripur). Similar to last year all the top ten districts scored above 80.
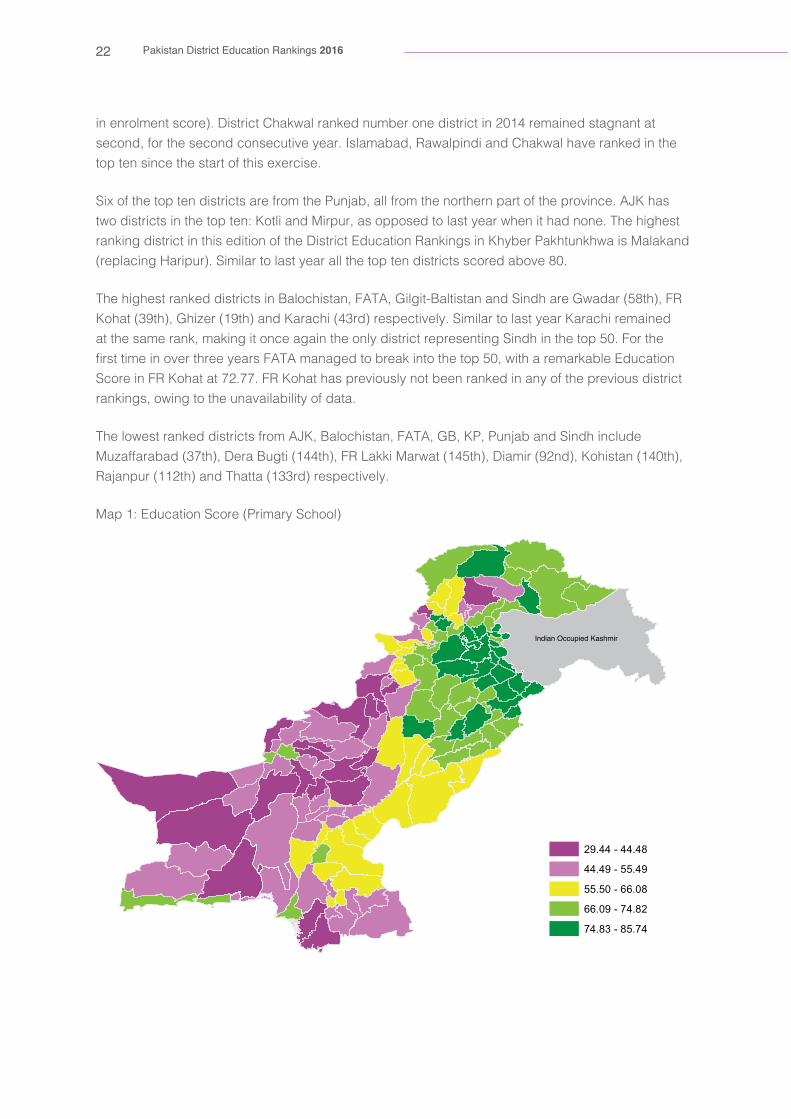
The highest ranked districts in Balochistan, FATA, Gilgit-Baltistan and Sindh are Gwadar (58th), FR Kohat (39th), Ghizer (19th) and Karachi (43rd) respectively. Similar to last year Karachi remained at the same rank, making it once again the only district representing Sindh in the top 50. For the first time in over three years FATA managed to break into the top 50, with a remarkable Education Score in FR Kohat at 72.77. FR Kohat has previously not been ranked in any of the previous district rankings, owing to the unavailability of data.
The lowest ranked districts from AJK, Balochistan, FATA, GB, KP, Punjab and Sindh include Muzaffarabad (37th), Dera Bugti (144th), FR Lakki Marwat (145th), Diamir (92nd), Kohistan (140th), Rajanpur (112th) and Thatta (133rd) respectively.
Map 1: Education Score (Primary School)
29.44 - 44.48
44.49 - 55.49
55.50 - 66.08
66.09 - 74.82
74.83 - 85.74
Indian Occupied Kashmir
23Education Score
Highlights of the primary education rankings
Overall, similar patterns have continued from past district rankings:
n The top half of the rankings is dominated by districts from the Punjab (with 33 out of 36 districts), followed by AJK (all ten districts) and Gilgit-Baltistan (six out of seven ranked districts). The districts from the Punjab in the bottom half of the rankings are all from south Punjab (Rajanpur, Muzaffargarh and Dera Ghazi Khan), although all three bottom districts improved their ranks from last year.
n The bottom half of the rankings has greater representation from Balochistan (29 out of the province’s 31 ranked districts), FATA (ten out of eleven ranked districts) and Sindh (18 out of 24 districts).
n Khyber Pakhtunkhwa is firmly ensconced in the middle of the table; Malakand, Mardan and Haripur are the only districts in the top 25 while Tank and Kohistan are in the bottom 25. Last year KP did not have a single district in the bottom 25 ranks.
n Sindh’s educational performance is persistently poor, only six districts (Karachi, Naushehro Feroze, Dadu, Larkana, Khairpur and Sukkur) appear in the top half of the rankings table; once again, Karachi is the only district in the top 50.
n Apart from FR Kohat all FATA agencies are in the bottom half of the rankings table; interestingly FR Kohat which was unranked in previous years, managed to get the 39th position (discussed further under Anomalies section).
n Balochistan ranked at the bottom of provincial/territories rankings, has only two districts in the top half (Gwadar and Quetta); furthermore, eight of the bottom ten districts are from Balochistan.
Anomalies
Variations from year-to-year are rare in provincial rankings (no province or region has moved more than one ranking position since we initiated this exercise in 2013). However, at the district level, districts can jump considerably up and down the ranking table. This can be due to genuine variations from year to year at the district level (e.g. the group of Class 5 students this year may be much better or much worse at test taking than the group last year); but large variations in some districts can also be due to the vagaries of data collection in Pakistan. More districts were ranked this year (with data availability improving from 142 districts to 145 districts), contributing to year-on-year changes in rank.
Overall, there are five instances where the rank of a district increased or decreased by more than 40 places. These are Sohbatpur (up 63 places from 2015), Ziarat (down by 50), Dera Ghazi Khan (up by 43), Kech (down by 48) and Killa Saifullah (down by 43).
Sohbatpur jumped 63 positions up the district rankings table to 76, and Ziarat dropped 50 ranking places down to 129. Sohbatpur was a new district that was included for the first time in 2015 rankings. It managed to move up the rankings this year due to the inclusion of retention scores which were missing in 2015. The decrease in Ziarat’s rank was primarily due to the fall in its gender parity and retention scores.

24 Pakistan District Education Rankings 2016
The biggest movers in last year’s rankings, Astor and Gwadar, remain fairly stable this year. Astor only slightly increased its rank to number 27 (up from rank 32 last year). Gwadar managed to further increase its rank to 58 (from 77 last year), mainly due to a significant improvement in learning scores.
Three districts were ranked for the first time this year including Sujawal (130), Kurram Agency (73) and FR Kohat (39). Remarkably, FR Kohat’s first entry into the ranked districts is in the top 50. This also allowed FATA to improve its overall rank this year. This is all the more remarkable given the significant displacement suffered by the people of FATA over the last two years. As displaced communities return home, it is likely that the education statistics for FATA will continue to exhibit significant year-on-year changes.
Historical comparison
Islamabad has been the top ranking region/territory since the education ranking exercise started in 2013. Similarly GB has continuously been ranked fourth. However, Punjab and AJK intermittently switch ranks, (AJK was ranked second in three of the past four years). Similarly KP and Sindh have shared the fifth rank, where KP took the position in three of the four years. Balochistan and FATA consistently occupy the bottom two ranks.
Table 7: Historical comparison of provinces and territories for education ranks
Rank 2013 2014 2015 2016
1 ICT ICT ICT ICT
2 AJK Punjab AJK AJK
3 Punjab AJK Punjab Punjab
4 GB GB GB GB
5 KP Sindh KP KP
6 Sindh KP Sindh Sindh
7 FATA Balochistan Balochistan FATA
8 Balochistan FATA FATA Balochistan
Education Score based on middle school
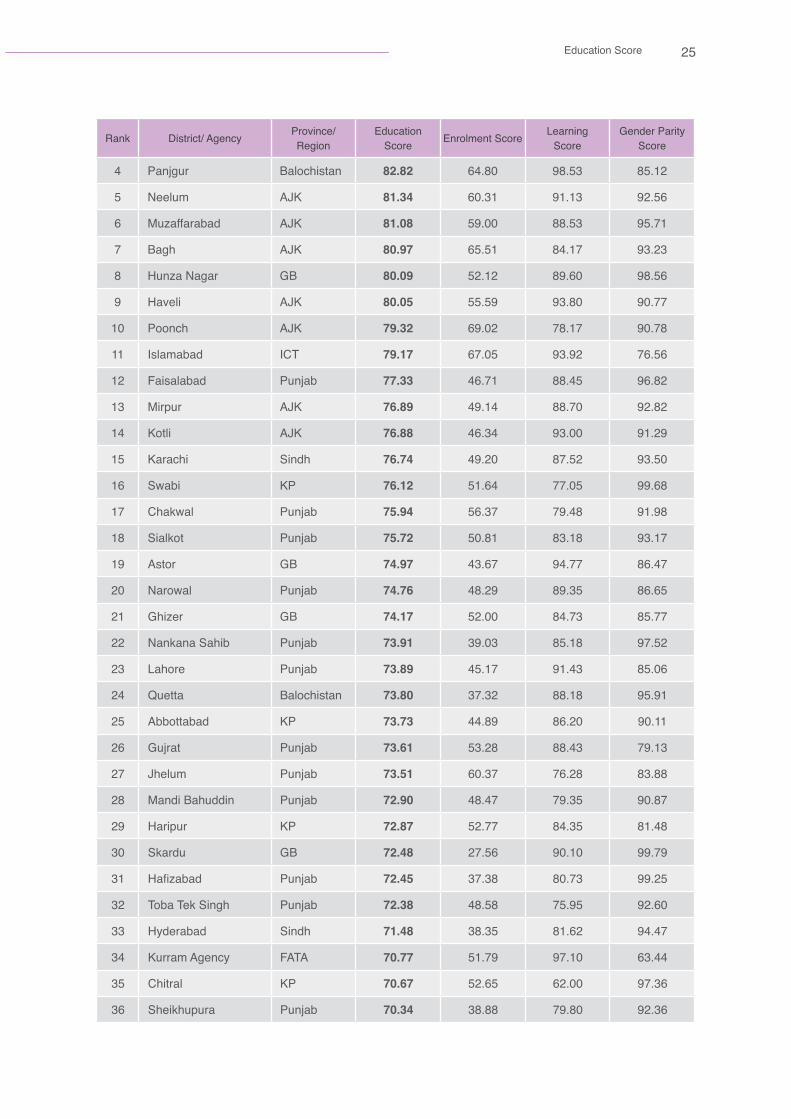
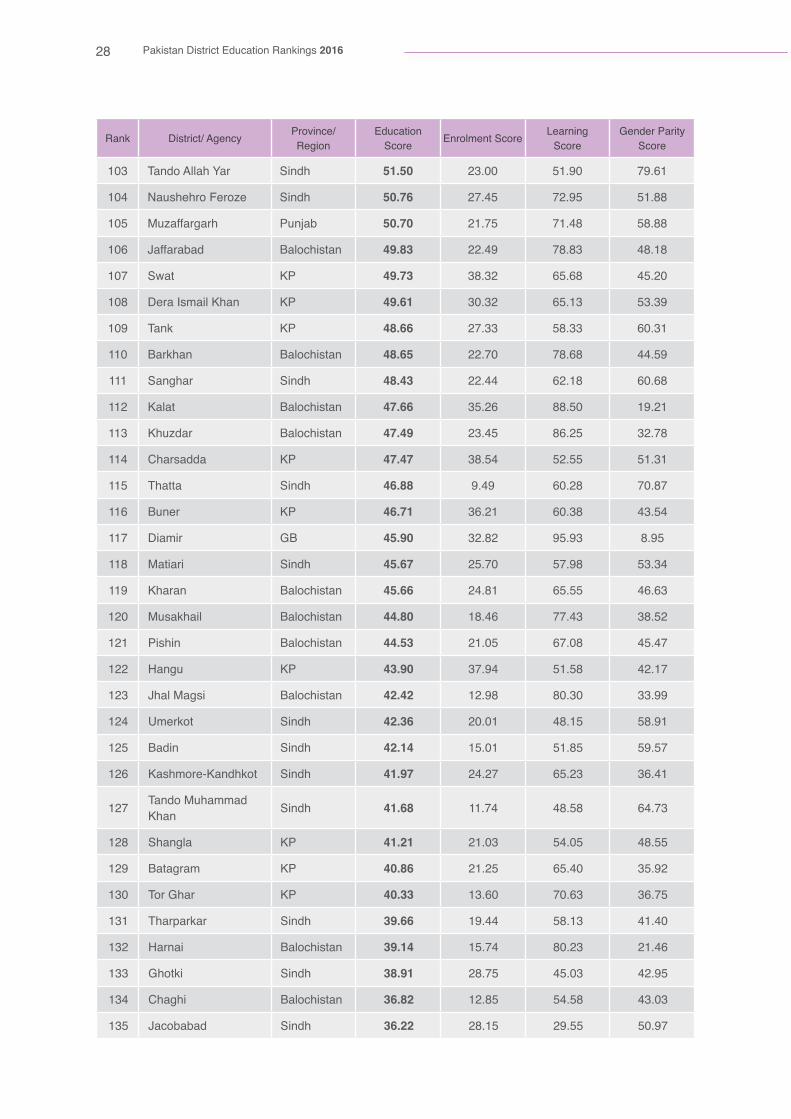
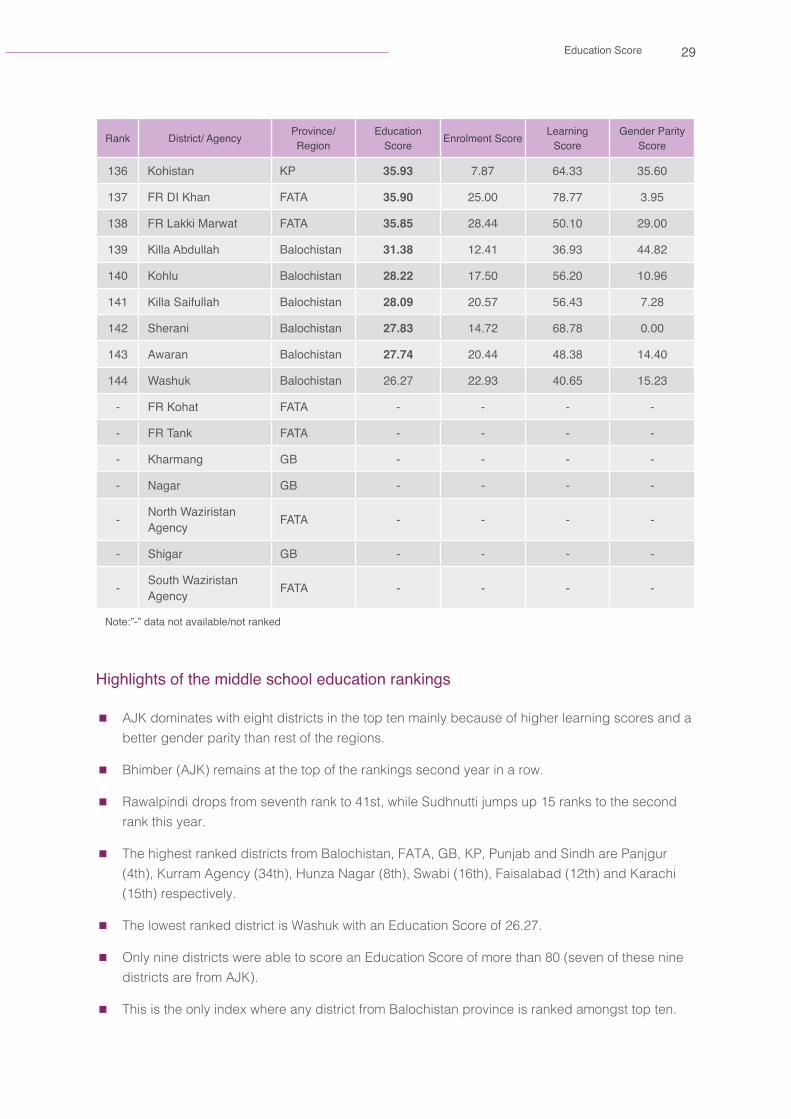
Similar to previous years, separate Education Scores are calculated for middle schools. Table 8 below provides the rankings of 144 districts at the middle school level.
Table 8: District education scores (middle schools)
Rank District/ Agency Province/Region
Education Score Enrolment Score Learning
ScoreGender Parity
Score
1 Bhimber AJK 87.96 75.16 99.70 89.03
2 Sudhnutti AJK 86.77 75.65 86.43 98.23
3 Hattian AJK 83.44 61.08 94.60 94.63
25Education Score
Rank District/ Agency Province/Region
Education Score Enrolment Score Learning
ScoreGender Parity
Score
4 Panjgur Balochistan 82.82 64.80 98.53 85.12
5 Neelum AJK 81.34 60.31 91.13 92.56
6 Muzaffarabad AJK 81.08 59.00 88.53 95.71
7 Bagh AJK 80.97 65.51 84.17 93.23
8 Hunza Nagar GB 80.09 52.12 89.60 98.56
9 Haveli AJK 80.05 55.59 93.80 90.77
10 Poonch AJK 79.32 69.02 78.17 90.78
11 Islamabad ICT 79.17 67.05 93.92 76.56
12 Faisalabad Punjab 77.33 46.71 88.45 96.82
13 Mirpur AJK 76.89 49.14 88.70 92.82
14 Kotli AJK 76.88 46.34 93.00 91.29
15 Karachi Sindh 76.74 49.20 87.52 93.50
16 Swabi KP 76.12 51.64 77.05 99.68
17 Chakwal Punjab 75.94 56.37 79.48 91.98
18 Sialkot Punjab 75.72 50.81 83.18 93.17
19 Astor GB 74.97 43.67 94.77 86.47
20 Narowal Punjab 74.76 48.29 89.35 86.65
21 Ghizer GB 74.17 52.00 84.73 85.77
22 Nankana Sahib Punjab 73.91 39.03 85.18 97.52
23 Lahore Punjab 73.89 45.17 91.43 85.06
24 Quetta Balochistan 73.80 37.32 88.18 95.91
25 Abbottabad KP 73.73 44.89 86.20 90.11
26 Gujrat Punjab 73.61 53.28 88.43 79.13
27 Jhelum Punjab 73.51 60.37 76.28 83.88
28 Mandi Bahuddin Punjab 72.90 48.47 79.35 90.87
29 Haripur KP 72.87 52.77 84.35 81.48
30 Skardu GB 72.48 27.56 90.10 99.79
31 Hafizabad Punjab 72.45 37.38 80.73 99.25
32 Toba Tek Singh Punjab 72.38 48.58 75.95 92.60
33 Hyderabad Sindh 71.48 38.35 81.62 94.47
34 Kurram Agency FATA 70.77 51.79 97.10 63.44
35 Chitral KP 70.67 52.65 62.00 97.36
36 Sheikhupura Punjab 70.34 38.88 79.80 92.36

26 Pakistan District Education Rankings 2016
Rank District/ Agency Province/Region
Education Score Enrolment Score Learning
ScoreGender Parity
Score
37 Mansehra KP 70.25 45.51 89.88 75.37
38 Ghanchi GB 70.09 40.51 85.43 84.34
39 Sargodha Punjab 69.86 40.73 83.25 85.59
40 Kasur Punjab 69.83 37.52 78.85 93.11
41 Rawalpindi Punjab 69.50 53.30 88.60 66.60
42 Okara Punjab 69.49 32.71 78.08 97.67
43 Sohbatpur Balochistan 68.99 23.84 93.30 89.82
44 Gujranwala Punjab 68.98 42.16 78.10 86.69
45 Layyah Punjab 68.72 38.92 81.65 85.58
46 Khanewal Punjab 68.42 32.91 81.00 91.35
47 Nowshera KP 68.08 51.40 82.85 69.99
48 Gilgit GB 67.96 32.82 88.77 82.29
49 Lodhran Punjab 67.50 32.83 80.08 89.61
50 Orakzai Agency FATA 67.35 48.32 90.17 63.55
51 Gwadar Balochistan 67.28 42.22 90.50 69.12
52 Mianwali Punjab 67.25 42.68 83.98 75.09
53 Bahawalpur Punjab 66.79 21.06 83.45 95.88
54 Vehari Punjab 66.04 34.13 78.18 85.82
55 Mardan KP 65.96 47.89 82.52 67.47
56 Karak KP 64.94 49.44 89.53 55.85
57 Multan Punjab 64.27 31.49 72.53 88.78
58 Khushab Punjab 64.22 39.09 78.83 74.76
59 Mastung Balochistan 64.12 57.94 83.50 50.91
60 Attock Punjab 64.00 52.13 61.15 78.72
61 Chiniot Punjab 63.91 32.80 84.78 74.15
62 Bhakkar Punjab 63.45 28.65 84.58 77.14
63 Kohat KP 62.81 48.12 88.00 52.31
64 Sahiwal Punjab 62.80 35.50 83.98 68.91
65 Sibi Balochistan 62.47 30.08 82.00 75.34
66 Bahawalnagar Punjab 62.25 30.87 77.53 78.35
67 Dadu Sindh 61.96 41.45 68.28 76.15
68 FR Bannu FATA 61.93 32.04 100.00 53.75
69 Zhob Balochistan 61.60 26.35 81.58 76.88

27Education Score
Rank District/ Agency Province/Region
Education Score Enrolment Score Learning
ScoreGender Parity
Score
70 Larkana Sindh 61.56 37.83 70.83 76.01
71 Jhang Punjab 61.06 37.10 78.60 67.47
72 Malakand KP 60.66 53.05 71.83 57.12
73 Rajanpur Punjab 60.20 26.06 64.73 89.80
74 Pakpattan Punjab 60.03 30.06 83.03 67.02
75 Ziarat Balochistan 59.88 28.63 82.35 68.66
76 Kech Balochistan 59.86 28.23 77.23 74.13
77 Lower Dir KP 59.79 41.93 45.78 91.66
78 FR Peshawar FATA 59.70 53.72 79.30 46.08
79 Sukkur Sindh 58.42 45.98 51.43 77.84
80 Jamshoro Sindh 58.05 29.12 78.13 66.89
81 Kachhi Balochistan 57.06 19.31 77.68 74.19
82 Khyber Agency FATA 56.67 43.88 79.67 46.46
83 Peshawar KP 55.73 48.43 48.04 70.73
84 Dera Ghazi Khan Punjab 55.48 25.87 72.95 67.64
85 Lakki Marwat KP 54.93 46.38 59.70 58.71
86 Shaheed Benazirabad Sindh 54.84 31.01 73.33 60.19
87 Lasbela Balochistan 54.67 20.78 66.08 77.16
88 Upper Dir KP 54.04 23.89 78.73 59.51
89 Mohmand Agency FATA 53.90 33.51 93.77 34.43
90 Sujawal Sindh 53.48 10.28 55.90 94.25
91 Loralai Balochistan 53.35 28.71 86.00 45.34
92 Shikarpur Sindh 53.25 28.32 52.93 78.51
93 Bajaur Agency FATA 53.07 38.65 93.27 27.30
94 Mirpurkhas Sindh 53.06 24.67 52.80 81.71
95 Rahim Yar Khan Punjab 53.02 22.82 74.96 61.28
96 Lehri Balochistan 52.85 26.23 93.03 39.29
97 Dera Bugti Balochistan 52.81 15.61 81.25 61.57
98 Nushki Balochistan 52.80 33.43 39.55 85.42
99 Khairpur Sindh 52.45 32.39 51.08 73.90
100 Nasirabad Balochistan 52.39 16.68 74.85 65.65
101 Bannu KP 52.33 37.29 83.73 35.96
102 Kambar-Shahdadkot Sindh 52.21 22.32 70.88 63.43
28 Pakistan District Education Rankings 2016
Rank District/ Agency Province/Region
Education Score Enrolment Score Learning
ScoreGender Parity
Score
103 Tando Allah Yar Sindh 51.50 23.00 51.90 79.61
104 Naushehro Feroze Sindh 50.76 27.45 72.95 51.88
105 Muzaffargarh Punjab 50.70 21.75 71.48 58.88
106 Jaffarabad Balochistan 49.83 22.49 78.83 48.18
107 Swat KP 49.73 38.32 65.68 45.20
108 Dera Ismail Khan KP 49.61 30.32 65.13 53.39
109 Tank KP 48.66 27.33 58.33 60.31
110 Barkhan Balochistan 48.65 22.70 78.68 44.59
111 Sanghar Sindh 48.43 22.44 62.18 60.68
112 Kalat Balochistan 47.66 35.26 88.50 19.21
113 Khuzdar Balochistan 47.49 23.45 86.25 32.78
114 Charsadda KP 47.47 38.54 52.55 51.31
115 Thatta Sindh 46.88 9.49 60.28 70.87
116 Buner KP 46.71 36.21 60.38 43.54
117 Diamir GB 45.90 32.82 95.93 8.95
118 Matiari Sindh 45.67 25.70 57.98 53.34
119 Kharan Balochistan 45.66 24.81 65.55 46.63
120 Musakhail Balochistan 44.80 18.46 77.43 38.52
121 Pishin Balochistan 44.53 21.05 67.08 45.47
122 Hangu KP 43.90 37.94 51.58 42.17
123 Jhal Magsi Balochistan 42.42 12.98 80.30 33.99
124 Umerkot Sindh 42.36 20.01 48.15 58.91
125 Badin Sindh 42.14 15.01 51.85 59.57
126 Kashmore-Kandhkot Sindh 41.97 24.27 65.23 36.41
127 Tando Muhammad Khan Sindh 41.68 11.74 48.58 64.73
128 Shangla KP 41.21 21.03 54.05 48.55
129 Batagram KP 40.86 21.25 65.40 35.92
130 Tor Ghar KP 40.33 13.60 70.63 36.75
131 Tharparkar Sindh 39.66 19.44 58.13 41.40
132 Harnai Balochistan 39.14 15.74 80.23 21.46
133 Ghotki Sindh 38.91 28.75 45.03 42.95
134 Chaghi Balochistan 36.82 12.85 54.58 43.03
135 Jacobabad Sindh 36.22 28.15 29.55 50.97
29Education Score
Rank District/ Agency Province/Region
Education Score Enrolment Score Learning
ScoreGender Parity
Score
136 Kohistan KP 35.93 7.87 64.33 35.60
137 FR DI Khan FATA 35.90 25.00 78.77 3.95
138 FR Lakki Marwat FATA 35.85 28.44 50.10 29.00
139 Killa Abdullah Balochistan 31.38 12.41 36.93 44.82
140 Kohlu Balochistan 28.22 17.50 56.20 10.96
141 Killa Saifullah Balochistan 28.09 20.57 56.43 7.28
142 Sherani Balochistan 27.83 14.72 68.78 0.00
143 Awaran Balochistan 27.74 20.44 48.38 14.40
144 Washuk Balochistan 26.27 22.93 40.65 15.23
- FR Kohat FATA - - - -
- FR Tank FATA - - - -
- Kharmang GB - - - -
- Nagar GB - - - -
- North Waziristan Agency FATA - - - -
- Shigar GB - - - -
- South Waziristan Agency FATA - - - -
Note:”-” data not available/not ranked
Highlights of the middle school education rankings
n AJK dominates with eight districts in the top ten mainly because of higher learning scores and a better gender parity than rest of the regions.
n Bhimber (AJK) remains at the top of the rankings second year in a row.
n Rawalpindi drops from seventh rank to 41st, while Sudhnutti jumps up 15 ranks to the second rank this year.
n The highest ranked districts from Balochistan, FATA, GB, KP, Punjab and Sindh are Panjgur (4th), Kurram Agency (34th), Hunza Nagar (8th), Swabi (16th), Faisalabad (12th) and Karachi (15th) respectively.
n The lowest ranked district is Washuk with an Education Score of 26.27.
n Only nine districts were able to score an Education Score of more than 80 (seven of these nine districts are from AJK).
n This is the only index where any district from Balochistan province is ranked amongst top ten.

30 Pakistan District Education Rankings 2016
School Infrastructure Score The provincial rankings based on School Infrastructure Score have not changed from last year, although there has been a slight variation in the scores. School Infrastructure Scores given in Table 9 show that five of the eight regions’ scores are less than 50. The Punjab, ICT and KP continue to perform better than the national average.
Table 9: Provincial and national School Infrastructure Scores (primary school)
RankChange
Province/Region
School Infrastructure
Scores
Availability Building Condition
SatisfactoryElectricity Water Toilet Boundary Wall
2016 2015 2016
1 1 ↔ Punjab 89.42 81.41 97.24 94.81 91.60 82.04
2 2 ↔ ICT 86.60 98.43 92.67 95.29 96.86 49.74
3 3 ↔ KP 71.10 53.14 63.19 77.38 76.11 85.69
- - - Pakistan 60.17 50.74 62.96 64.64 67.29 55.23
4 4 ↔ Sindh 43.57 34.14 46.97 51.38 56.36 28.99
5 5 ↔ GB 42.53 43.91 52.45 35.88 56.09 24.30
6 6 ↔ FATA 41.73 44.74 40.95 34.90 59.41 28.64
7 7 ↔ Balochistan 22.89 21.29 31.97 14.81 28.90 17.47
8 8 ↔ AJK 22.33 10.92 21.37 27.39 20.87 31.07
Note: “-” not ranked
Overall, the national infrastructure score is 60.17, down from 62.22 last year. With an additional increase of 2.53 points the Punjab managed to solidify its position at the top of the rankings. The biggest difference was seen in Balochistan where the score reduced by almost 10 points (Figure 2), mainly because of a massive decrease in electricity availability (down from 69 percent last year to 21 percent). It would behove the Balochistan government to explore the source of such a large decrease – though it is likely explained by the collection of better data, than a qualitative change in the situation on the ground.
Figure 2: Change in School Infrastructure Scores (compared to 2015)
Punjab KP
Pakistan Sindh GB
FATA
AJKBalochistan
ICT
2.53
-1.06
-9.74
-2.85
0.68
-3.62
-2.05
2.65
0.00

31School Infrastructure Score
The most improved region compared to last year is FATA (up by 2.65 points). However, it wasn’t enough to increase its position - it remains at the 6th rank.
School perimeter security has been a major issue in the public discourse since the December 16, 2014 terrorist attack at the APS School in Peshawar – and we may have anticipated a quantum improvement in the availability of school boundary walls across the country. However, only two of the eight regions (Punjab and Islamabad) provide suitable boundary walls to more than 90 percent of their schools. KP has modestly improved the quantum of school infrastructure while Sindh, GB and AJK continue to witness a deterioration of their government school infrastructure. Sindh’s principal struggle has been with the availability of electricity whereas the effects of the 2005 earthquake continue to plague school building conditions in AJK. Table 10 presents the district School Infrastructure rankings. Vehari tops the rankings this year, going up by two places.
Table 10: District School Infrastructure Score (primary school)
Rank District/ Agency Province/Region
School Infrastructure
Score
Availability Building Condition
SatisfactoryElectricity Water Toilet Boundary Wall
1 Vehari Punjab 94.85 93.28 99.33 97.89 98.08 85.65
2 Faisalabad Punjab 94.59 95.82 99.63 98.51 94.11 84.86
3 Gujrat Punjab 94.46 94.01 98.88 97.06 97.26 85.10
4 Chakwal Punjab 94.23 87.48 97.07 97.60 96.01 93.01
5 Lahore Punjab 94.21 98.05 99.10 96.55 98.65 78.71
6 Chiniot Punjab 93.92 93.63 99.81 96.82 95.88 83.46
7 Jhelum Punjab 93.89 92.69 97.26 97.81 97.07 84.62
8 Khanewal Punjab 93.85 90.79 98.64 97.70 98.37 83.74
9 Kasur Punjab 93.36 91.91 98.99 96.51 94.58 84.83
10 Toba Tek Singh Punjab 93.25 94.17 99.72 98.19 88.33 85.83
11 Pakpattan Punjab 93.09 91.29 97.30 98.35 95.95 82.58
12 Sahiwal Punjab 92.74 98.18 99.72 97.91 87.29 80.59
13 Mandi Bahuddin Punjab 92.72 92.23 99.47 96.11 93.64 82.14
14 Multan Punjab 92.58 88.58 99.11 95.37 96.85 82.99
15 Sialkot Punjab 92.38 88.91 97.70 95.81 96.08 83.39
16 Okara Punjab 92.07 86.27 98.27 97.18 91.45 87.18
17 Attock Punjab 92.02 86.74 95.31 96.13 95.19 86.74
18 Muzaffargarh Punjab 91.96 87.09 98.90 95.93 95.70 82.18
19 Lodhran Punjab 91.77 85.71 97.42 96.73 99.31 79.69
20 Gujranwala Punjab 91.22 85.89 98.62 95.61 94.32 81.66
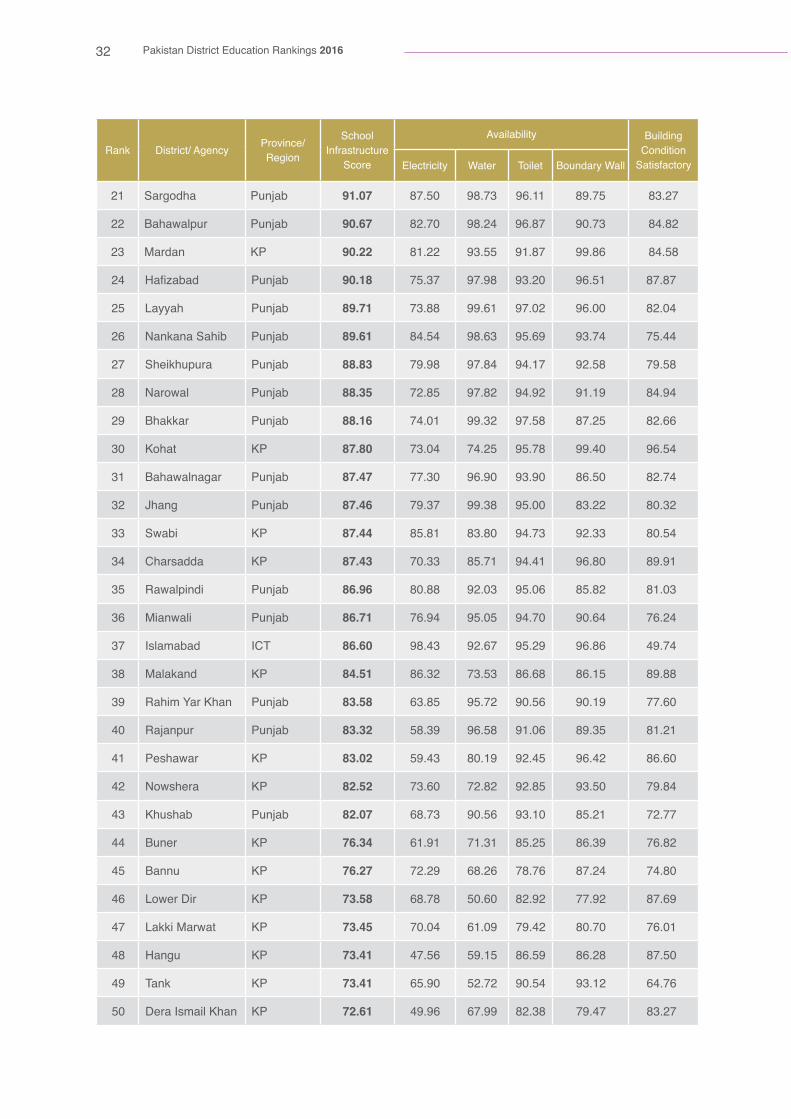
32 Pakistan District Education Rankings 2016
Rank District/ Agency Province/Region
School Infrastructure
Score
Availability Building Condition
SatisfactoryElectricity Water Toilet Boundary Wall
21 Sargodha Punjab 91.07 87.50 98.73 96.11 89.75 83.27
22 Bahawalpur Punjab 90.67 82.70 98.24 96.87 90.73 84.82
23 Mardan KP 90.22 81.22 93.55 91.87 99.86 84.58
24 Hafizabad Punjab 90.18 75.37 97.98 93.20 96.51 87.87
25 Layyah Punjab 89.71 73.88 99.61 97.02 96.00 82.04
26 Nankana Sahib Punjab 89.61 84.54 98.63 95.69 93.74 75.44
27 Sheikhupura Punjab 88.83 79.98 97.84 94.17 92.58 79.58
28 Narowal Punjab 88.35 72.85 97.82 94.92 91.19 84.94
29 Bhakkar Punjab 88.16 74.01 99.32 97.58 87.25 82.66
30 Kohat KP 87.80 73.04 74.25 95.78 99.40 96.54
31 Bahawalnagar Punjab 87.47 77.30 96.90 93.90 86.50 82.74
32 Jhang Punjab 87.46 79.37 99.38 95.00 83.22 80.32
33 Swabi KP 87.44 85.81 83.80 94.73 92.33 80.54
34 Charsadda KP 87.43 70.33 85.71 94.41 96.80 89.91
35 Rawalpindi Punjab 86.96 80.88 92.03 95.06 85.82 81.03
36 Mianwali Punjab 86.71 76.94 95.05 94.70 90.64 76.24
37 Islamabad ICT 86.60 98.43 92.67 95.29 96.86 49.74
38 Malakand KP 84.51 86.32 73.53 86.68 86.15 89.88
39 Rahim Yar Khan Punjab 83.58 63.85 95.72 90.56 90.19 77.60
40 Rajanpur Punjab 83.32 58.39 96.58 91.06 89.35 81.21
41 Peshawar KP 83.02 59.43 80.19 92.45 96.42 86.60
42 Nowshera KP 82.52 73.60 72.82 92.85 93.50 79.84
43 Khushab Punjab 82.07 68.73 90.56 93.10 85.21 72.77
44 Buner KP 76.34 61.91 71.31 85.25 86.39 76.82
45 Bannu KP 76.27 72.29 68.26 78.76 87.24 74.80
46 Lower Dir KP 73.58 68.78 50.60 82.92 77.92 87.69
47 Lakki Marwat KP 73.45 70.04 61.09 79.42 80.70 76.01
48 Hangu KP 73.41 47.56 59.15 86.59 86.28 87.50
49 Tank KP 73.41 65.90 52.72 90.54 93.12 64.76
50 Dera Ismail Khan KP 72.61 49.96 67.99 82.38 79.47 83.27

33School Infrastructure Score
Rank District/ Agency Province/Region
School Infrastructure
Score
Availability Building Condition
SatisfactoryElectricity Water Toilet Boundary Wall
51 Swat KP 70.67 56.69 61.23 76.74 67.01 91.66
52 Larkana Sindh 69.98 50.10 78.97 76.65 89.44 54.75
53 Dera Ghazi Khan Punjab 68.84 41.84 84.51 74.26 72.40 71.19
54 Haripur KP 68.83 58.72 61.20 78.02 73.37 72.86
55 Chitral KP 65.88 33.84 69.97 67.38 62.20 96.04
56 Karak KP 64.94 42.99 49.16 69.24 80.69 82.63
57 Karachi Sindh 64.84 67.61 58.38 70.58 87.01 40.65
58 Hyderabad Sindh 64.72 68.86 57.89 78.46 80.11 38.27
59 Hunza Nagar GB 62.55 60.98 73.17 75.61 85.37 17.65
60 Ghizer GB 62.37 72.88 76.27 86.44 61.02 15.25
61 Matiari Sindh 62.10 63.24 61.73 74.33 79.11 32.08
62 Abbottabad KP 61.00 29.80 54.25 66.78 61.04 93.14
63 Mansehra KP 60.26 34.63 51.38 60.40 57.27 97.59
64 Upper Dir KP 59.85 25.28 38.79 80.55 70.38 84.26
65 Shaheed Benazirabad Sindh 58.68 62.23 69.13 57.45 66.06 38.52
66 Gilgit GB 58.44 63.64 57.14 80.52 76.62 14.29
67 FR Peshawar FATA 57.66 59.33 66.00 57.33 82.00 23.65
68 Naushehro Feroze Sindh 56.94 54.39 84.31 56.71 56.52 32.76
69 Sukkur Sindh 56.22 54.18 72.09 63.36 66.09 25.36
70 Tando Allah Yar Sindh 55.39 56.20 50.54 62.53 77.36 30.32
71 Shangla KP 54.69 22.39 37.65 67.99 58.87 86.57
72 Khairpur Sindh 54.37 54.60 77.23 63.73 55.46 20.82
73 Batagram KP 52.55 13.46 40.11 63.46 47.94 97.80
74 FR Tank FATA 49.54 43.39 36.51 48.15 76.72 42.94
75 FR Bannu FATA 49.13 53.85 45.30 32.19 74.64 39.69
76 Jamshoro Sindh 48.86 46.98 32.96 59.19 81.91 23.28
77 Shikarpur Sindh 48.30 38.36 60.70 56.27 71.27 14.92
78 Dadu Sindh 47.56 45.42 42.17 52.03 65.46 32.71
79 Diamir GB 44.64 50.00 70.87 12.14 44.66 45.54
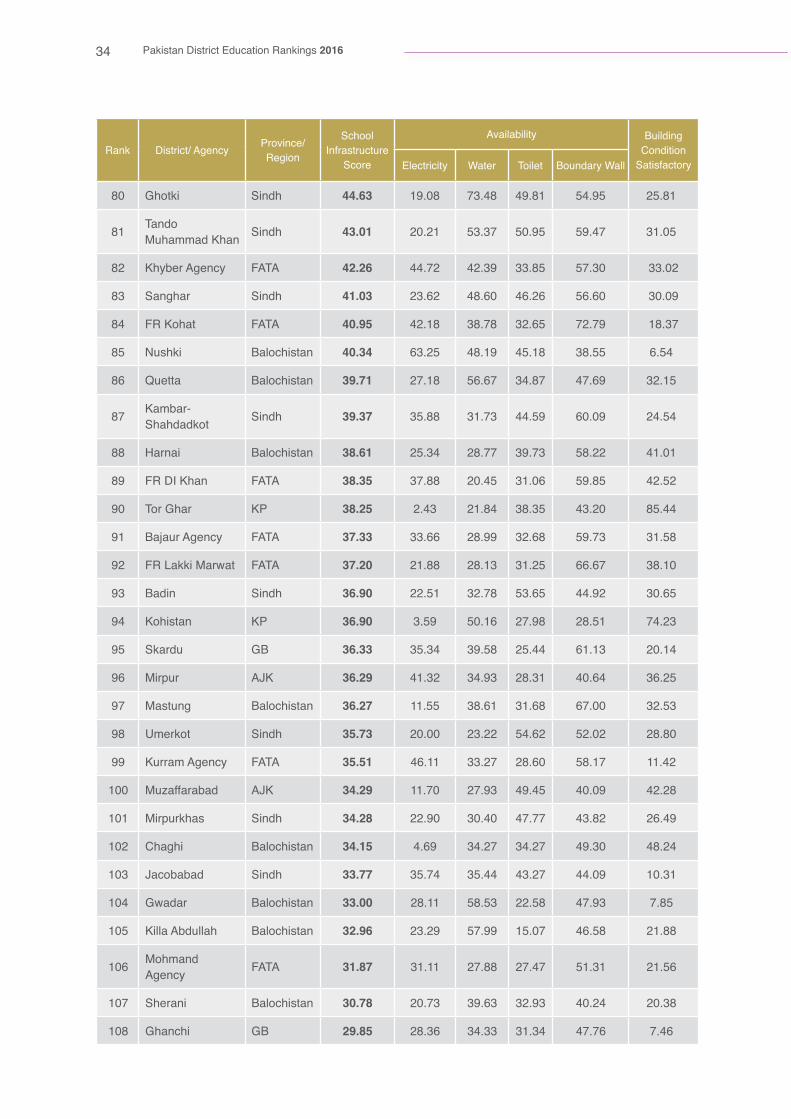
34 Pakistan District Education Rankings 2016
Rank District/ Agency Province/Region
School Infrastructure
Score
Availability Building Condition
SatisfactoryElectricity Water Toilet Boundary Wall
80 Ghotki Sindh 44.63 19.08 73.48 49.81 54.95 25.81
81 Tando Muhammad Khan Sindh 43.01 20.21 53.37 50.95 59.47 31.05
82 Khyber Agency FATA 42.26 44.72 42.39 33.85 57.30 33.02
83 Sanghar Sindh 41.03 23.62 48.60 46.26 56.60 30.09
84 FR Kohat FATA 40.95 42.18 38.78 32.65 72.79 18.37
85 Nushki Balochistan 40.34 63.25 48.19 45.18 38.55 6.54
86 Quetta Balochistan 39.71 27.18 56.67 34.87 47.69 32.15
87 Kambar-Shahdadkot Sindh 39.37 35.88 31.73 44.59 60.09 24.54
88 Harnai Balochistan 38.61 25.34 28.77 39.73 58.22 41.01
89 FR DI Khan FATA 38.35 37.88 20.45 31.06 59.85 42.52
90 Tor Ghar KP 38.25 2.43 21.84 38.35 43.20 85.44
91 Bajaur Agency FATA 37.33 33.66 28.99 32.68 59.73 31.58
92 FR Lakki Marwat FATA 37.20 21.88 28.13 31.25 66.67 38.10
93 Badin Sindh 36.90 22.51 32.78 53.65 44.92 30.65
94 Kohistan KP 36.90 3.59 50.16 27.98 28.51 74.23
95 Skardu GB 36.33 35.34 39.58 25.44 61.13 20.14
96 Mirpur AJK 36.29 41.32 34.93 28.31 40.64 36.25
97 Mastung Balochistan 36.27 11.55 38.61 31.68 67.00 32.53
98 Umerkot Sindh 35.73 20.00 23.22 54.62 52.02 28.80
99 Kurram Agency FATA 35.51 46.11 33.27 28.60 58.17 11.42
100 Muzaffarabad AJK 34.29 11.70 27.93 49.45 40.09 42.28
101 Mirpurkhas Sindh 34.28 22.90 30.40 47.77 43.82 26.49
102 Chaghi Balochistan 34.15 4.69 34.27 34.27 49.30 48.24
103 Jacobabad Sindh 33.77 35.74 35.44 43.27 44.09 10.31
104 Gwadar Balochistan 33.00 28.11 58.53 22.58 47.93 7.85
105 Killa Abdullah Balochistan 32.96 23.29 57.99 15.07 46.58 21.88
106 Mohmand Agency FATA 31.87 31.11 27.88 27.47 51.31 21.56
107 Sherani Balochistan 30.78 20.73 39.63 32.93 40.24 20.38
108 Ghanchi GB 29.85 28.36 34.33 31.34 47.76 7.46

35School Infrastructure Score
Rank District/ Agency Province/Region
School Infrastructure
Score
Availability Building Condition
SatisfactoryElectricity Water Toilet Boundary Wall
109 South Waziristan Agency FATA 29.59 34.44 26.35 33.81 44.60 8.76
110 Kalat Balochistan 28.35 22.31 36.09 23.81 48.87 10.69
111 Bagh AJK 28.32 7.78 28.53 41.79 26.51 36.99
112 Loralai Balochistan 28.09 37.54 40.34 13.24 29.13 20.20
113 Astor GB 26.25 17.19 28.13 37.50 31.25 17.19
114 Tharparkar Sindh 26.07 3.58 14.90 33.02 37.40 41.46
115 Pishin Balochistan 26.07 20.07 43.53 19.35 32.77 14.63
116 Kharan Balochistan 25.81 58.47 34.97 7.65 21.86 6.11
117 Hattian AJK 25.62 3.58 16.49 37.99 32.97 37.05
118 Lasbela Balochistan 25.43 16.22 32.43 28.96 34.17 15.37
119 Kashmore-Kandhkot Sindh 25.14 10.12 48.46 24.48 34.24 8.40
120 Jaffarabad Balochistan 24.66 35.01 27.57 1.61 24.14 34.95
121 Bhimber AJK 24.64 19.08 31.40 16.67 22.46 33.57
122 Kohlu Balochistan 24.62 39.85 25.50 1.24 19.80 36.72
123 Orakzai Agency FATA 23.62 23.95 22.79 12.79 37.44 21.13
124 Neelum AJK 21.04 3.23 27.65 27.19 12.90 34.25
125 Khuzdar Balochistan 20.71 13.00 30.59 19.49 28.21 12.25
126 Barkhan Balochistan 19.99 8.88 17.05 0.89 33.57 39.53
127 Sujawal Sindh 19.91 7.12 12.78 24.12 27.71 27.83
128 Zhob Balochistan 19.83 18.24 27.70 7.77 28.04 17.41
129 Thatta Sindh 19.77 1.83 5.91 35.16 45.92 10.06
130 Ziarat Balochistan 19.31 3.20 17.35 15.53 37.90 22.58
131 Nasirabad Balochistan 18.77 37.61 13.72 9.51 18.36 14.67
132 Washuk Balochistan 18.69 23.23 31.61 1.94 16.13 20.53
133 Sibi Balochistan 18.45 29.61 29.13 23.79 6.80 2.94
134 Musakhail Balochistan 18.43 9.85 31.82 7.20 35.61 7.66
135 Sohbatpur Balochistan 16.55 19.61 26.61 14.29 16.25 5.99
136 Kech Balochistan 16.13 16.34 38.58 14.17 6.50 5.07
137 Killa Saifullah Balochistan 15.93 17.56 26.43 7.76 18.11 9.77
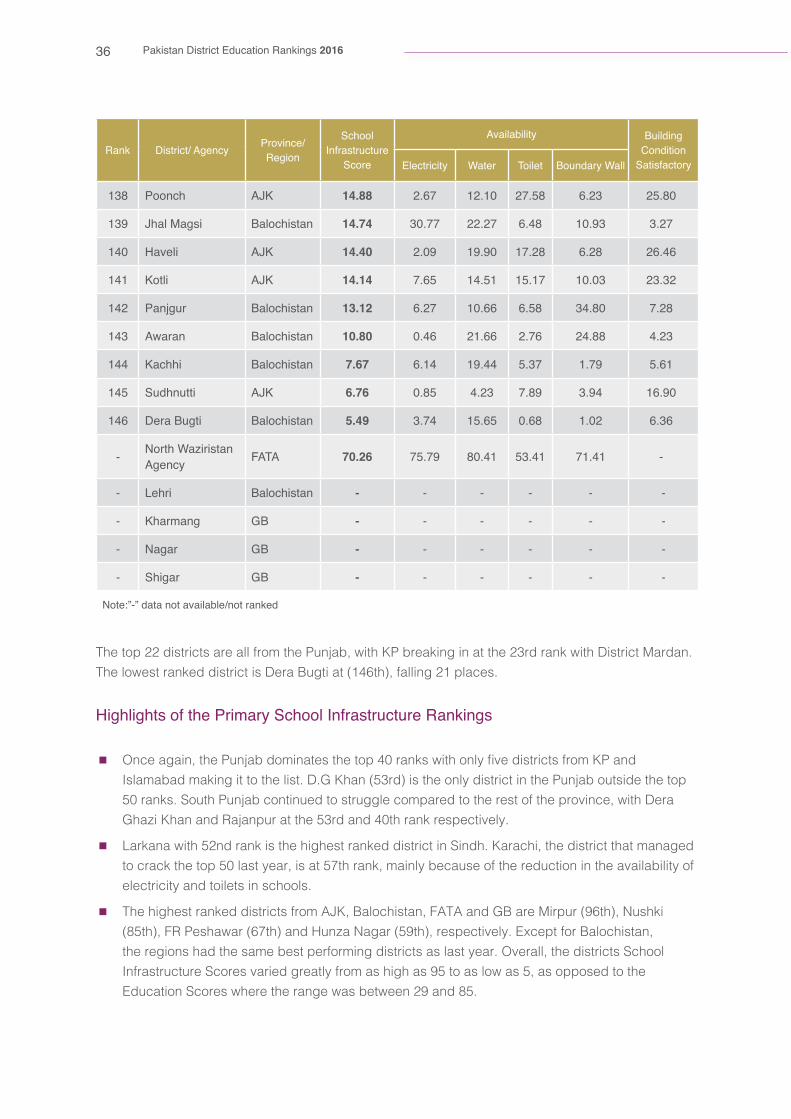
36 Pakistan District Education Rankings 2016
Rank District/ Agency Province/Region
School Infrastructure
Score
Availability Building Condition
SatisfactoryElectricity Water Toilet Boundary Wall
138 Poonch AJK 14.88 2.67 12.10 27.58 6.23 25.80
139 Jhal Magsi Balochistan 14.74 30.77 22.27 6.48 10.93 3.27
140 Haveli AJK 14.40 2.09 19.90 17.28 6.28 26.46
141 Kotli AJK 14.14 7.65 14.51 15.17 10.03 23.32
142 Panjgur Balochistan 13.12 6.27 10.66 6.58 34.80 7.28
143 Awaran Balochistan 10.80 0.46 21.66 2.76 24.88 4.23
144 Kachhi Balochistan 7.67 6.14 19.44 5.37 1.79 5.61
145 Sudhnutti AJK 6.76 0.85 4.23 7.89 3.94 16.90
146 Dera Bugti Balochistan 5.49 3.74 15.65 0.68 1.02 6.36
- North Waziristan Agency FATA 70.26 75.79 80.41 53.41 71.41 -
- Lehri Balochistan - - - - - -
- Kharmang GB - - - - - -
- Nagar GB - - - - - -
- Shigar GB - - - - - -
Note:”-” data not available/not ranked
The top 22 districts are all from the Punjab, with KP breaking in at the 23rd rank with District Mardan. The lowest ranked district is Dera Bugti at (146th), falling 21 places.
Highlights of the Primary School Infrastructure Rankings
n Once again, the Punjab dominates the top 40 ranks with only five districts from KP and Islamabad making it to the list. D.G Khan (53rd) is the only district in the Punjab outside the top 50 ranks. South Punjab continued to struggle compared to the rest of the province, with Dera Ghazi Khan and Rajanpur at the 53rd and 40th rank respectively.
n Larkana with 52nd rank is the highest ranked district in Sindh. Karachi, the district that managed to crack the top 50 last year, is at 57th rank, mainly because of the reduction in the availability of electricity and toilets in schools.
n The highest ranked districts from AJK, Balochistan, FATA and GB are Mirpur (96th), Nushki (85th), FR Peshawar (67th) and Hunza Nagar (59th), respectively. Except for Balochistan, the regions had the same best performing districts as last year. Overall, the districts School Infrastructure Scores varied greatly from as high as 95 to as low as 5, as opposed to the Education Scores where the range was between 29 and 85.
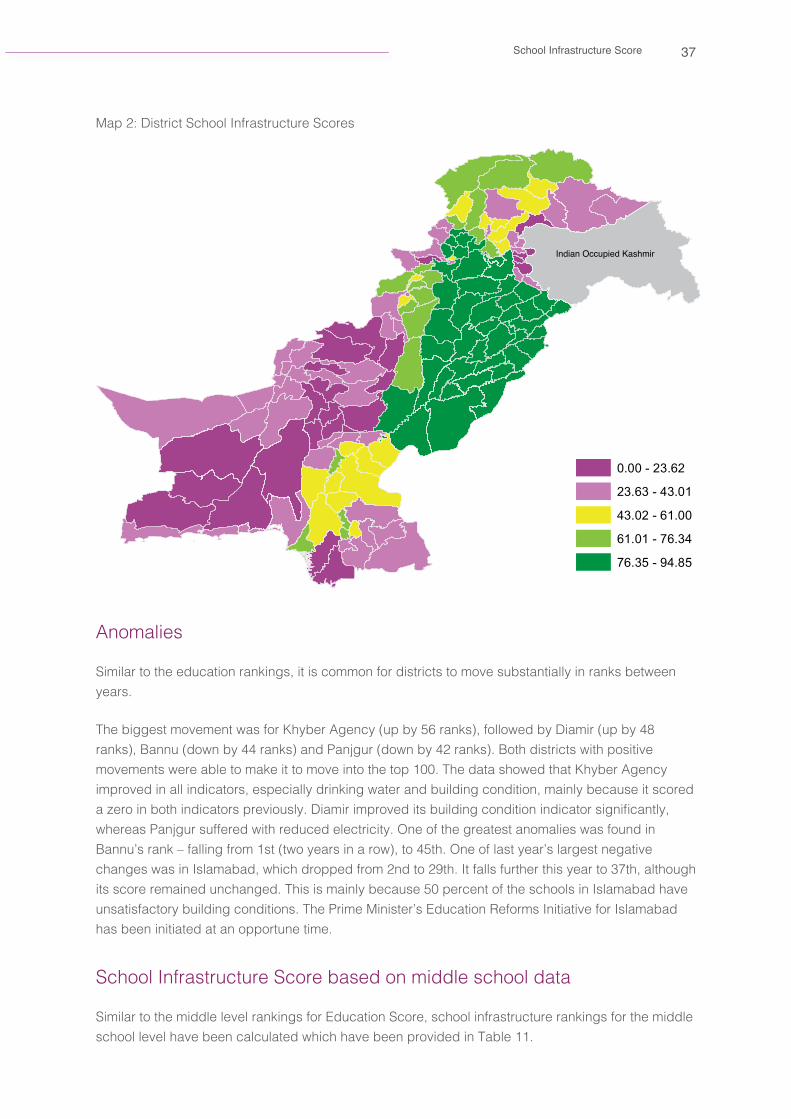
37School Infrastructure Score
Map 2: District School Infrastructure Scores
Indian Occupied Kashmir
0.00 - 23.62
23.63 - 43.01
43.02 - 61.00
61.01 - 76.34
76.35 - 94.85
Anomalies
Similar to the education rankings, it is common for districts to move substantially in ranks between years.
The biggest movement was for Khyber Agency (up by 56 ranks), followed by Diamir (up by 48 ranks), Bannu (down by 44 ranks) and Panjgur (down by 42 ranks). Both districts with positive movements were able to make it to move into the top 100. The data showed that Khyber Agency improved in all indicators, especially drinking water and building condition, mainly because it scored a zero in both indicators previously. Diamir improved its building condition indicator significantly, whereas Panjgur suffered with reduced electricity. One of the greatest anomalies was found in Bannu’s rank – falling from 1st (two years in a row), to 45th. One of last year’s largest negative changes was in Islamabad, which dropped from 2nd to 29th. It falls further this year to 37th, although its score remained unchanged. This is mainly because 50 percent of the schools in Islamabad have unsatisfactory building conditions. The Prime Minister’s Education Reforms Initiative for Islamabad has been initiated at an opportune time.
School Infrastructure Score based on middle school data
Similar to the middle level rankings for Education Score, school infrastructure rankings for the middle school level have been calculated which have been provided in Table 11.
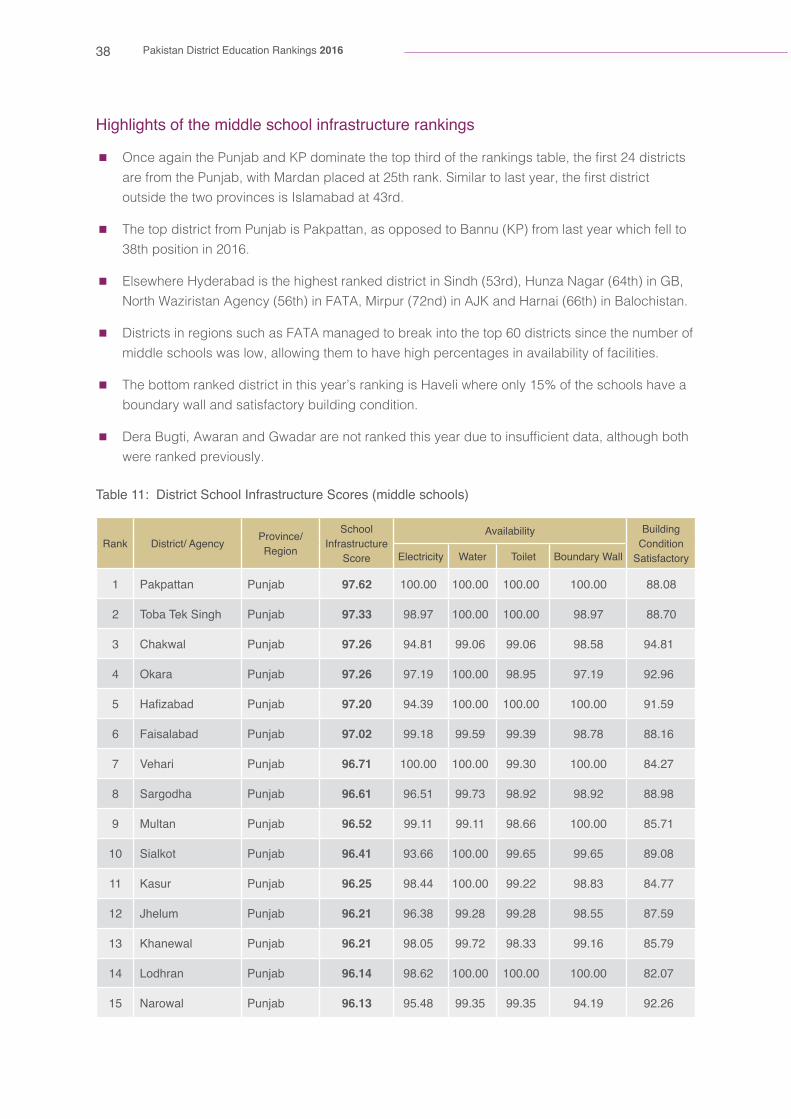
38 Pakistan District Education Rankings 2016
Highlights of the middle school infrastructure rankings
n Once again the Punjab and KP dominate the top third of the rankings table, the first 24 districts are from the Punjab, with Mardan placed at 25th rank. Similar to last year, the first district outside the two provinces is Islamabad at 43rd.
n The top district from Punjab is Pakpattan, as opposed to Bannu (KP) from last year which fell to 38th position in 2016.
n Elsewhere Hyderabad is the highest ranked district in Sindh (53rd), Hunza Nagar (64th) in GB, North Waziristan Agency (56th) in FATA, Mirpur (72nd) in AJK and Harnai (66th) in Balochistan.
n Districts in regions such as FATA managed to break into the top 60 districts since the number of middle schools was low, allowing them to have high percentages in availability of facilities.
n The bottom ranked district in this year’s ranking is Haveli where only 15% of the schools have a boundary wall and satisfactory building condition.
n Dera Bugti, Awaran and Gwadar are not ranked this year due to insufficient data, although both were ranked previously.
Table 11: District School Infrastructure Scores (middle schools)
Rank District/ Agency Province/Region
School Infrastructure
Score
Availability Building Condition
SatisfactoryElectricity Water Toilet Boundary Wall
1 Pakpattan Punjab 97.62 100.00 100.00 100.00 100.00 88.08
2 Toba Tek Singh Punjab 97.33 98.97 100.00 100.00 98.97 88.70
3 Chakwal Punjab 97.26 94.81 99.06 99.06 98.58 94.81
4 Okara Punjab 97.26 97.19 100.00 98.95 97.19 92.96
5 Hafizabad Punjab 97.20 94.39 100.00 100.00 100.00 91.59
6 Faisalabad Punjab 97.02 99.18 99.59 99.39 98.78 88.16
7 Vehari Punjab 96.71 100.00 100.00 99.30 100.00 84.27
8 Sargodha Punjab 96.61 96.51 99.73 98.92 98.92 88.98
9 Multan Punjab 96.52 99.11 99.11 98.66 100.00 85.71
10 Sialkot Punjab 96.41 93.66 100.00 99.65 99.65 89.08
11 Kasur Punjab 96.25 98.44 100.00 99.22 98.83 84.77
12 Jhelum Punjab 96.21 96.38 99.28 99.28 98.55 87.59
13 Khanewal Punjab 96.21 98.05 99.72 98.33 99.16 85.79
14 Lodhran Punjab 96.14 98.62 100.00 100.00 100.00 82.07
15 Narowal Punjab 96.13 95.48 99.35 99.35 94.19 92.26

39School Infrastructure Score
Rank District/ Agency Province/Region
School Infrastructure
Score
Availability Building Condition
SatisfactoryElectricity Water Toilet Boundary Wall
16 Attock Punjab 96.12 95.63 98.54 100.00 98.06 88.35
17 Gujrat Punjab 96.09 98.60 100.00 99.53 100.00 82.33
18 Gujranwala Punjab 96.03 96.03 100.00 99.34 99.67 85.10
19 Bahawalnagar Punjab 96.00 95.07 99.18 99.18 93.97 92.60
20 Bahawalpur Punjab 95.67 96.03 98.92 99.64 99.28 84.48
21 Lahore Punjab 95.60 99.08 100.00 98.17 98.62 82.11
22 Sahiwal Punjab 95.59 99.64 99.29 98.22 94.31 86.48
23 Muzaffargarh Punjab 95.07 96.80 99.09 98.17 98.63 82.65
24 Chiniot Punjab 94.94 94.25 100.00 96.55 97.70 86.21
25 Mardan KP 94.67 90.22 91.30 96.20 100.00 95.65
26 Bhakkar Punjab 94.64 92.78 100.00 98.45 98.45 83.51
27 Malakand KP 94.52 91.94 90.32 98.39 96.77 95.16
28 Rahim Yar Khan Punjab 94.35 93.87 99.73 99.47 99.73 78.93
29 Mandi Bahuddin Punjab 94.29 97.96 100.00 97.28 98.64 77.55
30 Nankana Sahib Punjab 94.27 97.20 100.00 99.30 95.80 79.02
31 Charsadda KP 94.10 86.67 95.24 100.00 100.00 88.57
32 Jhang Punjab 94.04 96.28 100.00 97.87 89.89 86.17
33 Sheikhupura Punjab 93.69 91.26 100.00 99.03 99.03 79.13
34 Layyah Punjab 93.42 91.25 100.00 98.75 99.58 77.50
35 Mianwali Punjab 93.29 94.12 98.82 98.24 94.71 80.59
36 Khushab Punjab 91.88 91.30 98.55 98.55 99.28 71.74
37 Swabi KP 91.74 88.43 88.43 94.21 96.69 90.91
38 Bannu KP 91.16 84.78 84.78 97.83 98.55 89.86
39 Rawalpindi Punjab 90.91 94.48 96.63 98.16 88.04 77.23
40 Rajanpur Punjab 90.44 84.44 98.89 96.67 94.44 77.78
41 Kohat KP 89.43 81.61 80.46 97.70 98.85 88.51
42 Peshawar KP 88.65 80.65 85.16 87.10 98.06 92.26
43 Islamabad ICT 86.33 100.00 91.67 98.33 98.33 43.33
44 Chitral KP 86.28 73.26 86.05 96.51 81.40 94.19

40 Pakistan District Education Rankings 2016
Rank District/ Agency Province/Region
School Infrastructure
Score
Availability Building Condition
SatisfactoryElectricity Water Toilet Boundary Wall
45 Lakki Marwat KP 84.33 78.35 74.23 94.85 87.63 86.60
46 Nowshera KP 84.26 79.79 74.47 84.04 94.68 88.30
47 Buner KP 83.33 64.10 73.08 92.31 91.03 96.15
48 Dera Ghazi Khan Punjab 83.18 65.13 93.33 91.79 92.82 72.82
49 Swat KP 82.77 78.46 78.46 85.38 77.69 93.85
50 Hangu KP 81.71 57.14 71.43 91.43 94.29 94.29
51 Lower Dir KP 81.61 75.17 67.79 92.62 81.21 91.28
52 Tank KP 80.45 77.27 59.09 100.00 81.82 84.09
53 Hyderabad Sindh 79.71 89.86 75.36 91.30 89.86 52.17
54 Haripur KP 79.24 67.42 73.48 87.88 78.03 89.39
55 Dera Ismail Khan KP 79.06 61.26 71.73 90.05 83.25 89.01
56 North Waziristan Agency FATA 78.88 76.74 86.05 67.44 91.86 72.29
57 Karak KP 78.54 68.29 62.20 84.15 91.46 86.59
58 FR Peshawar FATA 76.25 93.75 81.25 75.00 87.50 43.75
59 Karachi Sindh 76.23 80.66 74.30 86.51 94.15 45.55
60 Abbottabad KP 74.94 60.00 68.24 90.00 66.47 90.00
61 Larkana Sindh 74.85 57.58 86.36 83.33 95.45 51.52
62 Shangla KP 74.08 52.11 64.79 81.69 81.69 90.14
63 Shaheed Benazirabad Sindh 74.08 72.80 82.40 84.00 87.20 44.00
64 Hunza Nagar GB 73.50 81.82 87.88 96.97 84.85 16.00
65 Sukkur Sindh 71.60 80.25 82.72 86.42 82.72 25.93
66 Harnai Balochistan 68.83 36.36 54.55 90.91 90.91 71.43
67 Upper Dir KP 67.25 46.15 42.86 91.21 67.03 89.01
68 Naushehro Feroze Sindh 67.11 61.84 84.21 68.42 79.61 41.45
69 Tando Muhammad Khan Sindh 66.90 62.07 79.31 79.31 79.31 34.48
70 Khairpur Sindh 66.77 75.66 88.89 80.95 75.66 12.70
71 Gilgit GB 65.88 76.47 76.47 94.12 73.53 8.82

41School Infrastructure Score
Rank District/ Agency Province/Region
School Infrastructure
Score
Availability Building Condition
SatisfactoryElectricity Water Toilet Boundary Wall
72 Mirpur AJK 64.95 82.76 81.61 59.77 71.26 29.35
73 Ghizer GB 63.81 66.67 71.43 85.71 76.19 19.05
74 Mansehra KP 63.77 41.88 43.46 69.63 68.59 95.29
75 FR Bannu FATA 63.46 68.42 55.26 50.00 86.84 56.76
76 Nushki Balochistan 63.24 90.00 77.50 77.50 67.50 3.70
77 Matiari Sindh 62.86 61.90 57.14 80.95 85.71 28.57
78 Quetta Balochistan 62.57 52.13 77.66 59.57 86.17 37.31
79 Bajaur Agency FATA 61.91 52.08 56.25 58.33 85.42 57.45
80 Mastung Balochistan 61.58 34.78 58.70 67.39 93.48 53.57
81 Lasbela Balochistan 59.23 42.31 67.31 90.38 71.15 25.00
82 Sanghar Sindh 58.50 50.47 59.81 69.16 84.11 28.97
83 Khyber Agency FATA 58.03 63.83 65.96 51.06 72.34 36.96
84 Bhimber AJK 57.59 79.05 80.95 49.52 43.81 34.62
85 Chaghi Balochistan 56.89 20.00 60.00 80.00 80.00 44.44
86 Jaffarabad Balochistan 56.42 66.67 69.05 52.38 59.52 34.48
87 FR Tank FATA 56.37 44.00 44.00 60.00 88.00 45.83
88 Ghotki Sindh 56.30 39.13 83.70 61.96 68.48 28.26
89 Badin Sindh 56.07 47.66 43.93 70.09 71.03 47.66
90 Dadu Sindh 54.58 50.85 55.93 66.10 69.49 30.51
91 Shikarpur Sindh 54.43 39.34 63.93 72.13 85.25 11.48
92 Jamshoro Sindh 54.00 66.67 36.67 63.33 93.33 10.00
93 Diamir GB 53.64 59.09 90.91 63.64 50.00 4.55
94 Batagram KP 52.77 14.89 31.91 68.09 51.06 97.87
95 Killa Abdullah Balochistan 52.52 34.21 76.32 39.47 81.58 31.03
96 Skardu GB 52.50 66.67 57.29 60.42 60.42 17.71
97 Tando Allah Yar Sindh 52.31 57.69 44.23 65.38 73.08 21.15
98 Pishin Balochistan 52.11 38.53 66.97 61.47 64.22 29.33
99 Kambar-Shahdadkot Sindh 51.86 47.46 42.37 57.63 81.36 30.51
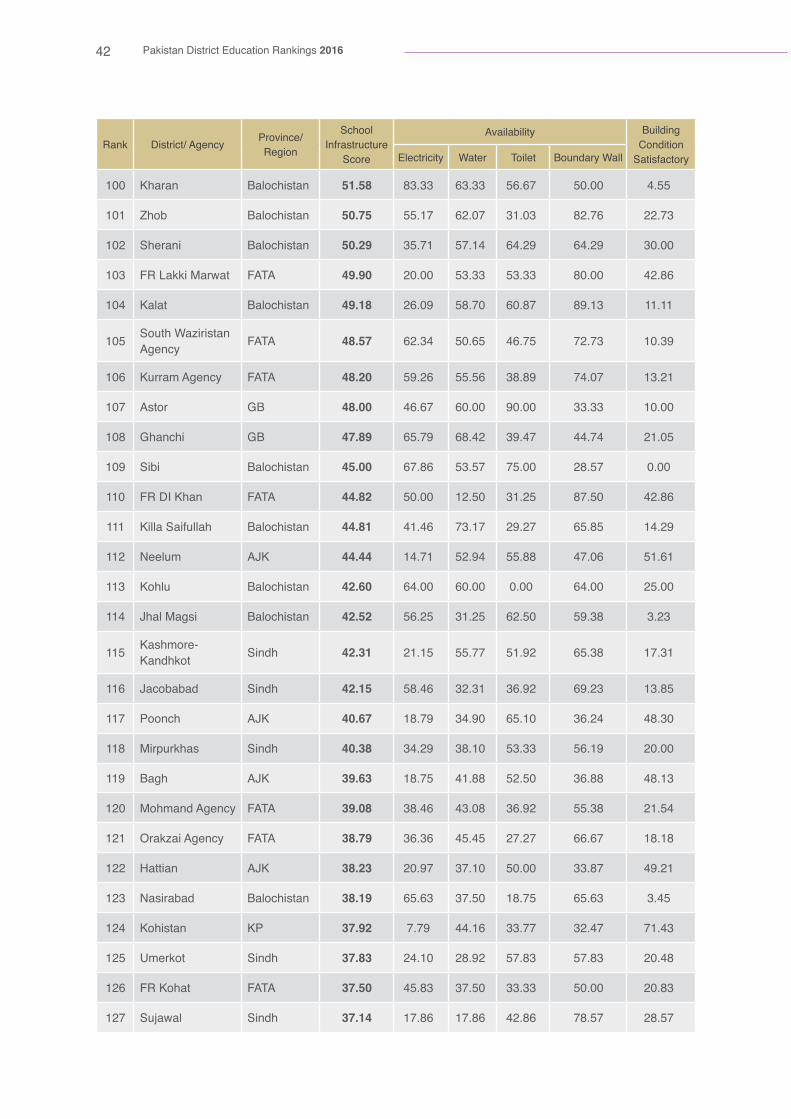
42 Pakistan District Education Rankings 2016
Rank District/ Agency Province/Region
School Infrastructure
Score
Availability Building Condition
SatisfactoryElectricity Water Toilet Boundary Wall
100 Kharan Balochistan 51.58 83.33 63.33 56.67 50.00 4.55
101 Zhob Balochistan 50.75 55.17 62.07 31.03 82.76 22.73
102 Sherani Balochistan 50.29 35.71 57.14 64.29 64.29 30.00
103 FR Lakki Marwat FATA 49.90 20.00 53.33 53.33 80.00 42.86
104 Kalat Balochistan 49.18 26.09 58.70 60.87 89.13 11.11
105 South Waziristan Agency FATA 48.57 62.34 50.65 46.75 72.73 10.39
106 Kurram Agency FATA 48.20 59.26 55.56 38.89 74.07 13.21
107 Astor GB 48.00 46.67 60.00 90.00 33.33 10.00
108 Ghanchi GB 47.89 65.79 68.42 39.47 44.74 21.05
109 Sibi Balochistan 45.00 67.86 53.57 75.00 28.57 0.00
110 FR DI Khan FATA 44.82 50.00 12.50 31.25 87.50 42.86
111 Killa Saifullah Balochistan 44.81 41.46 73.17 29.27 65.85 14.29
112 Neelum AJK 44.44 14.71 52.94 55.88 47.06 51.61
113 Kohlu Balochistan 42.60 64.00 60.00 0.00 64.00 25.00
114 Jhal Magsi Balochistan 42.52 56.25 31.25 62.50 59.38 3.23
115 Kashmore-Kandhkot Sindh 42.31 21.15 55.77 51.92 65.38 17.31
116 Jacobabad Sindh 42.15 58.46 32.31 36.92 69.23 13.85
117 Poonch AJK 40.67 18.79 34.90 65.10 36.24 48.30
118 Mirpurkhas Sindh 40.38 34.29 38.10 53.33 56.19 20.00
119 Bagh AJK 39.63 18.75 41.88 52.50 36.88 48.13
120 Mohmand Agency FATA 39.08 38.46 43.08 36.92 55.38 21.54
121 Orakzai Agency FATA 38.79 36.36 45.45 27.27 66.67 18.18
122 Hattian AJK 38.23 20.97 37.10 50.00 33.87 49.21
123 Nasirabad Balochistan 38.19 65.63 37.50 18.75 65.63 3.45
124 Kohistan KP 37.92 7.79 44.16 33.77 32.47 71.43
125 Umerkot Sindh 37.83 24.10 28.92 57.83 57.83 20.48
126 FR Kohat FATA 37.50 45.83 37.50 33.33 50.00 20.83
127 Sujawal Sindh 37.14 17.86 17.86 42.86 78.57 28.57

43School Infrastructure Score
Rank District/ Agency Province/Region
School Infrastructure
Score
Availability Building Condition
SatisfactoryElectricity Water Toilet Boundary Wall
128 Muzaffarabad AJK 36.70 19.23 32.31 50.00 45.38 36.57
129 Ziarat Balochistan 36.44 28.00 20.00 52.00 64.00 18.18
130 Tor Ghar KP 36.00 0.00 20.00 44.00 28.00 88.00
131 Loralai Balochistan 35.63 39.66 43.10 37.93 37.93 19.51
132 Kotli AJK 35.58 49.36 45.51 46.15 19.23 17.65
133 Musakhail Balochistan 35.52 9.52 33.33 23.81 80.95 30.00
134 Kech Balochistan 35.43 39.77 64.77 52.27 11.36 8.96
135 Sohbatpur Balochistan 35.19 43.75 28.13 34.38 59.38 10.34
136 Panjgur Balochistan 34.00 42.50 25.00 32.50 67.50 2.50
137 Thatta Sindh 33.75 10.42 18.75 56.25 75.00 8.33
138 Khuzdar Balochistan 32.65 32.26 48.39 50.00 25.81 6.82
139 Barkhan Balochistan 31.31 24.00 20.00 8.00 76.00 28.57
140 Tharparkar Sindh 30.37 6.17 19.75 46.09 48.97 30.86
141 Washuk Balochistan 26.89 22.22 27.78 38.89 38.89 6.67
142 Kachhi Balochistan 23.84 29.03 45.16 32.26 3.23 9.52
143 Sudhnutti AJK 23.45 27.59 26.44 41.38 5.75 16.09
144 Haveli AJK 23.41 7.32 43.90 36.59 14.63 14.63
- Awaran Balochistan 21.54 - 33.33 22.22 48.15 4.00
- Dera Bugti Balochistan 15.68 13.51 56.76 - 8.11 -
- Gwadar Balochistan 52.67 50.00 86.67 50.00 76.67 -
- Kharmang GB - - - - - -
- Nagar GB - - - - -
- Shigar GB - - - - - -
- Lehri Balochistan - - - - - -
Note:”-”data not available/not ranked

44 Pakistan District Education Rankings 2016
School Facilities Completeness ScoreThe rationale for introducing a ‘completeness’ scoring metric is to gain insights into the status of individual schools and their ability in terms of providing the bare minimum facilities that the Pakistani children deserve. Unlike School Infrastructure Score where the availability of basic facilities is measured at the district level, the School Facilities Completeness Score is calculated at the individual school level. A disadvantage of using district level averages of each infrastructure individually is that it averages out school-level variations which are a critical aspect for improving school-based, and eventually collective outcomes. This is the first year in which the school completeness score has been calculated, therefore historical trends are not available. They will be introduced in future years.
Of 154,144 schools in Pakistan, only 52 percent have all four components of essential infrastructure – boundary wall, electricity, water and toilets – whereas 11 percent of the schools do not have any of the four basic facilities available. This insight draws immediate attention to ensure essential infrastructure in all schools. Table 12 presents a regional view of schools having no essential infrastructure. While the Punjab tops the list with 93 percent schools having all four components, AJK ranks lowest with only 14 percent schools having all components.
Table 12: Provincial and national school facility completeness score
Rank Province/ RegionNumber of facilities available
All four Three Two Only one None1 Punjab 93.3 6.7 0.0 0.0 0.0
2 ICT 88.5 11.0 0.3 0.3 0.0
- Pakistan 51.6 16.2 12.0 8.9 11.3
3 KP 44.1 22.3 15.7 7.9 10.0
4 GB 27.1 25.2 17.3 12.2 18.3
5 FATA 27.0 18.1 17.2 17.4 20.2
6 Balochistan 25.6 32.6 29.6 12.2 0.0
7 Sindh 22.5 19.3 17.8 16.7 23.8
8 AJK 13.9 13.4 16.8 17.8 38.1
Note: the four infrastructure components are availability of electricity, water, toilets, boundary wall.

45School Facilities Completeness Score
Table 13: School Facilities Completeness Score at district level
Rank District/ Agency Province/Region
Number of facilities available
All four Three Two Only one None
1 Lodhran Punjab 99.52 0.48 0.00 0.00 0.00
2 Lahore Punjab 98.95 1.05 0.00 0.00 0.00
3 Vehari Punjab 98.67 1.33 0.00 0.00 0.00
4 Khanewal Punjab 98.62 1.38 0.00 0.00 0.00
5 Gujrat Punjab 97.65 2.35 0.00 0.00 0.00
6 Jhelum Punjab 97.61 2.39 0.00 0.00 0.00
7 Multan Punjab 97.60 2.40 0.00 0.00 0.00
8 Hafizabad Punjab 97.40 2.60 0.00 0.00 0.00
9 Pakpattan Punjab 97.04 2.96 0.00 0.00 0.00
10 Sialkot Punjab 97.00 3.00 0.00 0.00 0.00
11 Layyah Punjab 96.82 3.18 0.00 0.00 0.00
12 Chakwal Punjab 96.61 3.39 0.00 0.00 0.00
13 Muzaffargarh Punjab 96.21 3.79 0.00 0.00 0.00
14 Chiniot Punjab 96.10 3.90 0.00 0.00 0.00
15 Faisalabad Punjab 96.09 3.91 0.00 0.00 0.00
16 Attock Punjab 95.96 4.04 0.00 0.00 0.00
17 Gujranwala Punjab 95.90 4.10 0.00 0.00 0.00
18 Kasur Punjab 95.61 4.39 0.00 0.00 0.00
19 Mandi Bahuddin Punjab 95.55 4.45 0.00 0.00 0.00
20 Nankana Sahib Punjab 94.47 5.53 0.00 0.00 0.00
21 Sheikhupura Punjab 94.14 5.86 0.00 0.00 0.00
22 Okara Punjab 93.12 6.88 0.00 0.00 0.00
23 Sargodha Punjab 92.86 7.14 0.00 0.00 0.00
24 Bahawalpur Punjab 92.60 7.40 0.00 0.00 0.00
25 Narowal Punjab 92.37 7.63 0.00 0.00 0.00
26 Toba Tek Singh Punjab 92.21 7.79 0.00 0.00 0.00
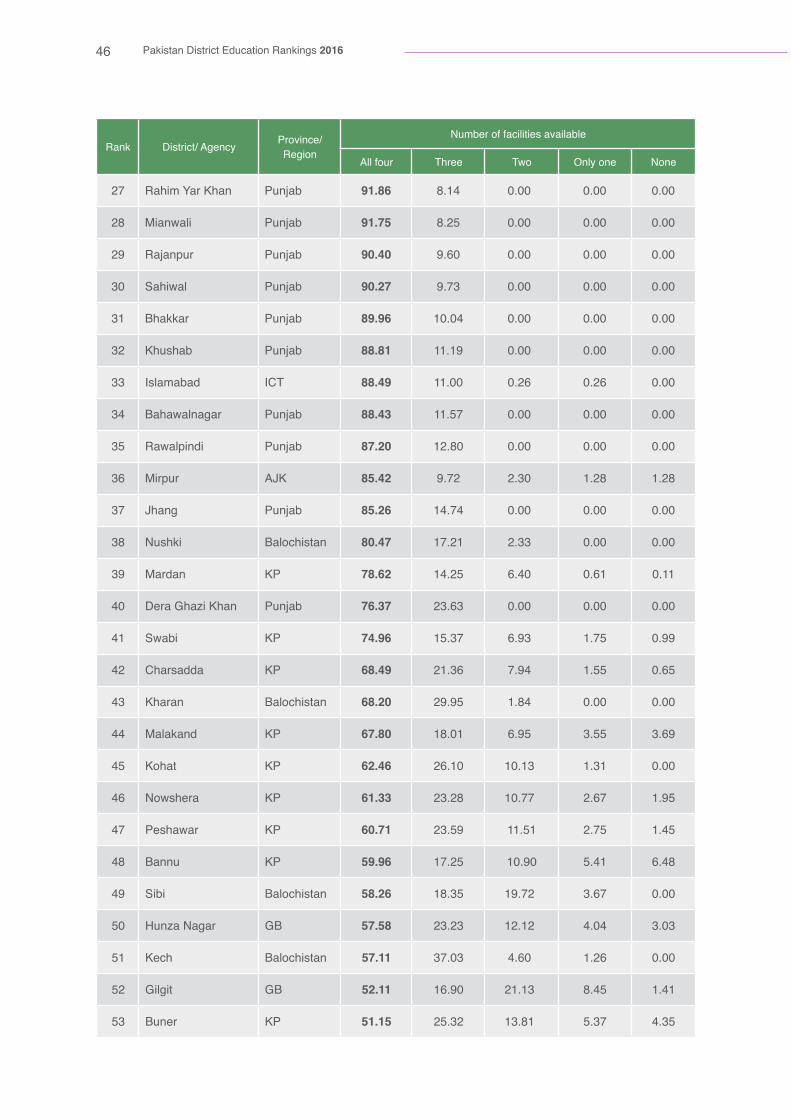
46 Pakistan District Education Rankings 2016
Rank District/ Agency Province/Region
Number of facilities available
All four Three Two Only one None
27 Rahim Yar Khan Punjab 91.86 8.14 0.00 0.00 0.00
28 Mianwali Punjab 91.75 8.25 0.00 0.00 0.00
29 Rajanpur Punjab 90.40 9.60 0.00 0.00 0.00
30 Sahiwal Punjab 90.27 9.73 0.00 0.00 0.00
31 Bhakkar Punjab 89.96 10.04 0.00 0.00 0.00
32 Khushab Punjab 88.81 11.19 0.00 0.00 0.00
33 Islamabad ICT 88.49 11.00 0.26 0.26 0.00
34 Bahawalnagar Punjab 88.43 11.57 0.00 0.00 0.00
35 Rawalpindi Punjab 87.20 12.80 0.00 0.00 0.00
36 Mirpur AJK 85.42 9.72 2.30 1.28 1.28
37 Jhang Punjab 85.26 14.74 0.00 0.00 0.00
38 Nushki Balochistan 80.47 17.21 2.33 0.00 0.00
39 Mardan KP 78.62 14.25 6.40 0.61 0.11
40 Dera Ghazi Khan Punjab 76.37 23.63 0.00 0.00 0.00
41 Swabi KP 74.96 15.37 6.93 1.75 0.99
42 Charsadda KP 68.49 21.36 7.94 1.55 0.65
43 Kharan Balochistan 68.20 29.95 1.84 0.00 0.00
44 Malakand KP 67.80 18.01 6.95 3.55 3.69
45 Kohat KP 62.46 26.10 10.13 1.31 0.00
46 Nowshera KP 61.33 23.28 10.77 2.67 1.95
47 Peshawar KP 60.71 23.59 11.51 2.75 1.45
48 Bannu KP 59.96 17.25 10.90 5.41 6.48
49 Sibi Balochistan 58.26 18.35 19.72 3.67 0.00
50 Hunza Nagar GB 57.58 23.23 12.12 4.04 3.03
51 Kech Balochistan 57.11 37.03 4.60 1.26 0.00
52 Gilgit GB 52.11 16.90 21.13 8.45 1.41
53 Buner KP 51.15 25.32 13.81 5.37 4.35

47School Facilities Completeness Score
Rank District/ Agency Province/Region
Number of facilities available
All four Three Two Only one None
54 Karachi Sindh 50.11 21.83 15.08 9.04 3.94
55 Ghizer GB 49.12 30.70 14.04 4.39 1.75
56 Haripur KP 48.26 18.79 14.74 6.64 11.58
57 Hyderabad Sindh 47.44 24.46 12.40 11.26 4.44
58 North Waziristan Agency FATA 47.12 21.96 11.94 12.15 6.82
59 Lakki Marwat KP 46.43 26.65 14.35 6.77 5.79
60 Matiari Sindh 45.46 20.19 16.41 8.10 9.83
61 Larkana Sindh 44.86 34.50 5.48 8.65 6.51
62 Gwadar Balochistan 44.58 31.73 22.09 1.61 0.00
63 Tank KP 44.06 28.67 20.75 5.83 0.70
64 Dera Ismail Khan KP 43.89 24.13 18.43 7.66 5.89
65 Swat KP 43.82 20.16 15.55 8.36 12.11
66 Quetta Balochistan 42.91 37.99 15.55 3.54 0.00
67 Khyber Agency FATA 41.73 22.43 14.52 10.11 11.21
68 Lower Dir KP 41.58 31.96 13.17 4.71 8.59
69 Shaheed Benazirabad Sindh 40.56 18.77 15.54 13.48 11.65
70 Hangu KP 40.50 25.50 23.75 5.50 4.75
71 Kachhi Balochistan 40.07 47.29 7.58 5.05 0.00
72 FR Peshawar FATA 40.00 24.44 19.44 6.67 9.44
73 Naushehro Feroze Sindh 36.49 23.16 13.42 16.38 10.55
74 Sukkur Sindh 36.05 25.74 16.31 13.03 8.87
75 Awaran Balochistan 35.94 54.38 9.22 0.46 0.00
76 Khairpur Sindh 35.49 24.71 15.20 13.44 11.16
77 Pishin Balochistan 34.47 30.29 22.81 12.42 0.00
78 South Waziristan Agency FATA 32.41 16.60 18.97 12.45 19.57
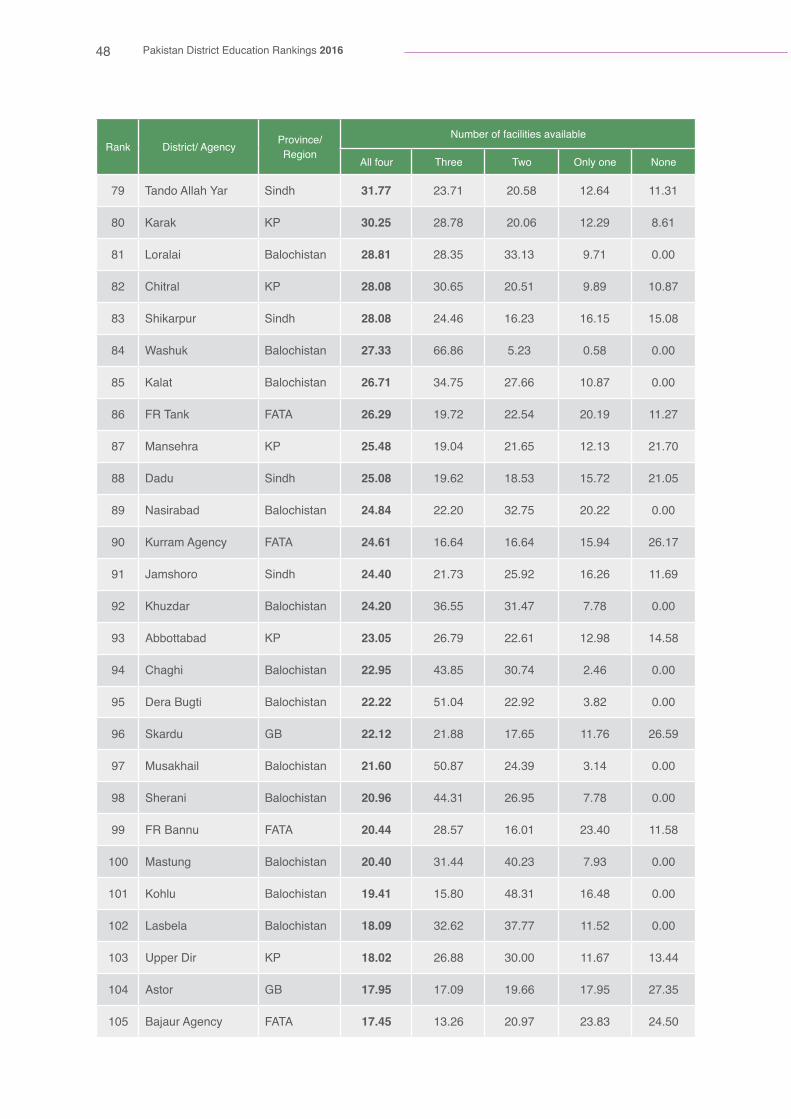
48 Pakistan District Education Rankings 2016
Rank District/ Agency Province/Region
Number of facilities available
All four Three Two Only one None
79 Tando Allah Yar Sindh 31.77 23.71 20.58 12.64 11.31
80 Karak KP 30.25 28.78 20.06 12.29 8.61
81 Loralai Balochistan 28.81 28.35 33.13 9.71 0.00
82 Chitral KP 28.08 30.65 20.51 9.89 10.87
83 Shikarpur Sindh 28.08 24.46 16.23 16.15 15.08
84 Washuk Balochistan 27.33 66.86 5.23 0.58 0.00
85 Kalat Balochistan 26.71 34.75 27.66 10.87 0.00
86 FR Tank FATA 26.29 19.72 22.54 20.19 11.27
87 Mansehra KP 25.48 19.04 21.65 12.13 21.70
88 Dadu Sindh 25.08 19.62 18.53 15.72 21.05
89 Nasirabad Balochistan 24.84 22.20 32.75 20.22 0.00
90 Kurram Agency FATA 24.61 16.64 16.64 15.94 26.17
91 Jamshoro Sindh 24.40 21.73 25.92 16.26 11.69
92 Khuzdar Balochistan 24.20 36.55 31.47 7.78 0.00
93 Abbottabad KP 23.05 26.79 22.61 12.98 14.58
94 Chaghi Balochistan 22.95 43.85 30.74 2.46 0.00
95 Dera Bugti Balochistan 22.22 51.04 22.92 3.82 0.00
96 Skardu GB 22.12 21.88 17.65 11.76 26.59
97 Musakhail Balochistan 21.60 50.87 24.39 3.14 0.00
98 Sherani Balochistan 20.96 44.31 26.95 7.78 0.00
99 FR Bannu FATA 20.44 28.57 16.01 23.40 11.58
100 Mastung Balochistan 20.40 31.44 40.23 7.93 0.00
101 Kohlu Balochistan 19.41 15.80 48.31 16.48 0.00
102 Lasbela Balochistan 18.09 32.62 37.77 11.52 0.00
103 Upper Dir KP 18.02 26.88 30.00 11.67 13.44
104 Astor GB 17.95 17.09 19.66 17.95 27.35
105 Bajaur Agency FATA 17.45 13.26 20.97 23.83 24.50

49School Facilities Completeness Score
Rank District/ Agency Province/Region
Number of facilities available
All four Three Two Only one None
106 Bagh AJK 17.06 24.73 24.95 16.20 17.06
107 Sanghar Sindh 16.93 21.48 17.77 15.72 28.10
108 Killa Abdullah Balochistan 16.70 41.97 30.41 10.92 0.00
109 Kambar-Shahdadkot Sindh 16.06 19.25 17.17 22.87 24.65
110 FR Lakki Marwat FATA 15.89 10.28 26.17 32.71 14.95
111 Ghanchi GB 15.83 26.62 21.58 15.11 20.86
112 FR DI Khan FATA 15.79 11.84 18.42 26.97 26.97
113 FR Kohat FATA 15.68 18.38 21.08 28.11 16.76
114 Mohmand Agency FATA 15.26 15.44 16.49 20.70 32.11
115 Bhimber AJK 15.25 17.38 15.43 20.21 31.74
116 Zhob Balochistan 15.24 36.89 41.77 6.10 0.00
117 Shangla KP 15.21 24.34 27.25 13.97 19.23
118 Ghotki Sindh 14.90 30.20 15.20 22.86 16.84
119 Tando Muhammad Khan Sindh 14.16 25.17 19.08 22.81 18.78
120 Mirpurkhas Sindh 13.20 14.77 20.82 16.71 34.49
121 Killa Saifullah Balochistan 13.09 23.82 36.73 26.36 0.00
122 Jaffarabad Balochistan 12.41 28.20 39.29 20.11 0.00
123 Jacobabad Sindh 12.15 19.93 18.40 19.58 29.93
124 Harnai Balochistan 12.05 39.16 37.35 11.45 0.00
125 Jhal Magsi Balochistan 10.68 27.40 39.86 22.06 0.00
126 Umerkot Sindh 10.56 13.52 25.20 22.64 28.08
127 Badin Sindh 10.32 17.14 24.18 20.18 28.18
128 Batagram KP 9.91 21.91 23.62 15.30 29.25
129 Muzaffarabad AJK 9.90 18.86 24.33 10.83 36.09
130 Diamir GB 9.21 37.24 14.23 17.57 21.76
131 Sohbatpur Balochistan 7.96 26.79 32.89 32.36 0.00
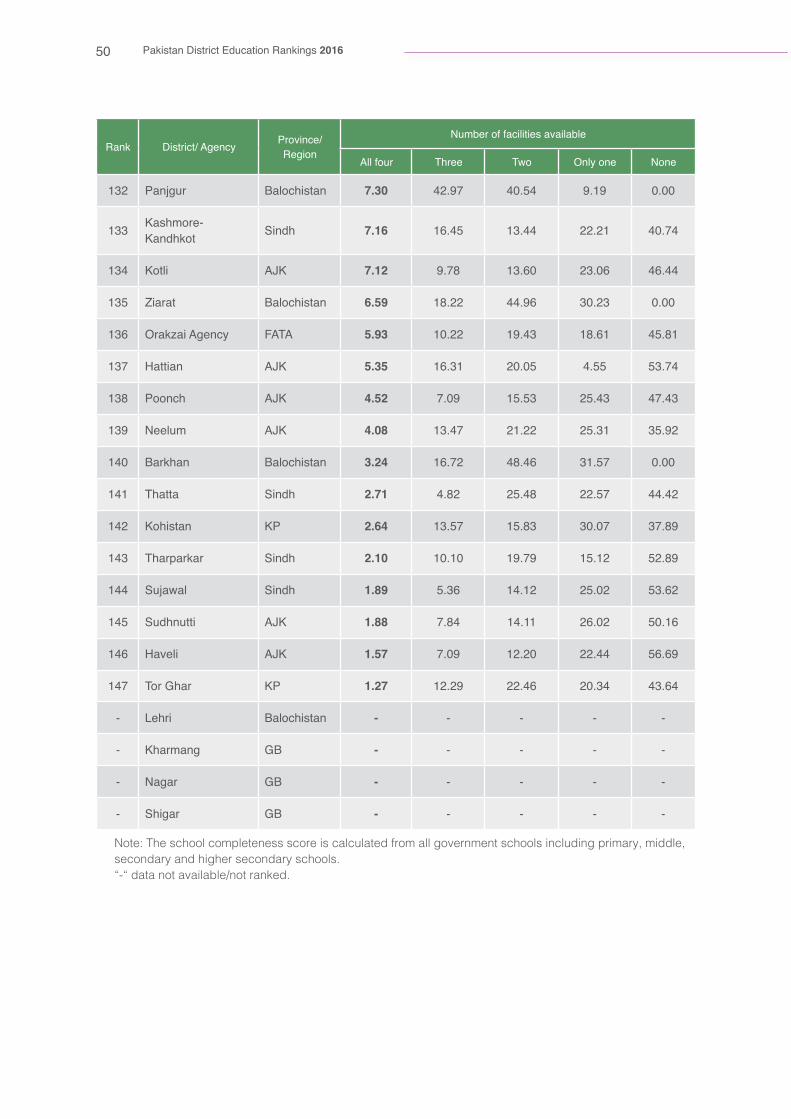
50 Pakistan District Education Rankings 2016
Rank District/ Agency Province/Region
Number of facilities available
All four Three Two Only one None
132 Panjgur Balochistan 7.30 42.97 40.54 9.19 0.00
133 Kashmore-Kandhkot Sindh 7.16 16.45 13.44 22.21 40.74
134 Kotli AJK 7.12 9.78 13.60 23.06 46.44
135 Ziarat Balochistan 6.59 18.22 44.96 30.23 0.00
136 Orakzai Agency FATA 5.93 10.22 19.43 18.61 45.81
137 Hattian AJK 5.35 16.31 20.05 4.55 53.74
138 Poonch AJK 4.52 7.09 15.53 25.43 47.43
139 Neelum AJK 4.08 13.47 21.22 25.31 35.92
140 Barkhan Balochistan 3.24 16.72 48.46 31.57 0.00
141 Thatta Sindh 2.71 4.82 25.48 22.57 44.42
142 Kohistan KP 2.64 13.57 15.83 30.07 37.89
143 Tharparkar Sindh 2.10 10.10 19.79 15.12 52.89
144 Sujawal Sindh 1.89 5.36 14.12 25.02 53.62
145 Sudhnutti AJK 1.88 7.84 14.11 26.02 50.16
146 Haveli AJK 1.57 7.09 12.20 22.44 56.69
147 Tor Ghar KP 1.27 12.29 22.46 20.34 43.64
- Lehri Balochistan - - - - -
- Kharmang GB - - - - -
- Nagar GB - - - - -
- Shigar GB - - - - -
Note: The school completeness score is calculated from all government schools including primary, middle, secondary and higher secondary schools.“-“ data not available/not ranked.
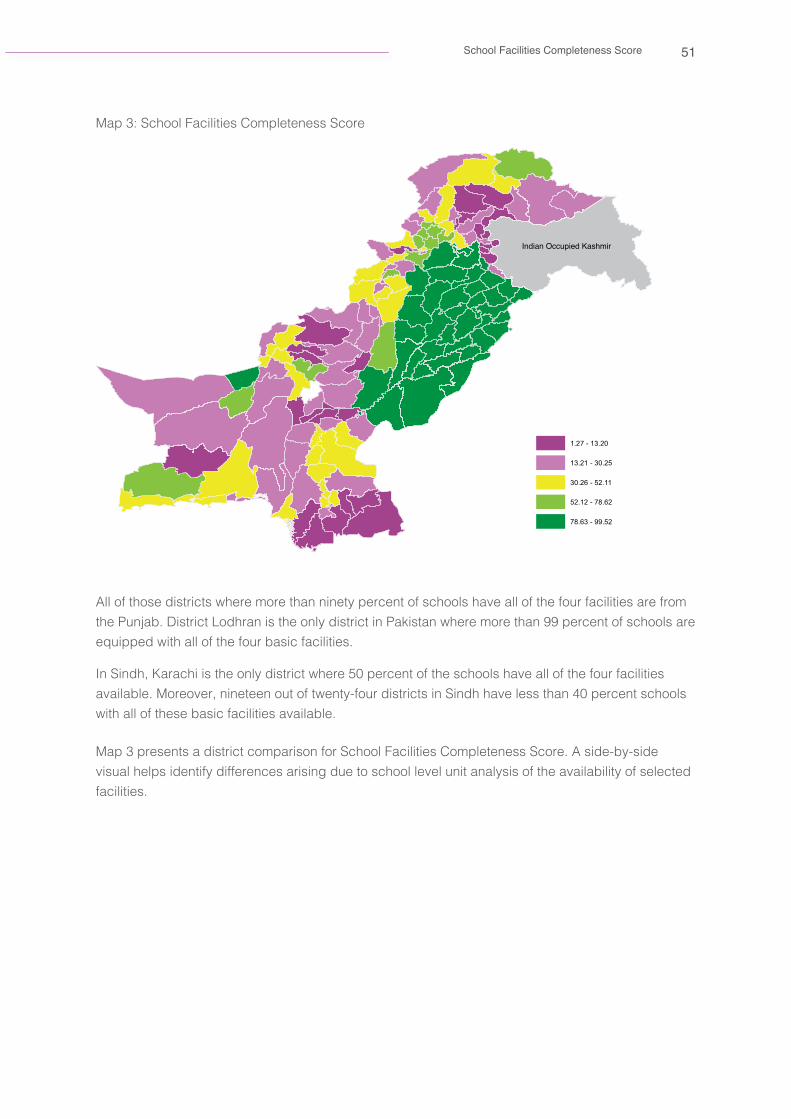
51School Facilities Completeness Score
Map 3: School Facilities Completeness Score
Indian Occupied Kashmir
1.27 - 13.20
13.21 - 30.25
30.26 - 52.11
52.12 - 78.62
78.63 - 99.52
All of those districts where more than ninety percent of schools have all of the four facilities are from the Punjab. District Lodhran is the only district in Pakistan where more than 99 percent of schools are equipped with all of the four basic facilities.
In Sindh, Karachi is the only district where 50 percent of the schools have all of the four facilities available. Moreover, nineteen out of twenty-four districts in Sindh have less than 40 percent schools with all of these basic facilities available.
Map 3 presents a district comparison for School Facilities Completeness Score. A side-by-side visual helps identify differences arising due to school level unit analysis of the availability of selected facilities.

52 Pakistan District Education Rankings 2016
Other metricsNumber of primary schools
To cater to the schooling needs of all the children between the ages of 5-16 years, as determined by the Constitution of Pakistan, schooling facilities need to be made available at all levels including primary, middle and higher levels. This is also a critical component of the changes instituted by the transition from the primary-level focus of the MDGs, to the more holistic SDGs.
Using the NEMIS 2014-15 school census we calculated the share of primary schools among all government schools. At a national level, 81 percent of the total schools are at primary level whereas the remaining 19 percent are at the middle, high or higher secondary level. What does this mean? Essentially, that the Pakistani state has chosen to provide only one in five children, the opportunity to continue school beyond primary school. Not only does this de facto choice represent a violation of Pakistan’s constitution, it also places Pakistan on-track to miss the SDGs, just as it missed the MDGs. The rank of each province and region based on the proportion of primary schools as a percentage of government schools is given in Table 14 below.
Table 14: Province and national level proportion of primary schools as percentage of all schools
Rank Province/ Region Number of primary schools Total number of schools Primary schools as percentage
of total schools
1 ICT 191 391 48.8
2 GB 797 1,275 62.5
3 AJK 4,202 5,985 70.2
4 Punjab 37,853 52,986 71.4
- Pakistan 124,070 154,144 80.5
5 KP 23,022 28,178 81.7
6 Balochistan 11,167 13,279 84.1
7 FATA 5,114 6,011 85.1
8 Sindh 41,724 46,039 90.6
Note:”-” data not available/not ranked
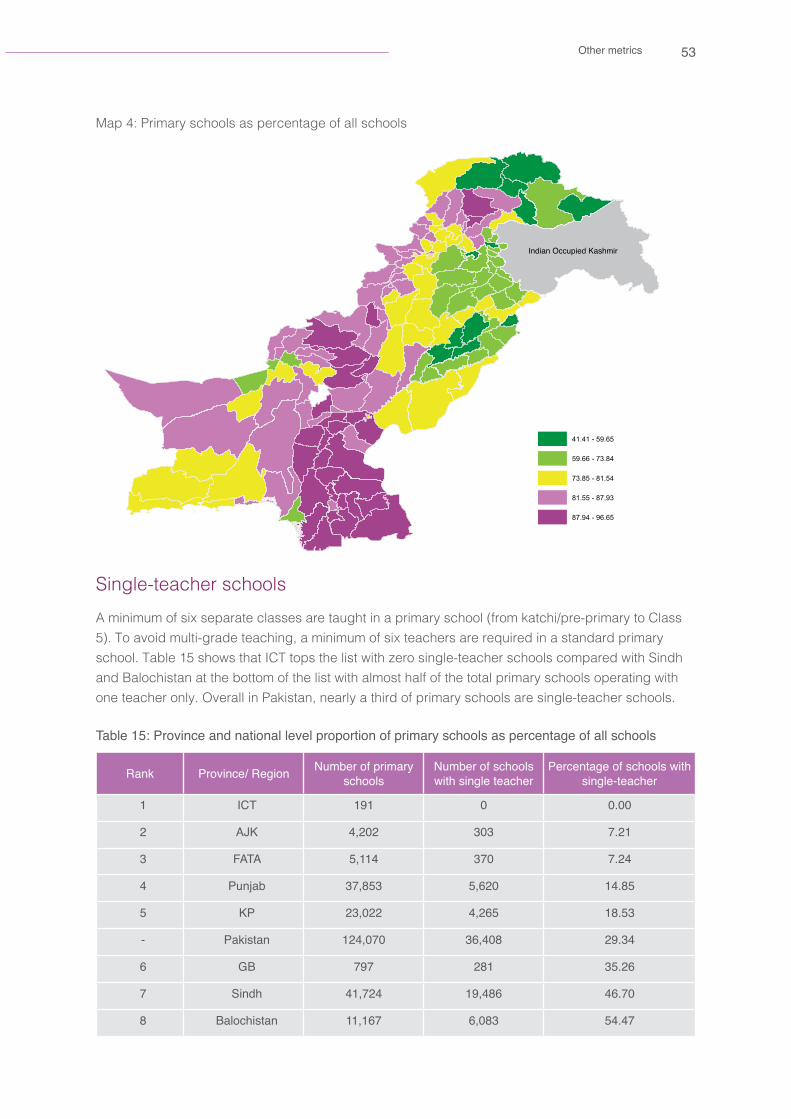
53Other metrics
Map 4: Primary schools as percentage of all schools
41.41 - 59.65
59.66 - 73.84
73.85 - 81.54
81.55 - 87.93
87.94 - 96.65
Indian Occupied Kashmir
Single-teacher schoolsA minimum of six separate classes are taught in a primary school (from katchi/pre-primary to Class 5). To avoid multi-grade teaching, a minimum of six teachers are required in a standard primary school. Table 15 shows that ICT tops the list with zero single-teacher schools compared with Sindh and Balochistan at the bottom of the list with almost half of the total primary schools operating with one teacher only. Overall in Pakistan, nearly a third of primary schools are single-teacher schools.
Table 15: Province and national level proportion of primary schools as percentage of all schools
Rank Province/ Region Number of primary schools
Number of schools with single teacher
Percentage of schools with single-teacher
1 ICT 191 0 0.00
2 AJK 4,202 303 7.21
3 FATA 5,114 370 7.24
4 Punjab 37,853 5,620 14.85
5 KP 23,022 4,265 18.53
- Pakistan 124,070 36,408 29.34
6 GB 797 281 35.26
7 Sindh 41,724 19,486 46.70
8 Balochistan 11,167 6,083 54.47
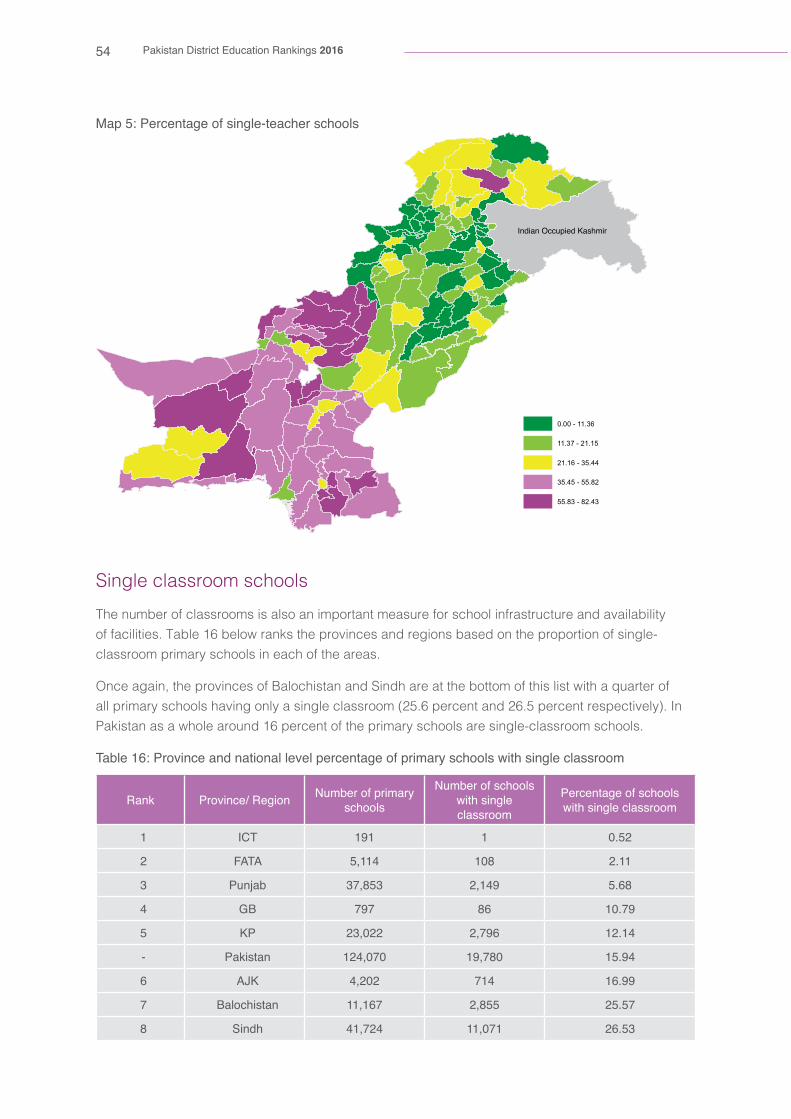
54 Pakistan District Education Rankings 2016
Map 5: Percentage of single-teacher schools
0.00 - 11.36
11.37 - 21.15
21.16 - 35.44
35.45 - 55.82
55.83 - 82.43
Indian Occupied Kashmir
Single classroom schoolsThe number of classrooms is also an important measure for school infrastructure and availability of facilities. Table 16 below ranks the provinces and regions based on the proportion of single-classroom primary schools in each of the areas.
Once again, the provinces of Balochistan and Sindh are at the bottom of this list with a quarter of all primary schools having only a single classroom (25.6 percent and 26.5 percent respectively). In Pakistan as a whole around 16 percent of the primary schools are single-classroom schools.
Table 16: Province and national level percentage of primary schools with single classroom
Rank Province/ Region Number of primary schools
Number of schools with single classroom
Percentage of schools with single classroom
1 ICT 191 1 0.52
2 FATA 5,114 108 2.11
3 Punjab 37,853 2,149 5.68
4 GB 797 86 10.79
5 KP 23,022 2,796 12.14
- Pakistan 124,070 19,780 15.94
6 AJK 4,202 714 16.99
7 Balochistan 11,167 2,855 25.57
8 Sindh 41,724 11,071 26.53

55Alternative rankings
Map 6: Percentage of single-classroom schools
0.00 - 5.41
5.42 - 12.68
12.69 - 21.56
21.57 - 31.28
31.29 - 55.73
Indian Occupied Kashmir
Alternative rankings: what would the rankings look like if different indicators were usedCreating rankings and indices involves multiple decisions about which datasets and which indicators to use. In this regard, our main emphasis has been on the completeness of an indicator i.e. it should be available for all geographic regions. In certain cases more robust indicators were available but they could not be used due to their unavailability for all provinces, territories and districts.
In this section, we calculate the alternative ranking based on the test scores that are used to assess the quality of learning being provided in government schools.
Alternative rankings using Sindh Standardized Achievement Test (SAT)
The SAT provides an average of language, mathematics and science mean scores for the Class 5 and Class 8 students. In Table 17, we have calculated the primary school rankings by using SAT results for the calculation of learning scores.
Interestingly, while the same districts occupy the bottom five places (Tando Muhammad Khan, Tharparkar, Jacobabad, Sujawal and Thatta), a shift in the top five ranks is noticed with Karachi occupying the top niche in rankings based on ASER scores and Naushehro Feroze being the top ranked district when SAT scores are used. One possible explanation for this shift is the fact, that as opposed to the ASER household survey which includes the sample of children attending both private and public schools, SAT only tests students attending government schools. For urbanised

56 Pakistan District Education Rankings 2016
districts such as Karachi where almost 74 percent of the children attend private schools (as per PSLMS 2014-15), the exclusion of a student sample attending private schools in SAT scores can be seen as a plausible cause for the drop in learning scores. The reduction in learning scores appears across the board when ASER scores are replaced with SAT scores and therefore does not affect the rankings greatly, especially for the districts ranked at the bottom.
Table 17: District education scores (primary schools) with SAT
Rank District Education Score
Enrolment Score
Learning Score
Retention Score
Gender Parity Score
1 Naushehro Feroze 66.50 70.97 32.05 77.00 85.992 Karachi 64.83 73.70 38.48 58.00 89.133 Khairpur 63.65 66.51 30.03 74.00 84.074 Dadu 62.60 80.62 34.40 45.00 90.39
5Shaheed Benazirabad
61.93 64.42 30.82 69.11 83.37
6 Larkana 60.35 65.37 27.94 62.00 86.087 Sukkur 58.77 63.36 28.25 61.00 82.458 Hyderabad 58.12 63.60 27.56 60.00 81.349 Ghotki 54.65 49.29 27.02 62.00 80.30
10 Matiari 54.58 51.75 29.40 52.00 85.1511 Tando Allah Yar 54.47 46.71 26.13 59.00 86.0212 Shikarpur 54.30 51.29 24.13 61.00 80.7713 Jamshoro 53.59 61.65 28.78 43.00 80.9314 Sanghar 53.06 52.31 26.66 55.00 78.29
15Kashmore-Kandhkot
52.79 41.92 24.76 65.00 79.46
16Kambar-Shahdadkot
51.54 58.31 24.43 36.00 87.43
17 Umerkot 51.08 51.71 28.72 36.00 87.8718 Badin 51.03 45.84 28.29 47.00 82.9919 Mirpurkhas 50.95 52.52 31.74 42.00 77.5620 Tharparkar 45.53 54.23 27.63 26.00 74.2721 Jacobabad 45.38 47.37 24.85 39.00 70.28
22Tando Muhammad Khan
45.32 35.28 26.20 43.67 76.11
23 Sujawal 41.61 47.75 28.77 20.00 69.91
24 Thatta 40.24 37.22 26.79 18.00 78.94
Alternative rankings using the Punjab Examination Commission (PEC) resultsFor the Punjab rankings based on PEC 2015 examination results have been provided in Table 18 where the learning scores have been revised using the average of six variables: adult literacy rate and average scores of Urdu, Islamiat, English, mathematics and science.

57Alternative rankings
Table 18: District Education Scores (primary schools) with PEC
Rank District Education Score
Enrolment Score
Learning Score
Retention Score
Gender Parity Score
1 Chakwal 82.95 88.90 58.63 88.68 95.57
2 Jhelum 81.78 90.79 60.48 85.07 90.78
3 Sialkot 81.68 84.61 53.25 90.00 98.84
4 Attock 80.29 85.94 53.16 86.00 96.04
5 Gujrat 78.30 80.19 53.39 87.00 92.63
6 Gujranwala 77.97 74.91 56.60 85.00 95.39
7 Layyah 77.70 87.81 60.83 69.00 93.17
8 Rawalpindi 77.64 77.88 52.43 86.00 94.25
9 Mandi Bahuddin 76.95 81.12 51.85 78.00 96.83
10 Toba Tek Singh 76.83 76.41 57.71 77.00 96.21
11 Faisalabad 76.79 77.55 56.89 77.00 95.72
12 Sheikhupura 76.51 73.58 50.07 89.00 93.39
13 Lahore 74.20 76.02 54.55 81.00 85.25
14 Khushab 74.00 69.71 57.07 80.00 89.23
15 Okara 73.47 80.92 50.81 67.00 95.14
16 Hafizabad 72.098 70.27 51.98 68.13 97.99
17 Narowal 72.098 82.03 51.78 62.00 92.56
18 Sargodha 71.97 70.85 54.95 68.00 94.08
19 Sahiwal 71.96 73.38 53.75 70.00 90.70
20 Kasur 71.31 68.02 51.60 70.00 95.62
21 Mianwali 70.87 70.44 54.86 72.00 86.19
22 Vehari 69.95 69.09 58.72 59.00 93.00
23 Nankana Sahib 69.05 76.82 56.08 56.00 87.29
24 Bhakkar 68.64 70.29 55.10 59.00 90.17
25 Khanewal 68.02 68.79 58.93 57.00 87.35
26 Multan 67.79 66.81 59.42 50.00 94.95
27 Jhang 67.69 68.75 57.86 58.00 86.15
28 Pakpattan 67.27 72.74 54.25 51.00 91.10
29 Chiniot 65.44 68.02 54.18 53.00 86.57
30 Bahawalnagar 64.72 59.01 56.33 54.00 89.56
31 Lodhran 64.08 59.81 57.86 46.00 92.64
32 Bahawalpur 63.67 50.25 55.81 53.00 95.62
33 Rahim Yar Khan 61.17 49.69 51.91 53.00 90.10
34 Muzaffargarh 60.22 60.73 62.83 38.00 79.31
35 Dera Ghazi Khan 59.44 64.09 54.17 34.00 85.48
36 Rajanpur 52.18 52.43 53.78 29.00 73.50
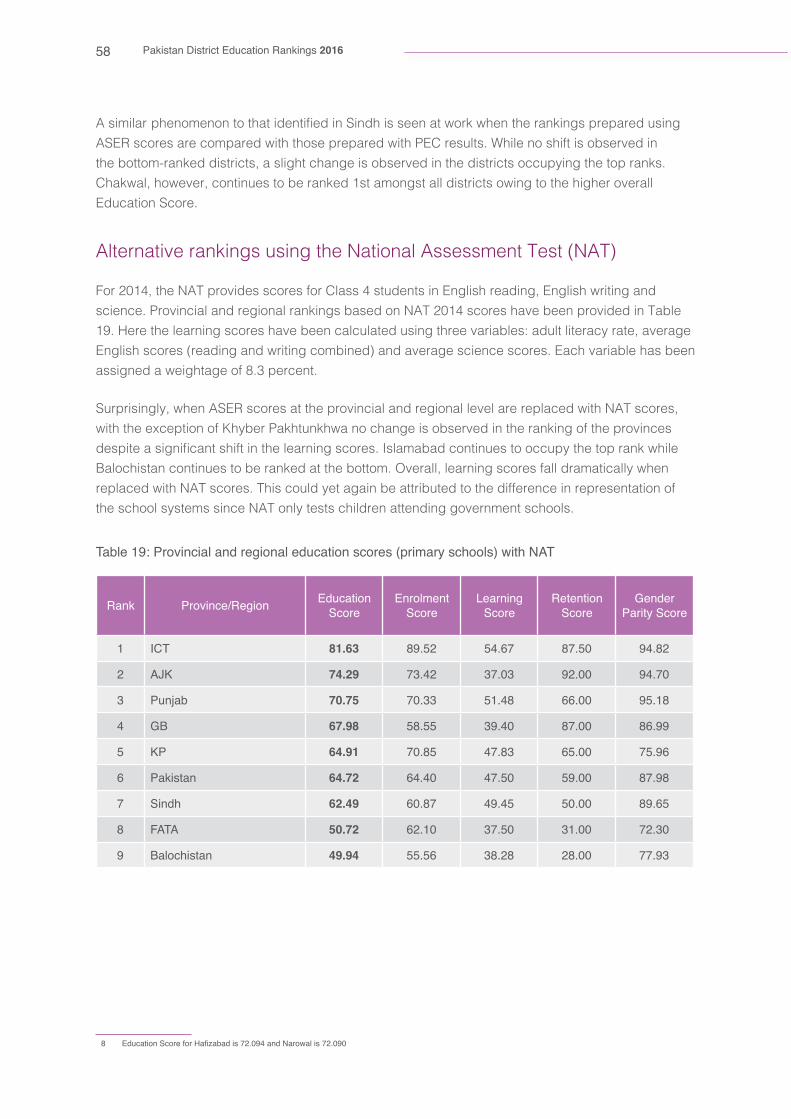
58 Pakistan District Education Rankings 2016
A similar8phenomenon to that identified in Sindh is seen at work when the rankings prepared using ASER scores are compared with those prepared with PEC results. While no shift is observed in the bottom-ranked districts, a slight change is observed in the districts occupying the top ranks. Chakwal, however, continues to be ranked 1st amongst all districts owing to the higher overall Education Score.
Alternative rankings using the National Assessment Test (NAT)
For 2014, the NAT provides scores for Class 4 students in English reading, English writing and science. Provincial and regional rankings based on NAT 2014 scores have been provided in Table 19. Here the learning scores have been calculated using three variables: adult literacy rate, average English scores (reading and writing combined) and average science scores. Each variable has been assigned a weightage of 8.3 percent.
Surprisingly, when ASER scores at the provincial and regional level are replaced with NAT scores, with the exception of Khyber Pakhtunkhwa no change is observed in the ranking of the provinces despite a significant shift in the learning scores. Islamabad continues to occupy the top rank while Balochistan continues to be ranked at the bottom. Overall, learning scores fall dramatically when replaced with NAT scores. This could yet again be attributed to the difference in representation of the school systems since NAT only tests children attending government schools.
Table 19: Provincial and regional education scores (primary schools) with NAT
Rank Province/Region Education Score
Enrolment Score
Learning Score
Retention Score
Gender Parity Score
1 ICT 81.63 89.52 54.67 87.50 94.82
2 AJK 74.29 73.42 37.03 92.00 94.70
3 Punjab 70.75 70.33 51.48 66.00 95.18
4 GB 67.98 58.55 39.40 87.00 86.99
5 KP 64.91 70.85 47.83 65.00 75.96
6 Pakistan 64.72 64.40 47.50 59.00 87.98
7 Sindh 62.49 60.87 49.45 50.00 89.65
8 FATA 50.72 62.10 37.50 31.00 72.30
9 Balochistan 49.94 55.56 38.28 28.00 77.93
8 Education Score for Hafizabad is 72.094 and Narowal is 72.090
59Alternative rankings
How to improve a district scoreIn order for a district to improve its score, and subsequently its ranking on the indices, it is important to understand the components that contribute to the computation of the scores. The Education Score is comprised of access, learning, retention and gender parity. The School Infrastructure Score is comprised of availability boundary wall, drinking water, electricity and toilets, as well as satisfactory building condition.
A district’s score can be improved through greater effort in improving these informants of the Education and School Infrastructure Scores. There are also inter-linkages across these indicators and indices. Ensuring the availability of all facilities in all schools will obviously lead to improved Infrastructure Scores and therefore the ranks of districts. However, better facilities can also drive improvements across the board. Fully equipped schools may help attract and/or retain more students, resulting in improved Education Scores. Similarly, the availability of facilities like toilets (especially in girls’ schools) may help improve gender parity scores and therefore drive improved district ranks. Only approximately 37 percent of all schools across the country are girls’ only schools. Building new girls’ schools, closer to large communities with higher out-of-school girls’ populations and low transition levels from primary to middle can potentially improve gender parity score. Additionally, offering incentives like transportation facilities and stipends programmes while preventing corporal punishment can also increase girl’s enrolment.
To improve learning scores, a good starting point is sustaining the effort to ensure merit based appointments of teachers. Separately, improved teacher attendance does not guarantee better reaching, but it makes it more likely, as compared to the situation in classrooms with no teachers. Accountability and performance management along with requisite enablement with training and development may also improve teaching quality and result in improved learning and retention. Enrolment drives to induct out-of-school children, backed by improved school infrastructure and teacher quality may also drive up enrolment. The effects of these measures may vary in each administrative unit, but they have linkages to each of the score components and the cumulative effect of these individual scores will affect district scores and hence their rankings.
It must be noted that none of these measures can be brought about without a transformational change in both the amount of funding allocated to education, and the manner in which education budgets are spent. Continued governmental failure to fulfil the promise of spending at least 4 percent of the GDP on education therefore will affect education outcomes in a significant manner.
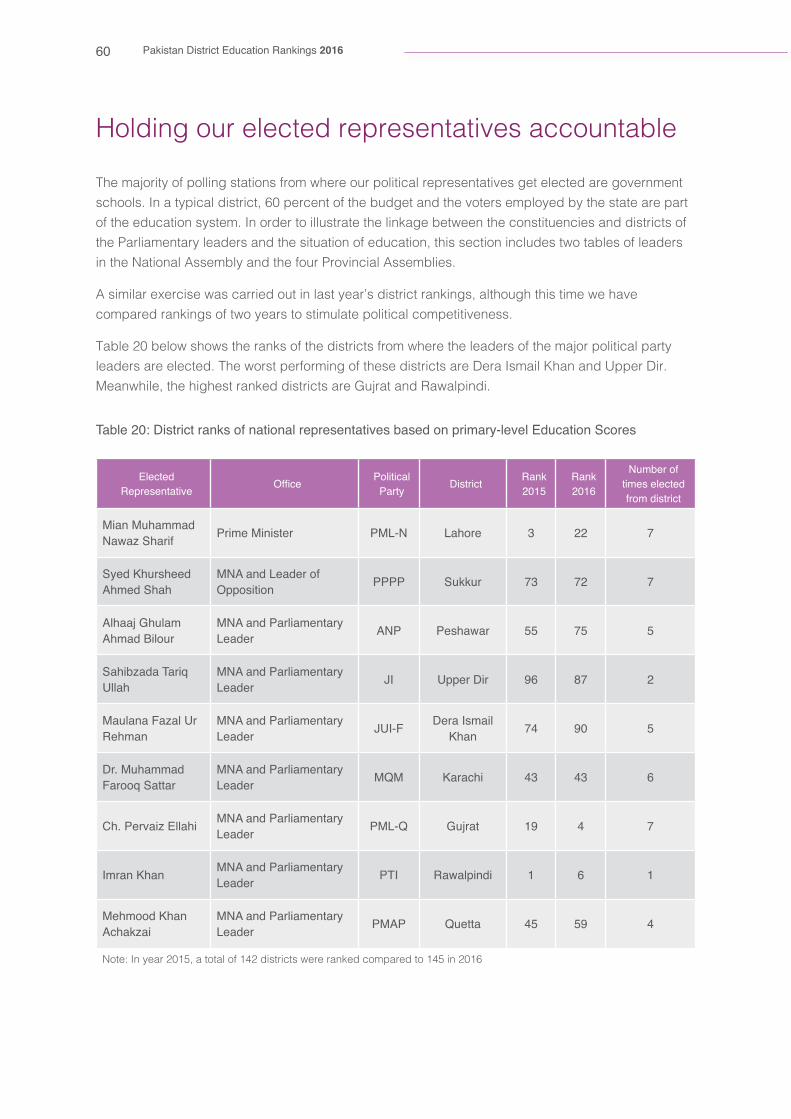
60 Pakistan District Education Rankings 2016
Holding our elected representatives accountable
The majority of polling stations from where our political representatives get elected are government schools. In a typical district, 60 percent of the budget and the voters employed by the state are part of the education system. In order to illustrate the linkage between the constituencies and districts of the Parliamentary leaders and the situation of education, this section includes two tables of leaders in the National Assembly and the four Provincial Assemblies.
A similar exercise was carried out in last year’s district rankings, although this time we have compared rankings of two years to stimulate political competitiveness.
Table 20 below shows the ranks of the districts from where the leaders of the major political party leaders are elected. The worst performing of these districts are Dera Ismail Khan and Upper Dir. Meanwhile, the highest ranked districts are Gujrat and Rawalpindi.
Table 20: District ranks of national representatives based on primary-level Education Scores
Elected Representative Office Political
Party District Rank 2015
Rank 2016
Number of times elected from district
Mian Muhammad Nawaz Sharif Prime Minister PML-N Lahore 3 22 7
Syed Khursheed Ahmed Shah
MNA and Leader of Opposition PPPP Sukkur 73 72 7
Alhaaj Ghulam Ahmad Bilour
MNA and Parliamentary Leader ANP Peshawar 55 75 5
Sahibzada Tariq Ullah
MNA and Parliamentary Leader JI Upper Dir 96 87 2
Maulana Fazal Ur Rehman
MNA and Parliamentary Leader JUI-F Dera Ismail
Khan 74 90 5
Dr. Muhammad Farooq Sattar
MNA and Parliamentary Leader MQM Karachi 43 43 6
Ch. Pervaiz Ellahi MNA and Parliamentary Leader PML-Q Gujrat 19 4 7
Imran Khan MNA and Parliamentary Leader PTI Rawalpindi 1 6 1
Mehmood Khan Achakzai
MNA and Parliamentary Leader PMAP Quetta 45 59 4
Note: In year 2015, a total of 142 districts were ranked compared to 145 in 2016
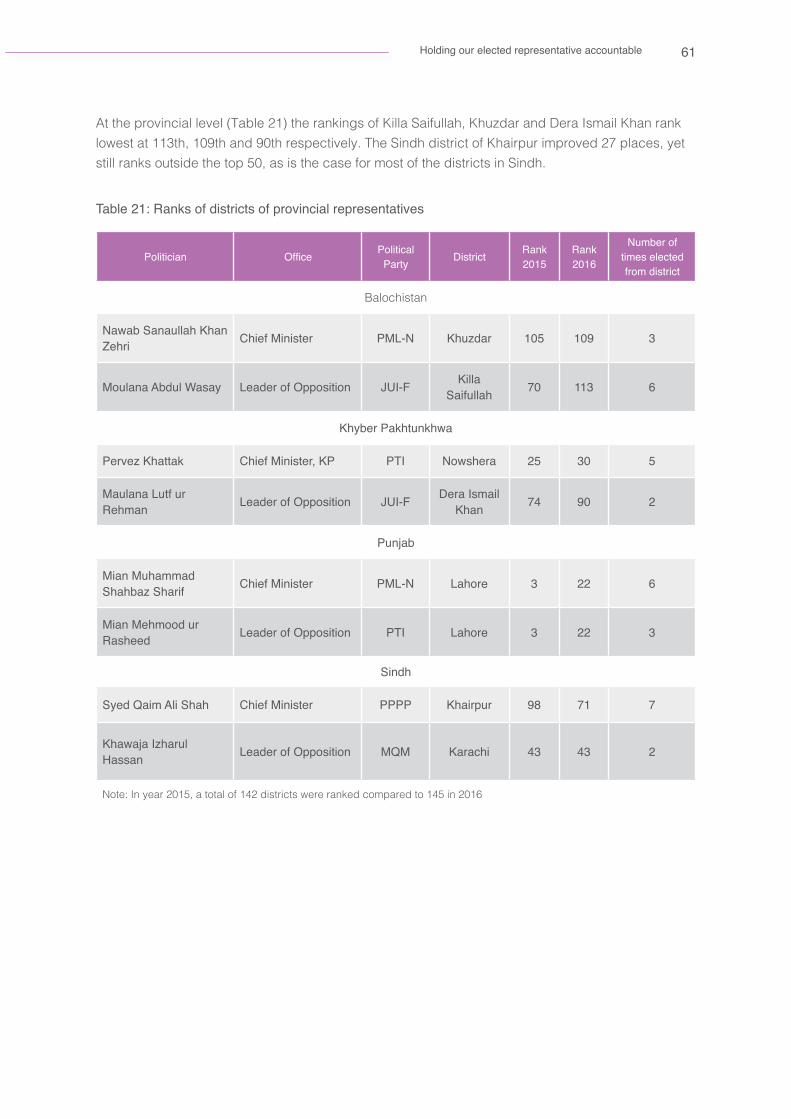
61Holding our elected representative accountable
At the provincial level (Table 21) the rankings of Killa Saifullah, Khuzdar and Dera Ismail Khan rank lowest at 113th, 109th and 90th respectively. The Sindh district of Khairpur improved 27 places, yet still ranks outside the top 50, as is the case for most of the districts in Sindh.
Table 21: Ranks of districts of provincial representatives
Politician Office Political Party District Rank
2015Rank 2016
Number of times elected from district
Balochistan
Nawab Sanaullah Khan Zehri Chief Minister PML-N Khuzdar 105 109 3
Moulana Abdul Wasay Leader of Opposition JUI-F Killa Saifullah 70 113 6
Khyber Pakhtunkhwa
Pervez Khattak Chief Minister, KP PTI Nowshera 25 30 5
Maulana Lutf ur Rehman Leader of Opposition JUI-F Dera Ismail
Khan 74 90 2
Punjab
Mian Muhammad Shahbaz Sharif Chief Minister PML-N Lahore 3 22 6
Mian Mehmood ur Rasheed Leader of Opposition PTI Lahore 3 22 3
Sindh
Syed Qaim Ali Shah Chief Minister PPPP Khairpur 98 71 7
Khawaja Izharul Hassan Leader of Opposition MQM Karachi 43 43 2
Note: In year 2015, a total of 142 districts were ranked compared to 145 in 2016

62 Pakistan District Education Rankings 2016
The road to achieving SDG 4
In September 2000, leaders from around the globe adopted the United Nations Millennium Declaration. Pakistan was among the 193 signatories that committed to help achieve the eight international development goals which included achieving universal primary education i.e. “ensuring that by 2015, children everywhere, boys and girls alike, will be able to complete a full course of primary schooling”. In parallel to the MDG commitment, Pakistan also pledged to achieve six education-related goals by 2015 set under Education For All (EFA), a global movement led by UNESCO.
Where we are
It is disheartening to learn that not only did Pakistan come up short in upholding its international commitment to ensure all its citizens access to primary education as prescribed under the Millennium Development Goal (MDG) 2 but it has also failed to meet its constitutional obligation9 of providing all its children (between the ages of 5 and 16 years) the access to free and compulsory education.
Now the world is set to finalise the Education 2030 Agenda as a part of the 17 UN Sustainable Development Goals (SDGs). Education is represented by SDG 4 which aims to “ensure inclusive and equitable quality education and promote lifelong learning opportunities for all”. The goals set under SDG 4 are more comprehensive than the MDGs as they extend from primary to secondary and tertiary education and from access to the quality of learning. However, the progress on MDG 2 and MDG 3, and the EFA goals paints a grim picture (Table 22). The potential for Pakistan to meet its SDG 4 obligations therefore needs to be examined carefully.
Despite a decrease in the out-of-school children population this year (from 25 million to 24 million), 47 percent of all children between the ages of 5 and 16 in Pakistan remain out of school. Of the children who do get enrolled, 31 percent drop out before they finish primary school. While a significant reduction has been observed in gender disparity, 52 percent of all girls within the age bracket of 5 and 16 years in Pakistan are currently out of school compared to 43 percent10 of all boys. The aim of bringing to light the existing picture on the state of education in the country is to underscore the urgency of dealing with SDG 4 with greater seriousness and commitment than what was afforded to the MDGs. Without evidence-based policy decisions, adequate financial and human resource allocation, robust implementation and devout political will, the SDG 4 targets are on track to be missed, across the board.
9 Article 25-A, Constitution of Pakistan, 197310 National Education Management Information System (NEMIS) 2014-15
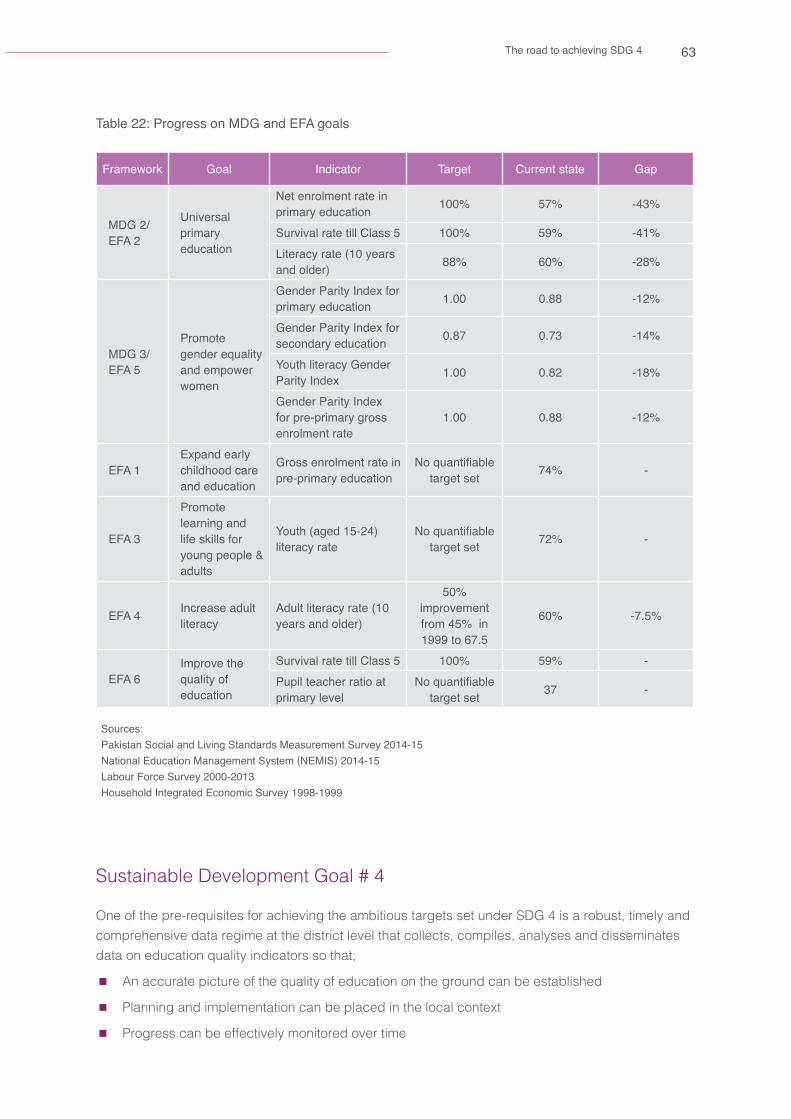
63The road to achieving SDG 4
Table 22: Progress on MDG and EFA goals
Framework Goal Indicator Target Current state Gap
MDG 2/EFA 2
Universal primary education
Net enrolment rate in primary education 100% 57% -43%
Survival rate till Class 5 100% 59% -41%Literacy rate (10 years and older) 88% 60% -28%
MDG 3/EFA 5
Promote gender equality and empower women
Gender Parity Index for primary education 1.00 0.88 -12%
Gender Parity Index for secondary education 0.87 0.73 -14%
Youth literacy Gender Parity Index 1.00 0.82 -18%
Gender Parity Index for pre-primary gross enrolment rate
1.00 0.88 -12%
EFA 1Expand early childhood care and education
Gross enrolment rate in pre-primary education
No quantifiable target set 74% -
EFA 3
Promote learning and life skills for young people & adults
Youth (aged 15-24) literacy rate
No quantifiable target set 72% -
EFA 4 Increase adult literacy
Adult literacy rate (10 years and older)
50% improvement from 45% in 1999 to 67.5
60% -7.5%
EFA 6Improve the quality of education
Survival rate till Class 5 100% 59% -Pupil teacher ratio at primary level
No quantifiable target set 37 -
Sources: Pakistan Social and Living Standards Measurement Survey 2014-15National Education Management System (NEMIS) 2014-15Labour Force Survey 2000-2013Household Integrated Economic Survey 1998-1999
Sustainable Development Goal # 4
One of the pre-requisites for achieving the ambitious targets set under SDG 4 is a robust, timely and comprehensive data regime at the district level that collects, compiles, analyses and disseminates data on education quality indicators so that;
n An accurate picture of the quality of education on the ground can be established
n Planning and implementation can be placed in the local context
n Progress can be effectively monitored over time
64 Pakistan District Education Rankings 2016
Failure to achieve MDG targets and EFA goals indicates gaps in the aforementioned areas which need to be identified as soon as possible and resolved if Pakistan wishes to keep itself from repeating history with SDG 4 targets. Table 23 provides a list of the global indicators for tracking the SDG 4 targets developed by the Inter-agency and Expert Group on SDG indicators (IAEG-SDGs).
In Table 23, Alif Ailaan has collated the entire spectrum of SDG 4 targets and indicators, and identified the available and unavailable data. Without a coherent and urgent addressing of the statistical and data gaps, the chances of the country achieving the SDG 4 targets are slim. We hope that government will urgently adopt a new data regime that enables the country to both robustly report on SDG 4 targets, and achieve those targets in a timely fashion.
SDG 4 targets
4.1 Ensure that all girls and boys complete free, equitable and quality primary and secondary education
4.2 Ensure that all girls and boys have access to quality pre-primary education so that they are ready for primary education
4.3 Ensure equal access for all women and men to affordable and quality technical, vocational and tertiary education, including university
4.4 Substantially increase the number of youth and adults who have relevant skills, including technical and vocational skills, for employment, decent jobs and entrepreneurship
4.5 Eliminate gender disparities in education and ensure equal access to all levels of education and vocational training for the vulnerable, including persons with disabilities, indigenous peoples and children in vulnerable situations
4.6 Ensure that all youth and a substantial proportion of adults, both men and women, achieve literacy and numeracy
4.7 Ensure that all learners acquire the knowledge and skills needed to promote sustainable development, including, among others, through education for sustainable development and sustainable lifestyles, human rights, gender equality, promotion of a culture of peace and non-violence, global citizenship and appreciation of cultural diversity and of culture’s contribution to sustainable development
4.a Build and upgrade education facilities that are child, disability and gender sensitive and provide safe, nonviolent, inclusive and effective learning environments for all
4.b Substantially expand globally the number of scholarships available for enrolment in higher education, including vocational training
4.c Substantially increase the supply of qualified teachers, including through international cooperation for teacher training in developing countries, especially least developed countries and small island developing states.

65The road to achieving SDG 4
Table 23: SDG 4 targets, monitoring indicators and proposed solutions
SDG 4Target
SDG 4Outcome
SDG 4Indicator
SDG 4Sub-indicator
Agency already responsible or proposed
responsible agency
Status (including whether data is available or
collected)
4.1
Learning
Percentage of children who achieve minimum proficiency standards in reading/mathematics at the end of primary school
English reading
NEAS61%
Science 51%
Percentage of children who achieve minimum proficiency standards in reading/mathematics at the end of middle school
Urdu reading
NEAS73%
Mathematics 68%
Completion
Gross intake ratio to Class 5 AEPAMRaw data available,
but value not calculated
Gross intake ratio to Class 8 AEPAMRaw data available,
but value not calculated
Completion rate of primary education AEPAMRaw data available,
but value not calculated
Completion rate of middle education AEPAMRaw data available,
but value not calculated
Completion rate of high & higher secondary education AEPAMRaw data available,
but value not calculated
Participation
Out-of-school rate at primary school age AEPAM 28%
Out-of-school rate at middle school age AEPAM 53%
Percentage of children over-age for grade in primary education PBS
Raw data available,
but value not calculated
Percentage of children over-age for grade in middle education PBS
Raw data available,
but value not calculated
Provision
Number of years of compulsory primary education guaranteed in legal frameworks
Article 25-A, Constitution 5 years
Number of years of free primary education guaranteed in legal frameworks
Article 25-A, Constitution 5 years
Number of years of compulsory secondary education (Class 6-12) guaranteed in legal frameworks
Article 25-A, Constitution 7 years
Number of years of free secondary education (Class 6-12) guaranteed in legal frameworks
Article 25-A, Constitution 7 years

66 Pakistan District Education Rankings 2016
SDG 4
Target
SDG 4Outcome
SDG 4Indicator
SDG 4Sub-indicator
Agency already
responsible or proposed responsible
agency
Status (including whether data is
available or collected)
4.2
Readiness
Percentage of children under 5 years of age who are developmentally on track in learning and psychosocial well-being
Sub-indicators need to be developed
PBS
No data is collected, and estimates not possible with
existing regime
Percentage of children under 5 years of age experiencing responsive and stimulating parenting
Sub-indicators need to be developed
PBS
No data is collected, and estimates not possible with
existing regime
ParticipationParticipation rate in organized learning (from 24 months to official primary school entry age) PBS
No data is collected, and estimates not possible with
existing regime
Gross pre-primary enrolment ratio AEPAM 74%
Provision
Number of years of free pre-primary education guaranteed in legal frameworks
AJK
-- not available in any region
Balochistan
GB
KP
Punjab
Sindh
ICT
Number of years of compulsory pre-primary education guaranteed in legal frameworks
AJK
-- not available in any region
Balochistan
GB
KP
Punjab
Sindh
ICT
4.3 Participation
Gross enrolment ratio for tertiary education PBSRaw data available,
but value not calculated
Participation rate in technical-vocational education programmes (15 to 24 year-olds)
AEPAM/NAVTTC
Raw data available,
but value not calculated
Participation rate of adults in formal and non-formal education and training
Participation rate in formal education
PBS
No data is collected, and estimates not possible with
existing regime
Participation rate in non-formal education
No data is collected, and estimates not possible with
existing regime
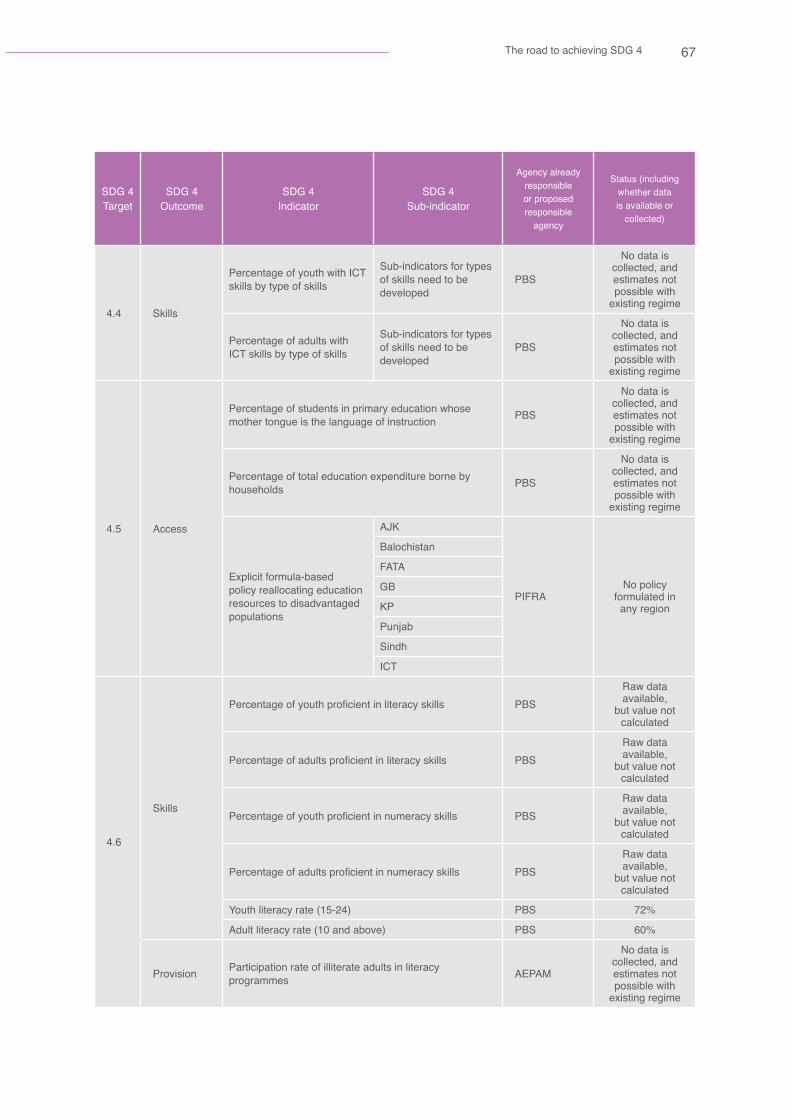
67The road to achieving SDG 4
SDG 4Target
SDG 4Outcome
SDG 4Indicator
SDG 4Sub-indicator
Agency already responsible or proposed responsible
agency
Status (including whether data is available or
collected)
4.4 Skills
Percentage of youth with ICT skills by type of skills
Sub-indicators for types of skills need to be developed
PBS
No data is collected, and estimates not possible with
existing regime
Percentage of adults with ICT skills by type of skills
Sub-indicators for types of skills need to be developed
PBS
No data is collected, and estimates not possible with
existing regime
4.5 Access
Percentage of students in primary education whose mother tongue is the language of instruction PBS
No data is collected, and estimates not possible with
existing regime
Percentage of total education expenditure borne by households PBS
No data is collected, and estimates not possible with
existing regime
Explicit formula-based policy reallocating education resources to disadvantaged populations
AJK
PIFRANo policy
formulated in any region
Balochistan
FATA
GB
KP
Punjab
Sindh
ICT
4.6
Skills
Percentage of youth proficient in literacy skills PBSRaw data available,
but value not calculated
Percentage of adults proficient in literacy skills PBSRaw data available,
but value not calculated
Percentage of youth proficient in numeracy skills PBSRaw data available,
but value not calculated
Percentage of adults proficient in numeracy skills PBSRaw data available,
but value not calculated
Youth literacy rate (15-24) PBS 72%
Adult literacy rate (10 and above) PBS 60%
Provision Participation rate of illiterate adults in literacy programmes AEPAM
No data is collected, and estimates not possible with
existing regime

68 Pakistan District Education Rankings 2016
SDG 4Target
SDG 4Outcome
SDG 4Indicator
SDG 4Sub-indicator
Agency already responsible or proposed responsible agency
Status (including whether data is
available or collected)
4.7
KnowledgePercentage of 15-year-old students showing proficiency in knowledge of environmental science and geoscience
NEAS
No data is collected, and estimates not possible with
existing regime
Attitudes
Percentage of 13-year-old students endorsing values and attitudes promoting equality, trust and participation in governance
NEAS
No data is collected, and estimates not possible with
existing regime
Participation
Percentage of teaching hours dedicated to education for sustainable development
DSD (Punjab), STEDA & PITE (Sindh), BOC & PITE (KP), BOC & PITE (Balochistan)
No data is collected, and estimates not possible with
existing regime
Percentage of teaching hours dedicated to global citizenship education
DSD (Punjab), STEDA & PITE (Sindh), BOC & PITE (KP), BOC & PITE (Balochistan)
No data is collected, and estimates not possible with
existing regime
Percentage of schools that provide life skills-based HIV and sexuality education AEPAM
No data is collected, and estimates not possible with
existing regime
4.a
Resources
Percentage of schools providing basic drinking water AEPAM 63%
Percentage of schools providing adequate sanitation AEPAM 65%
Percentage of schools providing adequate hygiene services AEPAM
No data is collected, and estimates not possible with
existing regime
Percentage of schools with electricity AEPAM 51%
Percentage of schools with adapted infrastructure and materials for people with disabilities
AEPAM
No data is collected, and estimates not possible with
existing regime
Percentage of schools with Internet access for pedagogical purposes AEPAM
No data is collected, and estimates not possible with
existing regime
Pupil-to-computer ratio by level AEPAM
No data is collected, and estimates not possible with
existing regime
Environment
Percentage of students experiencing bullying, corporal punishment, harassment, violence, sexual discrimination and abuse
AEPAM, PBS
No data is collected, and estimates not possible with
existing regime
Number of attacks on students, personnel and institutions AEPAM, PBS
No data is collected, and estimates not possible with
existing regime

69The road to achieving SDG 4
SDG 4Target
SDG 4Outcome
SDG 4Indicator
SDG 4Sub-indicator
Agency already responsible or proposed
responsible agency
Status (including whether data is available or
collected)
4.b Provision
Number of higher education scholarships awarded by beneficiary country HEC
Raw data available,
but value not calculated
Volume of official development assistance (ODA) flows for higher education HEC
Raw data available,
but value not calculated
4.c
Qualified
Percentage of teachers qualified according to national standards (by level)
Academic Qualification*
Primary
AEPAMRaw data available,
but value not calculated
Middle
High
Higher secondary
ProfessionalQualification*
Primary
Middle
High
Higher secondary
Trained
Percentage of teachers trained according to national standards (by level)*
Sub-indicators need to be developed
AEPAM, Provincial teacher staff departments
Raw data available,
but value not calculated
Motivated
Average teacher salary relative to other professionalsProvincial teacher staff departments
No data is collected, and
estimates not possible with existing
regime
Teacher attrition rate --
No data is collected, and
estimates not possible with existing
regime
Supported Percentage of teachers receiving in-service training
AEPAM, Provincial teacher staff departments
Raw data available,
but value not calculated
* No defined national standards for each level
A look at Table 23 is a clear indication of the gaps in the existent data regime on education in the context of SDG 4 indicators. We look forward to the day where these gaps are met and a ranking of districts based on an index of SDG 4 indicators can be computed and published.

70 Pakistan District Education Rankings 2016
Conclusions
This fourth annual edition of the Alif Ailaan – SDPI Pakistan District Education Rankings provides a basis for comparative examination of districts across four years. This year’s rankings covered 151 districts, agencies and frontier regions of the country, to assess and compare the quality of education, taking both educational outputs and inputs into account.
The provincial rankings remained fairly predictable with ICT, AJK and the Punjab entrenching their positions at the top in Education Score.
Despite witnessing a drop in the overall education and infrastructure scores at the national level, there were districts and regions that demonstrated remarkable improvement. Traditionally the biggest challenge has been that of improving education quality, represented in the Education Score by learning outcomes scores. There were only moderate improvements in learning score: last year from 52.33 to 54.78 this year. Education departments will need to consider the urgency of improving educational quality in the country, which is not necessarily linked to infrastructure alone. While infrastructure is always going to be necessary for the functioning of schools, it is an insufficient condition for improving the quality of education.
Azad Jammu and Kashmir (AJK) has consistently performed above the national average for the past four years in Education Score. This year it is the most improved region with ten points above last year. It also managed to achieve eight districts in the top ten of middle school education rankings. This is despite them scoring abysmally in the School Infrastructure Scores, and having barely 13 percent of its schools with all four basic facilities (electricity, drinking water, toilet facility and boundary wall).
The Federally Administered Tribal Areas (FATA) and Balochistan round up the bottom of the provincial rankings. FATA continued to demonstrate progress with higher Education Scores, enabling it to outrank Balochistan. This makes FATA the only province or region to improve its rank this year in the education rankings. Balochistan, on the other hand, ranked last in educational outcomes and performed poorly on school infrastructure.
Districts from Gilgit-Baltistan (GB) continuously appear in the top half of the rankings. With 50 percent of its school facilities not available, GB, like AJK, succeeds with relatively high Education Scores. This consistency, despite severe resource limitations, highlights the strength of education within these two regions and hints towards the importance of a societal focus on education.
Khyber Pakthunkhwa (KP), although remaining stagnant on fifth rank, is below the national average, with a slightly reduced Education Score. KP ranks higher at third rank in School Infrastructure Score—a major improvement. Yet 50 percent of its schools still do not have any of the four basic facilities available (electricity, drinking water, toilet and boundary wall). Unlike the Punjab, KP’s districts are more evenly distributed whereby one specific region does not dominate the rest, as was the case in previous years.
Punjab remains consistent in both the education and school infrastructure rankings. Additionally, we
71The road to achieving SDG 4
found that over 93 percent of schools in the province had all four facilities available, rendering their schools more complete than other provinces. Unlike previous years, the Punjab also demonstrated an improvement in learning outcomes, a variable for which it was criticised in the previous rankings. South Punjab continued to lag behind the rest of the province, although all three bottom ranked districts (Dera Ghazi Khan, Muzaffargarh and Rajanpur) have increased their ranks from last year.
Sindh remained stagnant at the sixth rank in educational score. It only managed to get six districts in the top half of the rankings, with none in the top 40. School infrastructure is no better with a score below 50, out of which only 23 percent schools could be considered complete, having all four basic facilities (electricity, drinking water, toilet and boundary wall). This could potentially impact future educational outcomes in the province.
With four years of comprehensive and comparable data, we hope this report triggers a healthy and competitive spirit in public-sector education delivery.
In addition to the primary education rankings we continued to calculate similar rankings for middle level and alternative rankings with provincial test scores. For the first time, we also included School Facilities Completeness Scores to further dissect the infrastructure available in the country. Moving beyond headline rankings and figures, we tried to provide a more holistic image of the state of education in the country.
Finally, we have added a section on the Sustainable Development Goal (SDG) number 4. This is the SDG for education. We hope that this edition of the rankings will provide some motivation for an urgent adaptation of a reformed data regime that will capture, report and spur improvement across the spectrum of education inputs and outputs that SDG 4 will seek to measure, globally.
We hope that by using publicly available government data, we are able to generate a debate on its challenges and limitations. This kind of engagement with the data will surely encourage the promotion of a robust, credible and timely data regime in the country.

72

73Provincial Rankings
PROVINCIAL RANKINGS

74 Pakistan District Education Rankings 2016
Education Score Rankings
Azad Jammu and Kashmir
National Rank
Provincial Rank District Education
ScoreEnrolment
ScoreLearning
ScoreRetention
ScoreGender Parity
Score
3 1 Kotli 83.03 85.08 72.30 86.00 88.7510 2 Mirpur 80.35 79.06 58.06 88.00 96.2611 3 Hattian 80.27 71.55 71.81 82.28 95.4513 4 Haveli 79.86 73.65 73.47 79.26 93.0615 5 Bagh 79.36 72.95 59.97 89.81 94.7221 6 Sudhnutti 78.28 68.18 54.32 92.55 98.0724 7 Bhimber 78.11 75.70 62.75 83.66 90.3531 8 Poonch 74.42 71.73 44.00 86.30 95.6733 9 Neelum 74.11 68.14 59.03 79.21 90.0637 10 Muzaffarabad 73.09 68.53 54.35 79.74 89.74
Balochistan
National Rank
Provincial Rank District Education
ScoreEnrolment
ScoreLearning
ScoreRetention
ScoreGender Parity
Score58 1 Gwadar 68.28 82.28 35.74 74.00 81.1059 2 Quetta 68.09 72.39 60.30 54.00 85.6876 3 Sohbatpur 62.23 67.50 57.19 35.00 89.2398 4 Lasbela 53.50 46.81 36.54 50.00 80.6599 5 Kharan 53.48 55.53 48.62 38.93 70.84
101 6 Kech 52.98 56.56 31.68 38.00 85.69102 7 Sibi 52.80 46.04 24.37 70.83 69.96108 8 Mastung 50.48 80.28 25.93 15.00 80.72109 9 Khuzdar 50.44 67.33 41.51 27.00 65.91113 10 Killa Saifullah 49.90 53.79 55.40 25.79 64.64114 11 Nushki 49.30 55.65 22.14 43.00 76.41115 12 Jhal Magsi 49.12 55.87 57.13 32.56 50.94116 13 Loralai 48.88 69.00 45.03 14.82 66.66118 14 Musakhail 47.42 56.56 37.62 17.56 77.96119 15 Panjgur 47.07 74.32 12.20 24.00 77.75122 16 Nasirabad 46.06 39.30 40.42 62.00 42.52123 17 Jaffarabad 45.83 49.46 57.02 23.00 53.85125 18 Pishin 45.08 41.97 45.87 35.00 57.49126 19 Zhob 44.48 48.14 53.76 19.00 57.02128 20 Kalat 43.76 62.46 20.61 29.00 62.98129 21 Ziarat 43.63 56.55 46.72 21.00 50.24134 22 Kohlu 41.93 46.14 39.66 29.00 52.90135 23 Chaghi 41.10 41.72 28.55 32.94 61.21136 24 Washuk 40.45 56.36 13.21 18.84 73.39137 25 Awaran 40.22 59.09 18.14 29.00 54.65138 26 Kachhi 39.12 44.55 37.04 16.00 58.89139 27 Sherani 37.37 43.87 40.68 25.00 39.93
141 28 Harnai 36.57 29.90 20.88 32.00 63.50
142 29 Barkhan 32.48 55.03 17.83 8.00 49.07
143 30 Killa Abdullah 32.07 35.74 16.45 24.93 51.16
144 31 Dera Bugti 30.36 27.76 21.80 18.00 53.88
- Lehri 33.4 39.6 12.0 - 48.6

75Provincial Rankings
FATA
National Rank
Provincial Rank District Education
ScoreEnrolment
ScoreLearning
ScoreRetention
ScoreGender Parity
Score
39 1 FR Kohat 72.77 77.90 74.03 67.00 72.15
73 2 Kurram Agency 63.19 66.57 54.67 56.00 75.50
81 3 Orakzai Agency 58.98 75.29 61.13 28.00 71.50
85 4 FR Bannu 57.33 54.15 56.19 55.25 63.73
94 5 FR Tank 54.57 70.45 26.02 51.00 70.83
100 6 FR Peshawar 53.28 70.52 26.20 55.03 61.39
105 7 Mohmand Agency 52.40 56.62 73.63 31.00 48.37
110 8 Khyber Agency 50.30 66.27 46.80 20.00 68.13
127 9 FR DI Khan 44.08 55.69 51.15 24.53 44.97
131 10 Bajaur Agency 42.42 52.80 36.57 20.00 60.32
145 11 FR Lakki Marwat 29.44 41.60 19.17 19.80 37.20
- -North Waziristan Agency
49.52 - - 36.00 63.04
- -South Waziristan Agency
37.07 - - 17.00 57.14
Gilgit-Baltistan
National Rank
Provincial Rank District Education
ScoreEnrolment
ScoreLearning
ScoreRetention
ScoreGender Parity
Score
19 1 Ghizer 78.66 73.04 61.67 83.56 96.39
27 2 Astor 76.19 68.22 64.66 80.06 91.82
36 3 Skardu 73.27 57.99 49.81 94.22 91.04
44 4 Ghanchi 71.92 66.65 47.43 87.36 86.24
48 5 Gilgit 70.95 56.66 52.23 85.24 89.64
53 6 Hunza Nagar 69.72 69.04 53.38 71.00 85.48
92 7 Diamir 54.82 27.50 82.32 56.00 53.46
- Kharmang - - - - -
- Nagar - - - - -
- Shigar - - - - -
Islamabad Capital Territory
National Rank
Provincial Rank District Education
ScoreEnrolment
ScoreLearning
ScoreRetention
ScoreGender Parity
Score
1 1 Islamabad 85.74 89.52 71.13 87.50 94.82

76 Pakistan District Education Rankings 2016
Khyber Pakhtunkhwa
National Rank
Provincial Rank District Education
ScoreEnrolment
ScoreLearning
ScoreRetention
ScoreGender Parity
Score
8 1 Malakand 81.00 80.89 58.64 87.00 97.48
16 2 Mardan 79.34 83.32 63.99 81.61 88.46
20 3 Haripur 78.44 80.93 59.18 79.00 94.64
28 4 Abbottabad 76.19 80.89 54.34 77.00 92.51
30 5 Nowshera 74.80 79.05 59.85 80.00 80.27
32 6 Swabi 74.18 79.93 50.90 83.00 82.88
47 7 Chitral 71.10 76.41 39.66 79.00 89.32
50 8 Charsadda 70.17 74.81 54.65 66.00 85.20
52 9 Karak 69.81 74.40 50.45 74.00 80.39
54 10 Kohat 69.56 73.63 49.84 73.90 80.89
60 11 Mansehra 67.68 74.20 67.15 50.00 79.36
62 12 Bannu 66.08 64.00 57.63 64.78 77.92
64 13 Lower Dir 65.50 71.80 29.00 74.00 87.20
75 14 Peshawar 62.74 76.90 37.61 63.00 73.45
80 15 Hangu 59.55 69.64 30.87 72.00 65.67
82 16 Lakki Marwat 58.53 62.99 31.75 73.00 66.39
83 17 Swat 58.17 77.13 32.98 49.00 73.56
87 18 Upper Dir 57.05 55.65 39.15 59.25 74.14
88 19 Buner 57.00 77.58 29.83 59.00 61.58
90 20 Dera Ismail Khan 55.49 51.95 37.37 54.00 78.63
103 21 Tor Ghar 52.47 46.26 45.19 45.00 73.44
111 22 Batagram 50.28 60.12 40.59 33.00 67.40
120 23 Shangla 46.89 44.16 27.40 47.00 69.01
132 24 Tank 42.41 47.55 30.42 34.00 57.68
140 25 Kohistan 36.70 37.10 46.63 17.50 45.58

77Provincial Rankings
Punjab
National Rank
Provincial Rank District Education
ScoreEnrolment
ScoreLearning
ScoreRetention
ScoreGender Parity
Score
2 1 Chakwal 84.85 88.90 66.23 88.68 95.57
4 2 Gujrat 82.66 80.19 70.83 87.00 92.63
5 3 Sialkot 82.36 84.61 55.98 90.00 98.84
6 4 Rawalpindi 82.32 77.88 71.13 86.00 94.25
7 5 Attock 81.25 85.94 57.02 86.00 96.04
9 6 Jhelum 80.93 90.79 57.06 85.07 90.78
12 7 Toba Tek Singh 80.20 76.41 71.18 77.00 96.21
14 8 Sheikhupura 79.53 73.58 62.15 89.00 93.39
17 9 Mandi Bahuddin 79.04 81.12 60.20 78.00 96.83
18 10 Faisalabad 78.88 77.55 65.23 77.00 95.72
22 11 Lahore 78.17 76.02 70.42 81.00 85.25
23 12 Layyah 78.16 87.81 62.64 69.00 93.17
25 13 Gujranwala 77.18 74.91 53.43 85.00 95.39
26 14 Narowal 76.34 82.03 68.78 62.00 92.56
29 15 Okara 74.82 80.92 56.21 67.00 95.14
34 16 Hafizabad 73.99 70.27 59.58 68.13 97.99
35 17 Sargodha 73.28 70.85 60.19 68.00 94.08
38 18 Khushab 72.83 69.71 52.38 80.00 89.23
40 19 Kasur 72.53 68.02 56.48 70.00 95.62
41 20 Nankana Sahib 72.39 76.82 69.45 56.00 87.29
42 21 Sahiwal 72.35 73.38 55.33 70.00 90.70
45 22 Mianwali 71.88 70.44 58.90 72.00 86.19
46 23 Bhakkar 71.66 70.29 67.20 59.00 90.17
49 24 Khanewal 70.39 68.79 68.40 57.00 87.35
55 25 Jhang 69.53 68.75 65.20 58.00 86.15
56 26 Pakpattan 69.48 72.74 63.10 51.00 91.10
57 27 Vehari 69.01 69.09 54.95 59.00 93.00
61 28 Chiniot 66.63 68.02 58.93 53.00 86.57
63 29 Lodhran 65.82 59.81 64.82 46.00 92.64
65 30 Bahawalpur 65.34 50.25 62.47 53.00 95.62
66 31 Bahawalnagar 65.03 59.01 57.55 54.00 89.56
68 32 Rahim Yar Khan 64.43 49.69 64.95 53.00 90.10
69 33 Multan 63.89 66.81 43.78 50.00 94.95
78 34 Dera Ghazi Khan 61.02 64.09 60.51 34.00 85.48
86 35 Muzaffargarh 57.19 60.73 50.73 38.00 79.31
112 36 Rajanpur 50.25 52.43 46.08 29.00 73.50

78 Pakistan District Education Rankings 2016
Sindh
National Rank
Provincial Rank District Education
ScoreEnrolment
ScoreLearning
ScoreRetention
ScoreGender Parity
Score
43 1 Karachi 72.18 73.70 67.90 58.00 89.13
51 2 Naushehro Feroze 69.88 70.97 45.55 77.00 85.99
67 3 Dadu 64.62 80.62 42.48 45.00 90.39
70 4 Larkana 63.84 65.37 41.93 62.00 86.08
71 5 Khairpur 63.74 66.51 30.39 74.00 84.07
72 6 Sukkur 63.65 63.36 47.81 61.00 82.45
74 7Shaheed Benazirabad
63.08 64.42 35.43 69.11 83.37
77 8 Hyderabad 61.59 63.60 41.44 60.00 81.34
79 9 Ghotki 60.01 49.29 48.48 62.00 80.30
84 10 Sanghar 57.55 52.31 44.61 55.00 78.29
89 11 Tando Allah Yar 56.74 46.71 35.23 59.00 86.02
91 12 Kashmore-Kandhkot 54.86 41.92 33.06 65.00 79.46
93 13 Shikarpur 54.79 51.29 26.09 61.00 80.77
95 14 Matiari 54.30 51.75 28.28 52.00 85.15
96 15 Jamshoro 54.01 61.65 30.47 43.00 80.93
97 16 Kambar-Shahdadkot 53.81 58.31 33.49 36.00 87.43
104 17 Badin 52.44 45.84 33.91 47.00 82.99
106 18 Mirpurkhas 52.20 52.52 36.71 42.00 77.56
107 19 Umerkot 52.15 51.71 33.03 36.00 87.87
117 20Tando Muhammad Khan
48.57 35.28 39.22 43.67 76.11
121 21 Tharparkar 46.70 54.23 32.30 26.00 74.27
124 22 Jacobabad 45.21 47.37 24.20 39.00 70.28
130 23 Sujawal 43.03 47.75 34.46 20.00 69.91
133 24 Thatta 42.23 37.22 34.77 18.00 78.94

79Provincial Rankings
School Infrastructure Score RankingsAzad Jammu and Kashmir
National Rank
Provincial Rank District
School Infrastructure
Score
Availability ofBuilding Condition
SatisfactoryElectricity Drinking Water Toilet Boundary
Wall96 1 Mirpur 36.29 41.32 34.93 28.31 40.64 36.25
100 2 Muzaffarabad 34.29 11.70 27.93 49.45 40.09 42.28111 3 Bagh 28.32 7.78 28.53 41.79 26.51 36.99117 4 Hattian 25.62 3.58 16.49 37.99 32.97 37.05121 5 Bhimber 24.64 19.08 31.40 16.67 22.46 33.57124 6 Neelum 21.04 3.23 27.65 27.19 12.90 34.25138 7 Poonch 14.88 2.67 12.10 27.58 6.23 25.80140 8 Haveli 14.40 2.09 19.90 17.28 6.28 26.46141 9 Kotli 14.14 7.65 14.51 15.17 10.03 23.32145 10 Sudhnutti 6.76 0.85 4.23 7.89 3.94 16.90
Balochistan
National Rank
Provincial Rank District
School Infrastructure
Score
Availability ofBuilding Condition
SatisfactoryElectricity Drinking Water Toilet Boundary
Wall85 1 Nushki 40.34 63.25 48.19 45.18 38.55 6.5486 2 Quetta 39.71 27.18 56.67 34.87 47.69 32.1588 3 Harnai 38.61 25.34 28.77 39.73 58.22 41.0197 4 Mastung 36.27 11.55 38.61 31.68 67.00 32.53102 5 Chaghi 34.15 4.69 34.27 34.27 49.30 48.24104 6 Gwadar 33.00 28.11 58.53 22.58 47.93 7.85105 7 Killa Abdullah 32.96 23.29 57.99 15.07 46.58 21.88107 8 Sherani 30.78 20.73 39.63 32.93 40.24 20.38110 9 Kalat 28.35 22.31 36.09 23.81 48.87 10.69112 10 Loralai 28.09 37.54 40.34 13.24 29.13 20.20115 11 Pishin 26.07 20.07 43.53 19.35 32.77 14.63116 12 Kharan 25.81 58.47 34.97 7.65 21.86 6.11118 13 Lasbela 25.43 16.22 32.43 28.96 34.17 15.37120 14 Jaffarabad 24.66 35.01 27.57 1.61 24.14 34.95122 15 Kohlu 24.62 39.85 25.50 1.24 19.80 36.72125 16 Khuzdar 20.71 13.00 30.59 19.49 28.21 12.25126 17 Barkhan 19.99 8.88 17.05 0.89 33.57 39.53128 18 Zhob 19.83 18.24 27.70 7.77 28.04 17.41130 19 Ziarat 19.31 3.20 17.35 15.53 37.90 22.58131 20 Nasirabad 18.77 37.61 13.72 9.51 18.36 14.67132 21 Washuk 18.69 23.23 31.61 1.94 16.13 20.53133 22 Sibi 18.45 29.61 29.13 23.79 6.80 2.94134 23 Musakhail 18.43 9.85 31.82 7.20 35.61 7.66135 24 Sohbatpur 16.55 19.61 26.61 14.29 16.25 5.99136 25 Kech 16.13 16.34 38.58 14.17 6.50 5.07137 26 Killa Saifullah 15.93 17.56 26.43 7.76 18.11 9.77139 27 Jhal Magsi 14.74 30.77 22.27 6.48 10.93 3.27142 28 Panjgur 13.12 6.27 10.66 6.58 34.80 7.28143 29 Awaran 10.80 0.46 21.66 2.76 24.88 4.23144 30 Kachhi 7.67 6.14 19.44 5.37 1.79 5.61146 31 Dera Bugti 5.49 3.74 15.65 0.68 1.02 6.36
- - Lehri - - - - - -

80 Pakistan District Education Rankings 2016
Federally Administered Tribal Areas
National Rank
Provincial Rank District
School Infrastructure
Score
Availability of Building Condition SatisfactoryElectricity Drinking
Water Toilet Boundary Wall
67 1 FR Peshawar 57.66 59.33 66.00 57.33 82.00 23.65
74 2 FR Tank 49.54 43.39 36.51 48.15 76.72 42.94
75 3 FR Bannu 49.13 53.85 45.30 32.19 74.64 39.69
82 4 Khyber Agency 42.26 44.72 42.39 33.85 57.30 33.02
84 5 FR Kohat 40.95 42.18 38.78 32.65 72.79 18.37
89 6 FR DI Khan 38.35 37.88 20.45 31.06 59.85 42.52
91 7 Bajaur Agency 37.33 33.66 28.99 32.68 59.73 31.58
92 8 FR Lakki Marwat 37.20 21.88 28.13 31.25 66.67 38.10
99 9 Kurram Agency 35.51 46.11 33.27 28.60 58.17 11.42
106 10 Mohmand Agency 31.87 31.11 27.88 27.47 51.31 21.56
109 11South Waziristan Agency
29.59 34.44 26.35 33.81 44.60 8.76
123 12 Orakzai Agency 23.62 23.95 22.79 12.79 37.44 21.13
- -North Waziristan Agency
70.26 75.79 80.41 53.41 71.41 -
Gilgit-Baltistan
National Rank
Provincial Rank District
School Infrastructure
Score
Availability ofBuilding Condition
SatisfactoryElectricity Drinking Water Toilet Boundary
Wall
59 1 Hunza Nagar 62.55 60.98 73.17 75.61 85.37 17.65
60 2 Ghizer 62.37 72.88 76.27 86.44 61.02 15.25
66 3 Gilgit 58.44 63.64 57.14 80.52 76.62 14.29
79 4 Diamir 44.64 50.00 70.87 12.14 44.66 45.54
95 5 Skardu 36.33 35.34 39.58 25.44 61.13 20.14
108 6 Ghanchi 29.85 28.36 34.33 31.34 47.76 7.46
113 7 Astor 26.25 17.19 28.13 37.50 31.25 17.19
- - Kharmang - - - - - -
- - Nagar - - - - - -
- - Shigar - - - - - -
Islamabad Capital Territory
National Rank
Provincial Rank District
School Infrastructure
Score
Availability ofBuilding Condition
SatisfactoryElectricity Drinking Water Toilet Boundary
Wall
37 1 Islamabad 86.60 98.43 92.67 95.29 96.86 49.74

81Provincial Rankings
Khyber Pakhtunkhwa
National Rank
Provincial Rank District
School Infrastructure
Score
Availability ofBuilding Condition
SatisfactoryElectricity Drinking Water Toilet Boundary
Wall
23 1 Mardan 90.22 81.22 93.55 91.87 99.86 84.58
30 2 Kohat 87.80 73.04 74.25 95.78 99.40 96.54
33 3 Swabi 87.44 85.81 83.80 94.73 92.33 80.54
34 4 Charsadda 87.43 70.33 85.71 94.41 96.80 89.91
38 5 Malakand 84.51 86.32 73.53 86.68 86.15 89.88
41 6 Peshawar 83.02 59.43 80.19 92.45 96.42 86.60
42 7 Nowshera 82.52 73.60 72.82 92.85 93.50 79.84
44 8 Buner 76.34 61.91 71.31 85.25 86.39 76.82
45 9 Bannu 76.27 72.29 68.26 78.76 87.24 74.80
46 10 Lower Dir 73.58 68.78 50.60 82.92 77.92 87.69
47 11 Lakki Marwat 73.45 70.04 61.09 79.42 80.70 76.01
48 12 Hangu 73.41 47.56 59.15 86.59 86.28 87.50
49 13 Tank 73.41 65.90 52.72 90.54 93.12 64.76
50 14 Dera Ismail Khan 72.61 49.96 67.99 82.38 79.47 83.27
51 15 Swat 70.67 56.69 61.23 76.74 67.01 91.66
54 16 Haripur 68.83 58.72 61.20 78.02 73.37 72.86
55 17 Chitral 65.88 33.84 69.97 67.38 62.20 96.04
56 18 Karak 64.94 42.99 49.16 69.24 80.69 82.63
62 19 Abbottabad 61.00 29.80 54.25 66.78 61.04 93.14
63 20 Mansehra 60.26 34.63 51.38 60.40 57.27 97.59
64 21 Upper Dir 59.85 25.28 38.79 80.55 70.38 84.26
71 22 Shangla 54.69 22.39 37.65 67.99 58.87 86.57
73 23 Batagram 52.55 13.46 40.11 63.46 47.94 97.80
90 24 Tor Ghar 38.25 2.43 21.84 38.35 43.20 85.44
94 25 Kohistan 36.90 3.59 50.16 27.98 28.51 74.23

82 Pakistan District Education Rankings 2016
Punjab
National Rank
Provincial Rank District
School Infrastructure
Score
Availability ofBuilding Condition
SatisfactoryElectricity Drinking Water Toilet Boundary
Wall
1 1 Vehari 94.85 93.28 99.33 97.89 98.08 85.65
2 2 Faisalabad 94.59 95.82 99.63 98.51 94.11 84.86
3 3 Gujrat 94.46 94.01 98.88 97.06 97.26 85.10
4 4 Chakwal 94.23 87.48 97.07 97.60 96.01 93.01
5 5 Lahore 94.21 98.05 99.10 96.55 98.65 78.71
6 6 Chiniot 93.92 93.63 99.81 96.82 95.88 83.46
7 7 Jhelum 93.89 92.69 97.26 97.81 97.07 84.62
8 8 Khanewal 93.85 90.79 98.64 97.70 98.37 83.74
9 9 Kasur 93.36 91.91 98.99 96.51 94.58 84.83
10 10 Toba Tek Singh 93.25 94.17 99.72 98.19 88.33 85.83
11 11 Pakpattan 93.09 91.29 97.30 98.35 95.95 82.58
12 12 Sahiwal 92.74 98.18 99.72 97.91 87.29 80.59
13 13 Mandi Bahuddin 92.72 92.23 99.47 96.11 93.64 82.14
14 14 Multan 92.58 88.58 99.11 95.37 96.85 82.99
15 15 Sialkot 92.38 88.91 97.70 95.81 96.08 83.39
16 16 Okara 92.07 86.27 98.27 97.18 91.45 87.18
17 17 Attock 92.02 86.74 95.31 96.13 95.19 86.74
18 18 Muzaffargarh 91.96 87.09 98.90 95.93 95.70 82.18
19 19 Lodhran 91.77 85.71 97.42 96.73 99.31 79.69
20 20 Gujranwala 91.22 85.89 98.62 95.61 94.32 81.66
21 21 Sargodha 91.07 87.50 98.73 96.11 89.75 83.27
22 22 Bahawalpur 90.67 82.70 98.24 96.87 90.73 84.82
24 23 Hafizabad 90.18 75.37 97.98 93.20 96.51 87.87
25 24 Layyah 89.71 73.88 99.61 97.02 96.00 82.04
26 25 Nankana Sahib 89.61 84.54 98.63 95.69 93.74 75.44
27 26 Sheikhupura 88.83 79.98 97.84 94.17 92.58 79.58
28 27 Narowal 88.35 72.85 97.82 94.92 91.19 84.94
29 28 Bhakkar 88.16 74.01 99.32 97.58 87.25 82.66
31 29 Bahawalnagar 87.47 77.30 96.90 93.90 86.50 82.74
32 30 Jhang 87.46 79.37 99.38 95.00 83.22 80.32
35 31 Rawalpindi 86.96 80.88 92.03 95.06 85.82 81.03
36 32 Mianwali 86.71 76.94 95.05 94.70 90.64 76.24
39 33 Rahim Yar Khan 83.58 63.85 95.72 90.56 90.19 77.60
40 34 Rajanpur 83.32 58.39 96.58 91.06 89.35 81.21
43 35 Khushab 82.07 68.73 90.56 93.10 85.21 72.77
53 36 Dera Ghazi Khan 68.84 41.84 84.51 74.26 72.40 71.19

83Provincial Rankings
Sindh
National Rank
Provincial Rank District
School Infrastructure
Score
Availability ofBuilding Condition
SatisfactoryElectricity Drinking Water Toilet Boundary
Wall
52 1 Larkana 69.98 50.10 78.97 76.65 89.44 54.75
57 2 Karachi 64.84 67.61 58.38 70.58 87.01 40.65
58 3 Hyderabad 64.72 68.86 57.89 78.46 80.11 38.27
61 4 Matiari 62.10 63.24 61.73 74.33 79.11 32.08
65 5Shaheed Benazirabad
58.68 62.23 69.13 57.45 66.06 38.52
68 6 Naushehro Feroze 56.94 54.39 84.31 56.71 56.52 32.76
69 7 Sukkur 56.22 54.18 72.09 63.36 66.09 25.36
70 8 Tando Allah Yar 55.39 56.20 50.54 62.53 77.36 30.32
72 9 Khairpur 54.37 54.60 77.23 63.73 55.46 20.82
76 10 Jamshoro 48.86 46.98 32.96 59.19 81.91 23.28
77 11 Shikarpur 48.30 38.36 60.70 56.27 71.27 14.92
78 12 Dadu 47.56 45.42 42.17 52.03 65.46 32.71
80 13 Ghotki 44.63 19.08 73.48 49.81 54.95 25.81
81 14Tando Muhammad Khan
43.01 20.21 53.37 50.95 59.47 31.05
83 15 Sanghar 41.03 23.62 48.60 46.26 56.60 30.09
87 16Kambar-Shahdadkot
39.37 35.88 31.73 44.59 60.09 24.54
93 17 Badin 36.90 22.51 32.78 53.65 44.92 30.65
98 18 Umerkot 35.73 20.00 23.22 54.62 52.02 28.80
101 19 Mirpurkhas 34.28 22.90 30.40 47.77 43.82 26.49
103 20 Jacobabad 33.77 35.74 35.44 43.27 44.09 10.31
114 21 Tharparkar 26.07 3.58 14.90 33.02 37.40 41.46
119 22 Kashmore-Kandhkot 25.14 10.12 48.46 24.48 34.24 8.40
127 23 Sujawal 19.91 7.12 12.78 24.12 27.71 27.83
129 24 Thatta 19.77 1.83 5.91 35.16 45.92 10.06

REGIONAL PROFILES
Cannot read a story in Urdu4
Cannot read a sentence in English4
Cannot do two digit division Learning
outcomes3
AlifAilaan
GirlsBoys TotalOut-of-schoolchildren2
Neverattended
school5
Students enrolledin private schools
Students enrolledin government schools
Government school Private school
Average number of years spent in school6
Dropout rate atprimary level Girls TotalBoys
Number of Teachers Gender distributionNumber of schools Gender distribution1
SchoolsGirls
schoolsBoys
schoolsMiddleschools
Secondaryschools
Primaryschools
Highersecondary
schools
Education score
Number of Teachers Gender distributionNumber of teachers Gender distribution
TeachersPrimaryschools
Secondaryschools
Middleschools
Highersecondary
schoolsMale
teachersFemale teachers
Azad Jammu & Kashmir
Provincial ranking
1. This is sum of primary, middle, high and higher secondary schools only2. Children between the ages of 5-16 years3. For Class 5 students4. Text meant for Class 2 students5. Age 15 years and above6. Age 18-35 years
- Female- Male - Total
- % Female- % Male - % Total
75% 25%
5% 8%11%
31% 30% 39%
52%48% 50%
8,479 6,863 11,096 1,143 15,842 11,739
4,202 1,011 718 54 3,226 2,759
81.68 2/8
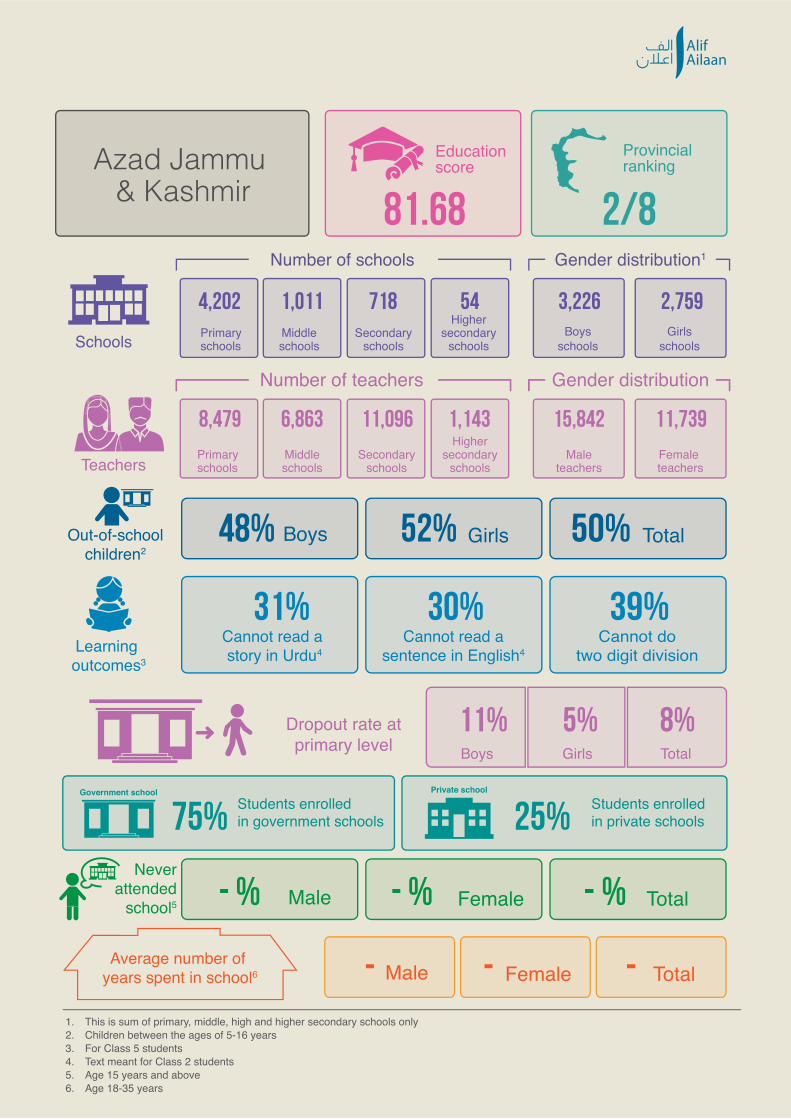

AlifAilaan
7. This data is for primary schools only8. The basic facilities include: boundary wall, drinking water, electricity and toilet
Secretary Education Name: Raja Muhammad Abbas KhanTelephone:
Additional Secretary Name: Ch. Muhammad YounasTelephone: 058-22960826
Classroom school ratio in primary schoolsPrimary schools with single classroom
Pupil teacher ratio in primary schools
Primary schools with single teacher
Teacher school ratio in primary schools
Girls schools where infrastructure facilities are not available7:
Schools where infrastructure facilities are not available7:
Electricity ToiletBoundary wall
School infrastructurescore
Schools with unsatisfactory building condition
Schools with all basic facilities8
Schools without any basic facilities8
Boundary wall Toilet
Azad Jammu & Kashmir
Provincial ranking
Drinkingwater
24:1 7%2:1
1:117%
69% 38%14%
89%79% 73%79%
76% 68%
22.33 8/8
Cannot read a story in Urdu4
Cannot read a sentence in English4
Cannot do two digit division Learning
outcomes3
AlifAilaan
GirlsBoys TotalOut-of-schoolchildren2
Neverattended
school5
Students enrolledin private schools
Students enrolledin government schools
Government school Private school
Average number of years spent in school6
Dropout rate atprimary level Girls TotalBoys
Number of Teachers Gender distributionNumber of schools Gender distribution1
SchoolsGirls
schoolsBoys
schoolsMiddleschools
Secondaryschools
Primaryschools
Highersecondary
schools
Education score
Number of Teachers Gender distributionNumber of teachers Gender distribution
TeachersPrimaryschools
Secondaryschools
Middleschools
Highersecondary
schoolsMale
teachersFemale teachers
Balochistan
1. This is sum of primary, middle, high and higher secondary schools only2. Children between the ages of 5-16 years3. For Class 5 students4. Text meant for Class 2 students5. Age 15 years and above6. Age 18-35 years
Provincial ranking
2 Female5 Male 4 Total
83% Female46% Male 64% Total
90% 10%
73% 72%71%
56% 61% 57%
75%65% 70%
16,878 11,025 16,439 1,539 30,594 15,287
11,167 1,233 836 43 9,399 3,880
51.04 8/8

AlifAilaan
7. This data is for primary schools only8. The basic facilities include: boundary wall, drinking water, electricity and toilet
Secretary Education Name: Raja Muhammad Abbas KhanTelephone:
Additional Secretary Name: Ch. Muhammad YounasTelephone: 058-22960826
Classroom school ratio in primary schoolsPrimary schools with single classroom
Pupil teacher ratio in primary schools
Primary schools with single teacher
Teacher school ratio in primary schools
Girls schools where infrastructure facilities are not available7:
Schools where infrastructure facilities are not available7:
Electricity ToiletBoundary wall
School infrastructurescore
Schools with unsatisfactory building condition
Schools with all basic facilities8
Schools without any basic facilities8
Boundary wall Toilet
Azad Jammu & Kashmir
Provincial ranking
Drinkingwater
24:1 7%2:1
1:117%
69% 38%14%
89%79% 73%79%
76% 68%
22.33 8/8
Cannot read a story in Urdu4
Cannot read a sentence in English4
Cannot do two digit division Learning
outcomes3
AlifAilaan
GirlsBoys TotalOut-of-schoolchildren2
Neverattended
school5
Students enrolledin private schools
Students enrolledin government schools
Government school Private school
Average number of years spent in school6
Dropout rate atprimary level Girls TotalBoys
Number of Teachers Gender distributionNumber of schools Gender distribution1
SchoolsGirls
schoolsBoys
schoolsMiddleschools
Secondaryschools
Primaryschools
Highersecondary
schools
Education score
Number of Teachers Gender distributionNumber of teachers Gender distribution
TeachersPrimaryschools
Secondaryschools
Middleschools
Highersecondary
schoolsMale
teachersFemale teachers
Balochistan
1. This is sum of primary, middle, high and higher secondary schools only2. Children between the ages of 5-16 years3. For Class 5 students4. Text meant for Class 2 students5. Age 15 years and above6. Age 18-35 years
Provincial ranking
2 Female5 Male 4 Total
83% Female46% Male 64% Total
90% 10%
73% 72%71%
56% 61% 57%
75%65% 70%
16,878 11,025 16,439 1,539 30,594 15,287
11,167 1,233 836 43 9,399 3,880
51.04 8/8
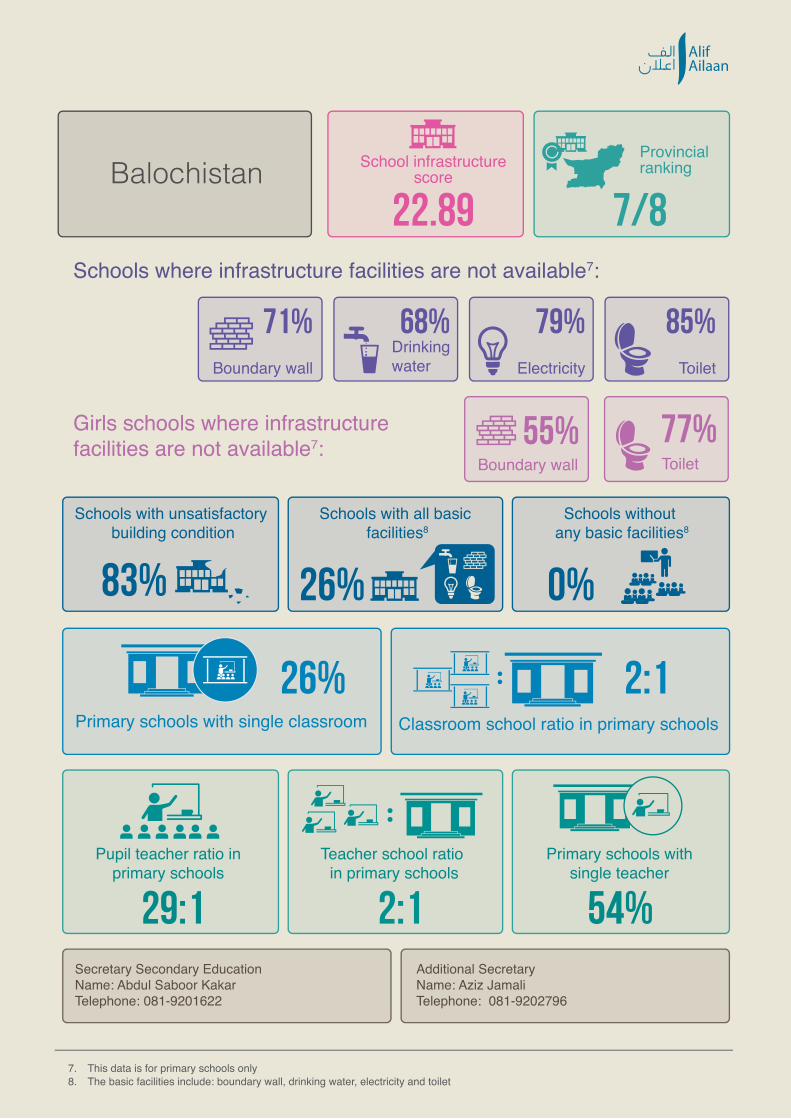
AlifAilaan
7. This data is for primary schools only8. The basic facilities include: boundary wall, drinking water, electricity and toilet
Secretary Secondary Education Name: Abdul Saboor KakarTelephone: 081-9201622
Additional Secretary Name: Aziz JamaliTelephone: 081-9202796
Classroom school ratio in primary schoolsPrimary schools with single classroom
Pupil teacher ratio in primary schools
Primary schools with single teacher
Teacher school ratio in primary schools
Girls schools where infrastructure facilities are not available7:
Schools where infrastructure facilities are not available7:
Electricity ToiletBoundary wall
School infrastructurescore
Schools with unsatisfactory building condition
Schools with all basic facilities8
Schools without any basic facilities8
Boundary wall Toilet
BalochistanProvincial ranking
Drinkingwater
29:1 54%2:1
2:126%
83% 0%26%
79%68% 85%71%
55% 77%
22.89 7/8
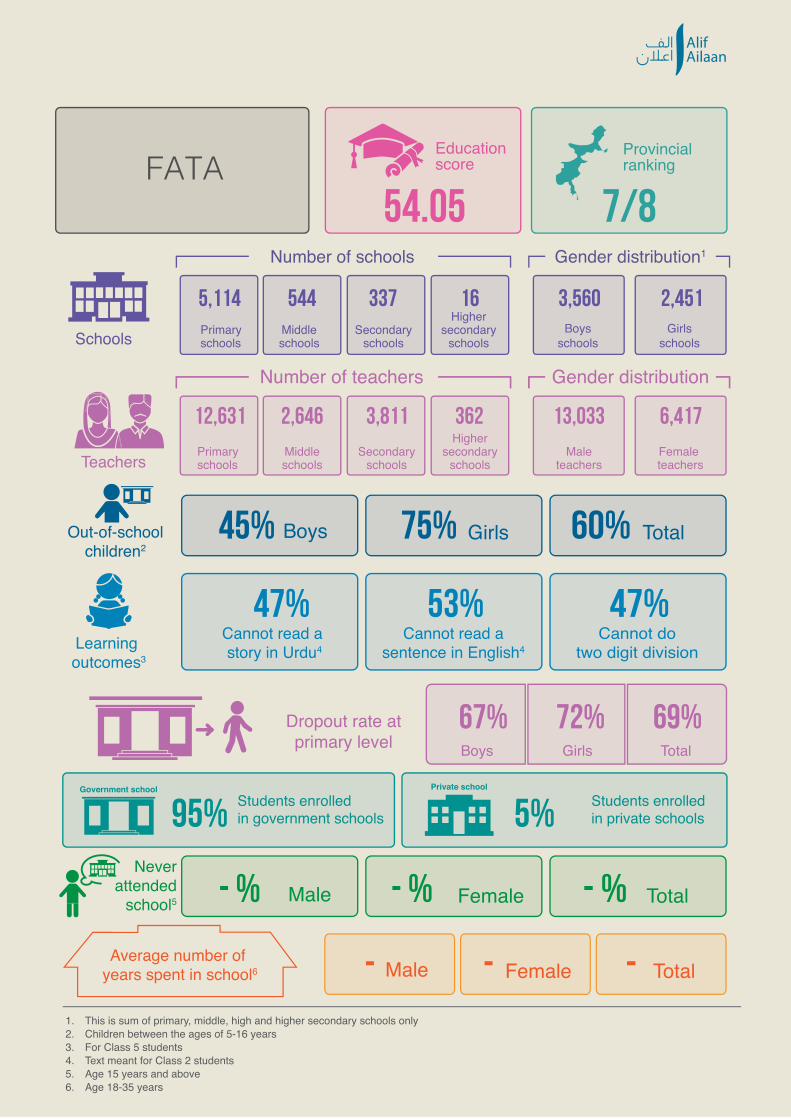
Cannot read a story in Urdu4
Cannot read a sentence in English4
Cannot do two digit division Learning
outcomes3
AlifAilaan
GirlsBoys TotalOut-of-schoolchildren2
Neverattended
school5
Students enrolledin private schools
Students enrolledin government schools
Government school Private school
Average number of years spent in school6
Dropout rate atprimary level Girls TotalBoys
Number of Teachers Gender distributionNumber of schools Gender distribution1
SchoolsGirls
schoolsBoys
schoolsMiddleschools
Secondaryschools
Primaryschools
Highersecondary
schools
Education score
Number of Teachers Gender distributionNumber of teachers Gender distribution
TeachersPrimaryschools
Secondaryschools
Middleschools
Highersecondary
schoolsMale
teachersFemale teachers
FATA
1. This is sum of primary, middle, high and higher secondary schools only2. Children between the ages of 5-16 years3. For Class 5 students4. Text meant for Class 2 students5. Age 15 years and above6. Age 18-35 years
Provincial ranking
- Female- Male - Total
- % Female- % Male - % Total
95% 5%
72% 69%67%
47% 53% 47%
75%45% 60%
12,631 2,646 3,811 362 13,033 6,417
5,114 544 337 16 3,560 2,451
54.05 7/8

AlifAilaan
7. This data is for primary schools only8. The basic facilities include: boundary wall, drinking water, electricity and toilet
Secretary Social SectorName: Waqar-ul-HaqTelephone: 091-9210166
Additional Chief SecretaryName: Muhammad Aslam KambohTelephone: 091-9210166
Classroom school ratio in primary schoolsPrimary schools with single classroom
Pupil teacher ratio in primary schools
Primary schools with single teacher
Teacher school ratio in primary schools
Girls schools where infrastructure facilities are not available7:
Schools where infrastructure facilities are not available7:
Electricity ToiletBoundary wall
School infrastructurescore
Schools with unsatisfactory building condition
Schools with all basic facilities8
Schools without any basic facilities8
Boundary wall Toilet
FATAProvincial ranking
Drinkingwater
41:1 7%2:1
2:12%
71% 20%27%
55%59% 65%41%
22% 44%
41.73 6/8
Cannot read a story in Urdu4
Cannot read a sentence in English4
Cannot do two digit division Learning
outcomes3
AlifAilaan
GirlsBoys TotalOut-of-schoolchildren2
Neverattended
school5
Students enrolledin private schools
Students enrolledin government schools
Government school Private school
Average number of years spent in school6
Dropout rate atprimary level Girls TotalBoys
Number of Teachers Gender distributionNumber of schools Gender distribution1
SchoolsGirls
schoolsBoys
schoolsMiddleschools
Secondaryschools
Primaryschools
Highersecondary
schools
Education score
Number of Teachers Gender distributionNumber of teachers Gender distribution
TeachersPrimaryschools
Secondaryschools
Middleschools
Highersecondary
schoolsMale
teachersFemale teachers
1. This is sum of primary, middle, high and higher secondary schools only2. Children between the ages of 5-16 years3. For Class 5 students4. Text meant for Class 2 students5. Age 15 years and above6. Age 18-35 years
Provincial ranking
- Female- Male - Total
- % Female- % Male - % Total
70% 30%
12% 13%15%
41% 38% 41%
53%46% 50%
1,992 1,932 2,536 267 4,458 2,269
797 274 189 15 859 416
73.21 4/8Gilgit-Baltistan
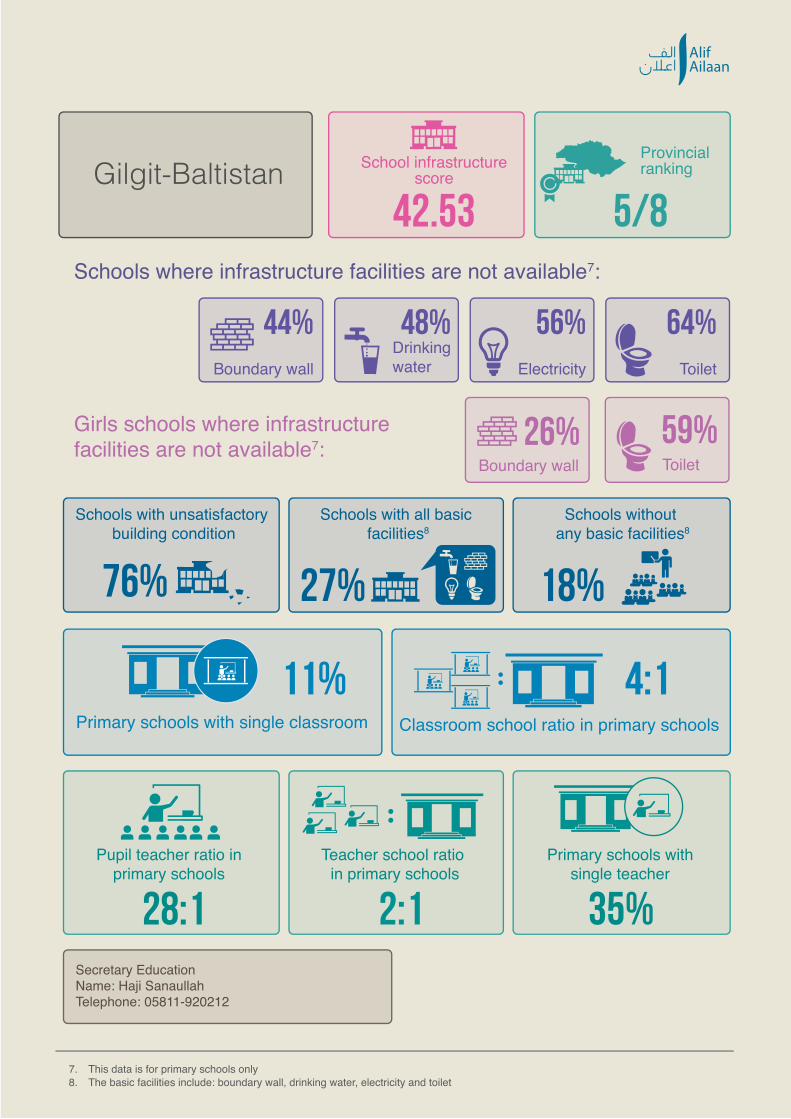
AlifAilaan
7. This data is for primary schools only8. The basic facilities include: boundary wall, drinking water, electricity and toilet
Secretary Education Name: Haji SanaullahTelephone: 05811-920212
Classroom school ratio in primary schoolsPrimary schools with single classroom
Pupil teacher ratio in primary schools
Primary schools with single teacher
Teacher school ratio in primary schools
Girls schools where infrastructure facilities are not available7:
Schools where infrastructure facilities are not available7:
Electricity ToiletBoundary wall
School infrastructurescore
Schools with unsatisfactory building condition
Schools with all basic facilities8
Schools without any basic facilities8
Boundary wall Toilet
Provincial ranking
Drinkingwater
28:1 35%2:1
4:111%
76% 18%27%
56%48% 64%44%
26% 59%
42.53 5/8Gilgit-Baltistan
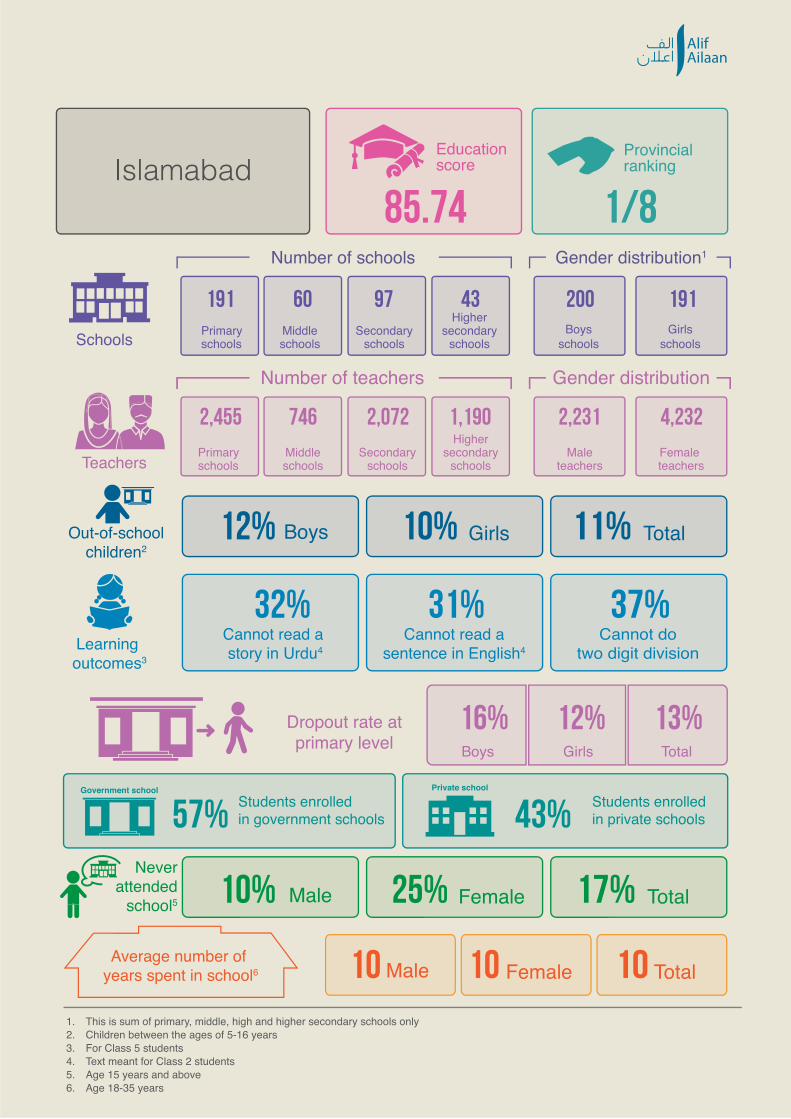
Cannot read a story in Urdu4
Cannot read a sentence in English4
Cannot do two digit division Learning
outcomes3
AlifAilaan
GirlsBoys TotalOut-of-schoolchildren2
Neverattended
school5
Students enrolledin private schools
Students enrolledin government schools
Government school Private school
Average number of years spent in school6
Dropout rate atprimary level Girls TotalBoys
Number of Teachers Gender distributionNumber of schools Gender distribution1
SchoolsGirls
schoolsBoys
schoolsMiddleschools
Secondaryschools
Primaryschools
Highersecondary
schools
IslamabadEducation score
Number of Teachers Gender distributionNumber of teachers Gender distribution
TeachersPrimaryschools
Secondaryschools
Middleschools
Highersecondary
schoolsMale
teachersFemale teachers
1. This is sum of primary, middle, high and higher secondary schools only2. Children between the ages of 5-16 years3. For Class 5 students4. Text meant for Class 2 students5. Age 15 years and above6. Age 18-35 years
Provincial ranking
10 Female10 Male 10 Total
25% Female10% Male 17% Total
57% 43%
12% 13%16%
32% 31% 37%
10%12% 11%
2,455 746 2,072 1,190 2,231 4,232
191 60 97 43 200 191
85.74 1/8

AlifAilaan
7. This data is for primary schools only8. The basic facilities include: boundary wall, drinking water, electricity and toilet
Secretary CADDName: Hassan IqbalTelephone: 051-9211622
Director General FDEName: Dr. Shahnaz RiazTelephone: 051-9260230
Islamabad
Classroom school ratio in primary schoolsPrimary schools with single classroom
Pupil teacher ratio in primary schools
Primary schools with single teacher
Teacher school ratio in primary schools
Girls schools where infrastructure facilities are not available7:
Schools where infrastructure facilities are not available7:
Electricity ToiletBoundary wall
Islamabad School infrastructurescore
Schools with unsatisfactory building condition
Schools with all basic facilities8
Schools without any basic facilities8
Boundary wall Toilet
Provincial ranking
Drinkingwater
19:1 0%13:1
9:11%
50% 0%88%
2%7% 5%3%
1% 5%
86.60 2/8
Cannot read a story in Urdu4
Cannot read a sentence in English4
Cannot do two digit division Learning
outcomes3
AlifAilaan
GirlsBoys TotalOut-of-schoolchildren2
Neverattended
school5
Students enrolledin private schools
Students enrolledin government schools
Government school Private school
Average number of years spent in school6
Dropout rate atprimary level Girls TotalBoys
Number of Teachers Gender distributionNumber of schools Gender distribution1
SchoolsGirls
schoolsBoys
schoolsMiddleschools
Secondaryschools
Primaryschools
Highersecondary
schools
Education score
Number of Teachers Gender distributionNumber of teachers Gender distribution
TeachersPrimaryschools
Secondaryschools
Middleschools
Highersecondary
schoolsMale
teachersFemale teachers
Khyber Pakhtunkhwa
1. This is sum of primary, middle, high and higher secondary schools only2. Children between the ages of 5-16 years3. For Class 5 students4. Text meant for Class 2 students5. Age 15 years and above6. Age 18-35 years
Provincial ranking
3 Female8 Male 5 Total
72% Female33% Male 54% Total
69% 31%
46% 35%25%
53% 50% 52%
52%21% 36%
72,121 15,232 26,401 9,537 80,027 43,264
23,022 2,642 2,108 406 17,649 10,529
65.32 5/8
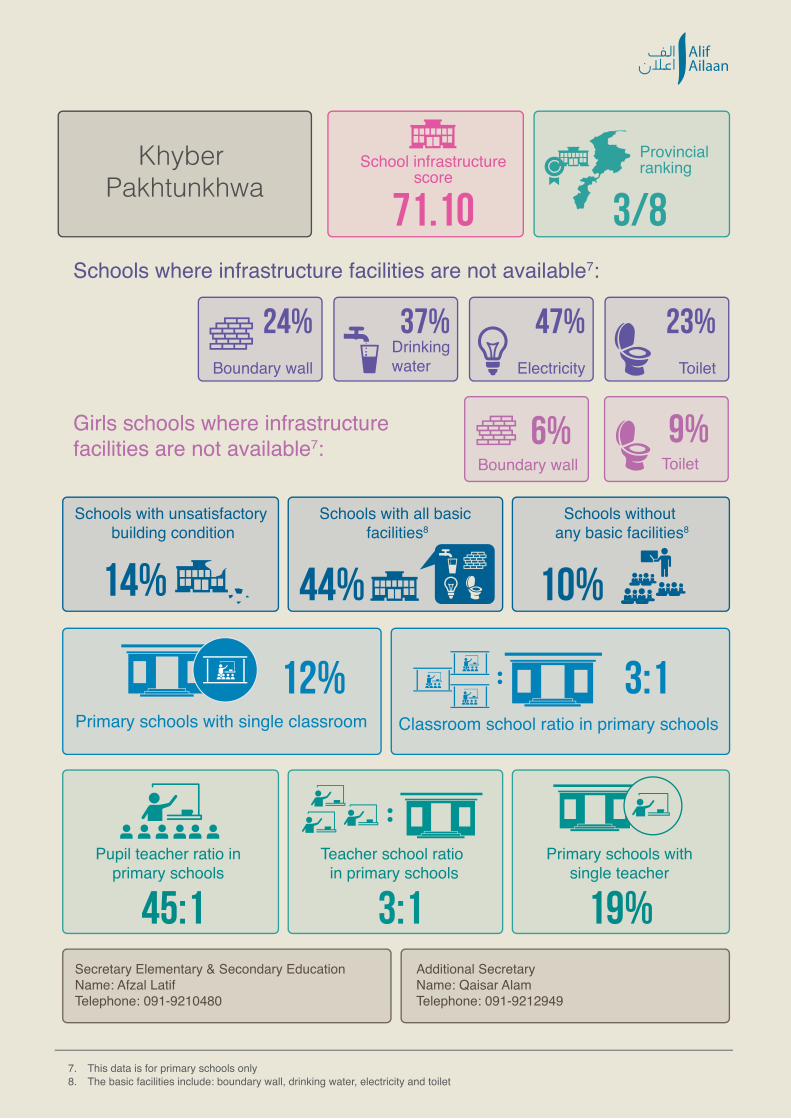
AlifAilaan
7. This data is for primary schools only8. The basic facilities include: boundary wall, drinking water, electricity and toilet
Secretary Elementary & Secondary EducationName: Afzal LatifTelephone: 091-9210480
Additional SecretaryName: Qaisar AlamTelephone: 091-9212949
Classroom school ratio in primary schoolsPrimary schools with single classroom
Pupil teacher ratio in primary schools
Primary schools with single teacher
Teacher school ratio in primary schools
Girls schools where infrastructure facilities are not available7:
Schools where infrastructure facilities are not available7:
Electricity ToiletBoundary wall
School infrastructurescore
Schools with unsatisfactory building condition
Schools with all basic facilities8
Schools without any basic facilities8
Boundary wall Toilet
Provincial rankingKhyber
Pakhtunkhwa
Drinkingwater
45:1 19%3:1
3:112%
14% 10%44%
47%37% 23%24%
6% 9%
71.10 3/8
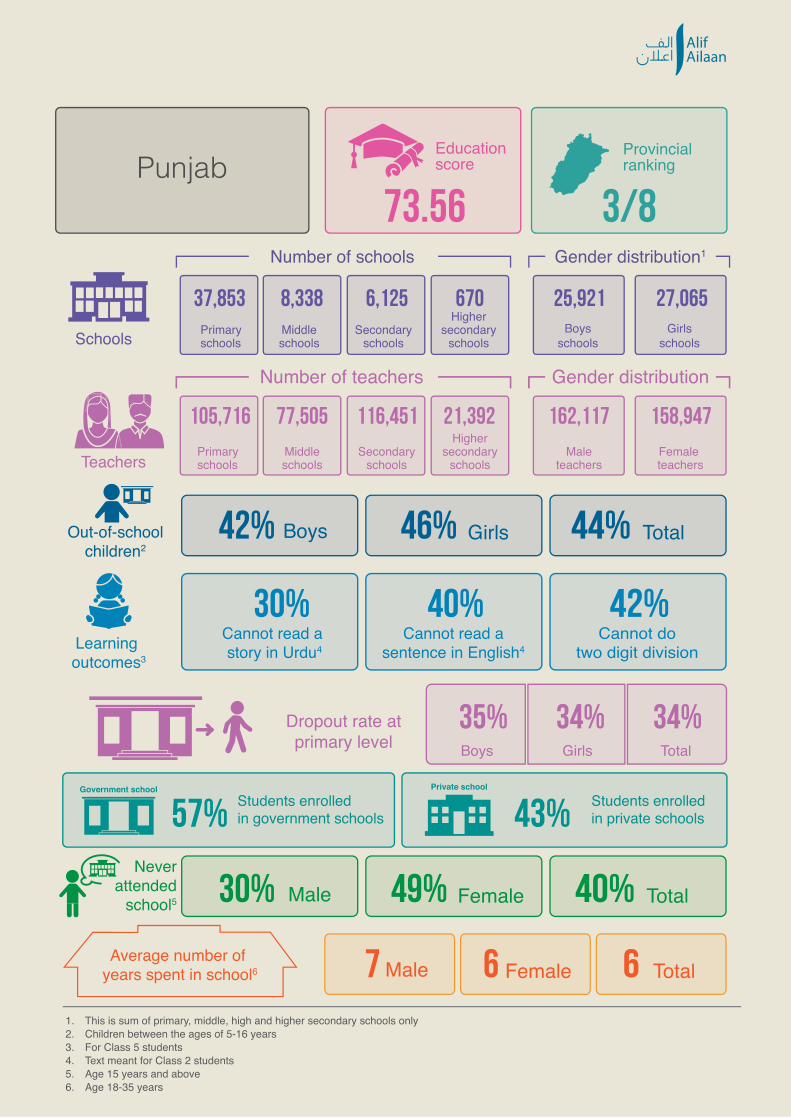
Cannot read a story in Urdu4
Cannot read a sentence in English4
Cannot do two digit division Learning
outcomes3
AlifAilaan
GirlsBoys TotalOut-of-schoolchildren2
Neverattended
school5
Students enrolledin private schools
Students enrolledin government schools
Government school Private school
Average number of years spent in school6
Dropout rate atprimary level Girls TotalBoys
Number of Teachers Gender distributionNumber of schools Gender distribution1
SchoolsGirls
schoolsBoys
schoolsMiddleschools
Secondaryschools
Primaryschools
Highersecondary
schools
Education score
Number of Teachers Gender distributionNumber of teachers Gender distribution
TeachersPrimaryschools
Secondaryschools
Middleschools
Highersecondary
schoolsMale
teachersFemale teachers
Punjab
1. This is sum of primary, middle, high and higher secondary schools only2. Children between the ages of 5-16 years3. For Class 5 students4. Text meant for Class 2 students5. Age 15 years and above6. Age 18-35 years
Provincial ranking
6 Female7 Male 6 Total
49% Female30% Male 40% Total
57% 43%
34% 34%35%
30% 40% 42%
46%42% 44%
105,716 77,505 116,451 21,392 162,117 158,947
37,853 8,338 6,125 670 25,921 27,065
73.56 3/8

AlifAilaan
7. This data is for primary schools only8. The basic facilities include: boundary wall, drinking water, electricity and toilet
Secretary School EducationName: Abdul Jabbar ShaheenTelephone: 042-9210039
Special Secretary School EducationName: Imran Sikandar BalochTelephone: 042-9210039
Classroom school ratio in primary schoolsPrimary schools with single classroom
Pupil teacher ratio in primary schools
Primary schools with single teacher
Teacher school ratio in primary schools
Girls schools where infrastructure facilities are not available7:
Schools where infrastructure facilities are not available7:
Electricity ToiletBoundary wall
School infrastructurescore
Schools with unsatisfactory building condition
Schools with all basic facilities8
Schools without any basic facilities8
Boundary wall Toilet
Provincial rankingPunjab
Drinkingwater
39:1 15%3:1
3:16%
18% 0%93%
19%3% 5%8%
3% 4%
89.42 1/8
Cannot read a story in Urdu4
Cannot read a sentence in English4
Cannot do two digit division Learning
outcomes3
AlifAilaan
GirlsBoys TotalOut-of-schoolchildren2
Neverattended
school5
Students enrolledin private schools
Students enrolledin government schools
Government school Private school
Average number of years spent in school6
Dropout rate atprimary level Girls TotalBoys
Number of Teachers Gender distributionNumber of schools Gender distribution1
SchoolsGirls
schoolsBoys
schoolsMiddleschools
Secondaryschools
Primaryschools
Highersecondary
schools
Education score
Number of Teachers Gender distributionNumber of teachers Gender distribution
TeachersPrimaryschools
Secondaryschools
Middleschools
Highersecondary
schoolsMale
teachersFemale teachers
Sindh
1. This is sum of primary, middle, high and higher secondary schools only2. Children between the ages of 5-16 years3. For Class 5 students4. Text meant for Class 2 students5. Age 15 years and above6. Age 18-35 years
Provincial ranking
5 Female7 Male 6 Total
54% Female31% Male 42% Total
61% 39%
50% 50%49%
55% 76% 65%
61%51% 56%
87,085 12,278 34,588 10,219 99,493 44,677
41,724 2,316 1,706 293 35,551 10,488
60.44 6/8
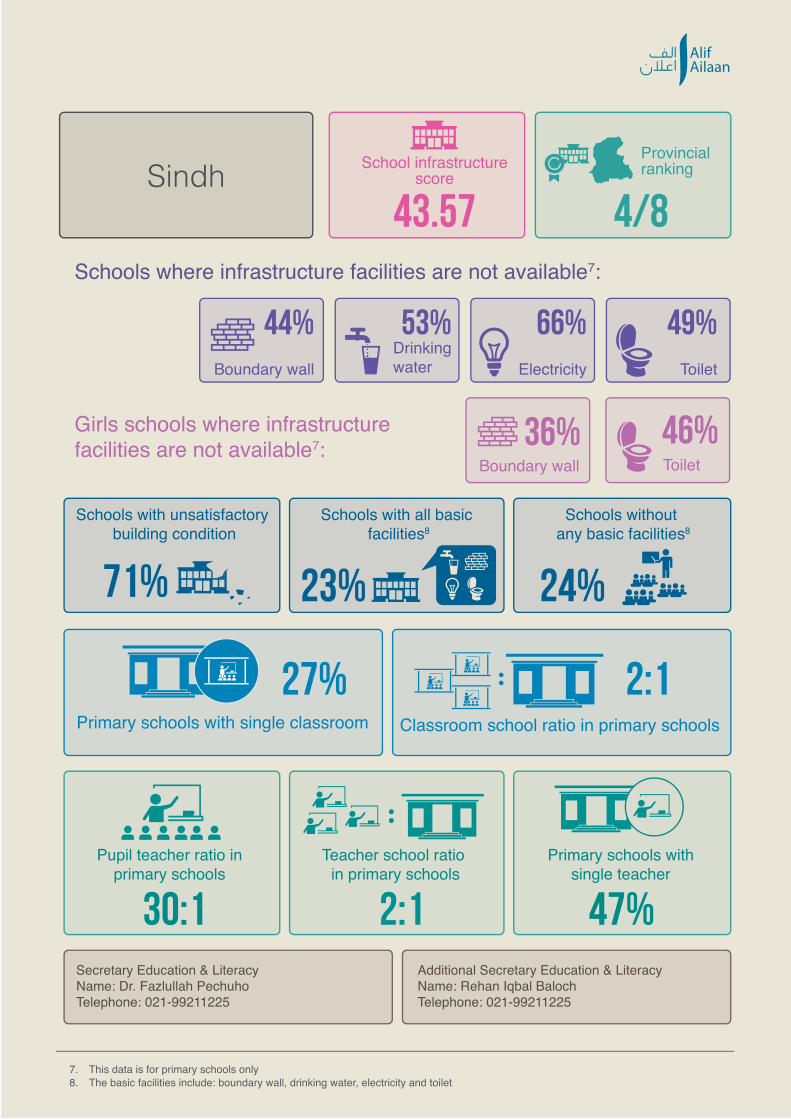
AlifAilaan
7. This data is for primary schools only8. The basic facilities include: boundary wall, drinking water, electricity and toilet
Secretary Education & LiteracyName: Dr. Fazlullah PechuhoTelephone: 021-99211225
Additional Secretary Education & LiteracyName: Rehan Iqbal BalochTelephone: 021-99211225
Classroom school ratio in primary schoolsPrimary schools with single classroom
Pupil teacher ratio in primary schools
Primary schools with single teacher
Teacher school ratio in primary schools
Girls schools where infrastructure facilities are not available7:
Schools where infrastructure facilities are not available7:
Electricity ToiletBoundary wall
School infrastructurescore
Schools with unsatisfactory building condition
Schools with all basic facilities8
Schools without any basic facilities8
Boundary wall Toilet
Provincial rankingSindh
Drinkingwater
30:1 47%2:1
2:127%
71% 24%23%
66%53% 49%44%
36% 46%
43.57 4/8
Cannot read a story in Urdu4
Cannot read a sentence in English4
Cannot do two digit division Learning
outcomes3
AlifAilaan
1. This is sum of primary, middle, high and higher secondary schools only2. Children between the ages of 5-16 years3. For Class 5 students4. Text meant for Class 2 students5. Age 15 years and above6. Age 18-35 years
GirlsBoys TotalOut-of-schoolchildren2
Neverattended
school5
Students enrolledin private schools
Students enrolledin government schools
Government school Private school
Average number of years spent in school6
Dropout rate atprimary level Girls TotalBoys
Number of Teachers Gender distributionNumber of schools Gender distribution1
SchoolsGirls
schoolsBoys
schoolsMiddleschools
Secondaryschools
Primaryschools
Highersecondary
schools
PakistanPakistanEducation score
Number of Teachers Gender distributionNumber of teachers Gender distribution
TeachersPrimaryschools
Secondaryschools
Middleschools
Highersecondary
schoolsMale
teachersFemale teachers
5 Female7 Male 6 Total
55% Female31% Male 43% Total
62% 38%
42% 41%40%
44% 48% 49%
52%43% 47%
307357 128,227 213,394 45,649 407,795 286,832
124,070 16,418 12,116 1,540 96,365 57,779
66.54
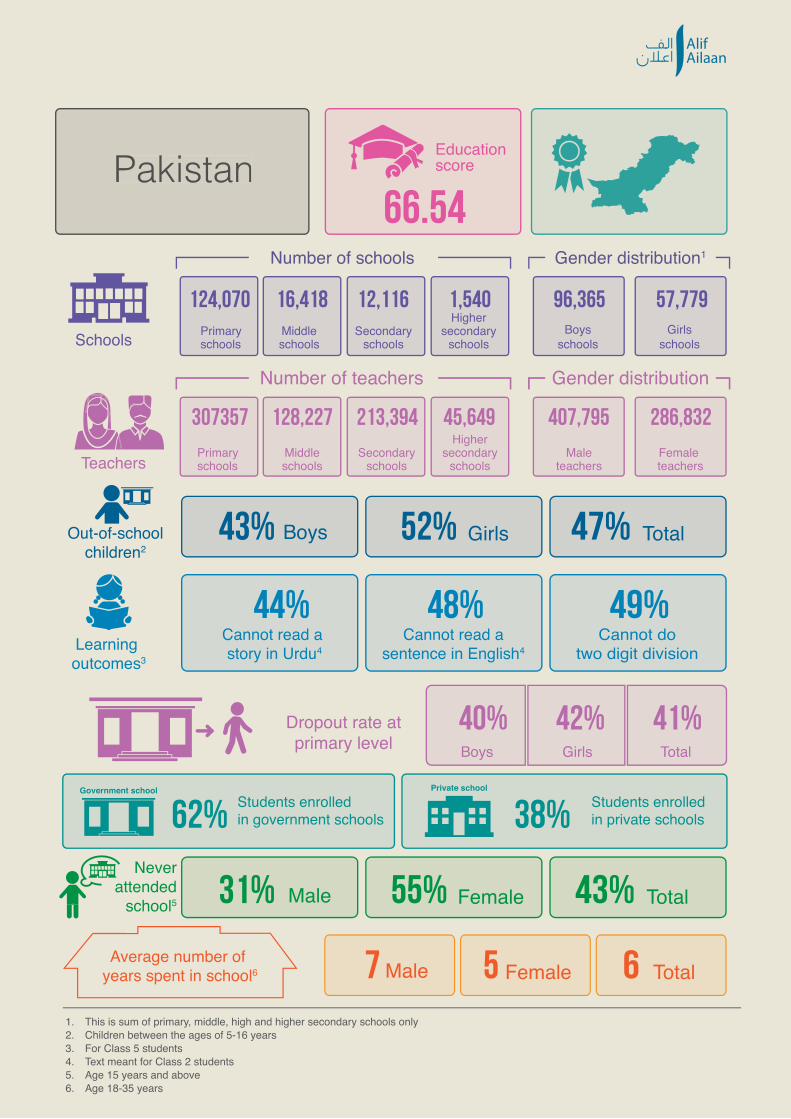
AlifAilaan
7. This data is for primary schools only8. The basic facilities include: boundary wall, drinking water, electricity and toilet
Secretary Education & LiteracyName: Dr. Fazlullah PechuhoTelephone: 021-99211225
Additional Secretary Education & LiteracyName: Rehan Iqbal BalochTelephone: 021-99211225
Classroom school ratio in primary schoolsPrimary schools with single classroom
Pupil teacher ratio in primary schools
Primary schools with single teacher
Teacher school ratio in primary schools
Girls schools where infrastructure facilities are not available7:
Schools where infrastructure facilities are not available7:
Electricity ToiletBoundary wall
School infrastructurescore
Schools with unsatisfactory building condition
Schools with all basic facilities8
Schools without any basic facilities8
Boundary wall Toilet
Provincial rankingSindh
Drinkingwater
30:1 47%2:1
2:127%
71% 24%23%
66%53% 49%44%
36% 46%
43.57 4/8
Cannot read a story in Urdu4
Cannot read a sentence in English4
Cannot do two digit division Learning
outcomes3
AlifAilaan
1. This is sum of primary, middle, high and higher secondary schools only2. Children between the ages of 5-16 years3. For Class 5 students4. Text meant for Class 2 students5. Age 15 years and above6. Age 18-35 years
GirlsBoys TotalOut-of-schoolchildren2
Neverattended
school5
Students enrolledin private schools
Students enrolledin government schools
Government school Private school
Average number of years spent in school6
Dropout rate atprimary level Girls TotalBoys
Number of Teachers Gender distributionNumber of schools Gender distribution1
SchoolsGirls
schoolsBoys
schoolsMiddleschools
Secondaryschools
Primaryschools
Highersecondary
schools
PakistanPakistanEducation score
Number of Teachers Gender distributionNumber of teachers Gender distribution
TeachersPrimaryschools
Secondaryschools
Middleschools
Highersecondary
schoolsMale
teachersFemale teachers
5 Female7 Male 6 Total
55% Female31% Male 43% Total
62% 38%
42% 41%40%
44% 48% 49%
52%43% 47%
307357 128,227 213,394 45,649 407,795 286,832
124,070 16,418 12,116 1,540 96,365 57,779
66.54
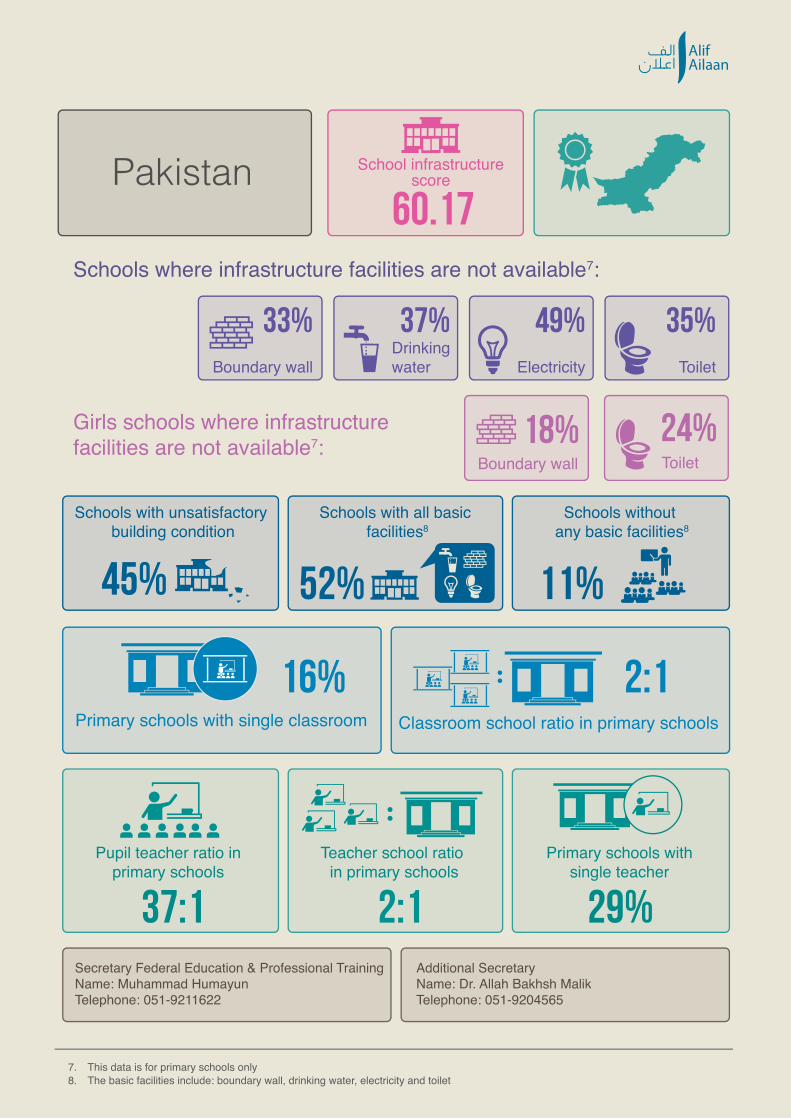
AlifAilaan
7. This data is for primary schools only8. The basic facilities include: boundary wall, drinking water, electricity and toilet
Secretary Federal Education & Professional Training Name: Muhammad HumayunTelephone: 051-9211622
Additional Secretary Name: Dr. Allah Bakhsh MalikTelephone: 051-9204565
Classroom school ratio in primary schoolsPrimary schools with single classroom
Pupil teacher ratio in primary schools
Primary schools with single teacher
Teacher school ratio in primary schools
Girls schools where infrastructure facilities are not available7:
Schools where infrastructure facilities are not available7:
ElectricityDrinkingwater ToiletBoundary wall
Pakistan School infrastructurescore
Schools with unsatisfactory building condition
Schools with all basic facilities8
Schools without any basic facilities8
Boundary wall Toilet
37:1 29%2:1
2:116%
45% 11%52%
49%37% 35%33%
18% 24%
60.17
The Alif Ailaan Campaign is funded by the UK Department for International Development.
PAKISTAN DISTRICT EDUCATION RANKINGS2016
PA
KIS
TAN
DIS
TRIC
T ED
UC
ATIO
N R
AN
KIN
GS
2016


