Page 1
Pakistan Investment Strategy 2019An Offer You Can’t Resist
1
REP-300
www.jamapunji.pk
AHL ResearchD: +92 21 32462742
UAN: +92 21 111 245 111, Ext: 322
F: +92 21 32420742
E: [email protected] Best Domestic Equity House Top 25 CompaniesCorporate Finance House
of the YearBest Equity Research
Analyst
Page 2
SynopsisAn Offer You Can’t Resist – 47,000 here I come
Exhibit: Historical & Expected PE of KSE-100
Source: Company Financials, AHL Research
2
35% return on the table: Total return for our top picks is expected to be 35%, for the KSE-100 Index
the return is projected to be 23%. We have used earnings growth methodology to calculate returns.
Enticing Valuations: The KSE-100 index is trading below its 14-yr average PE of 9x and is currently
offering investors a 2019 PE of 7.6x. These levels have not been seen since 2011, Pakistan equities
are cheap.
Earnings Growth of 28% for 2019: Earnings growth of our top picks is 28% while for the KSE-100
index, earnings growth for 2019 is forecast at a 5-Yr high of 15%, E&P’s (+36%), Commercial Banks
(+32%) and Fertilizers (+20%).
1. E&P sector expected to benefit from a higher PKR/USD parity (PKR 147/USD by end Jun’19; +21%
YoY) and stable oil prices.
2. Banking sector earnings are expected to be driven by the impact of 425bps hike in interest rates
during CY18.
3. Fertilizer sector earnings growth should benefit from better pricing.
Addressing of economic concerns to increase investor confidence: Lower Current Account
Deficit (expected at USD 600mn monthly from Jan’19 onwards; USD 10bn for FY19) along with
arrangement of funds from IMF and friendly countries including China, UAE and Saudi Arabia are
expected to brighten investor sentiment.
Stable PKR outlook post currency adjustment: Following several rounds of devaluation in 2018,
we estimate that the REER has now come down to 105. Historical data shows that foreigners have
been net buyers when the REER falls below 100. We see a stable PKR in FY19.
Increase in IPOs and SPOs is expected due to political stability.
-
2.0
4.0
6.0
8.0
10.0
12.0
14.0
16.0
CY
06
CY
07
CY
08
CY
09
CY
10
CY
11
CY
12
CY
13
CY
14
CY
15
CY
16
CY
17
CY
18
CY
19E
KSE100 PE (x) Interest Rate (%)Average PE (x) Average Interest Rate (%)
Exhibit: AHL Top Picks
Source: AHL Research
Closing Prices are as of 07-Dec-2018
PSX Code Company Name PSX Code Company Name
PPL Pakistan Petroleum Ltd. BAFL Bank Alfalah Ltd.
OGDC Oil & Gas Dev. Co. Ltd. SNGP Sui Northern Gas Pipelines Ltd.
ENGRO Engro Corporation Ltd. NML Nishat Mills Ltd.
UBL United Bank Ltd. INDU Indus Motor Co. Ltd.
FFC Fauji Fertilizer Co. Ltd. BOP The Bank of Punjab
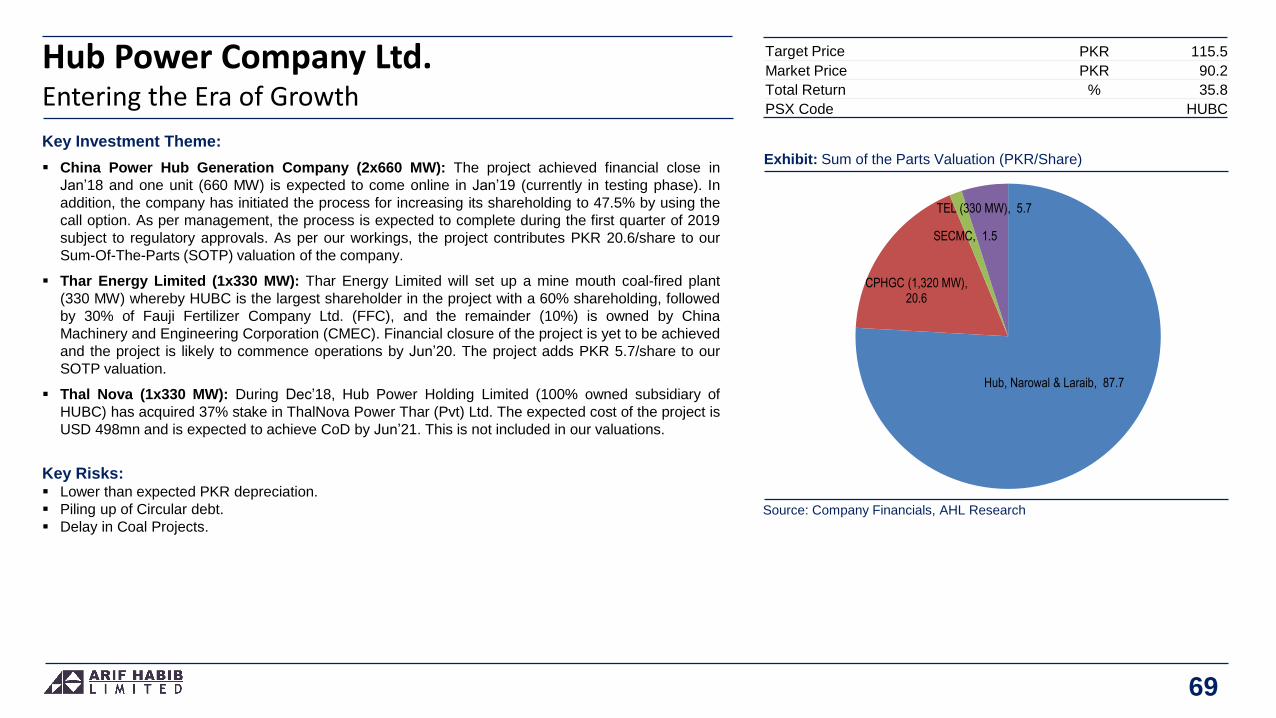
HUBC The Hub Power Co. Ltd. APL Attock Petroleum Ltd.
LUCK Lucky Cement Ltd. LOTCHEM Lotte Chemical (Pak) Ltd.
POL Pakistan Oilfields Ltd. ASTL Amreli Steels Ltd.
EFERT Engro Fertilizers Ltd.
Page 3
3
Political Outlook 5 • Highest Ever Foreign Selling during CY18 28
• Stability is Crucial 5 • Rectification of Overvalued PKR to lure FIPI 29
• Finding a Balance between Washington & Beijing 6 • BoP Sustainability to increase investors’ confidence 30
Economy of Pakistan 7 • Earnings Growth 31
• Household Consumption to Weaken 8 • KSE-100 index expected to cross 47,000 by Dec’19 32
• Commodity Producing sectors to face headwinds 9 • KSE-100 Index Performance (CY18TD) 33
• The Achilles Heel 10 • Equity Market Offerings 34
• Outlook – Rocky Ride Ahead 11 Sectoral Strategy
• Outlook – Expected to Tame Down 12 • Banks 36
• Outlook – Financing from IMF & friendly countries crucial 14 • Exploration & Production 46
• 100bps Rate Hike Likely 15 • Fertilizer 56
• From a 4-Yr High to a 13-M Low 16 • Cement 63
• No Signs of Redemption Yet 17 • Power 68
• Essential for Economic Discipline 18 • Oil & Gas Marketing 71
• An Economic Agony 19 • Textile Composite 76
• RFO being replaced by RLNG and Coal 20 • Engineering (Steel) 79
• GoP has been Proactive 21 • Automobile Assemblers 82
• Further Measures needed for Economic Revival 23 • Chemical 85
• Key Economic Indicators 24 Recommendation Summary 88
Capital Markets Annexure
• 2018 – All Bourses Hate Uncertainty 26 • List of Abbreviation 89
• Traded Value Declined by 42% YoY 27 • Contact List 92
Table of Content
Page 5
PoliticsStability is Crucial
Exhibit: Current Party Position in Parliament
Source: National Assembly, AHL Research
5
Year Ruling Party Seats Opposition Seats
Nov-88 PPP 94 IJI 55
Oct-90 IJI 111 PPP 44
Oct-93 PPP 89 PMLN 73
Feb-97 PML-N 137 PPP 18
Oct-02 PML-Q 126 PPP 81
Feb-08 PPP 119 PMLN 89
May-13 PML-N 166 PPP 42
Jul-18 PTI 156 PMLN 85
PTI forms its first ever gov’t: General Elections 2018 were conducted successfully in a peaceful
environment on the 25th of July, 2018 in which PTI emerged as the largest party in the National
Assembly, bagging 156 seats. Predecessors, PML-N, followed with 85 seats while PPPP won 54
seats. PTI formed the gov’t with the help of independent candidates alongside MQM (7), PMLQ (5),
and BAP (5). A new gov’t is seen to erode political impasse and investment climate is perceived to be
conducive
Simple majority in Parliament:. We highlight that owing to the coalition nature of the incumbent
gov’t, certain legislation can prove to be slightly problematic and any conflict between coalition
partners can cause waters to turn rough for the govt’s boat.
Judiciary, Army and Government on the same page : The new government, judiciary and the
military all seem to be on one page, which is encouraging for addressing key issues like eliminating
extremism, money laundering and initiating grass root reforms for improving governance.
18th Amendment might constrain performance of Federal Government: 18th Amendment
(whereby the Federal Government has to share resources with provinces and is facing higher fiscal
deficit and certain major social areas like housing, health and education are termed provincial
subjects) can possibly hinder accomplishment of certain economic objectives such as fiscal discipline,
as well as improvement in performance of education and health sectors.
Healthy returns expected: That said, we highlight that capital markets have provided lucrative
returns in the first year of a newly elected gov’t. An empirical study reveals that the KSE-100 has
provided an average return of 31% in the first year of a new gov’t, looking at the last 5 elections.
Page 6
Foreign RelationsFinding a Balance between Washington & Beijing
Exhibit: PSX Return During Elections (01-Year)
Source: PSX, AHL Research
PTI’s Gove performance is till 07-Dec-2018
6
70%4%
97%
-59%
43%
-5%
-80%
-60%
-40%
-20%
0%
20%
40%
60%
80%
100%
120%
1993 1997 2002 2008 2013 2018
PSX Return (01-Year)
PPP
PML-N
PML-Q
PML-N
PPP PTI
Peaceful stance towards India: PM Imran Khan has made his intention of initiating an overture with India
very clear right since the onset of assuming the office of chief executive. Whether it was offering a
dialogue between the two countries’ foreign ministers on the sidelines of the UN General Assembly
session, or the successful opening of the Kartarpur Corridor (to allow access for Sikh Pilgrims to a holy
shrine in Pakistan), the PM has been very upfront in establishing his intention and desires of establishing
peaceful relations with India and addressing all outstanding issues through dialogue. However, the
initiatives have not been met with a parallel level of enthusiasm, which is possibly owing to this being an
election year in India. Going forward, improvement in relations can very much be on the cards as we see
that the military leadership in Pakistan also seems to have a desire to engage with India as PM Khan
emphatically stated that the army and the gov’t are on one page on all policies.
Convergence of views with US on Afghanistan: The relations with US are expected to improve as there
appears to be convergence of views of both countries regarding dialogue as the preferred route for
bringing peace in Afghanistan. We believe the recent communication between US President Trump and
Prime Minister Imran Khan in this respect is a major step and is going to aid US-Pak relations and the
potential bailout package from IMF.
China and Saudi Arabia: In a symbolic and economically demanding move, PM Khan chose Saudi
Arabia as his first official tour since taking oath. Pakistan is facing severe challenges in its Balance of
Payments and is in dire need of foreign assistance. Long-standing allies Saudi Arabia responded
positively to Pakistan’s request and provided a USD 6bn financial assistance package. In return, Pakistan
offered its services as a peacemaker for resolution of regional conflicts to the Saudi leadership. The PM
also made a trip to China where a number of MOUs were signed for various investment projects and
further agreements and discussions on CPEC projects. Albeit, the gov’ts on both sides, including the
Pakistani military leadership, have asserted the desire to further economic and security ties between the
two countries.
Page 7
7
Economy: Treating the Patient
Page 8
Pakistan’s economy is expected to grow by 4.0% during FY19 compared to a 12-Yr high growth rate
of 5.8% during FY18.
Burgeoning imports and persistently high CAD (Current Account Deficit) has led to an import cover of
less than 1.6 months – stressing reserves to a 5-Yr low level of USD 8.1bn.
22% PKR depreciation since Dec’17 will lead to lower consumer purchasing power and hence, a
compression / moderation in domestic consumption is expected. As household consumption
contributes around 82% to Pakistan’s GDP, a slowdown is imminent.
Increasing remittances is a ray of hope as 4MFY19 remittances are up by 15% YoY to reach USD
7.4bn compared to USD 6.4bn for the same period last year.
To moderate domestic demand and control macroeconomic imbalances like inflation and CAD, SBP
has raised the interest rates by 425bps during CY18 (inflation in 5MFY19 has averaged at 6.02%
compared to 3.5% for FY18).
Overall, a contractionary monetary policy, a weaker exchange rate along with fiscal consolidation
measures are ominous of a slowdown in the economic growth of the country.
GDP Growth RateHousehold Consumption to Weaken
Exhibit: Historical and Expected GDP Growth
Source: MoF, AHL Research
8
3.7%
4.0%
4.2%
4.7%
5.3%
5.8%
4.0%
3.0%
3.5%
4.0%
4.5%
5.0%
5.5%
6.0%
FY13 FY14 FY15 FY16 FY17 FY18 FY19F
Page 9
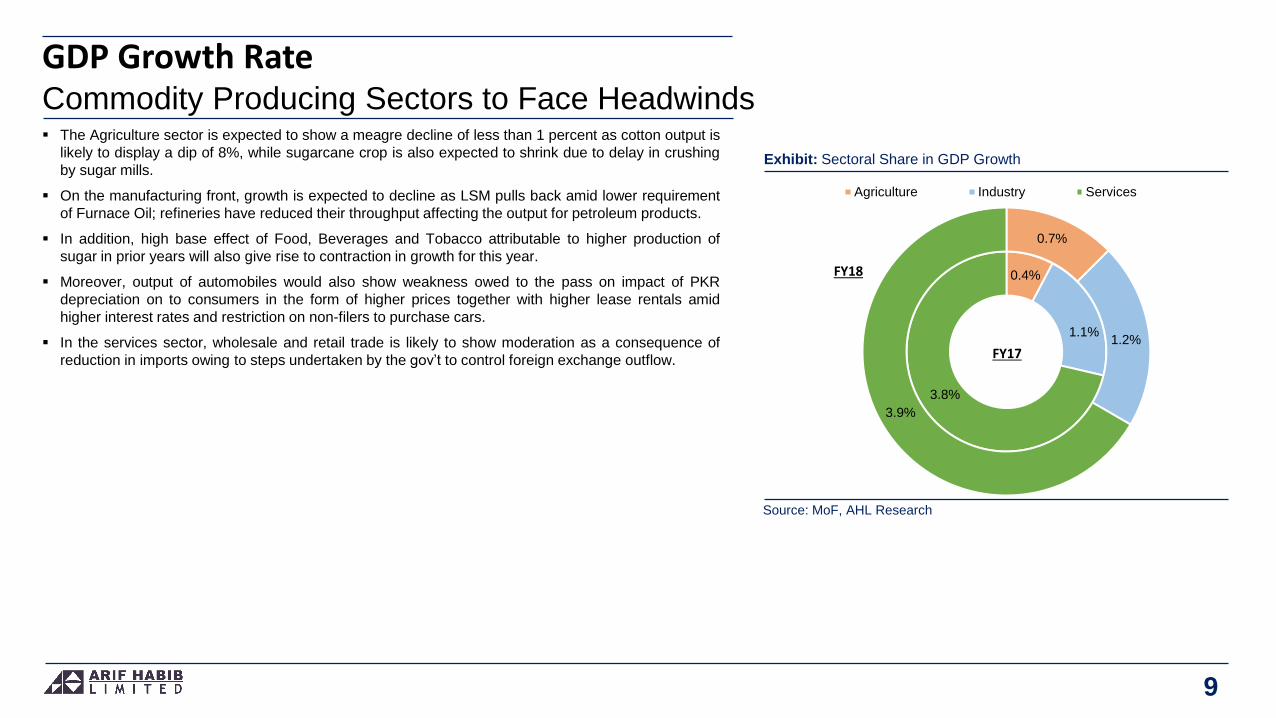
The Agriculture sector is expected to show a meagre decline of less than 1 percent as cotton output is
likely to display a dip of 8%, while sugarcane crop is also expected to shrink due to delay in crushing
by sugar mills.
On the manufacturing front, growth is expected to decline as LSM pulls back amid lower requirement
of Furnace Oil; refineries have reduced their throughput affecting the output for petroleum products.
In addition, high base effect of Food, Beverages and Tobacco attributable to higher production of
sugar in prior years will also give rise to contraction in growth for this year.
Moreover, output of automobiles would also show weakness owed to the pass on impact of PKR
depreciation on to consumers in the form of higher prices together with higher lease rentals amid
higher interest rates and restriction on non-filers to purchase cars.
In the services sector, wholesale and retail trade is likely to show moderation as a consequence of
reduction in imports owing to steps undertaken by the gov’t to control foreign exchange outflow.
GDP Growth RateCommodity Producing Sectors to Face Headwinds
Exhibit: Sectoral Share in GDP Growth
Source: MoF, AHL Research
9
0.4%
1.1%
3.8%
0.7%
1.2%
3.9%
Agriculture Industry Services
FY18
FY17
Page 10
Balance of PaymentsThe Achilles Heel
Exhibit: Overall Balance of Payments
Source: SBP, AHL Research
10
-
2.0
4.0
6.0
8.0
10.0
12.0
14.0
16.0
18.0
20.0
(25.0)
(20.0)
(15.0)
(10.0)
(5.0)
-
5.0
10.0
15.0
20.0
FY12 FY13 FY14 FY15 FY16 FY17 FY18
Current Account Financial Account
Capital Account FX Reserves (RHS)
(USD bn)
Balance of Payments situation has been the Achilles heel in Pakistan’s macroeconomic environment.
Pakistan incurred a Current Account Deficit (CAD) of USD 19.0bn during FY18, which was 50%
higher than USD 12.6bn in FY17. Albeit, the CAD has tamed recently, settling at USD 2.7bn during
Aug-Oct ’18, that is, 55% lower than the CAD of ~USD 6bn witnessed in May-Jul’18.
PKR depreciation of approx. ~22% during CY18TD, has slowed down the pace of imports. If we
compare imports for 4MFY19 against the same period last year, imports of all major groups except
petroleum have gone down.
The imports under petroleum group have increased owing to price hike (4MFY19 average Arab Light
oil price is USD 77.0/bbl compared to USD 51.8/bbl during 4MFY18). During the same period, oil
imports are down by 30% in volumetric terms due to change in fuel mix of power sector tagged with
slowdown in demand for retail fuel given higher prices. Moreover, if we observe import of LNG
(substituting Furnace Oil), we noticed that total petroleum imports are actually down by 12% during
the said period.
Imports have also slowed down as a consequence of conclusion of election spending as well as the
fact that majority of power projects under CPEC have been completed leading to a decline in
machinery imports. In addition, higher regulatory duties and restriction on advance payments on
imports and on open accounts has curtailed imports.
Page 11
Balance of PaymentsOutlook – Rocky Ride Ahead
Exhibit: Precarious Balance of Payments Situation
Source: SBP, AHL Research
11
(15.0)
(10.0)
(5.0)
-
5.0
10.0
15.0
Sep-0
7
Sep-0
8
Sep-0
9
Sep-1
0
Sep-1
1
Sep-1
2
Sep-1
3
Sep-1
4
Sep-1
5
Sep-1
6
Sep-1
7
Sep-1
8
Net foreign currency swaps
Predetermined Repayments for next 12 months
Net International Reserves(USD bn)
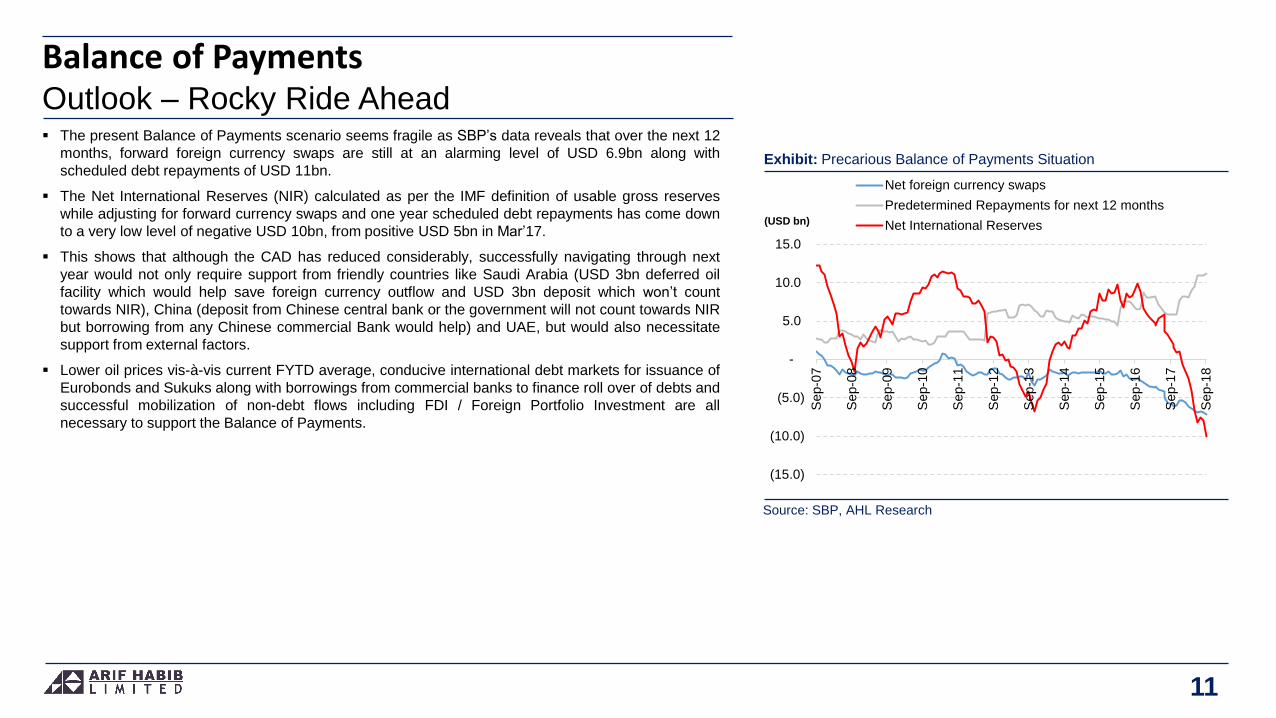
The present Balance of Payments scenario seems fragile as SBP’s data reveals that over the next 12
months, forward foreign currency swaps are still at an alarming level of USD 6.9bn along with
scheduled debt repayments of USD 11bn.
The Net International Reserves (NIR) calculated as per the IMF definition of usable gross reserves
while adjusting for forward currency swaps and one year scheduled debt repayments has come down
to a very low level of negative USD 10bn, from positive USD 5bn in Mar’17.
This shows that although the CAD has reduced considerably, successfully navigating through next
year would not only require support from friendly countries like Saudi Arabia (USD 3bn deferred oil
facility which would help save foreign currency outflow and USD 3bn deposit which won’t count
towards NIR), China (deposit from Chinese central bank or the government will not count towards NIR
but borrowing from any Chinese commercial Bank would help) and UAE, but would also necessitate
support from external factors.
Lower oil prices vis-à-vis current FYTD average, conducive international debt markets for issuance of
Eurobonds and Sukuks along with borrowings from commercial banks to finance roll over of debts and
successful mobilization of non-debt flows including FDI / Foreign Portfolio Investment are all
necessary to support the Balance of Payments.
Page 12
The Current Account FiascoOutlook – Expected to Tame Down
Exhibit: Historical Current Account Deficit
Source: SBP, AHL Research
12
19.7 25.4 24.7 24.8 25.1 24.1 22.0 22.0 24.8
-31.1 -35.8 -40.4 -40.2 -41.7 -41.4 -41.3-48.7
-56.0
8.911.2 13.2 13.9 15.8 18.7 19.9 19.4 19.6
-20.0
-15.0
-10.0
-5.0
0.0
5.0
-80.0
-60.0
-40.0
-20.0
0.0
20.0
40.0
60.0
FY10 FY11 FY12 FY13 FY14 FY15 FY16 FY17 FY18
Exports Imports
Remittances C/A Balance (RHS)(USD bn)
We have an optimistic outlook on the CAD for FY19 as the stabilization measures undertaken by the
gov’t alongside other macroeconomic phenomenon are likely to bear fruit. To recall, the CAD for
4MFY19 has clocked-in at USD 4.8bn depicting a decline of 4.6% YoY compared to SPLY. The
downturn in CAD was led primarily by a very healthy jump in remittances (+15% YoY) during the said
period, while export growth also portrayed an uptick of 4% YoY. Going forward, we expect the CAD for
FY19 to arrive at USD 9.5bn implying a drastic decline of 48% YoY.
We expect the currency depreciation to amplify its effects on the CAD as usually, the positive bearing
comes in with a lagged effect. Furthermore, we expect additional weakening of the currency going
forward, whereby we forecast the PKR/USD parity to settle at PKR 147/USD by the end of FY19 and
PKR 152/USD at the end of CY19.
Moreover, we believe that declining oil prices have not shown a very pronounced impact so far. This,
coupled with the fact that power consumption patterns of the country are shifting away from costly
sources to cheaper sources is expected to dampen the import bill of the country significantly going
forward. Imposition of regulatory duties on non-essential and luxury items has also played a vital role
in decelerating import growth momentum.
Premised on these factors, we forecast a 4% YoY decline in imports of the country during FY19. To
recall, petroleum imports contributed a hefty 24% to the FY18 import bill while this contribution has
increased to 27% for the 4MFY19 period. Petroleum products’ volumetric imports has witnessed a
20% suppression YoY (including LNG) during 4MFY19 where Furnace Oil (FO) imports have declined
90% In terms of value, petroleum products have shown a 38% uptick during the said period (higher
fuel prices). With the influx of newer and efficient power generation plants running on LNG and coal,
demand for FO has declined despite higher power generation (4MFY18 +6.3%).
Page 13
The Current Account FiascoOutlook – Expected to Tame Down
Exhibit: Historical & Forecasted Current Account Deficit
Source: SBP, AHL Research
13
4.7
2.5 3.1 2.8
4.9
12.6
19.0
10.0
-
3.0
6.0
9.0
12.0
15.0
18.0
21.0
FY
12
FY
13
FY
14
FY
15
FY
16
FY
17
FY
18
FY
19E
(USD bn)
On the exports front again we expect the weakening of the currency to impact exports positively.
Moreover steps undertaken to improve the exports competitiveness combined with provision of
various incentives to export-oriented sectors are also likely to help alleviate the infamous export
stagnancy issue of the country. We forecast exports to portray a 6% YoY increase during FY19.
Remittances are also expected to continue their healthy trajectory upwards and we expect the growth
to clock-in at 13% YoY during FY19. We attribute the continuation of the aggressive momentum of
remittances inflow to the weakening of the Pak Rupee which is incentivizing expat Pakistanis to remit
larger amounts. Moreover the global clampdown against money laundering and enforcement of
regulations is also forcing money inflows through official channels. Additionally, the recent remittances
framework approved by GoP is also likely to have a positive bearing on remittances inflow.
Compliance with FATF (Financial Action Task Force) recommendations are also going to increase the
flow of remittances via official channels.
Page 14
FOREX ReservesOutlook – Financing from IMF & friendly countries crucial
Exhibit: Historical and Forecasted FX Reserves
Source: SBP, AHL Research
14
-
5.0
10.0
15.0
20.0
25.0
FY
04
FY
05
FY
06
FY
07
FY
08
FY
09
FY
10
FY
11
FY
12
FY
13
FY
14
FY
15
FY
16
FY
17
FY
18
Nov-1
8
FY
19F
Reserves With SBP Net Reserves With Banks
(USD bn)
We expect SBP’s gross reserves to settle at USD 9.9bn as compared to USD 9.8bn in FY18. While
we estimate debt servicing to clock-in at USD 8bn for the remaining of FY19. Mobilization of additional
funds are expected to amount to USD 16bn for FY19; we highlight key sources and major repayments
below:
1. USD 6bn from Saudi Arabia - USD 3bn as immediate BoP support and USD 3bn deferred oil
payments. USD 1bn has already been deposited into the SBP.
2. We expect USD 5bn assistance from China and USD 2bn from UAE.
3. USD 1bn tranche (disbursement during FY19) from a possible IMF bailout package. Contingent on
IMF bailout are:
USD 2bn from Eurobond + Sukuk issuance.
USD 2bn from Commercial Banks.
4. Scheduled debt repayments of USD 8bn are outstanding during FY19.
5. We expect the Pakistani Rupee to reach PKR 147/USD by Jun’19.
Page 15
Inflation100bps Rate Hike Likely due to PKR Devaluation
Exhibit: Real Interest Rate
Source: SBP, AHL Research
15
(2.0)
(1.0)
-
1.0
2.0
3.0
4.0
5.0
-
2.0
4.0
6.0
8.0
10.0
12.0
14.0
16.0
FY
10
FY
11
FY
12
FY
13
FY
14
FY
15
FY
16
FY
17
FY
18
FY
19F
Avg. Discount Rate
Avg. CPI
Real Interest Rate (RHS)(%) (%)
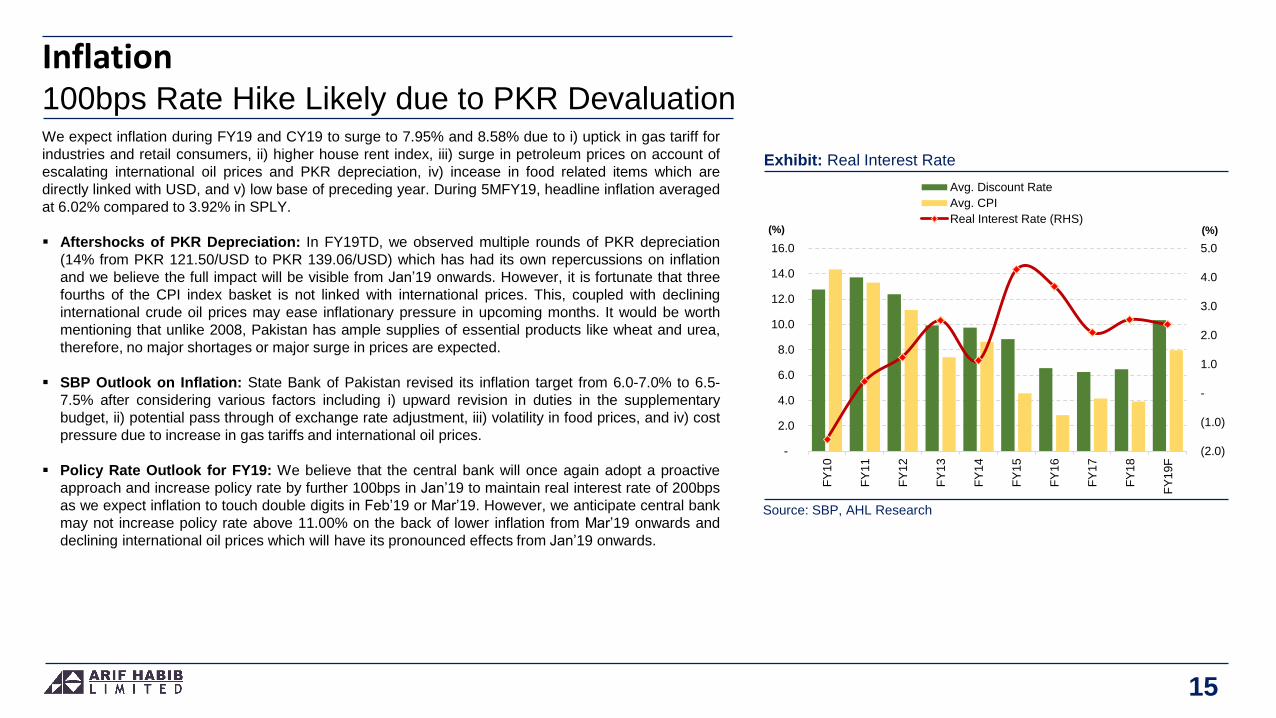
We expect inflation during FY19 and CY19 to surge to 7.95% and 8.58% due to i) uptick in gas tariff for
industries and retail consumers, ii) higher house rent index, iii) surge in petroleum prices on account of
escalating international oil prices and PKR depreciation, iv) incease in food related items which are
directly linked with USD, and v) low base of preceding year. During 5MFY19, headline inflation averaged
at 6.02% compared to 3.92% in SPLY.
Aftershocks of PKR Depreciation: In FY19TD, we observed multiple rounds of PKR depreciation
(14% from PKR 121.50/USD to PKR 139.06/USD) which has had its own repercussions on inflation
and we believe the full impact will be visible from Jan’19 onwards. However, it is fortunate that three
fourths of the CPI index basket is not linked with international prices. This, coupled with declining
international crude oil prices may ease inflationary pressure in upcoming months. It would be worth
mentioning that unlike 2008, Pakistan has ample supplies of essential products like wheat and urea,
therefore, no major shortages or major surge in prices are expected.
SBP Outlook on Inflation: State Bank of Pakistan revised its inflation target from 6.0-7.0% to 6.5-
7.5% after considering various factors including i) upward revision in duties in the supplementary
budget, ii) potential pass through of exchange rate adjustment, iii) volatility in food prices, and iv) cost
pressure due to increase in gas tariffs and international oil prices.
Policy Rate Outlook for FY19: We believe that the central bank will once again adopt a proactive
approach and increase policy rate by further 100bps in Jan’19 to maintain real interest rate of 200bps
as we expect inflation to touch double digits in Feb’19 or Mar’19. However, we anticipate central bank
may not increase policy rate above 11.00% on the back of lower inflation from Mar’19 onwards and
declining international oil prices which will have its pronounced effects from Jan’19 onwards.
Page 16
International oil prices have been on a roller coaster ride. Arab Light prices (the most relevant
benchmark for Pakistan) were around USD 60/bbl in FY18.
During 1QFY19, average prices surged by 50.2% YoY to reach USD 75.7/bbl while increasing by
another 6% on average to reach USD 80/bbl in Oct’18.
Pertinently, higher oil prices have a significant impact on Pakistan’s balance of payments as the
country imports approximately 85% of its oil requirements, contributing 27% towards its total imports
(4MFY19). Imports under the petroleum group surged by 17% YoY during 4MFY19 to reach USD
5.6bn from USD 4.4bn as higher prices (+49% for 4MFY19 of USD 76.97/bbl vs USD 51.8/bbl for
4MFY18) offset the impact of lower volumetric imports (-32% to 6.3mn tons for 4MFY19 vs. 9.3mn
tons for 4MFY18, excluding LNG).
In the last few months, we have seen the initiation of a possible downwards trajectory in oil prices, as
the US announced waivers for 8 countries for purchasing oil from Iran. The OPEC (Organization of
Petroleum Exporting Countries) has announced a cut of 1.2mn barrels per day, which is expected to
eliminate the imbalance in the supply and demand of oil and normalize the price
Arab Light prices declined by 31% from their peak of USD 85.8/bbl to touch a 13 month low of USD
58.9/bbl on Nov 29, 2018.
This development is fairly recent and is therefore not visible in period averages. However, if we
assume that oil prices will continue to hover around the same levels (USD 65/bbl for Arab Light) for
the remaining part of the fiscal year, the import bill for petroleum group would remain around USD
13bn for FY19. This estimate incorporates the recent changes in Pakistan’s fuel mix due to addition of
newer power plants in Pakistan’s power sector
We expect Arab Light prices to average at USD 65/bbl in FY19 and FY20.
Oil Prices – A Silver LiningFrom a 4-Yr High to a 13-M Low
Exhibit: Share of oil Imports and Average Oil Prices
Source: SBP, Bloomberg, AHL Research
16
-
20.0
40.0
60.0
80.0
100.0
120.0
10%
15%
20%
25%
30%
35%
40%
FY
04
FY
05
FY
06
FY
07
FY
08
FY
09
FY
10
FY
11
FY
12
FY
13
FY
14
FY
15
FY
16
FY
17
FY
18
4M
FY
19
Oil Share in Total Imports Avg. Oil Price* (RHS) (USD/bbl)
* Arab Light
Page 17
Fiscal deficit during FY18 clocked-in at 6.6% of GDP, which was a 5-yr high.
Finance Minister Asad Umer (in his speech during the Finance Supplementary Bill) announced the
govt’s target for the fiscal deficit at 5.1% for FY19. During 1QFY19, the deficit clocked-in at PKR
542bn (1.4% of GDP) vis-à-vis PKR 441bn (1.2% of GDP) during 1QFY18, portraying a YoY jump of
23%.
The surge in the fiscal imbalance was led by a 19% YoY rise in Current Expenditure, with debt
servicing increasing 14% YoY and defence expenditure showing an uptick of 21% YoY.
We highlight that in the prevailing rising interest rates scenario, debt servicing can see a drastic uptick
going forward. That said, during 1QFY19 domestic financing has registered a 24% YoY decline, led
by 77% decline in bank borrowings, while reliance on external financing increased significantly
(+2553% YoY).
Tax revenue showed a meagre uptick of 7% during the said period, with direct tax revenue rising only
4% YoY and indirect tax revenue increasing by 11% YoY.
Going forward tax revenue increase may be on the cards in light of introduction of various policies to
widen the tax base introduced in the Finance Bill 2018. Measures undertaken that focus specifically
on widening of the tax base include:
1. Non-filers are banned from purchasing vehicles (new locally manufactured and new/used imported).
2. 1% tax on purchase of property for non-filers.
3. Non-filers are banned from purchasing property worth over PKR 5mn.
4. Advance tax of 1% from filers and 3% from non-filers to be collected from credit/debit cards holders
conducting transaction abroad.
Fiscal DeficitNo Signs of Redemption Yet
Exhibit: Budget Deficit for 1QFY19 Settled at PKR 542bn
Source: MoF, AHL Research
17
224
276 257
284 287
337 328
438 441
542
1.0
1.1
1.2
1.3
1.4
1.5
1.6
1.7
200
250
300
350
400
450
500
550
600
1Q
FY
10
1Q
FY
11
1Q
FY
12
1Q
FY
13
1Q
FY
14
1Q
FY
15
1Q
FY
16
1Q
FY
17
1Q
FY
18
1Q
FY
19
Budget Deficit % of GDP (RHS)(PKR bn) (%)
Page 18
Negotiations with the IMF are underway for a bailout package and after a successful agreement, the
approval will be taken to the Board of the IMF, where the US has a 16% voting right. Currently,
bilateral relations between Pakistan and US have a room for improvement, and it seems that the
conditions for Pakistan’s entry into the IMF program are contingent upon that. Nevertheless,
Pakistan’s focus should be to convince the IMF on homegrown reforms agenda and reduce external
dependence.
Benefits of entry into the IMF program
Confidence of all stakeholders including other multilateral institutions like ADB, World Bank, and
other capital markets - for Sukuk and Eurobond issuance - and direct investors (interested in
investing in Pakistan).
MoF estimates the cost of borrowing via Sukuk and Eurobonds will reduce by 1-1.5ppts if Pakistan
enters into an IMF program.
Challenging steps demanded by the IMF
Free float of PKR vs. USD implying additional devaluation of 5-7% and 100-150bps increase in
interest rates.
Complete cost recovery from customers for utility bills like gas and electric (this could be achieved
via reduction in line losses and UFG however, this would take a long time and prices would have
to be increased until then).
Pakistan’s electricity and gas tariffs are already higher than other regional countries
thereby affecting the competitiveness of exports as well as import substitution industry. To
recall the gov’t has already raised gas tariffs by 33% and approved an electricity tariff hike
of 12%, while exempting export-oriented industries from the recent price increase.
Lower Fiscal Deficit, higher revenues via increase in indirect taxation such as through increase in
GST to 18%.
Minimization of losses from SOEs either through reform or privatization.
Broadening of tax base.
IMF Program Essential for Economic Discipline
Exhibit: Currency Depreciation Under IMF and Non-IMF Period
Source: IMF, SBP, AHL Research
18
58
68
78
88
98
108
118
128
138
Jan
-06
Jul-0
6
Jan
-07
Jul-0
7
Jan
-08
Jul-0
8
Jan
-09
Jul-0
9
Jan
-10
Jul-1
0
Jan
-11
Jul-1
1
Jan
-12
Jul-1
2
Jan
-13
Jul-1
3
Jan
-14
Jul-1
4
Jan
-15
Jul-1
5
Jan
-16
Jul-1
6
Jan
-17
Jul-1
7
Jan
-18
Jul-1
8
IMF Period
Nov-08: 79.1
Sep-11: 87.5
PKR Depreciation: 9.6%
IMF Period
Sep-13: 104.9
Sep-16: 104.5
PKR Depreciation: -0.4%Non-IMF Period
Sep-11: 87.5
Sep-13: 104.9
PKR Depreciation: 16.6%
Non-IMF Period
Sep-16: 104.5
Dec-18: 137.9
PKR Depreciation: 24.2%
Page 19
The government intends to take concrete steps to control the infamous bleeding of Public Sector
Enterprises. As per Federal Foot Print - SOE Annual Report issued by Implementation and Economic
Reforms Unit, Ministry of Finance, the total loss incurred by top 10 loss making SOEs is a whopping
PKR 224bn for FY16 (Latest available statistics). Only the loss incurred by NHA during FY16 is PKR
157bn, which is not included in this estimate.
Since the government’s accounting methodology is based on cash accounting, it is important to note
that on a consolidated basis, the loss in these entities is not being reported in the fiscal deficit.
However, once the need for financing arises, the burden falls on the budget.
In addition, it is noteworthy that companies earning a profit do not have a 100% payout ratio.
However, the entities incurring losses do need support to the extent of their losses or sometimes even
more. Therefore, the prominent loss making entities do need infusion of cash to the extent of their
losses. That said, similar amount of cash flow is not available from profitable companies.
Other than PIA and NHA, majority of the loss making entities are DISCOS operating in the power
sector. The higher losses incurred by DISCOS during 2016 were due to delay in implementation of
tariff as a result of a court order.
As per news reports, the government has decided to establish a company called Sarmaya-e-Pakistan
(as per PTI’s manifesto document) to take management control of all these entities and improve
management of these companies in order to curtail losses and manage these entities on commercial
basis. IMF and other multilateral lenders have been insisting on the reform of these SOEs during
previous programs too.
Ailing SOEs An Economic Agony
Exhibit: Top Ten Profit and Loss Making SoE (FY16)
Source: MoF, AHL Research
19
-157
-45
-35-24
-27
-22
-19
-15
-13-11
3
9
10
10
17
18
19
19
23
60
-200 -150 -100 -50 0 50 100
NHA
PIA
QUESCO
HESCO
Railways
SEPCO
PSM
PESCO
FESCO
LESCO
PKIC
NTDCL
GEPCO
PSO
PPL
GHPL
PARCO
WAPDA
NBP
OGDCL
Page 20
Power GenerationRFO being replaced by RLNG and Coal
Exhibit: Source Wise Generation
Source: NEPRA, AHL Research
20
GWh 4MFY19 4MFY18 YoY
Hydel 15,039 14,625 2.8%
RLNG 11,600 5,703 103.4%
Coal 5,345 2,012 165.7%
FO 4,707 11,197 -58.0%
Nuclear 2,934 2,993 -2.0%
Wind 1,305 656 99.0%
Others 8,965 9,731 -7.9%
Total 49,894 46,917 6.3%
Total Power Generation during 4MFY19 is up by 6% YoY. During Aug’18, Pakistan’s power
generation touched a record high of 14,017 GWh (average generation of 18,840 MW), which was up
by 10% YoY compared to previous highest generation of 12,754 Gwh (average generation of 17,142
MW).
During 4MFY19 Coal based power generation has increased by 166% YoY to 5,345 GWh, while
generation on FO has reduced by 58% to 4,707 GWh. The share in power generation on FO has
reduced from 24% during 4MFY18 to 9% during 4MFY19.
Total saving in fuel cost by generating power on RLNG and coal during this tenure is approximately
USD 367mn. This does not include the impact of increase in economic output due to availability of
power generation, nor does it include the impact on demand of other fuels like HSD.
Going forward, with the induction of Engro’s Thar Power Plant (EPTL 660 MW), Hubco’s Coal Power
Plant (CPHGL 1320 MW) and Punjab Thermal Power Limited (1263 MW RLNG fired) during 2019,
Pakistan’s electricity grid’s reliance is expected to reduce on expensive fuels like FO and HSD. This
shift in power consumption should also bode well for our trade deficit as import of FO will see a likely
contraction going forward.
Page 21
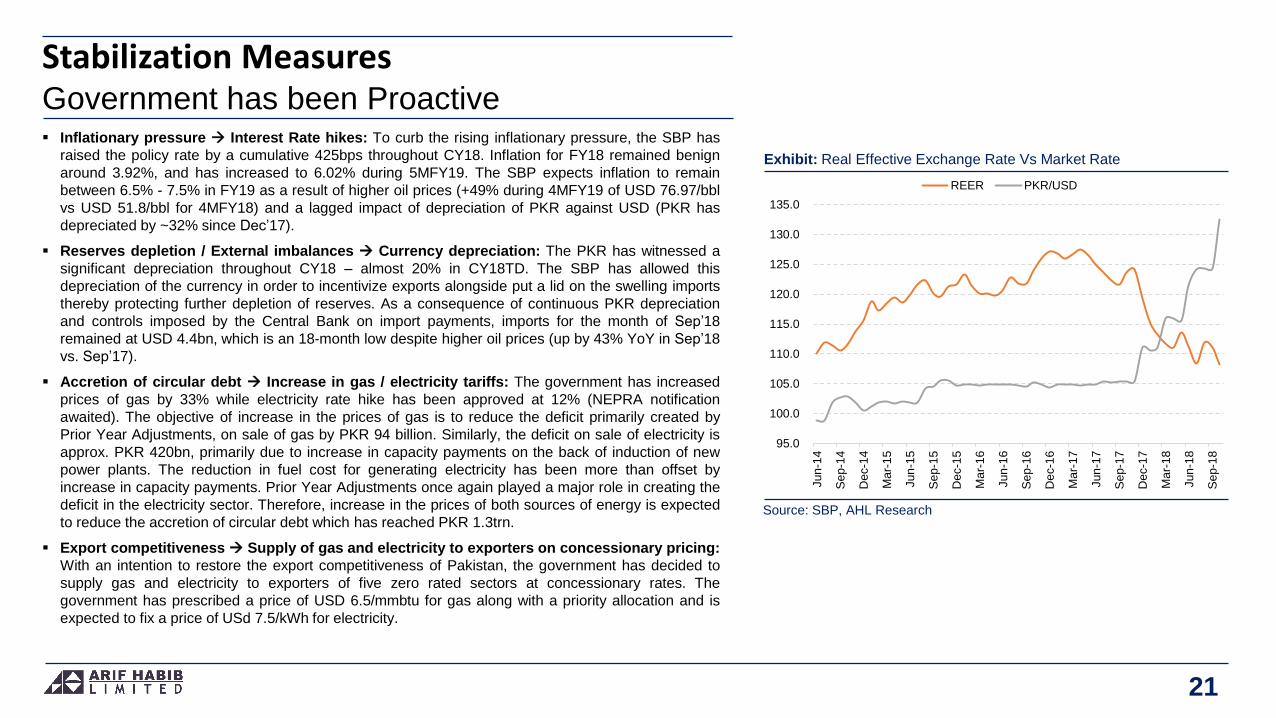
Inflationary pressure Interest Rate hikes: To curb the rising inflationary pressure, the SBP has
raised the policy rate by a cumulative 425bps throughout CY18. Inflation for FY18 remained benign
around 3.92%, and has increased to 6.02% during 5MFY19. The SBP expects inflation to remain
between 6.5% - 7.5% in FY19 as a result of higher oil prices (+49% during 4MFY19 of USD 76.97/bbl
vs USD 51.8/bbl for 4MFY18) and a lagged impact of depreciation of PKR against USD (PKR has
depreciated by ~32% since Dec’17).
Reserves depletion / External imbalances Currency depreciation: The PKR has witnessed a
significant depreciation throughout CY18 – almost 20% in CY18TD. The SBP has allowed this
depreciation of the currency in order to incentivize exports alongside put a lid on the swelling imports
thereby protecting further depletion of reserves. As a consequence of continuous PKR depreciation
and controls imposed by the Central Bank on import payments, imports for the month of Sep’18
remained at USD 4.4bn, which is an 18-month low despite higher oil prices (up by 43% YoY in Sep’18
vs. Sep’17).
Accretion of circular debt Increase in gas / electricity tariffs: The government has increased
prices of gas by 33% while electricity rate hike has been approved at 12% (NEPRA notification
awaited). The objective of increase in the prices of gas is to reduce the deficit primarily created by
Prior Year Adjustments, on sale of gas by PKR 94 billion. Similarly, the deficit on sale of electricity is
approx. PKR 420bn, primarily due to increase in capacity payments on the back of induction of new
power plants. The reduction in fuel cost for generating electricity has been more than offset by
increase in capacity payments. Prior Year Adjustments once again played a major role in creating the
deficit in the electricity sector. Therefore, increase in the prices of both sources of energy is expected
to reduce the accretion of circular debt which has reached PKR 1.3trn.
Export competitiveness Supply of gas and electricity to exporters on concessionary pricing:
With an intention to restore the export competitiveness of Pakistan, the government has decided to
supply gas and electricity to exporters of five zero rated sectors at concessionary rates. The
government has prescribed a price of USD 6.5/mmbtu for gas along with a priority allocation and is
expected to fix a price of USd 7.5/kWh for electricity.
Stabilization Measures Government has been Proactive
Exhibit: Real Effective Exchange Rate Vs Market Rate
Source: SBP, AHL Research
21
95.0
100.0
105.0
110.0
115.0
120.0
125.0
130.0
135.0
Jun
-14
Se
p-1
4
Dec-1
4
Ma
r-1
5
Jun
-15
Se
p-1
5
Dec-1
5
Ma
r-1
6
Jun
-16
Se
p-1
6
Dec-1
6
Ma
r-1
7
Jun
-17
Se
p-1
7
Dec-1
7
Ma
r-1
8
Jun
-18
Se
p-1
8
REER PKR/USD
Page 22
Housing shortage PM Housing Scheme: According to World Bank studies, Pakistan faces a
shortfall of 10mn housing units, which is increasing by 0.6mn units annually. The government intends
to reduce this gap and has embarked upon an ambitious plan to build 5mn low cost housing units.
The government’s task includes building a policy framework along with improvement in legislation to
incentivize private sector builders to participate in this initiative accompanied by improvement in land
records (digitization) and utilization of government’s land to break urban land monopoly. Mortgage
financing in Pakistan stands very low at 0.5% of GDP compared to 3% in Bangladesh and 7.7% in
India on account of: 1) Low contract enforcement and, 2) Uncertainty of title deeds which restrict
banks to take exposure in the housing sector. If the government is able to dilute the impediments to
construction of low cost housing in Pakistan and initiate the process, it would be a long term positive
for many local industries including but not limited to steel and cement.
External Financing Gap IMF Negotiations underway + Assistance from friendly countries:
According to our estimates, the FY19 Current Account deficit is expected to be restricted to USD 10bn
coupled with Debt servicing of USD 11bn. Cumulatively the gross external financing requirement
clocks-in at around USD 21bn. IMF is expected to finance part of this requirement while the remaining
amount is expected to be contributed by friendly countries including China, UAE and Saudi Arabia.
Saudi Arabia has already pledged to provide USD 3bn immediate deposit to support Pakistan’s
reserves, while an additional USD 3bn worth of oil deferred payments facility has been provided.
Support from China and UAE is also expected,
Stabilization MeasuresGovernment has been Proactive
Exhibit: Housing Shortage (percent share of total population)
Source: World Bank, NLIHC
22
35%
31%
18%
13%11%
4%2%
0%
5%
10%
15%
20%
25%
30%
35%
40%
Afg
ha
nis
tan
Pakis
tan
Bang
lad
esh
Sri L
anka
India
US
A
Germ
any
Page 23
AHL ViewFurther Measures needed for Economic Revival
Exhibit: Historical Foreign Direct Investment
Source: SBP, AHL Research
23
Broaden tax base by i) enhancing documentation of the economy, and ii) imposition of tax on
agriculture and recovery of the same from wholesale and retail trade.
Reduce losses in State Owned Enterprises through reform and restrict government’s role in business
by divestment from government owned entities.
Increase value added exports by providing inputs at competitive prices and improve labor productivity
via provision of vocational training.
Support import substitution industries.
Encourage remittances through formal banking channels.
Check abuse of Afghan Transit Trade, renegotiate Free Trade Agreements as well as control under
invoicing of imports and exports to protect local industry.
Attract foreign investment in exporting industries via establishment of Special Economic Zones.
Further improve energy mix towards low cost energy and reduce the basket price of electricity via
focusing on indigenous sources of energy like Thar Coal, wind and solar power.
Control Transmission and Distribution (T&D) losses for electricity and Unaccounted For Gas (UFG)
losses for gas distribution companies to reduce the cost of gas and electricity.
Improve Ease of Doing Business, whereby undue regulations and delays have put Pakistan at 147th
rank, compared with 100th rank of India and 111th rank of Sri Lanka..
0.8
1.5 1.7
1.0
2.3
2.7 3.1
0.6
15%
6%
41%
32%
46%44%
59%56%
0%
10%
20%
30%
40%
50%
60%
70%
-
0.5
1.0
1.5
2.0
2.5
3.0
3.5
FY12 FY13 FY14 FY15 FY16 FY17 FY18 4MFY19
Total FDI China's % of Total (RHS)(USD bn)
Page 24
Pakistan EconomyKey Economic Indicators
Exhibit: Key Indicators
Source: SBP, PBS, AHL Research
24
FY12A FY13A FY14A FY15A FY16A FY17A FY18A FY19E FY20F
Real
GDP 3.8% 3.7% 4.0% 4.2% 4.7% 5.3% 5.8% 4.0% 4.5%
GDP (USD bn) 224.0 231.0 244.0 271.0 279.0 305.0 312.6 281.6 285.5
Prices
CPI (% YoY) 11.00% 7.40% 8.60% 4.60% 2.90% 4.15% 3.95% 7.95% 7.18%
Discount Rate - Period end 12.00% 9.50% 10.00% 7.00% 6.25% 6.25% 7.00% 11.50% 11.50%
External Sector (USD bn)
Exports 24.7 24.8 25.1 22.9 22.0 21.7 24.8 26.2 28.8
Imports 40.5 40.2 41.8 41.3 41.2 48.5 56.0 54.0 52.0
Trade Deficit 15.8 15.4 16.7 18.4 19.2 26.8 31.2 27.8 23.2
Remittances 13.2 13.9 15.8 18.7 19.9 19.3 19.6 22.2 23.3
FX Reserves (Period End) 15.3 11.0 14.1 18.7 23.1 21.4 16.4 16.5 19.0
Exchange Rate (Period End) 94.6 99.7 98.8 101.8 104.8 104.9 121.5 147.0 152.9
PKR Depreciation (%) 10.0 5.4 (0.9) 3.1 2.9 0.1 15.9 21.0 4.0
(% of GDP)
Current Account Deficit 2.1% 1.1% 1.2% 1.0% 1.7% 4.0% 6.1% 3.6% 2.5%
Trade Deficit 7.1% 6.7% 6.8% 6.8% 6.9% 8.8% 10.0% 9.9% 8.1%
Fiscal Deficit 6.6% 8.0% 5.5% 5.3% 4.6% 5.8% 6.6% 5.0% 4.5%
External Debt 30.9% 27.0% 25.6% 24.2% 26.6% 27.4% 33.7% 36.2% 39.2%
Domestic Debt 38.1% 42.5% 43.3% 44.4% 46.9% 46.5% 47.7% 60.1% 66.3%
Page 25
25
Capital Markets
Page 26
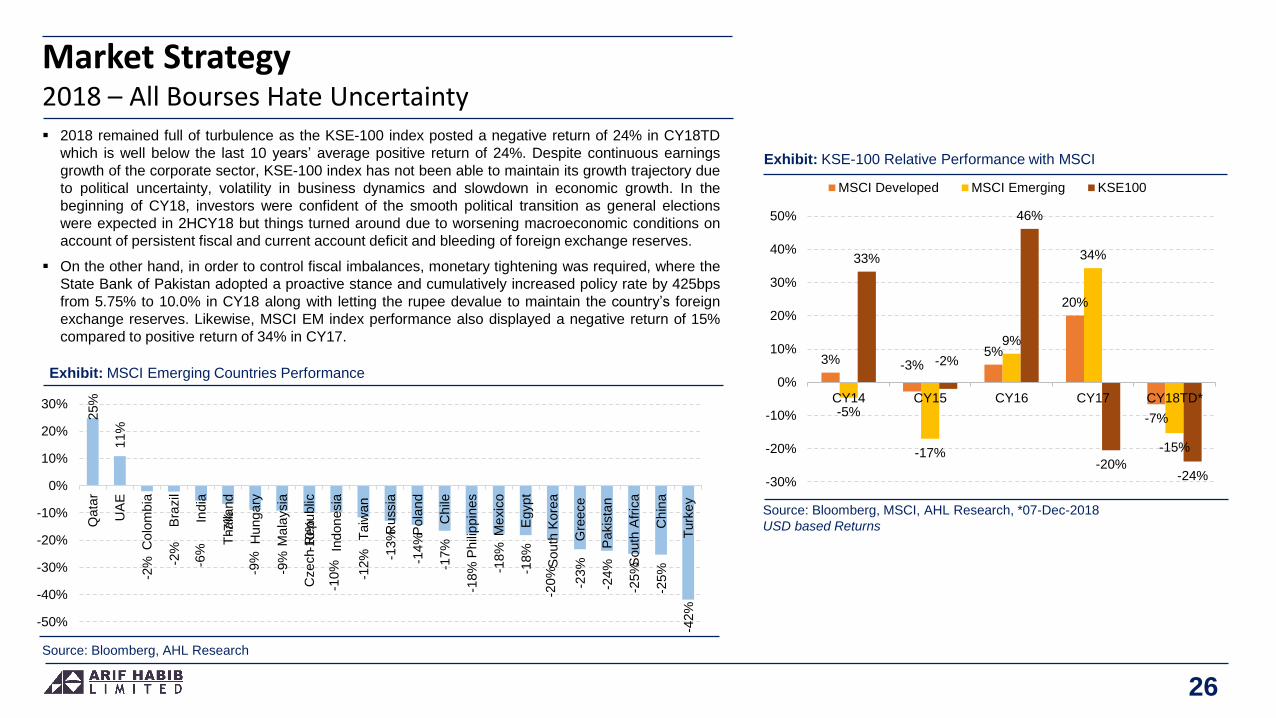
2018 remained full of turbulence as the KSE-100 index posted a negative return of 24% in CY18TD
which is well below the last 10 years’ average positive return of 24%. Despite continuous earnings
growth of the corporate sector, KSE-100 index has not been able to maintain its growth trajectory due
to political uncertainty, volatility in business dynamics and slowdown in economic growth. In the
beginning of CY18, investors were confident of the smooth political transition as general elections
were expected in 2HCY18 but things turned around due to worsening macroeconomic conditions on
account of persistent fiscal and current account deficit and bleeding of foreign exchange reserves.
On the other hand, in order to control fiscal imbalances, monetary tightening was required, where the
State Bank of Pakistan adopted a proactive stance and cumulatively increased policy rate by 425bps
from 5.75% to 10.0% in CY18 along with letting the rupee devalue to maintain the country’s foreign
exchange reserves. Likewise, MSCI EM index performance also displayed a negative return of 15%
compared to positive return of 34% in CY17.
Market Strategy2018 – All Bourses Hate Uncertainty
Exhibit: KSE-100 Relative Performance with MSCI
Source: Bloomberg, MSCI, AHL Research, *07-Dec-2018
USD based Returns
26
3% -3%5%
20%
-7%-5%
-17%
9%
34%
-15%
33%
-2%
46%
-20%-24%-30%
-20%
-10%
0%
10%
20%
30%
40%
50%
CY14 CY15 CY16 CY17 CY18TD*
MSCI Developed MSCI Emerging KSE100
Exhibit: MSCI Emerging Countries Performance
Source: Bloomberg, AHL Research
25%
11%
-2% -2
%
-6%
-7%
-9%
-9%
-10%
-10%
-12% -1
3%
-14%
-17%
-18% -1
8%
-18%
-20%
-23%
-24%
-25%
-25%
-42%
-50%
-40%
-30%
-20%
-10%
0%
10%
20%
30%
Qata
r
UA
E
Co
lom
bia
Bra
zil
India
Tha
iland
Hu
nga
ry
Ma
laysia
Czech R
epu
blic
Indon
esia
Taiw
an
Ru
ssia
Pola
nd
Ch
ile
Phili
ppin
es
Me
xic
o
Egypt
South
Kore
a
Gre
ece
Pakis
tan
South
Afr
ica
Ch
ina
Turk
ey
Page 27
Five-year low average volume and value: As a consequence of bearish sentiments dominating the
current year, average volumes dropped to five year low to settle at 190mn shares, down by 20% YoY
compared to CY17 average volumes of 237mn shares. Likewise, average value traded plunged by
42% YoY to USD 67mn (this level was last observed in CY13) compared to USD 115mn in CY17. The
decline in average traded value and volumes was as a result of i) lack of investors’ confidence amid
political uncertainty (election year and new government settling in), ii) rupee devaluation resulting in
foreign selling, and iii) economic challenges for new political setup. This year volumes registered a
high of 461mn shares on 29th Oct’18 - highest volumes since MSCI emerging market inclusion on
24th May’17 of 607mn shares. On the other hand, this year the market witnessed its lowest volumes at
57mn shares on 17th May’18.
Sectors-wise volume details: Sectors that attracted major volumes during the year were Chemicals,
Commercial Banks, Cements, Technology & Communication, and Power Generation, registering
average volumes of 25.9mn, 21.8mn, 21.6mn, 16.7mn and 10.8mn, respectively. Whereas on a scrip-
wise basis, volumes were led by BOP (9.52mn), LOTCHEM (8.97mn) and KEL (8.64mn).
Index Contribution: Laggards dominating the trend of contributions to the index included Cements
(515pts, 39% of total decline) followed by Automobile Assemblers (437pts, 33% of total decline), Food
and Personnel Care Products (326pts, 25% of total decline), Engineering (299pts, 23% of total
decline), Insurance (147pts, 11% of total decline), and Pharmaceuticals (142pts, 11% of total decline).
Meanwhile, scrip wise top contributions to the downside were by HBL (449pts, 34% of total decline)
and UBL (354pts, 27% of total decline) primarily attributable to earnings’ hit owing to: i) HBL’s higher
admin expenses (on account of business transformation and compliance program), and ii) UBL’s
significant one-off pension cost of PKR 8.8bn and gargantuan provisioning expenses primarily on
overseas loan book. Scrip wise positive contributors were i. FFC (300 pts), ii. BAHL (293 pts), iii.
ENGRO (282 pts), iv. EFERT (204 pts), and v. BAFL (172 pts).
Equities: Sluggish TradingTraded Value Declined by 42% YoY
Exhibit: Traded Value Declined by 42% YoY
Source: PSX, AHL Research, *07-Dec-2018
27
79
173
223 209
247
282
237
189
-
20
40
60
80
100
120
140
-
50
100
150
200
250
300
CY
-11
CY
-12
CY
-13
CY
-14
CY
-15
CY
-16
CY
-17
CY
-18T
D*
Avg. Traded Volume Avg. Traded Value (RHS)(USD mn)
Page 28
2018: Foreign Portfolio InvestmentHighest Ever Foreign Selling during CY18
Exhibit: Highest Ever Foreign Divestment during CY18
Source: NCCPL, AHL Research, *07-Dec-2018
28
Pakistani market witnessed worst foreign outflow in a decade: Foreign investors marked their
fourth straight year of selling shares as we witnessed net sell during CY18TD, which expanded to
USD 511mn compared to USD 488mn in CY17. Divestment by foreigners was engrossed by
Insurance Companies, Individuals and Companies worth USD 300mn, USD 129mn and USD 90mn,
respectively. During first six months, foreign selling clocked-in at USD 133mn while majority of the
selling was observed in second half on the back of sharp currency movement, economic challenges
and MSCI’s relocation of blue chips (LUCK and UBL) to small cap index resulting in major outflow.
Sector-wise offloading: Major foreign selling was witnessed in i. Commercial Banks (USD 259mn)
given decline in profitability of large banks due to pension cost, higher admin costs and higher
provisioning, ii. Exploration and Production (USD 139mn) primarily due to rupee devaluation, iii.
Cements (USD 72mn) amid surge in international coal prices and inability to increase cement prices,
iv. Power Generation and Distribution (USD 34mn), and v. Textile (USD 26mn).
Japan witnessed significant capital outflow in Asia-Pac Region: Asian markets bore the brunt as
foreign investors continuously pulled out their capital from Asia-Pac region due to external
developments such as interest rates hike by US Fed reflecting higher yields on Treasury bills, and
trade war of US with other countries. The data of Asia-Pac region reveals that major outflows were
witnessed in Japan, Taiwan, Thailand, South Korea and India at USD 44,350mn, USD 11,234mn and
USD 8,694mn, USD 5,538mn and USD 4,249mn, respectively. While imitating the same trend,
Pakistan also noticed total outflows of USD 511mn. However, China and Vietnam remains the country
in the list which managed to attract massive foreign inflows of USD 7,868mn (till Sep’18) and USD
1,866mn, respectively.
Outlook: The wait for PKR depreciation is largely over as local currency has depreciated by 20% in
CYTD to PKR 139/USD. We expect foreign investors to start accumulating shares as the KSE-100
index is currently trading at an attractive PE of 7.6x (2019) compared to regional (Asia-Pac) average
of 17.1x, while offering DY of ~7.6% versus~2.2% offered by the region.
126
398 383
(315) (339)
(488) (511) (600)
(400)
(200)
-
200
400
600
CY
-12
CY
-13
CY
-14
CY
-15
CY
-16
CY
-17
CY
18
TD
*
(USD mn)
Page 29
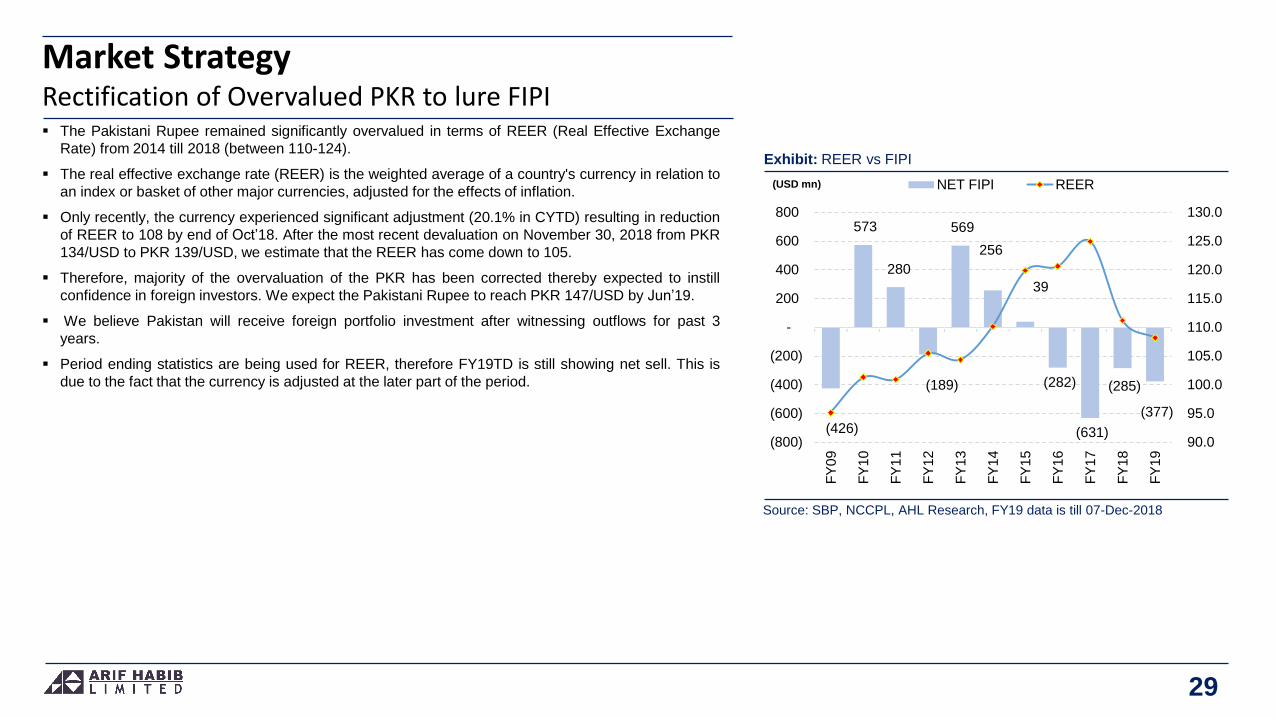
The Pakistani Rupee remained significantly overvalued in terms of REER (Real Effective Exchange
Rate) from 2014 till 2018 (between 110-124).
The real effective exchange rate (REER) is the weighted average of a country's currency in relation to
an index or basket of other major currencies, adjusted for the effects of inflation.
Only recently, the currency experienced significant adjustment (20.1% in CYTD) resulting in reduction
of REER to 108 by end of Oct’18. After the most recent devaluation on November 30, 2018 from PKR
134/USD to PKR 139/USD, we estimate that the REER has come down to 105.
Therefore, majority of the overvaluation of the PKR has been corrected thereby expected to instill
confidence in foreign investors. We expect the Pakistani Rupee to reach PKR 147/USD by Jun’19.
We believe Pakistan will receive foreign portfolio investment after witnessing outflows for past 3
years.
Period ending statistics are being used for REER, therefore FY19TD is still showing net sell. This is
due to the fact that the currency is adjusted at the later part of the period.
Market StrategyRectification of Overvalued PKR to lure FIPI
Exhibit: REER vs FIPI
Source: SBP, NCCPL, AHL Research, FY19 data is till 07-Dec-2018
29
(426)
573
280
(189)
569
256
39
(282)
(631)
(285)
(377)
90.0
95.0
100.0
105.0
110.0
115.0
120.0
125.0
130.0
(800)
(600)
(400)
(200)
-
200
400
600
800
FY
09
FY
10
FY
11
FY
12
FY
13
FY
14
FY
15
FY
16
FY
17
FY
18
FY
19
NET FIPI REER(USD mn)
Page 30
Pakistan’s high Current Account deficit (USD 18bn or 6.1% of GDP) was the primary reason behind
investors skepticism towards performance of the domestic equity bourse. With the needed adjustment
in the currency along with other steps like incentives for exporters along with imposition of regulatory
duties on imports, the CAD for FY19 is expected to come down to USD 10bn – a reduction of 44%
YoY (4.0% of GDP).
Weakness in Balance of Payments was behind the shortcoming in other macro indicators like higher
inflation, higher interest rates and PKR depreciation. We believe monthly CAD from Jan’19 will reduce
to around USD 600mn, which will be positive for the market. Financing this deficit through a
combination of FDI and additional borrowings should not be a concern.
Agreement with the IMF and receipt of funds from friendly countries (including China, UAE and Saudi
Arabia) should be positive for the market sentiment.
Attractive Valuations: PSX is presently trading at 2019 PE of 7.6x, which is lower than the average
PE’s of last 7 years. We contend that despite increase in interest rates (leading to higher risk free
rate) the valuations and macro outlook are favorably compared with 2012 when GDP growth was
lower and inflation was higher. In addition, the equity market can perform well due to clarity on the
political front, which wasn’t there in the past 2 years (since Panama leaks).
Market StrategyBoP Sustainability to increase investors’ confidence
Exhibit: Regional Discount to Peers
Source: Bloomberg, AHL Research
30
9.5
11.2
4.9
8.7 8.7
6.1
7.5
9.3
11.3
9.3
12.4
10.3
8.9
7.6
0%
10%
20%
30%
40%
50%
60%
-
2.0
4.0
6.0
8.0
10.0
12.0
14.0
16.0
18.0
CY
06
CY
07
CY
08
CY
09
CY
10
CY
11
CY
12
CY
13
CY
14
CY
15
CY
16
CY
17
CY
18
CY
19E
KSE100 Regional Average
Regional Discount Average Discount
Page 31
E&Ps to Lead Earnings Growth: During 2018, earnings growth arrived at 8.6% led by 28% growth in
the E&P Sector on the back of 19% higher oil prices. The heavy weight banking sector is expected to
show a negative growth of 3.8% primarily as a consequence of drastic reduction in large banks’
profitability. The cement sector has witnessed a decline of 3.6% amid initiation of price war amongst
cement companies and their inability to completely pass on the impact of higher coal prices (+47%
YoY) resulting in lower gross margins (down by 785bps).
We project an uptick in earnings of KSE-100 to a 5 year high of 15.2% in 2019 on account of 35.9%
uptick in E&Ps and 32% uptick in Banks, which are two of the highest weighted sectors in the PSX
(weight of 15.1% and 25.2%, respectively). Our growth estimates for E&Ps is premised on the
assumption of higher dollar parity (PKR 147/USD end Jun’19) along with assumption of Arab Light oil
prices at an average of USD 65/barrel in FY19. Whereas, higher profitability of the banking sector is
expected due to realization of lagged impact of 425bps increase in policy rate during CY18.
Corporate earnings are expected to increase by 15.2%, which is a 5-yr high, on the back of growth in
profitability of the E&P sector, owing to 17% average PKR depreciation and 4.5% higher oil price
(USD 65/bbl for FY19 compared to USD 62.2/bbl in FY18).
Market StrategyEarnings Growth
Exhibit: Corporate Sector Earnings Growth: Trend & Forecast
Source: Company Financials, AHL Research
31
Exhibit: KSE100 Index Performance
Source: PSX, AHL Research
-
100
200
300
400
500
35,000
37,000
39,000
41,000
43,000
45,000
47,000
Jan-1
8
Feb
-18
Ma
r-1
8
Apr-
18
Ma
y-1
8
Jun-1
8
Jul-1
8
Aug-1
8
Sep-1
8
Oct-
18
No
v-1
8
De
c-1
8
Volume (RHS) Index (mn Shares)
(%) 2013 2014 2015 2016 2017 5-Y Avg. 2018E 2019F
E&P -3.2 31.6 -29.4 -33.3 30.7 -0.7 27.8 35.9
Banks 3.5 29.2 15.0 -3.4 -8.5 7.2 -3.8 32.0
Textiles 98.1 -13.5 -8.7 23.3 -1.8 19.5 -1.3 28.8
Fertilizer 43.8 0.4 78.3 -41.0 3.2 17.0 28.2 19.5
Power 16.7 -7.4 29.4 3.7 0.0 8.5 9.3 17.0
Steel 31.7 270.0 -33.3 321.7 126.0 143.2 26.3 10.5
OMCs -43.1 166.3 -55.1 127.2 65.4 52.1 -11.3 -3.5
Chemicals 4.5 -12.2 38.4 69.1 27.2 25.4 38.6 -9.5
Autos 16.0 12.6 120.7 -1.4 37.4 37.1 9.7 -27.7
Cement 82.0 16.6 15.6 20.3 -2.7 26.3 -3.6 -32.4
KSE100 12.0 20.9 6.5 -3.8 7.6 8.6 6.7 15.2
Page 32
47,000 Index is targeted for Dec’19: KSE-100 Index is expected to cross 47,000 points by Dec’19.
We have used earnings growth methodology to calculate returns.
Balance of Payments Sustainability to increase investor confidence: Uncertainty regarding
Balance of Payments and Foreign Currency Reserves is one of the major reasons for lagging
performance in prior year of KSE-100. Lower Current Account Deficit (USD 600mn monthly from
Jan’19 onwards) along with arrangement of funds from IMF and friendly countries including China,
UAE and Saudi Arabia are expected to brighten investor mood.
Rectification of overvalued currency to lure Foreign Portfolio Investment: The Pakistani Rupee
remained significantly overvalued in terms of REER (Real Effective Exchange Rate) from 2014 till
2018 (between 110-124). After the most recent devaluation on November 30, 2018 from PKR
134/USD to PKR 139/USD, we estimate that the REER has come down to 105. Historical data
suggests that FIPI has been positive in years when REER was below 100 and FIPI outflow has been
witnessed during years when PKR was overvalued using REER.
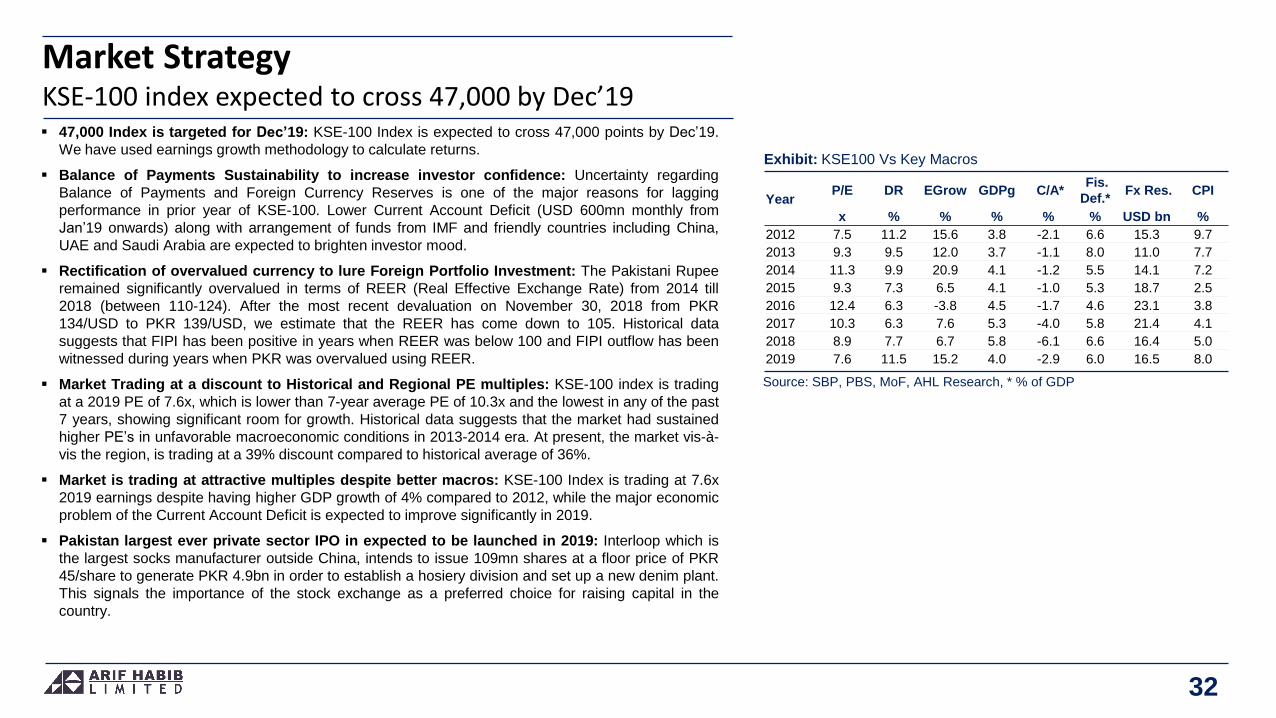
Market Trading at a discount to Historical and Regional PE multiples: KSE-100 index is trading
at a 2019 PE of 7.6x, which is lower than 7-year average PE of 10.3x and the lowest in any of the past
7 years, showing significant room for growth. Historical data suggests that the market had sustained
higher PE’s in unfavorable macroeconomic conditions in 2013-2014 era. At present, the market vis-à-
vis the region, is trading at a 39% discount compared to historical average of 36%.
Market is trading at attractive multiples despite better macros: KSE-100 Index is trading at 7.6x
2019 earnings despite having higher GDP growth of 4% compared to 2012, while the major economic
problem of the Current Account Deficit is expected to improve significantly in 2019.
Pakistan largest ever private sector IPO in expected to be launched in 2019: Interloop which is
the largest socks manufacturer outside China, intends to issue 109mn shares at a floor price of PKR
45/share to generate PKR 4.9bn in order to establish a hosiery division and set up a new denim plant.
This signals the importance of the stock exchange as a preferred choice for raising capital in the
country.
Market StrategyKSE-100 index expected to cross 47,000 by Dec’19
32
YearP/E DR EGrow GDPg C/A*
Fis.
Def.*Fx Res. CPI
x % % % % % USD bn %
2012 7.5 11.2 15.6 3.8 -2.1 6.6 15.3 9.7
2013 9.3 9.5 12.0 3.7 -1.1 8.0 11.0 7.7
2014 11.3 9.9 20.9 4.1 -1.2 5.5 14.1 7.2
2015 9.3 7.3 6.5 4.1 -1.0 5.3 18.7 2.5
2016 12.4 6.3 -3.8 4.5 -1.7 4.6 23.1 3.8
2017 10.3 6.3 7.6 5.3 -4.0 5.8 21.4 4.1
2018 8.9 7.7 6.7 5.8 -6.1 6.6 16.4 5.0
2019 7.6 11.5 15.2 4.0 -2.9 6.0 16.5 8.0
Exhibit: KSE100 Vs Key Macros
Source: SBP, PBS, MoF, AHL Research, * % of GDP
Page 33
Market StrategyKSE-100 Index Performance (CY18TD)
Exhibit: KSE100 Index Performance
Source: PSX, AHL Research
33
-
50
100
150
200
250
300
350
400
450
500
28,500
30,500
32,500
34,500
36,500
38,500
40,500
42,500
44,500
46,500
48,500
Jan-1
8
Feb
-18
Ma
r-1
8
Apr-
18
Ma
y-1
8
Jun-1
8
Jul-1
8
Aug-1
8
Sep-1
8
Oct-
18
No
v-1
8
De
c-1
8
KSE Volume KSE100 Index (mn Shares)
PKR Depreciated by
5% against USD
Verdict against former premier
to serve 10 years jail
No Consensus on Caretaker
Prime Minister
Foreigners Inflow
propels the market
Budget hype phased away from
the market
Imran Khan claims victory in
Pakistan elections
Delay in IMF bailout till
economic stabilization
Interest Rate Hike &
PKR Depreciation
Saudi Arabia granted USD 6bn
financial support package
MSCI Rebalancing
Page 34
PKR 236bn raised during past 5 years: Over the past decade, IPOs (Initial Public Offerings) , SPOs
(Secondary Public Offerings) and SEOs (Secondary Equity Offerings) remained a major source of
fund raising and capital formation for companies. Over the past decade, PKR 255bn has been raised
from the market, while more importantly, PKR 236bn has been raised during past five years.
Government has been the biggest beneficiary: Government has been the biggest beneficiary of
these offerings as it has raised PKR 170bn through 4 SPOs including UBL, HBL, ABL and PPL, which
is approx. 67% of the total proceeds.
Increase in IPOs and SPOs expected during 2019: The amount of SPOs and IPOs are expected to
increase during 2019 due to the following reasons : -
2018 was an election year, and therefore political uncertainty was prevalent. With elections
being peacefully concluded and smooth democratic transition taking place along with settling
in of the new government, 2019 is expected to be stable year in terms of political environment.
Higher interest rates are expected to encourage issuers to go for equity offering as cost of debt
has increased significantly as a result of higher discount rate (hike of 425bps during CY18).
On the other hand, valuations will drop as a result of higher return on debt, which is an
alternate investment avenue for investors.
Textile sector is expected to offer more IPOs as it benefits from government’s focus on
exports, PKR devaluation (20% in CYTD), fiscal incentives and concessionary energy pricing
(gas and electricity).
Although the textile sector has access to low cost financing in terms of LTFF (Long term
Financing Facility) and EFS (Export Financing Scheme) for capacity expansion and working
capital, respectively, not all kinds of expenditures (like cost of construction, machinery
erection, commissioning etc.) are covered in those schemes.
As the market is also expected to post a healthy run during 2019 on the back of improving
macros and political stability, companies are expected to resume/initiate IPOs.
We expect eight to ten IPOs during 2019 in Steel, Power, Transport and Logistic, Auto Parts,
Pharma, Food and IT sectors.
Equity Market OfferingsIncrease expected due to numerous factors
Exhibit: Equity Market Offering
Source: PSX, AHL Research
34
Year No. of IPO/SPO/SEO Amount (PKR bn)
2008 9 5.8
2009 3 1.5
2010 6 6.3
2011 4 3.1
2012 3 1.5
2013 1 0.8
2014 8 74.9
2015 8 116.8
2016 5 23.8
2017 5 9.0
2018 5 11.7
Total 57 255.3
Page 36
Commercial BanksRate Hike Era – Stimulant For Earnings
Exhibit: Profitability & Price Performance
Source: Company Financials, AHL Research
36
-80%
-60%
-40%
-20%
0%
20%
40%
60%
80%
100%
BO
P
SIL
K
SB
L
JS
BL
ME
BL
HM
B
BA
FL
SC
BP
L
NB
P
SN
BL
AB
L
FA
BL
BA
HL
AK
BL
SM
BL
MC
B
BO
K
UB
L
CYTD Price Performance YoY Profitability Growth (9MCY18)
Key Investment Theme:
NIMs to inflect: Net Interest Margins (NIMs) of the sector have been under pressure lately owing to
maturity of high yielding PIBs as well as compressing spreads. Spreads have contracted from an
average of ~6% in CY14 to 4.9% during CY18TD, while NIMs have declined from an average of
~4.1% in CY14 to ~3.3% currently. Going forward, banks’ NIMs are likely to inflect on the heels of
higher rates on lending and improving spreads. AHL universe NIMS are expected to settle at an
average of 4.5% during CY19-CY23.
Deposit Mobilization: Banking sector deposit growth has recently seen a meltdown, witnessing 9%
YoY growth during 9MCY18, and 10.9% YoY growth during CY17 tracking lower M2 growth (M2
growth for Sep’18 was 11% YoY as a result of negative Net Foreign Assets). The growth rates
compare rather unfavourably to average deposit growth rates of 13.6% during high interest rates era
(CY08-CY12). Going forward, with the expected normalization of Pakistan’s Balance of Payments
situation, we project an uptick of deposit mobilization to an average of 12% during CY19-CY23.
Increasing ADR: Banks have been increasing their exposure towards advances as the ADR of the
sector currently stands at 57.5% vis-à-vis last 5-Yr average of 48%. Increasing ADR bodes well for
sector earnings as banks will benefit from higher rates on lending and better spreads. However, we do
highlight that higher interest rates can also culminate in a lending squeeze (with a lagged impact)
because of which we have a relatively conservative outlook on advances growth growing forward (5-
Yr CAGR of 9.8%).
Investment yields to support earnings: Investment yields of banks have faced a downturn as high
yielding PIB’s have matured. According to SBP data, yields currently stand at ~6.25% declining from
an average of ~8% during CY14-17. Moreover, investment in PIB’s declined by 17.6% YoY during
1HCY18 as opposed to a 7% decline YoY during 1HCY17. Investment books are shifting in favour of
short-term securities to benefit from the rate hike (T-Bills investment have portrayed a 4.2% YoY
during 1HCY18). We expect the interest rate hike cycle to halt during CY19 which is when banks are
likely to mobilize funds towards PIB’s, and investment yields will depict an uptick. Banking sector IDR
currently stands at 61% as of 1HCY18 vs. 67% in SPLY, but has seen a rise on a sequential basis
(1QCY18: 54%).
Page 37
Key Investment Theme:
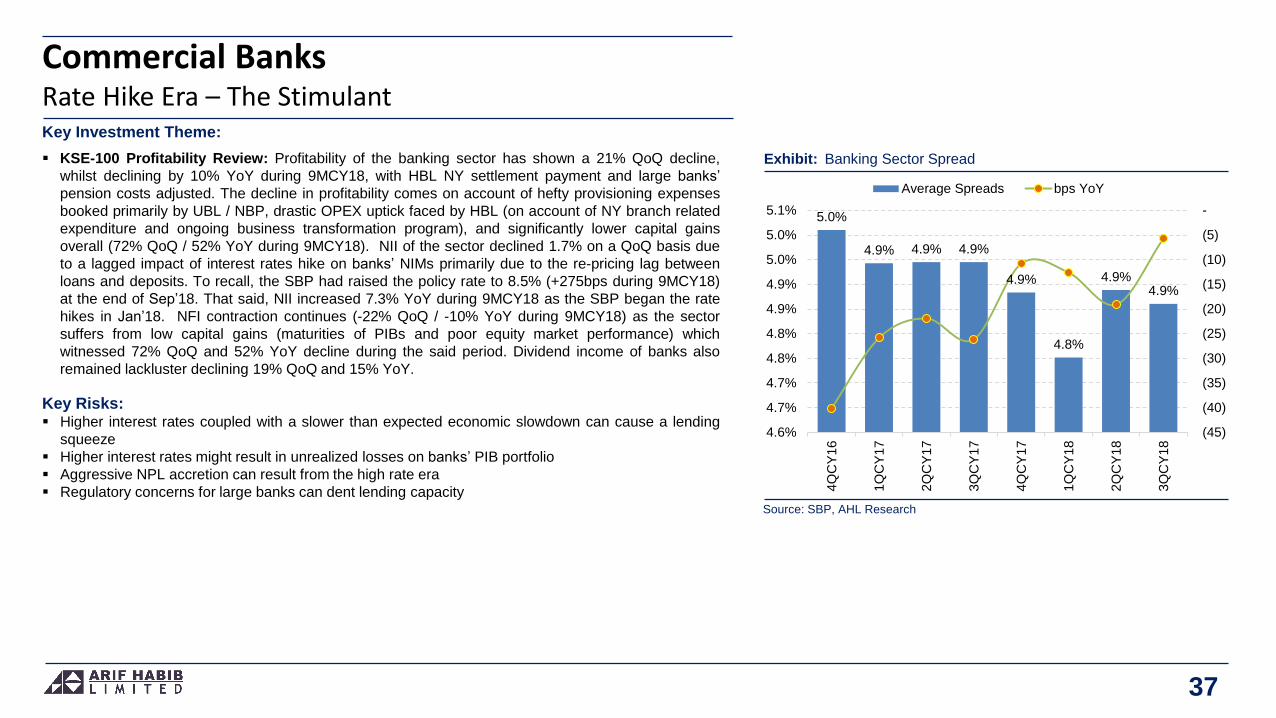
KSE-100 Profitability Review: Profitability of the banking sector has shown a 21% QoQ decline,
whilst declining by 10% YoY during 9MCY18, with HBL NY settlement payment and large banks’
pension costs adjusted. The decline in profitability comes on account of hefty provisioning expenses
booked primarily by UBL / NBP, drastic OPEX uptick faced by HBL (on account of NY branch related
expenditure and ongoing business transformation program), and significantly lower capital gains
overall (72% QoQ / 52% YoY during 9MCY18). NII of the sector declined 1.7% on a QoQ basis due
to a lagged impact of interest rates hike on banks’ NIMs primarily due to the re-pricing lag between
loans and deposits. To recall, the SBP had raised the policy rate to 8.5% (+275bps during 9MCY18)
at the end of Sep’18. That said, NII increased 7.3% YoY during 9MCY18 as the SBP began the rate
hikes in Jan’18. NFI contraction continues (-22% QoQ / -10% YoY during 9MCY18) as the sector
suffers from low capital gains (maturities of PIBs and poor equity market performance) which
witnessed 72% QoQ and 52% YoY decline during the said period. Dividend income of banks also
remained lackluster declining 19% QoQ and 15% YoY.
Key Risks: Higher interest rates coupled with a slower than expected economic slowdown can cause a lending
squeeze
Higher interest rates might result in unrealized losses on banks’ PIB portfolio
Aggressive NPL accretion can result from the high rate era
Regulatory concerns for large banks can dent lending capacity
Commercial BanksRate Hike Era – The Stimulant
Exhibit: Banking Sector Spread
37
Source: SBP, AHL Research
5.0%
4.9% 4.9% 4.9%
4.9%
4.8%
4.9%4.9%
(45)
(40)
(35)
(30)
(25)
(20)
(15)
(10)
(5)
-
4.6%
4.7%
4.7%
4.8%
4.8%
4.9%
4.9%
5.0%
5.0%
5.1%
4Q
CY
16
1Q
CY
17
2Q
CY
17
3Q
CY
17
4Q
CY
17
1Q
CY
18
2Q
CY
18
3Q
CY
18
Average Spreads bps YoY
Page 38
Key Investment Theme:
NII - The Forte: BOP’s NII tale tells a phenomenal growth story, portraying a staggering 5 Yr CAGR of
~49% during CY12-CY17. The growth in NII is the highest amongst the KSE-100 listed banking
sector, with peer banks averaging a CAGR of 11% and large banks averaging a CAGR of ~7%, in the
said period. BOP’s mark-up income has grown at a 5Yr CAGR of 7% while, more importantly, its
mark-up expense has declined at a 5Yr CAGR of 3%. With barely any PIBs on its book, the bank
stands afoot to benefit significantly from the rates hike. We project NII to depict a healthy growth of
17% (5-Yr CAGR).
Low cost deposit profile: Aggressive accumulation of low cost deposits over the years has
contributed to the glorious NII acceleration. Cost of deposits of the bank have shrunk from 7.4% in
CY12 to 3.4% in CY17, despite healthy deposit accumulation - 5-Yr CAGR of 16%. Current accounts
of the bank grew at a healthy 5-Yr CAGR of 24% with the proportion rising from 18% in CY12 to 26%
in CY17. That said, we project costs to settle at an average of 5.3% during CY18-CY20F as interest
rates are on the rise. Moreover, strength of the bank’s deposit portfolio is also sourced from a
consistent shedding off of expensive deposits. The bank’s fixed deposits proportion has reduced from
42% in CY12 to 30% currently. We forecast the trend to continue to benefit from rising rates, and
reduce its expensive deposits portfolio to an average 29% during CY18-CY20F.
Un-provided NPLs show drastic reduction: The bank’s coverage ratio has increased from 38% in
CY12 to 88% in CY17 (the bank booked provisioning of PKR 12bn in 4QCY17). Un-provided NPLs
reduced from PKR 43bn in CY12 to a mere PKR 6.5bn in CY17, with un-provided NPLs as a
proportion of equity reducing from a gargantuan 348% in CY12 to 22% in CY17. Going forward, we
expect advances to grow at a modest 5-Yr CAGR of 10% with infection to settle at an average of
10.7% during CY19-CY23. We have a conservative outlook on advances growth given we expect a
lending squeeze because of rising rates.
Key Risks: Unusual NPL accretion is a poignant downside risk to our valuations.
Exposure to textile sector (18.8% as at CY17 vis-a-vis 4% for the banking sector) does not bode well
for asset quality going forward.
Target Price PKR 18.3
Market Price PKR 12.9
Upside % 41.6
PSX Code BOP
Bank of PunjabReady To Soar High
Exhibit: The NII Growth Story
Source: Company Financials, AHL Research
38
0
5
10
15
20
25
30
0
10
20
30
40
50
60
70
80
CY12 CY13 CY14 CY15 CY16 CY17 CY18E CY19F
Mark-up income Mark-up expense
Net Interest Income (RHS)
(PKR bn) (PKR bn)
Page 39
Bank of PunjabReady To Soar High
PKR mn 2017A 2018E 2019F
Income Statement
Mark-up Income 15,655 20,720 27,572
Non-Mark-up Income 4,604 3,213 3,742
Total Income 20,258 23,932 31,314
OPEX 10,731 12,542 14,437
Post Tax Profit (3,384) 7,528 10,185
Balance Sheet
Advances 295,841 382,970 419,179
Deposits 242,488 238,275 261,833
Investments 556,192 635,196 716,004
Borrowings 38,949 38,112 42,960
Total Equity TIER - II 29,840 37,294 47,410
Revaluation Surplus 2,886 2,813 2,744
Source: Company Financials, AHL Research
Ratio Analysis Unit 2017A 2018E 2019F
Earnings PKR/share (1.7) 2.8 3.9
Dividend PKR/share - - -
Price to Earning x (5.0) 4.5 3.4
Price to Book x 0.7 0.9 0.7
NIMs % 3.0 3.4 4.1
ROE % (13.3) 24.7 25.9
ROA % (0.6) 1.1 1.3
Source: Company Financials, AHL Research
Exhibit: Reduction in Unprovided NPLs
Source: Company Financials, AHL Research
39
0%
50%
100%
150%
200%
250%
300%
350%
400%
0
10
20
30
40
50
60
70
CY12 CY13 CY14 CY15 CY16 CY17 CY18E CY19F
NPLs Unprovided NPLs Unprovided for NPLs/Equity
(PKR bn)
Page 40
Key Investment Theme:
Well Placed in the Rising Rates Era: BAFL’s fundamentals place it well in the rising interest rate
scenario making it a core beneficiary. The bank’s PIB portfolio has reduced to PKR 64bn (7.1% of
assets) compared to PKR 140bn at the end of CY17 (14% of assets). AHL universe average
PIB/assets ratio stands at 11.4% as at 9MCY18. Furthermore, the bank’s current account ratio stands
at a concrete 43% at present, which is likely to keep it relatively shielded from the impact of rising
rates on cost of deposits. BAFL’s mighty ADR of 72% compared to average of ~55% of the sector
(second only to FABL in the KSE-100 listed banking space) further cements BAFL’s position as a key
beneficiary of the rising rates era.
Supreme Asset Quality: BAFL’s loan book has portrayed an uptick of 19% YoY during 9MCY18,
which is marginally lower than industry advances growth of 22% during the same period. The
encouraging aspect of the bank’s loan book is its stellar asset quality, whereby infection stands at
3.5% (lowest in the AHL banking universe) and coverage stands 93.3% (above universe average of
92%). We have a conservative outlook on infection ratio as interest rates uptick may dent credit profile
of borrowers. We project infection to average out at 4% over the next 5 years. As of 3QCY18, 48% of
BAFL’s advances portfolio is constituted by the corporate segment while only 6% is contributed by
consumer loans – which presents an encouraging omen for asset quality going forward.
Strong Deposit Profile: Rising interest scenario coupled with a healthy current account base will
propel the bank’s NIMs upward. As of 3QCY18, the bank’s NIMs have clocked-in at 3.9% whereas the
last 5 years have seen NIMs hovering around 3.7%. Going forward, we project NIMs to touch an
average of 4.7% during CY19-CY21, which is above AHL universe average of 4.3%. A strong current
account proportion will help shield the bank’s cost of deposits from the higher interest rates. The
bank’s current account proportion has increased from 36% in CY14 to 43% as of 9MCY18. We expect
the ratio to climb up to an average of ~45% over the next three years.
Key Risks: Lower than expected rate hike.
Aggressive NPL accretion which can dent asset quality.
Target Price PKR 60.1
Market Price PKR 48.6
Upside % 23.5
PSX Code BAFL
Bank AlfalahThe Mid-Tier Star
Exhibit: Yields on advances to increase
Source: Company Financials, AHL Research
40
0.0%
2.0%
4.0%
6.0%
8.0%
10.0%
12.0%
14.0%
-
100
200
300
400
500
600
CY14 CY15 CY16 CY17 CY18E CY19F
Advances Infection Yields on Advances
(PKR bn)
Page 41
Bank AlfalahThe Mid-Tier Star
PKR mn 2017A 2018E 2019F
Income Statement
Mark-up Income 29,288 31,572 41,629
Non-Mark-up Income 10,580 11,310 12,421
Total Income 39,868 42,882 54,050
OPEX 25,717 24,589 28,224
Post Tax Profit 8,515 12,024 16,298
Balance Sheet
Advances 400,660 464,976 511,473
Deposits 653,346 683,526 747,134
Investments 401,742 313,224 341,848
Borrowings 206,567 136,705 164,370
Total Equity TIER - II 66,830 78,666 90,833
Revaluation Surplus 7,280 6,850 6,850
Source: Company Financials, AHL Research
Exhibit: Low cost deposit profile
Source: Company Financials, AHL Research
41
45
2
50
3
54
7
52
2
55
7
60
9
15
3
13
8
94
13
1
12
0 13
1
-
100
200
300
400
500
600
700
800
CY14 CY15 CY16 CY17 CY18E CY19F
CASA Fixed Deposits(PKR bn)
Ratio Analysis Unit 2017A 2018E 2019F
Earnings (new no. of shares) PKR/Share 4.8 6.8 9.2
Dividend PKR/Share 1.5 2.0 2.8
Price to Earning x 8.9 7.2 5.4
Price to Book x 1.1 1.1 1.0
NIMs % 3.5 3.8 4.9
ROE % 13.3 16.5 19.2
ROA % 0.9 1.2 1.6
Source: Company Financials, AHL Research
Page 42
Key Investment Theme:
Enticing Valuation: UBL’s stock price has faced a severe hammering this year, portraying a sharp
contraction of almost 20% in CY18TD. The bank currently trades at a P/B of 1.1x, which is at a 38%
discount to its last 5 year average of 1.5x. Moreover, the bank’s current multiple is at a 12% discount
to our exit multiple of 1.12x. On a trailing basis, the bank is operating at a current ROE of 13.4%
(pension cost adjusted) compared to CY17 ROE of 15.7%. We project average ROE of the bank to
clock-in at 20% for the next five years, led by ADR and strengthening deposit profile.
Cleaning up of the book: The bank has been suffering from a very fragile situation of its international
book, as NPLs on the overseas book have seen a drastic uptick of 52% YoY during 9MCY18
(domestic NPLs have contracted by 3% during the same period). The bank has booked heavy
provisioning expenses throughout the year (PKR 7.5bn for 9M) to build up its coverage against these
loans. Coverage on the international book has improved from 59% at the start of the year to 74%
currently, while NPLs have been provided for very adequately on the domestic book – at 91% at
present which is flattish compared to start of the year. The bank has been on a mission of contracting
its international balance sheet: as at 9MCY18, international deposits (USD) have declined by 16%
CY18TD while advances have also suppressed by 16% during same period. We expect provisioning
charges to decline 26% YoY and settle at PKR 7.4n during CY19 compared to PKR 10bn in CY18.
Asset Quality: An encouraging omen for the bank’s asset quality going forward is found in the bank’s
advances composition as at 9MCY18 whereby we see that the portfolio is dominated by the Power &
Energy sector (29%), which boasts a stellar asset quality in the banking sector of 2.9% (according to
SBP data for 1HCY18). In addition to this, the infamous textile sector which suffers a dismal infection
of 18.9%, contributes only 10% to UBL’s loan book. Going forward, we do expect NPL accretion of the
bank due to rising rates but we do not foresee a very aggressive pile-up of NPL stock for the bank.
We expect infection to settle at an average of 8.1% during CY19-CY21.
Key Risks: Fine/penalty on overseas operations (UBL has voluntarily liquidated its NY branch).
Further regulatory hurdles after being designated as a DSIB may curtail payout ratios. CET-1
requirement for the bank increased by 1.5% after being designated as a DSIB.
Target Price PKR 170.8
Market Price PKR 140.0
Upside % 22.0
PSX Code UBL
United Bank LimitedA Solid Valuation Play
Exhibit: Advances growth and rising yields to counter rising costs
Source: Company Financials, AHL Research
42
0.0%
2.0%
4.0%
6.0%
8.0%
10.0%
12.0%
0
100
200
300
400
500
600
700
800
900
CY14 CY15 CY16 CY17 CY18E CY19F
Advances Infection (RHS)
Yield on Advances (RHS) Cost of Deposits
(PKR bn)
Page 43
United Bank LimitedA Solid Valuation Play
PKR mn 2017A 2018E 2019F
Income Statement
Mark-up Income 58,092 58,233 68,757
Non-Mark-up Income 24,296 24,778 23,762
Total Income 82,848 83,769 93,428
OPEX 38,941 42,316 45,387
Post Tax Profit 26,197 13,178 25,538
Balance Sheet
Advances 642,507 736,167 809,334
Deposits 1,366,158 1,463,713 1,634,356
Investments 1,124,921 876,492 895,292
Borrowings 517,082 278,105 212,466
Total Equity TIER - II 174,735 174,867 186,420
Revaluation Surplus 33,828 31,850 31,267
Source: Company Financials, AHL Research
Exhibit: Growth in Current Accounts
Source: Company Financials, AHL Research
43
0.0%
2.0%
4.0%
6.0%
8.0%
10.0%
12.0%
14.0%
16.0%
18.0%
20.0%
0.0%
5.0%
10.0%
15.0%
20.0%
25.0%
30.0%
35.0%
40.0%
45.0%
CY15 CY16 CY17 CY18E CY19F
Current Accounts Fixed Deposits
Deposit Growth (RHS)
Ratio Analysis Unit 2017A 2018E 2019F
Earnings PKR/Share 21.4 10.7 20.6
Dividend PKR/Share 13.0 9.6 11.3
Price to Earning x 8.8 13.8 7.2
Price to Book x 1.3 1.0 1.0
NIMs % 3.4 3.1 3.7
ROE % 15.5 7.5 14.0
ROA % 1.4 0.6 1.3
Source: Company Financials, AHL Research
Page 44
Key Investment Theme:
Beefing up of CAR: In the aftermath of the NY fiasco (PKR 23.7bn settlement), HBL faced the
daunting task of strengthening up its capital base, which it has done so remarkably well. As of
9MCY18, HBL’s CAR stands at a mighty 17% compared to 16% at the start of the year, whereas Tier
1 CAR has settled at 12.7% compared to 12% at the start of the year. Strengthening of CAR has been
through a concerted effort of de-risking of operations, efforts to get corporate borrowers rated and
reducing international exposure, all of which has likely diluted risk weighted assets. HBL also beefed
up its Tier II capital through a revaluation of fixed assets worth ~PKR 10bn. HBL has been curtailing
its under-stress international operations: overseas loan book has contracted 22% CYTD while
international deposits have shrunk 11% CYTD.
Room for loan growth: Development of a concrete capital base will create room for loan book
expansion of the bank. We expect loan growth of the bank to settle at a 5-Yr CAGR of ~11%. A
nominal exposure to individuals (9%) and textiles (8%) is likely to keep infection in check in the rising
rates scenario. International NPLs once again depicted an uptick of 5% QoQ / 31% YoY. Albeit
domestic NPLs have decreased 8% YoY. International NPLs are provided for at a healthy coverage of
80% currently, while domestic NPL coverage ratio is at 88%. Overall infection for the bank has settled
at 7.6% as of 9MCY18 compared to 8.2% as at CY17. Going forward, we expect infection to hover
around an average of 8.1% during CY19-CY21.
OPEX to normalize 2HCY19 onwards: During 9MCY18, PKR 2.5bn out of the OPEX is on account
of business transformation program while remediation costs in NY contributed PKR 5.2bn. NY look-
backs are expected to continue until the end of 1HCY19. These costs will continue into 1HCY19 but
OPEX will start normalizing 2HCY19 onwards. The management said that about 70% of the business
transformation program costs will be booked in CY18. We expect the bank’s cost/income to come
down to 70% in CY19 compared to 75% in CY18E. Initiatives for financial inclusion/digitization such
as HBL Konnect, Farm Mobile App and Transaction & Employee Banking (TEB) are likely to help
revive fee income which we expect to grow at 9% during CY19.
Key Risks: Further pressure on OPEX on account of business transformation program/NY look-backs
Target Price PKR 155.2
Market Price PKR 132.5
Upside % 17.1
PSX Code HBL
Habib Bank LimitedStruggling For Glory
Exhibit: Curtailing International Operations
Source: Company Financials, AHL Research
44
268
308
237 217
159 165
130 113
-
50
100
150
200
250
300
350
CY15 CY16 CY17 9MCY18
Deposits Advances
(PKR bn)
Page 45
Habib Bank LimitedStruggling For Glory
PKR mn 2017A 2018E 2019F
Income Statement
Mark-up Income 83,067 81,662 108,916
Non-Mark-up Income 32,889 22,506 25,620
Total Income 115,957 104,168 134,537
OPEX 63,541 77,930 95,076
Post Tax Profit 7,829 13,948 24,276
Balance Sheet
Advances 851,502 968,907 1,056,005
Deposits 1,998,935 2,209,378 2,490,448
Investments 1,374,808 1,301,410 1,467,241
Borrowings 397,803 265,125 323,758
Total Equity TIER - II 188,815 197,235 210,209
Revaluation Surplus 21,287 21,626 22,059
Source: Company Financials, AHL Research
Exhibit: Quarterly NPL trend
Source: Company Financials, AHL Research
45
6.5%
7.0%
7.5%
8.0%
8.5%
9.0%
9.5%
-
10.0
20.0
30.0
40.0
50.0
60.0
70.0
80.0
1Q
CY
17
2Q
CY
17
3Q
CY
17
4Q
CY
17
1Q
CY
18
2Q
CY
18
3Q
CY
18
Domestic NPLs Overseas NPLs Infection (RHS)
(PKR bn)
Ratio Analysis Unit 2017A 2018E 2019F
Earnings PKR/Share 5.3 9.5 16.5
Dividend PKR/Share 7.0 4.0 8.0
Price to Earning x 31.3 13.9 8.0
Price to Book x 1.3 1.0 0.9
NIMs % 3.7 3.5 4.4
ROE % 4.1 7.2 11.9
ROA % 0.3 0.5 0.8
Source: Company Financials, AHL Research
Page 46
46
Key Investment Theme:
Bears in the Int’l oil market: The prices of Brent and WTI plunged by 35.3% and 30.7% to USD
71.43/bbl and USD 65.07/bbl during CY18TD as global oil supply surged due to top-three producers
including US, Russia and Saudi Arabia. Furthermore, after its annual meeting in Austria, the OPEC
announced oil production cut of 1.2mn bopd. In this regard, OPEC members ex-Iran (as Iran has
been exempted from production cut amid US sanctions) will cut oil production by 0.8mn barrels from
production level of 39.75mn bopd while non-OPEC members will reduce production by 0.4mn bopd.
Resultantly, prices of Brent and WTI recovered by 2.2% and 1.8%, respectively post conclusion of the
meeting.
What can drive oil price? We believe that int’l oil prices are dependent on many factors. However,
there are four major elements which will influence oil prices significantly going forward: 1) Saudia
Arab’s production strategy coupled with Iran and Russia oil production, 2) Trade war between China
and US which may lead towards economic imbalances in both countries, 3) US oil production which
surged at a 5-Yr CAGR of 6% to 10.9mn bopd in 2018 as compared to 8.76mn bopd in 2014, and 4)
Further interest rate hike in US which may be needed to curb the demand.
Demand Outlook: In 2019, world oil demand growth is forecasted to grow by 1.29mn bopd YoY to
reach 100.08mn bopd. The demand is expected to be lower as compared to initial estimates amid
economic adjustments in the non-OECD region and uncertainties regarding the overall global
economic development. Overall, the OECD demand is expected to rise by 0.2mn bopd, with OECD
Americas expanding solidly, OECD Europe remaining in the positive and OECD Asia Pacific
declining. In the non-OECD region, oil demand growth is expected to be around 1.04mn bopd, with
improvements in Latin America and the Middle East from 2018 levels.
Oil Assumption for AHL E&P Universe: In the wake of stability in oil prices, our oil price assumption
is set at USD 58/bbl in reminder of FY19, and average USD 65/bbl in FY20 onwards.
Key Risks: The production cut by OPEC can quickly be neutralized by an increase in production by US shale oil.
A slowdown in oil demand from major oil consuming economies.
Exploration & ProductionOil Price Fallout
Exhibit: World Oil Balance & Arab Light Price
Source: EIA, AHL Research
-4.0
-3.0
-2.0
-1.0
0.0
1.0
2.0
3.0
4.0
5.0
0
20
40
60
80
100
120
Jan-1
2
Jun-1
2
No
v-1
2
Apr-
13
Sep-1
3
Feb
-14
Jul-1
4
De
c-1
4
Ma
y-1
5
Oct-
15
Ma
r-1
6
Aug-1
6
Jan-1
7
Jun-1
7
No
v-1
7
Apr-
18
Sep-1
8
Feb
-19
Jul-1
9
De
c-1
9
Surplus/ (Deficit) - RHS Arab Light
(mn bpd)(USD/bbl)
Page 47
47
Key Investment Theme:
Trading at cheap valuations: The AHL E&P sector is currently trading at PER of 6.8x based on
FY19E earnings expectations compared with a PER of 7.6x of the KSE-100 Index and a five year
historical PER of 9.5x of the sector. The profitability of our E&P universe is expected to surge by 32%
YoY in FY19 amid higher average oil prices along with PKR depreciation.
Production and summary: Oil production during FY18 witnessed an increase of 1% YoY to 32.6mn
bbl from 32.3mn bbl in FY17. However, gas production depicted a drop of 1% YoY, settling at 3,997
mmcfd from 4,031 mmcfd in FY17. During FY19, we expect higher production from KPD, Tando
AllahYar, Jhandial, Makori Deep, Mari and Kandhkot.
Exploration Momentum to continue: During FY18, the domestic E&P companies spud a total of 81
wells out of a target of 100 wells, which includes 45 exploratory and 36 appraisal/exploratory.
Moreover, 14 oil and gas discoveries were made by the E&P companies.
PKR depreciation and Oil Prices: The E&P Universe companies are dependent on Arab Light price.
Pertinently, a USD 5/bbl rise in oil price will have an impact of 5% and 7% on AHL E&P Universe’s
profitability for FY19 and FY20, respectively. Furthermore, for every 5% PKR depreciation, positive
impact on bottom-line will be 2% in FY19.
Key Risks: Risk of inability to find commercial quantities of hydrocarbon.
Consistent drop in oil prices and appreciation of Pak Rupee against greenback.
Delay in production from new discoveries.
Adverse outcome of the windfall levy case in the court of law.
Exhibit: Planned & Spudded Wells and Discoveries
Source: Company Financials, AHL Research
0
5
10
15
20
25
30
35
0
20
40
60
80
100
120
FY
09
FY
10
FY
11
FY
12
FY
13
FY
14
FY
15
FY
16
FY
17
FY
18
Planned Spudded Discoveries
Exploration & ProductionOil Price Fallout
Page 48
48
Case-1: Oil Prices Assumption (USD/bbl) and Fair Values
CodeCurrent
Price
TPUpside (%) Stance
EPS (PKR) DPS (PKR) P/E (x) DY (%)
Dec-19 2019 2020 2019 2020 2019 2020 2019 2020
PPL 162.5 167.0 2.8 Hold 20.8 17.9 10.00 9.00 7.8 9.1 6% 6%
OGDC 140.3 169.5 20.8 Buy 20.3 20.2 10.00 10.00 6.9 7.0 7% 7%
POL 463.1 461.3 (0.4) Hold 43.7 43.9 42.00 42.00 10.6 10.5 9% 9%
With USD 45/bbl in FY19 and going forward
Case-2: Oil Prices Assumption (USD/bbl) and Fair Values
CodeCurrent
Price
TPUpside (%) Stance
EPS (PKR) DPS (PKR) P/E (x) DY (%)
Dec-19 2019 2020 2019 2020 2019 2020 2019 2020
PPL 162.5 191.7 18.0 Buy 22.9 23.4 11.00 11.00 7.1 6.9 7% 7%
OGDC 140.3 182.9 30.4 Buy 22.8 23.8 11.00 11.75 6.2 5.9 8% 8%
POL 463.1 528.2 14.1 Buy 51.1 54.7 50.00 52.00 9.1 8.5 11% 11%
With USD 55/bbl in FY19 and going forward
Base Case: Oil Prices Assumption (USD/bbl) and Fair Values
CodeCurrent
Price
TPUpside (%) Stance
EPS (PKR) DPS (PKR) P/E (x) DY (%)
Dec-19 2019 2020 2019 2020 2019 2020 2019 2020
PPL 162.5 213.6 31.5 Buy 25.0 27.9 12.00 14.00 6.5 5.8 7% 9%
OGDC 140.3 196.8 40.3 Buy 25.5 27.5 13.00 13.75 5.5 5.1 9% 10%
POL 463.1 593.0 28.1 Buy 58.5 65.4 56.00 64.00 7.9 7.1 12% 14%
With USD 65/bbl in FY19 and going forward
Case-4: Oil Prices Assumption (USD/bbl) and Fair Values
CodeCurrent
Price
TPUpside (%) Stance
EPS (PKR) DPS (PKR) P/E (x) DY (%)
Dec-19 2019 2020 2019 2020 2019 2020 2019 2020
PPL 162.5 233.8 43.9 Buy 26.9 31.7 13.00 16.00 6.0 5.1 8% 10%
OGDC 140.3 209.9 49.6 Buy 27.8 30.9 14.00 15.25 5.0 4.5 10% 11%
POL 463.1 653.9 41.2 Buy 64.6 75.5 62.00 72.00 7.2 6.1 13% 16%
With USD 75/bbl in FY19 and going forward
Source: Company Financials, AHL Research
73 89 90
106
150 147
192
136
93
118
151
-
20.00
40.00
60.00
80.00
100.00
120.00
-
50
100
150
200
250
FY
08
FY
09
FY
10
FY
11
FY
12
FY
13
FY
14
FY
15
FY
16
FY
17
FY
18
Sector Profit Arab Light Prices(USD/bbl)(PKR bn)
Exploration & ProductionOil Price Sensitivity
Exhibit: Movement of Sector Profitability with Oil Prices
Page 49
49
Source: Bloomberg, AHL Research
55.00
60.00
65.00
70.00
75.00
80.00
85.00
90.00
Jan
-18
Fe
b-1
8
Ma
r-1
8
Ap
r-18
Ma
y-1
8
Jun
-18
Jul-
18
Au
g-1
8
Se
p-1
8
Oct-
18
Nov-1
8
Dec-1
8
(USD/bbl)
Protests in
Venezuela and
calls for early
elections
Turkey starts
a military
offensive
against
Kurdish forces
US, UK
and France order
the bombing of
Syrian military
bases
US hit by
Hurricane
Florence
Saudi Arabia
under
pressure amid
Jamal
Khashoggi's
murder
Trump accepts
an invitation
from Kim Jong-
un for a meeting
US president’s
decision
to unilaterally exit
the nuclear
deal with Iran
First summit held
between a US
President and a
North Korean
Leader
Trump threatens
tariffs on another
$200 bln of Chinese
goods
US re-imposes
sanctions on
Iran
US allows
eight
importers to
keep buying
Iran oil
OPEC to cut
oil
production
by 1.2mn
BOPD
US announces it
will withdraw
from UN Human
rights Council
Exploration & ProductionArab Light Price Movement Timeline
Exhibit: Major Events dictating Arab Light
Source: Bloomberg, AHL Research
Page 50
50
Key Investment Theme:
Production and new developmental projects: The company’s historic 5-Yr oil production shows a
CAGR of 0.2%, contributed by Nashpa, Adhi, Makori East and Rajian. Whereas, 5-Yr Gas production
CAGR portrays a fall of 2.2%, owing to natural decline at Qadirpur, KPD, Miano, Dakhni and
Manzalai. Meanwhile, the work on Nashpa Project during FY18 has been completed and taken into
production, which will add 19,200bopd and 82 mmcfd into production. Currently compression and up
gradation projects are going on in Nashpa and Mela to counter depletion of gas reserves.
Encashment of PIBs: PIBs worth PKR 53bn were en-cashed in FY18. Moreover, term deposits
worth PKR 9.5bn also were converted into long term investments as the company intends to reinvest
the money. At present, OGDC is contemplating ways to utilize its funds which includes 1) acquiring
businesses outside the country, particularly in the Middle East, Africa and Indonesia, and 2)
diversification of funds in other sectors such as downstream oil and gas. Whereas, higher payout
ratio going forward is also a possibility.
Operating activities: The company is planning to spud 21 wells in FY19 out of which 15 will be
exploratory wells while 6 will be development wells. Additionally, drilling for Kekra-1, non-operated
offshore Indus Block G in partnership with ExxonMobil, is expected to commence in 3QFY19.
Moreover, for the purpose of exploration of new oil and gas reserves, higher productivity, efficiency
and sharing of latest equipment, the company has signed an agreement of strategic partnership with
MOL, KUFPEC and Gazprom.
Trading at the lowest PER: The stock is currently trading at an implied oil price of USD 25.39/bbl as
compared to Arab Light Price of USD 60.21/bbl with FY19 PER of 5.5x and PB of 1.0x along with a
dividend yield of 9%. We expect the company to post of earnings of PKR 25.49/share and PKR
27.47/share in FY19 and FY20, respectively.
Key Risks: Increase in exposure to circular debt (PKR 121bn as of FY18).
Consistent fall in oil prices and appreciation of Pak Rupee against greenback.
Postponement in production and one-off expenses such as impairment and dry wells.
Production cut from blocks such as Nashpa and TAL.
Target Price PKR 196.8
Market Price PKR 140.3
Upside % 40.3
PSX Code OGDC
Oil & Gas Development CompanyThe Bigger the Better
Exhibit: OGDC BoE sold and EPS
Source: Company Financials, AHL Research
10
15
20
25
30
70
75
80
85
90
FY13 FY14 FY15 FY16 FY17 FY18
BoE Sold EPS(Mn BoE) (PKR)
Page 51
51
PKR mn 2018A 2019E 2020F
Income Statement
Net Sales 205,335 269,054 292,627
Gross Profit 121,480 170,977 187,650
Operating Profit 101,201 147,176 158,536
Finance Cost 1,730 2,355 2,524
Post Tax Profit 78,736 109,610 118,157
Balance Sheet
Shareholder's Equity 550,556 611,781 679,567
Trade and Other Payables 55,195 80,395 93,291
Total Liabilities 115,921 143,907 159,736
Current Assets 405,858 475,758 538,417
Non-Current Assets 224,993 244,303 265,259
Total Assets 666,477 755,687 839,303
Source: Company Financials, AHL Research
Ratio Analysis Unit 2018A 2019E 2020FEarnings per share PKR/Share 18.3 25.5 27.5
Dividend per share PKR/Share 10.0 13.0 13.8
Book Value per share PKR/Share 128.0 142.2 158.0
Price to Earning x 8.5 5.5 5.1
Price to Book x 1.2 1.0 0.9
Net Margins % 59.2 63.5 64.1
Dividend Yield % 6.4 9.2 9.8
Source: Company Financials, AHL Research
Exhibit: OGDC Circular Debt Position
Source: Company Financials, AHL Research
-80%
-60%
-40%
-20%
0%
20%
40%
60%
80%
100%
120%
20
40
60
80
100
120
140
Jun'1
2
Jun'1
3
Jun'1
4
Jun'1
5
Jun'1
6
Jun'1
7
Jun'1
8
Circular Debt Position % ChangePKR bn
Oil & Gas Development CompanyThe Bigger the Better
Page 52
52
Key Investment Theme:
Earnings to jump up by 24% YoY in FY19: Pakistan Petroleum Limited is expected to depict a 5-Yr
earnings CAGR of 10%. Company’s bottom-line is expected to settle at PKR 25.04/share in FY19
based on i) Pak Rupee devaluation against USD, ii) higher average oil prices, and iii) 4% YoY higher
oil and gas production flows. The stock is trading at a FY19 PE of 6.5x and PB of 1.3x tagged with a
dividend yield of 7%.
Production matrix: PPL displayed a historic 5-Yr oil production CAGR of 4%, contributed by
Nashpa, Adhi, Makori East and Maramzai. Similarly, 5-Yr gas production CAGR showed
improvement of 1%, amid increase production from Kandhkot, Maramzai, Adhi and Nashpa. We
expect FY19 oil production to increase by 7% YoY, amid addition of Adhi South X-1, Dhok Sultan,
Badeel X-1, Talagang X-1, Yasar X-1, Bolan East X-1 and Gulsher 1 to the production system tagged
with increase in production from regular fields like Gambat South, TAL and Adhi Block. Moreover, we
expect gas production to increase by 4% YoY, owing to expected incremental production from Adhi,
Sawan and Qadirpur.
Future operating activities: Pertinently, Adhi gas compression project is under installation phase
and is expected to come online in Jan’19. Moreover, construction work in Wafiq well in Gambat
South is expected to be completed in Dec’18. Whereas, gas reserves of SUL west dome in Kandkhot
field have increased by 109% YoY to 211 bcf in Jun’18 from 101 bcf in Jun’17 and following that, the
well has been included in gas production. Apart from this, the company is planning to drill its maiden
well in Block-8 in Iraq during FY19. Lastly, PPL, along with OGDC and Exxon, plans to engage in
drilling offshore Indus G Block in 3QFY19.
Key Risks: Rising circular debt is a mammoth challenge, which has increased by 44% YoY to PKR 143bn as of
Jun’18 as compared to PKR 99bn in Jun’17.
With aggressive efforts to increase hydrocarbon production, the company can write off significant
amounts as dry wells costs (4 drywells in FY18).
Unfavorable terms of mining lease, especially in Sui, Adhi and Kandhkot.
Exhibit: PPL Oil And Gas Production
Source: Company Financials, AHL Research
56.0
57.0
58.0
59.0
60.0
61.0
62.0
63.0
64.0
65.0
66.0
FY14 FY15 FY16 FY17 FY18
(mn BOE)
Pakistan Petroleum LimitedReliable Bet
Target Price PKR 213.6
Market Price PKR 162.5
Upside % 31.5
PSX Code PPL
Page 53
53
PKR mn 2018A 2019E 2020F
Income Statement
Sales 126,210 154,125 171,540
Gross Profit 74,215 94,572 105,412
Other Income 9,319 7,318 6,744
Finance Cost 444 850 963
Post Tax Profit 45,688 56,776 63,268
Balance Sheet
Shareholder's Equity 240,392 272,915 304,439
Total Liabilities 126,929 140,616 149,155
Current Assets 174,408 206,579 229,873
Fixed Assets 155,123 169,163 185,932
Non-Current Assets 192,913 206,952 223,721
Total Assets 367,321 413,532 453,594
Source: Company Financials, AHL Research
Ratio Analysis Unit 2018A 2019E 2020FEarnings per share PKR/Share 20.1 25.0 27.9
Dividend per share PKR/Share 5.5 12.0 14.0
Book Value per share PKR/Share 106.0 120.4 134.3
Price to Earning x 9.2 6.5 5.8
Price to Book x 1.5 1.3 1.2
Net Margins % 36.2 36.8 36.9
Dividend Yield % 6.1 7.4 8.6
Source: Company Financials, AHL Research
Exhibit: Arab Light Prices vs. Sui Gas Price
Source: Company Financials, AHL Research
1.2
1.4
1.6
1.8
2.0
2.2
2.4
20
30
40
50
60
70
80
90
100
110
120
FY
12
FY
13
FY
14
FY
15
FY
16
FY
17
FY
18
Arab Light Price Sui Gas Price (RHS)
(USD/bbl) (USD/mmbtu)
Pakistan Petroleum LimitedReliable Bet
Page 54
54
Key Investment Theme:
Solid 46% YoY earnings growth in FY19: The growth in bottom-line is primarily owed to i) PKR
depreciation (21% in FY19TD), and ii) growth in oil and gas production by 3% each, keeping in view new
discoveries in Khaur North and Adhi South tagged with addition of new wells Jhandial, Makori East-6,
Makori Deep, Tolanj X-1 and Tolanj West to the production system. Moreover, we expect the company
to post a 5-Yr earnings CAGR (FY18-FY22) of 15%. With that said our FY19 and FY20 earnings
estimate arrive at PKR 58.5/share and PKR 65.4/share, respectively.
Escalation in Oil & Gas Reserves: Company’s oil and gas reserves, according to the updated reserves
data, depicts a massive growth of 134% and 80%, respectively as at Jun’18. This surge is owed to
addition of Jhandial X-1’s oil and gas reserves of 13.30mn bbls and 290 bcf, respectively, followed by
Joyamair oil reserves swelling up to 24mn bbls from 0.06 bbls in Jun’17.
Production Growth: The company spud three exploratory wells (Khaur North,Joyamair Deep and
Mamikhel Deep-1) and two developmental wells (Adhi-31 and Adhi-32) during FY18. That said, the
company’s oil production witnessed a jump of 7.6% YoY amid higher production from Adhi, Mamikhel,
Maramzai and Mardankhel during FY18. Similarly, gas production surged by 12.3% YoY, which was led
by Maramzai, Adhi and Mardankhel. Going forward, POL is planning to undertake drilling of 8 news
wells in FY19.
Highest Dividend Yield: In FY19, the company is expected to have a dividend payout and
dividend yield of 109% and 13% YoY, respectively (highest amongst E&P Universe).
Key Risks: More sensitive to oil prices; for every USD 5/bbl change in oil price, FY19 bottom-line changes by PKR
3.48/share or 6.7%.
Production cut from TAL Block and Nashpa amid low up-liftment by refineries due to shortage of storage
capacity for furnace oil.
Risk of not being able to find new oil and gas reserves.
Target Price PKR 593.0
Market Price PKR 463.1
Upside % 28.1
PSX Code POL
Pakistan Oilfields LimitedBlend of Price and Yield
Exhibit: POL Adjusted EPS and Payout Ratio
50%
60%
70%
80%
90%
100%
110%
120%
20
30
40
50
60
FY
11
FY
12
FY
13
FY
14
FY
15
FY
16
FY
17
FY
18
FY
19E
EPS Payout (RHS)(PKR)
Source: Company Financials, AHL Research
Page 55
55
PKR mn 2018A 2019E 2020F
Income Statement
Sales 32,665 47,620 51,377
Gross Profit 17,136 27,888 30,782
Other Income 3,262 2,604 2,967
Finance Cost 1,919 2,418 2,529
Post Tax Profit 11,384 16,597 18,562
Balance Sheet
Shareholder's Equity 32,769 35,440 37,001
Total Liabilities 37,398 45,569 48,246
Current Assets 35,937 48,023 53,447
Fixed Assets 8,755 8,467 8,079
Non-Current Assets 34,230 32,986 31,800
Total Assets 70,167 81,009 85,247
Source: Company Financials, AHL Research
Ratio Analysis Unit 2018A 2019E 2020FEarnings per share PKR/Share 40.1 58.5 65.4
Dividend per share PKR/Share 42.5 56.0 64.0
Book Value per share PKR/Share 115.4 124.8 130.3
Price to Earning x 14.0 7.9 7.1
Price to Book x 4.8 3.7 3.6
Net Margins % 34.9 34.9 36.1
Dividend Yield % 7.6 12.1 13.8
Source: Company Financials, AHL Research
Exhibit: POL Oil and Gas Production
Source: Company Financials, AHL Research
6.0
6.5
7.0
7.5
8.0
8.5
9.0
FY14 FY15 FY16 FY17 FY18
(mn BOE)
Pakistan Oilfields LimitedBlend of Price and Yield
Page 56
Key Investment Theme:
Pricing power: Low inventory levels coupled with higher int’l urea prices maximized the pricing power
of local manufacturers, leading towards higher margins. To recall, urea prices jumped up by 23%
during CY18TD to PKR 1,730/bag.
Gas tariff hike: The gov’t increased gas tariff for fertilizer feed and fuel stock by 50% and 25% in
Sep’18. Thereafter, local manufacturers increased urea prices by PKR 130/bag. We view that any
upcoming gas tariff increase (Jan’19) will also be passed on to the end consumers by manufacturers.
Agriculture sector: The sector contributed ~21% to the GDP during FY18, simultaneously ensured
food security and provided employment to 45% of the population. Being backbone of the economy,
we expect the incumbent government to prioritize performance of the sector which should aid fertilizer
sale.
Offtake: Over the past 10 years, fertilizer sector offtake has grown at an average rate of 2%. We
expect urea offtake to clock-in at 5.8mn tons and 6.0mn tons during CY18 and CY19, respectively.
International prices on the rise: International urea prices have recovered sharply to USD 320/ton,
increasing by 11% in CY18TD. Major uptick in urea prices is owed to higher coal prices amid supply
cuts from China. This provides a safe cushion to local prices.
Inventory levels to remain subdued: We view that post seasonality in Dec’18, urea inventory levels
would be minimum with local manufacturers. We estimate 4QCY18 urea offtake at 1.7mn taking
CY18E offtake to 5.85mn tons and closing inventory at 0.182mn tons mainly with National Fertilizer
Marketing Limited (NFML).
Key Risks: Gas tariff / GIDC increase and failure to pass on the same to end consumer.
Volatility in international prices.
Natural disasters such as floods and earthquake.
FertilizersOrganic Fuel for the Economy
Exhibit: Urea, DAP Offtake and Average Prices
Source: Company Financials, AHL Research
56
1,000
1,500
2,000
2,500
3,000
3,500
4,000
4,500
-
1,000
2,000
3,000
4,000
5,000
6,000
7,000
CY12 CY13 CY14 CY15 CY16 CY17 CY18
Urea Offtake DAP Offtake
Urea Price DAP Price(000
Tons) (PKR/bag)
Being a group company, we don’t cover Fatima Fertilizer Company Ltd. (FATIMA).
Page 57
Key Investment Theme:
Strong profitability; 5-yr CAGR of 14%: ENGRO is expected to post a 5-year profitability CAGR of
14%. The massive growth in earnings is primarily driven by 1) CoD of Engro Powergen Thar Power
Limited (EPTPL) along with Sindh Engro Coal Mining Company (SECMC), 2) EFERT, where we
expect windfall gains on urea price hike amid provision of concessionary gas, 3) Volumetric growth
amid expansion in polymer business including PVC, VCM and hydrogen peroxide leading towards
higher profitability, and 4) Steady business operations from Elengy terminal based on fixed RoE and
Engro powergen Qadirpur, which is likely to remain stable amid secure gas supply.
Black gold: Power projects worth ~USD 2bn include SECMC mining project amounting to USD
800mn and EPTPL mine-mouth 2x330MW coal power plant, with a ticket size of USD 1,200mn.
SECMC mine and a 330MW power plant is expected to become operational by Mar’19 while the
second 330MW plant would come online in Jun’19. We estimate EPTPL to contribute PKR 9.59/share
to ENGRO’s profitability in CY20 and PKR 60.7/share to our SoTP-based target price. Likewise,
SECMC mining project is expected to add PKR 1.42/share into our bottom-line and PKR 9.1/share to
our target price.
Polymer expansion: Engro Polymer is enhancing its PVC production capacity from 195K
tons/annum to 295K tons/annum and similarly, increasing its capacity for VCM from 204K tons/annum
to 274K tons/annum by 3Q 2020.
Cash position: The company sits on a massive cash pile at present, amounting to PKR 62.7bn as at
Sep’18, which could be utilized for future growth projects including RLNG terminal, Naptha cracking
facility and further investment in Phase 3 and 4 power plants, to name a few.
Key Risks: Gas price hike for fertilizer sector.
Volumetric and margin decline in dairy segment.
Delay in Thar coal power plant.
Inability to reinvest cash proceeds.
Target Price PKR 359.6
Market Price PKR 299.5
Upside % 20.1
PSX Code ENGRO
Exhibit: Sum of the Parts Valuation (SOTP)
Source: Company Financials, AHL Research,
*Target prices on ENGRO's paid up capital,
57
Engro Corporation Ltd. Sitting on a Crock of Gold
Company Stake TP*
Engro Fertilizer 57% 132.2
Engro Foods 40% 57.6
Engro Polymer 56% 52.7
Engro Eximp Agri porducts 100% 0.1
Engro Powergen 69% 12.9
Engro Vopak 50% 3.7
Engro Elengy Terminal 80% 16.3
Engro Powergen Thar Ltd 50% 60.7
SECMC 12% 9.1
After portfolio Discount 30% 241.6
Cash 118.1
Total 359.7
Page 58
Exhibit: Historical & Expected Payout
Source: Company Financials, AHL Research
58
Engro Corporation Ltd. Sitting on a Crock of Gold
PKR mn 2017A 2018E 2019F
Income Statement
Net Sales 118,982 133,847 143,063
Gross Profit 29,279 35,653 38,838
Other Income 6,586 7,756 5,880
Finance Cost 3,902 4,102 4,529
Post Tax Profit 10,440 13,261 19,654
Balance Sheet
Shareholder's Equity 171,074 175,217 189,330
Interest Bearing Liabilities 100,829 139,310 130,390
Total Liabilities 152,879 193,608 184,358
Current Assets 127,316 110,984 115,284
Non-Current Assets 196,637 257,842 258,404
Total Assets 323,953 368,825 373,688
Source: Company Financials, AHL Research
Ratio Analysis Unit 2017A 2018E 2019FEarnings PKR/Share 19.9 25.3 37.5
Dividend PKR/Share 24.0 16.0 24.0
Book Value PKR/Share 326.6 334.5 361.5
Price to Earning x 13.8 11.8 8.0
Price to Book x 0.8 0.9 0.8
Net Margins % 24.6 26.6 27.1
Dividend Yield % 8.7 5.3 8.0
Source: Company Financials, AHL Research
14.9
26.3
131.9
19.925.3
37.5
6.0
18.024.0 24.0
16.0
24.0
0%
20%
40%
60%
80%
100%
120%
140%
-
20.00
40.00
60.00
80.00
100.00
120.00
140.00
2014 2015 2016 2017 2018E 2019F
EPS DPS Payout(PKR)
Page 59
Key Investment Theme:
Immune to gas tariff hike: The company remains immune to gas tariff hikes given availability of
concessionary gas at USD 70/mmbtu for 5 years (till 2023) for its EnVen plant. To recall, gov’t
increased feed stock price by PKR 62/mmbtu in Sep’18 and local manufacturers passed it on to end
consumers, which resulted in higher margins for plants with concessionary gas price. With another
gas tariff hike on the cards, EFERT is poised to generate incremental margins in 2019 as well.
Trading business: The company is expected to import 450k tons of DAP in CY19, leading towards
earnings contribution of PKR 2,036mn (EPS: PKR 1.53). Moreover, current annual demand for DAP in
Pakistan is around 2.0mn tons out of which FFBL is expected to cater to 0.75mn tons, while the rest
will be shared between EFERT and other private importers.
Lowest multiple in fertilizer sector: The stock is currently trading at CY19F PE of 6.3x compared
with industry PER of 7.3x along with highest dividend yield of 11.5%.
Key Risks: For every PKR 50/bag reduction in urea prices, bottom-line is eroded by PKR 0.97/share.
Gas tariff hike in feed stock / fuel stock.
Target Price PKR 91.0
Market Price PKR 74.2
Upside % 22.6
PSX Code EFERT
Exhibit: PAT & Gross Margins
Source: Company Financials, AHL Research
59
Engro Fertilizer Ltd. Top-up Your Roots for Maximum Yield
20.0
22.0
24.0
26.0
28.0
30.0
32.0
34.0
36.0
38.0
-
2.0
4.0
6.0
8.0
10.0
12.0
14.0
16.0
18.0
CY14 CY15 CY16 CY17 CY18E CY19F
PAT Gross Margins (RHS)(%)(PKR bn)
Page 60
PKR mn 2017A 2018E 2019F
Income Statement
Net Sales 77,129 102,721 109,145
EBITDA 21,066 29,423 31,865
Other Income 5,866 2,403 1,891
Finance Cost 2,648 2,007 2,300
Post Tax Profit 11,156 15,811 16,180
Balance Sheet
Shareholder's Equity 42,470 43,593 44,417
Interest Bearing Liabilities 36,168 29,543 22,888
Total Liabilities 69,347 52,222 45,386
Current Assets 38,283 24,854 20,180
Non-Current Assets 73,533 70,961 69,623
Total Assets 111,816 95,815 89,803
Source: Company Financials, AHL Research
Ratio Analysis Unit 2017A 2018E 2019FEarnings PKR/Share 8.4 11.8 12.1
Dividend PKR/Share 11.0 11.5 11.5
Book Value PKR/Share 31.9 32.8 33.4
Price to Earning x 8.1 6.3 6.1
Price to Book x 2.1 2.3 2.2
Net Margins % 27.3 28.6 29.2
Dividend Yield % 16.2 15.5 15.5
Source: Company Financials, AHL Research
60
Exhibit: Margins
Source: Company Financials, AHL Research
Engro Fertilizer Ltd. Top-up Your Roots for Maximum Yield
5.0
10.0
15.0
20.0
25.0
30.0
35.0
40.0
CY14 CY15 CY16 CY17 CY18E CY19F
Gross Margins EBITDA Margins Net Margins
(%)
Page 61
Key Investment Theme:
Safest player: FFC remains the 2nd largest urea manufacturer in the country with highest market
share,. It also stands as the most secure investment in the sector in terms of lower gas curtailment,
premium branding, high payout ratio and diversified investment base.
Diversification: The company has a diversified portfolio including investment in Askari Bank Limited
(AKBL), FFC Energy Limited and Fauji Fresh n Freeze. We expected dividend income of PKR
1.00/share from AKBL and PKR 600mn from FFC Energy Limited in CY19.
Operational excellency: Stable urea offtake (average of 2.4mn tons during the last 5 years) with the
ability to operate at maximum capacity utilization level of 126% last year (average of 123% during
CY17) amid secure gas supply from the Mari field. Going forward, we anticipate offtake to remain
steady at 2.4mn tons for urea and 0.5mn tons for DAP during CY19.
Removal of GIDC: The removal of GIDC is expected to be a big trigger for companies including FFC
and FFBL. Gov’t may reduce/remove GIDC to bring down urea prices in the local market. Any
savings from that would result in windfall gains for FFC and FFBL.
Lucrative yields: High dividend payout ratio (3-year average of 85%) translates into a dividend yield
of 11% for CY19.
Key Risks: Gas tariff hike / inability to pass on the same. For every PKR 10/mmbtu increase in feed and fuel
stock prices, earnings will erode by PKR 0.38/share (PKR 14.5/bag increase in urea price to
neutralize the impact).
Reduction in price of urea by PKR 50/bag will hurt FFC’s EPS by PKR 1.32.
Target Price PKR 113.8
Market Price PKR 94.3
Upside % 20.7
PSX Code FFC
Fauji Fertilizer Company Ltd. Winning the Game of Numbers
Exhibit: Growing Payout Ratio
Source: Company Financials, AHL Research
61
11.9
7.9
7.0
9.0
11.0
80.0
82.0
84.0
86.0
88.0
90.0
92.0
5.0
6.0
7.0
8.0
9.0
10.0
11.0
12.0
13.0
CY15 CY16 CY17 CY18E CY19F
DPS Payout Ratio (RHS)(PKR)(%)
Page 62
PKR mn 2017A 2018E 2019F
Income Statement
Net Sales 90,714 100,419 122,986
EBITDA 20,394 24,035 27,718
Other Income 10,324 6,926 2,742
Finance Cost 849 1,475 2,406
Post Tax Profit 10,712 13,055 15,619
Balance Sheet
Shareholder's Equity 29,352 30,959 32,586
Interest Bearing Liabilities 33,942 45,742 40,860
Total Liabilities 79,278 100,992 107,527
Current Assets 55,885 77,460 85,807
Non-Current Assets 52,746 54,491 54,306
Total Assets 108,631 131,951 140,113
Source: Company Financials, AHL Research
Ratio Analysis Unit 2017A 2018E 2019FEarnings PKR/Share 8.4 10.3 12.3
Dividend PKR/Share 7.0 9.0 11.0
Book Value PKR/Share 23.1 24.3 25.6
Price to Earning x 9.5 9.2 7.7
Price to Book x 3.5 3.9 3.7
Net Margins % 11.8 13.0 12.7
Dividend Yield % 8.7 9.5 11.7
Source: Company Financials, AHL Research
62
Exhibit: Margins
Source: Company Financials, AHL Research
Fauji Fertilizer Company Ltd. Winning the Game of Numbers
8.0
13.0
18.0
23.0
28.0
33.0
38.0
CY15 CY16 CY17 CY18E CY19F
Gross Margins EBITDA Margins Net Margins(%)
Page 63
CementsGrowth That Ruffles The Order
Exhibit: Cement Sector Gross Margins Vs Coal Prices
Source: Company Financials, Bloomberg, AHL Research
63
Key Investment Theme:
Exports to deliver whilst local dispatches feel the tremors: As the Pak economy wads under
economic instability and the government adopts a contractionary monetary and fiscal policy to control
inflation and twin deficits, cement demand in the domestic space is set to feel a squeeze (3-yr forward
CAGR of 2% by FY21). In comparison, we expect exports to provide a breathing space as over
capacity in the sector together with dollar appreciation against the Pak Rupee and renewed US
sanctions on Iran have once again brought global markets under the radar; we project demand from
exports to grow at a 3-yr forward CAGR of 15% led primarily by clinker dispatches.
Marginally weaker: Not only was pricing under pressure all through a major part of FY18, coal prices
were unforgiving (touching a high of USD 106.15/ton in Jun’18) tagged with the Pak Rupee rolling
down to average at USD 110.13 against the greenback. Moreover, recent gas price hike and the
higher excise duty under the FY19 Budget by PKR 12.50/bag, have added to the industry's woes and
are expected to keep margins muted. Although coal appears bearish at the moment (USD 94.75/ton),
we believe the PKR-USD parity would stage an unfavorable prognosis in FY19 (already at
138.89/USD), while major upside in pricing appears unlikely in the backdrop of supply side pressures.
In addition, the upswing in interest rates against a climate of rising leverage positions to sponsor
capacity additions, also poses a risk to the sector profitability.
Pricing whereabouts: As margins came drastically below glory year levels in FY18 (29.4% vs. 36.4%
in FY17) and reemergence of exports relieved some pressure off local players of over capacity / under
utilization, optimism was witnessed in cement pricing in the last two quarters in order to recover some
profitability. Taking cue, we believe South appears to be a safer bet as most expansions have come
online (barring one, see slide 65) and exports from the region are expected to be robust in FY19 given
closeness to the port. In comparison, North accommodates several more players and many planned
brownfield projects over the course of the next 3 years will continue to suppress pricing power.
35%
36%
42%
38%
29%
40
50
60
70
80
90
100
25%
28%
30%
33%
35%
38%
40%
43%
45%
FY14 FY15 FY16 FY17 FY18
Cement Sector Gross Margins Avg. Coal Price (RHS)
(USD/ton)
Page 64
CementsGrowth That Ruffles The Order
Exhibit: Capacity utilisation in South appears rosier vs. North
Source: Company Financials, AHL Research
64
Key Investment Theme:
Naya Pakistan Housing Scheme could spark demand: While investment in sectors of housing,
energy and infrastructure has historically led cement demand in the country, a slowdown in the
economy may temporarily inhibit growth. Albeit, PM’s housing scheme (whereby the incumbent
government has drawn a 5 year plan to build 5mn new units), remains a key catalyst for the sector.
Pertinently, we have forecast potential demand stemming from construction of 250k houses per
annum at 8.75mn tons., assuming consumption of 35 tons of cement for a single story 100sq yards
house.
Key Risks: PKR depreciation against USD.
Ascent in coal prices.
Further loss of pricing power owing to new capacities.
Electricity tariff hike.
50%
55%
60%
65%
70%
75%
80%
85%
90%
95%
100%
FY17A FY18A FY19E FY20F FY21F FY22F
Utilization (Rated Capacity) Total
Utilization (Rated Capacity) North
Utilization (Rated Capacity) South
Page 65
CementsGrowth That Ruffles The Order
Exhibit: Announced Capacities
Source: Company Financials,, AHL Research
65
We have attached below a snapshot of the cement industry. With current capacity hovering at around
54.23mn tons (13.99mn tons in South and 40.24mn tons in North), announced expansions are set to
take installed capacity of the sector up by ~31% to 71.15mn tons (16.49mn tons in South and
54.66mn tons in North) by FY21. Pertinently, only one pertains to South while 8 out of the 9 remaining
Brownfield projects target the North market. We also highlight that MLCF, CHCC and POWER are
scheduled to undergo capacity growth before the close of FY19.
Company Type of
expansion Capacity (mn/ton) Timeline Comments
South North
POWER Brownfield 2.5 2HFY19 Civil works near completion stage
CHCC Brownfield 2.1 2HFY19 On-track
MLCF Brownfield 2.2 2HFY19 On-track
LUCK Brownfield 2.6 4QCY19 Civil works underway
KOHC Brownfield 2.3 1HFY20 Civil works underway
PIOC Brownfield 2.4 2HFY20 On-track
FLYNG Brownfield 0.6 2HFY20 Slight delay
DGKC Brownfield 2.2 2HFY21 Delayed
Total 2.50 14.42
Current capacity 13.99 40.24
Post expansion capacity 16.49 54.66
Exhibit: Cement Sector Gross Margins Vs Cement Prices
Source: Company Financials, PBS, AHL Research
35%36%
42%
38%
29%
500
510
520
530
540
550
560
15%
20%
25%
30%
35%
40%
45%
FY14 FY15 FY16 FY17 FY18
Cement Sector Gross Margins Avg. Cement Price (RHS)
(PKR/bag)
Page 66
Key Investment Theme:
Bottom-line CAGR robust despite changing local landscape: Second largest cement player and a
prominent conglomerate, Lucky Cement Limited (LUCK) has often been touted as a trailblazer of
diversification in Pakistan. We eye a solid earnings CAGR of 12% for the company by FY23 to PKR
21,931mn (EPS: PKR 67.82), taking account of the company’s chief cement business where we view
total dispatches to over 9mn tons.
Branching out to an impressive portfolio: LUCK’s strategic divergence to various sectors has
always been its main pitch. The company operates in the local cement industry with a footprint in
North and South of Pakistan and a nameplate capacity of 9mn tons whereas expansion beyond
borders in DR Congo (1.2mn tons) and Iraq (1.7mn tons) adds to its cement dominance. Pertinently,
the company’s second leg of expansion in the local market is underway; LUCK has commenced civil
works at the site of its 2.6mn tons Brownfield project in Pezzu, KPK with commercial operations
scheduled for 4QCY19. In addition, the company is in the process of constructing a PKR 20bn
automobile plant in Pakistan alongside South Korean auto giant Kia, with expected COD in Jun’19
(2QCY19). This will be followed by a project of national importance which will also solidify LUCK’s
presence in the energy sector; apart from a 50MW wind power plant located at Jhimpir (20% equity
stake; operational since Sep’16), its 100% owned 660MW coal power plant is projected to kick-off
operations in Mar’21 (we have assumed COD in FY22). Finally, the company’s 56% share in ICI
Pakistan Limited - a listed chemical company – also augments value of the portfolio.
Sum of the parts-based TP of PKR 587: With the stock offering a noteworthy 30% upside to the
Dec’19 target price of PKR 587/share, we flag LUCK as our top pick in the cement sector. We believe
above industry average P/E multiple remains justifiable for the company given its diversified theme.
Key Risks: Cement prices tapering off; every PKR 5/bag decline will erode earnings by PKR 1.1/share (3%).
Drastic ascent in coal prices; FY19 bottom-line should retreat by PKR 1.45/share (4%) on every USD
5.00/ton uptick in average coal prices.
Postponement in materialization of key investment projects.
Lucky Cement Ltd.A Guide to Leadership
66
Target Price PKR 586.5
Market Price PKR 469.6
Upside % 24.9
PSX Code LUCK
Source: AHL Research, * 2019F
Exhibit: LUCK’s sales break up
-4.0%
-2.0%
0.0%
2.0%
4.0%
6.0%
8.0%
10.0%
-
1,000
2,000
3,000
4,000
5,000
6,000
7,000
8,000
FY17A FY18A FY19E FY20F FY21F
Local Exports % Change in total dispatches
Page 67
PKR mn 2018A 2019E 2020F
Income Statement
Sales 47,542 53,053 55,019
Gross Profit 16,952 17,414 16,802
Other Income 2,595 2,281 1,865
Other Charges 1,346 1,502 1,558
Post Tax Profit 12,197 10,596 9,950
Balance Sheet
Shareholder's Equity 86,367 92,758 99,151
Current Liabilities 15,237 16,350 16,882
Trade and other payables 13,252 14,364 14,897
Non-Current Liabilities 7,395 7,468 7,616
Current Assets 42,956 27,085 21,731
Non-Current Assets 66,043 89,492 101,918
Source: Company Financials, AHL Research
Ratio Analysis Unit 2018A 2019E 2020FEarnings PKR/Share 37.7 32.8 30.8
Dividend PKR/Share 13.0 11.0 11.0
Book value PKR/Share 267.1 286.8 306.6
Price to Earning x 13.5 14.3 15.3
Price to Book x 1.9 1.6 1.5
Gross Margins % 35.7 30.0 32.8
Dividend Yield % 2.6 2.3 2.3
Source: Company Financials, AHL Research
67
Exhibit: Target Price Methodology
Source: AHL Research, * PKR mn
Sum of the Parts Value* Per share Discount TP
Core 93,214 288 288.3
ICI 31,850 98 30% 68.9
Iraq Project 3,221 10 10.0
Congo Project 12,457 39 38.5
660 MW Coal Power Plant 45,696 141 141.3
Wind Power 2,685 8 8.3
KIA motors 10,093 31 31.2
199,217 616 586.51
Last closing 469.6
Upside 25%
Lucky Cement Ltd.A Guide to Leadership
Page 68
Power Generation & DistributionDeclining Reliance on FO-based generation
68
Key Investment Theme:
Growing power demand: During 10MCY18, power generation has increased by 9.7% YoY.
However, power generation during Oct'18 witnessed a decline of 5.9% YoY to 9,574 GWh (12,868
MW), as compared to 10,177 GWh (13,679 MW) during Oct’17. We estimate the power demand to
grow by 5% annually.
Declining share of FO-based generation: During Oct’18, major contributors towards power
generation remain Hydel, RLNG, Gas, Coal, Nuclear and FO. RLNG-based generation’s share has
witnessed a growth of 826bps to 22.9% compared to 14.7% during Oct’17. Whereas power generation
on furnace oil declined as the government relied on cheaper options like RLNG and coal to generate
power. Therefore, generation on FO dipped by 70% YoY to 754 GWh from 2,547 GWh and its share
reduced from 25% to 7.9%.
Induction of coal & RLNG power plants is materializing: As mentioned earlier, the share of coal
and RLNG has been increased to 12% and 23%, respectively. Both these sources of power
generation are relatively cheaper than FO. The current cost of coal and RLNG based production is
~PKR 6.5/KWh and ~PKR 9.9/KWh, which is significantly lower than FO’s ~PKR 15.6/KWh. As per
our calculations, the country has saved ~USD 795mn during last 12-months from this shift.
CPEC is materializing: Under CPEC, two coal based power plants (Sahiwal & Port Qasim) are
generating electricity while the third, China Power Hub Generation’s first unit (660 MW), is in testing
phase and expected to come online in Jan’19. To recall, China is investing ~USD35bn in energy
related projects under the umbrella of CPEC.
Key Risks: Lower than expected PKR depreciation.
Piling up of Circular debt.
Exhibit: USD 795mn has been saved by replacing FO generation
79
42 41
61
43 44 33
84 78
66
116 107
-
2
4
6
8
10
12
14
16
18
-
20
40
60
80
100
120
140
No
v-1
7
De
c-1
7
Jan-1
8
Feb
-18
Ma
r-1
8
Apr-
18
Ma
y-1
8
Jun-1
8
Jul-1
8
Aug-1
8
Sep-1
8
Oct-
18
Estimated Fuel Savings (LHS)
Weihted Average Cost (Coal + RLNG)
FO Based Cost
(USD mn) (PKR/KWh)
Source: NEPRA, AHL Research
Page 69
Key Investment Theme:
China Power Hub Generation Company (2x660 MW): The project achieved financial close in
Jan’18 and one unit (660 MW) is expected to come online in Jan’19 (currently in testing phase). In
addition, the company has initiated the process for increasing its shareholding to 47.5% by using the
call option. As per management, the process is expected to complete during the first quarter of 2019
subject to regulatory approvals. As per our workings, the project contributes PKR 20.6/share to our
Sum-Of-The-Parts (SOTP) valuation of the company.
Thar Energy Limited (1x330 MW): Thar Energy Limited will set up a mine mouth coal-fired plant
(330 MW) whereby HUBC is the largest shareholder in the project with a 60% shareholding, followed
by 30% of Fauji Fertilizer Company Ltd. (FFC), and the remainder (10%) is owned by China
Machinery and Engineering Corporation (CMEC). Financial closure of the project is yet to be achieved
and the project is likely to commence operations by Jun’20. The project adds PKR 5.7/share to our
SOTP valuation.
Thal Nova (1x330 MW): During Dec’18, Hub Power Holding Limited (100% owned subsidiary of
HUBC) has acquired 37% stake in ThalNova Power Thar (Pvt) Ltd. The expected cost of the project is
USD 498mn and is expected to achieve CoD by Jun’21. This is not included in our valuations.
Key Risks: Lower than expected PKR depreciation.
Piling up of Circular debt.
Delay in Coal Projects.
Hub Power Company Ltd.Entering the Era of Growth
69
Target Price PKR 115.5
Market Price PKR 90.2
Total Return % 35.8
PSX Code HUBC
Exhibit: Sum of the Parts Valuation (PKR/Share)
Source: Company Financials, AHL Research
Hub, Narowal & Laraib, 87.7
CPHGC (1,320 MW), 20.6
SECMC, 1.5
TEL (330 MW), 5.7
Page 70
PKR mn 2018A 2019E 2020F
Income Statement
Net Sales 99,999 113,627 80,159
Gross Profit 18,279 25,193 28,570
Finance Cost 4,432 6,701 6,852
Share of Profit from Associates (280) (264) 2,836
Post Tax Profit 11,665 16,147 21,835
Balance Sheet
Shareholder's Equity 39,034 51,251 67,403
Interest Bearing Liabilities 62,908 60,103 75,585
Total Liabilities 146,972 130,238 124,456
Current Assets 121,849 107,543 119,355
Non-Current Assets 64,156 73,946 72,504
Total Assets 186,006 181,489 191,859
Source: Company Financials, AHL Research
Ratio Analysis Unit 2018A 2019E 2020FEarnings PKR/Share 9.6 12.5 17.0
Dividend PKR/Share 7.4 6.0 6.8
Book Value PKR/Share 33.7 44.3 58.2
Price to Earning x 9.6 7.2 5.3
Price to Book x 2.7 2.0 1.5
Net Margins % 18.3 22.2 35.6
Dividend Yield % 8.0 6.7 7.5
Source: Company Financials, AHL Research
70
Hub Power Company Ltd.Entering the Era of Growth
Exhibit: Payout Decline amid Equity Requirements for Coal Plants
Source: Company Financials, AHL Research
68%
77%
107%
81%77%
0%
20%
40%
60%
80%
100%
120%
-
2.0
4.0
6.0
8.0
10.0
12.0
14.0
16.0
18.0
FY16A FY17A FY18A FY19E FY20F
EPS DPS Payout Ratio (RHS)(PKR)
Page 71
Key Investment Theme:
Downturn in OMC sales: During last 3 years, retail sales volume of OMCs grew at a CAGR of 16%
due to consistency in economic development, double digit growth in vehicle sales and lower prices of
petroleum products. However, this time around retail volumes have started receding due to surge in
prices of petroleum products on the back of i) PKR depreciation, ii) higher petroleum product prices in
PKR, iii) increase in dumping of High Speed Diesel (HSD) from Iran, and iv) high base affect. During
5MFY19, Mogas, HSD and FO sales have witnessed a drastic decline of 2%, 20% and 68%,
respectively. We expect industry volumes of Motor Spirit to improve by 5% YoY during FY19 whereas
High Speed Diesel and Furnace Oil volumes may fall by 5% YoY and 60% YoY, respectively.
Margin revision of regulated products: In the beginning of FY19, regulators increased margins of
MS and HSD by 3.5% and 9.5% to a uniform 2.64/liter. Increase in ex-refinery prices of MS, HSD and
FO due to surge in international oil prices have resulted in inventory gains. We expect uptick in
inflation to be beneficial for the OMCs sector as margin revision is linked with CPI.
Profitability facing stiff challenges: Currently, the dynamics of the sector have turned challenging
due to a change in sales mix of power generation (reduction in share of FO in power generation) and
improving energy situation (induction of new Coal and Gas based power plants) of the country
keeping demand for both black and white oil down. After considering the facts, we have revised down
our earnings estimates of the OMC universe by 4%.
Double-digit UFG losses stage a comeback: In the past few quarters, especially with the advent of
higher RLNG in the system, domestic gas utilities have once again been confronted with rising UFG
losses which appears negative for the bottom-line. Albeit, prior years (FY13-17) UFG revision to 7.6%
as opposed to 4.5% and materialization of RLNG III remain key triggers for SNGP and SSGC.
Key Risks (Oil Marketing): Arrival of smuggled fuel and rise in product prices may impact volumes / profitability of the sector.
Decline in international oil price may result in inventory loss.
Devaluation of PKR against USD can lead to exchange losses.
Oil and Gas Marketing CompaniesTumbling Volumes after Price Escalation & FO Demise
Exhibit: Retail Price Vs Retail Volumes
Source: Company Financials, AHL Research
71
0.9
1.0
1.1
1.2
1.3
1.4
1.5
1.6
60.00
70.00
80.00
90.00
100.00
110.00
120.00
130.00
Jan-1
8
Feb
-18
Ma
r-1
8
Apr-
18
Ma
y-1
8
Jun-1
8
Jul-1
8
Aug-1
8
Sep-1
8
Oct-
18
No
v-1
8
MoGas HSD Retail Volumes (RHS)
(mn Tons)(PKR/Liter)
Page 72
Key Investment Theme:
Low risk and high return investment case: Despite industry facing stiff challenges and volumetric
decline, APL remains shielded from current scenario given continuous expansion in storage capacity
and retail outlets resulting in growing market share. During 5MFY19, APL’s market share has
increased to 10.7% compared to 7.9% in 5MFY18 on account of 15% growth in Mogas volumes while
HSD and FO’s volumetric decline has below prevailing industry average.
Strong customer base: APL is fortunate of being a preferred fuel supplying partner for the defense
sector of Pakistan for MS, HSD, HOBC and JP-1. Alongside this, the company has fixed customers of
furnace oil (FO) like Attock Gen Limited and other industries. Rising demand from fixed customer
base together with the company exploring untapped areas (that is, expanding retail outlets), has kept
it one step ahead of its competitors. On the other hand, improving infrastructure development and
road networks will keep APL’s asphalt demand upwards given its track record of being a key supplier
for the Peshawar Karachi Motorway project.
Immune from circular debt crisis: The circular debt issue continues to haunt the sector which has
caused liquidity shortage and made it difficult for companies to expand their operations. On the
flipside, APL remains immune to the circular debt situation amid majority of the sale arising from retail
outlets.
Deregulated products and low exchange losses to support bottom-line: Despite volumetric
decline in FO sales, we expect bottom-line of the company to increase by 4% YoY amid high margin
on deregulated product (asphalt) and increase in margins of MS and HSD by 3.5% and 9.5%,
respectively. Moreover, the company purchases fuel from its related party Attock Refinery Limited,
which reduces reliance on imported fuel and keeps the company safe from major exchange losses.
Key Risks: Rise in product prices might dent volumetric growth.
Lack of storage capacity to curb volumetric growth.
A depreciation in the value of PKR against USD can lead to exchange losses.
Target Price PKR 509.1
Market Price PKR 413.3
Upside % 23.2
PSX Code APL
Attock Petroleum Ltd.Capturing Retail Fuel Market Share
Exhibit: Volumes
Source: Company Financials, AHL Research
72
-
100
200
300
400
500
600
700
800
900
1,000
FY13 FY14 FY15 FY16 FY17 FY18 FY19E
HSD FO MS
(000 Tons)
Page 73
Attock Petroleum Ltd.Capturing Retail Fuel Market Share
PKR mn 2018A 2019E 2020F
Income Statement
Net Sales 177,344 229,230 260,632
Gross Profit 9,743 10,023 11,305
Other Income 885 854 846
Finance Income 1,242 1,694 1,873
Post Tax Profit 5,656 5,857 6,217
Balance Sheet
Shareholder's Equity 18,418 20,957 23,441
Interest Bearing Liabilities - - -
Total Liabilities 27,714 35,288 39,986
Current Assets 38,149 48,290 55,471
Non-Current Assets 7,983 7,955 7,956
Total Assets 46,131 56,245 63,427
Source: Company Financials, AHL Research
Ratio Analysis Unit 2018A 2019E 2020FEarnings PKR/Share 56.8 58.8 62.5
Dividend PKR/Share 33.2 35.0 37.5
Book Value PKR/Share 185.0 210.6 235.5
Price to Earning x 8.7 7.0 6.6
Price to Book x 2.7 2.0 1.8
Net Margins % 3.2 2.6 2.4
Dividend Yield % 8.1 8.5 9.1
Source: Company Financials, AHL Research
Exhibit: Rising Market Share
Source: Company Financials, AHL Research
73
7.6%
8.2%
8.7%
9.0%
9.5%
7.0%
7.5%
8.0%
8.5%
9.0%
9.5%
10.0%
FY16 FY17 FY18 FY19E FY20F
Page 74
Key Investment Theme:
RLNG; a market with unmet demand: Pakistan’s gas potential is far from being realized. As per
latest World Bank data, only 43% of the population has access to clean fuel for cooking whereas
discovered reserves of natural gas continue to deplete. This, along with other cost and efficiency
benefits, has rendered import of RLNG a natural choice. Hence, a need for RLNG III, a PKR 175bn
pipeline stretching from Karachi to Lahore, appears real. Given the nature of SNGP’s business model
whereby earnings are determined using a ROA-based formula, potential investment in the project
offers stunning riches for the company.
Gas tariff hike to counter some cash flow issues: With gas prices unchanged for several years
until recently despite costs going up and the Pak government struggling to steer the economy in the
right direction financially, receivables of the companies from GoP made it hard to manage working
capital requirements. Hence, the recent gas tariff hike will relive SNGP as it will compress the deficit
filled in by the government to establish the revenue required under ROA-based formula.
High CAPEX for transmission to counter rising UFG losses: With the Authority (OGRA) allowing a
massive capital expenditure for transmission mains and development as per the DERR for FY19, we
believe earnings hit from double digit UFG losses may be cushioned. We do highlight that as
circumstances indicate rising levels of UFG (9MFY18 average at 10.8%), we have assumed an
average UFG of over 10% over our investment horizon (11% in FY19).
BUY recommendation at current levels: Our DCF-based TP has been revised to PKR 96/share to
take account of a higher RFR in-line with the rising interest rate scenario. As of last closing, the stock
offers an upside of 24%, we recommend BUY.
Key Risks: Postponement or annulment of the RLNG III pipeline (SNGP’s share is PKR 110bn).
Uncontrollable increase in UFG losses; every 1% increase in our UFG assumption erodes bottom-line
by PKR 1.7-2.0bn.
Massive surge in oil prices or higher than expected PKR depreciation to push up the quantum of UFG
as a result of upswing in weighted average cost of gas.
Target Price PKR 96.2
Market Price PKR 77.5
Upside % 24.1
PSX Code SNGP
Sui Northern Gas Pipelines Ltd. Ensuring the Indispensable Role of Gas Supply
Exhibit: OGRA’s Indeginous Gas Forecast
Source: OGRA, AHL Research
74
-
1,000
2,000
3,000
4,000
5,000
6,000
7,000
8,000
FY
16
FY
17
FY
18
FY
19
FY
20
FY
21
FY
22
FY
23
FY
24
FY
25
Total Country Demand Total Country Supply Gap
Page 75
Sui Northern Gas Pipelines Ltd. Ensuring the Indispensable Role of Gas Supply
PKR mn 2017A 2018E 2019F
Income Statement
Net Sales 346,308 506,291 884,410
Gross Profit 19,699 23,312 26,851
Distribution expenses 5,646 6,535 7,588
Administration expenses 6,426 7,597 8,985
Post Tax Profit 8,614 7,938 9,476
Balance Sheet
Shareholder's Equity 10,596 14,728 20,398
Interest Bearing Liabilities 55,723 91,283 163,033
Total Liabilities 313,591 357,522 482,011
Current Assets 157,105 162,816 211,298
Non-Current Assets 167,081 209,434 291,111
Total Assets 324,187 372,250 502,409
Source: Company Financials, AHL Research
Ratio Analysis Unit 2017A 2018E 2019F
Earnings PKR/Share 13.6 12.5 14.9
Dividend PKR/Share 6.0 6.0 6.0
Book Value PKR/Share 16.7 23.2 32.2
Price to Earning x 11.0 6.2 5.2
Price to Book x 8.9 3.3 2.4
Net Margins % 2.5 1.6 1.1
Dividend Yield % 4.0 7.7 7.7
Source: Company Financials, AHL Research
Exhibit: SNGP’s UFG over the years
Source: Company Financials, AHL Research
75
-
100,000
200,000
300,000
400,000
500,000
600,000
7.00%
7.50%
8.00%
8.50%
9.00%
9.50%
10.00%
10.50%
11.00%
11.50%
FY11 FY12 FY13 FY14 FY15 FY16 FY17
UFG Actual (MMCF) Total Gas Sales (MMCF) UFG Actual %
Page 76
Key Investment Theme:
Massive Rupee depreciation favorable for the sector: Textile exports constitute over 60% of
Pakistan’s total exports. In CY18TD, the PKR has depreciated by 20% against USD to PKR 139/USD,
which is set to have a significant impact on sector profitability and improve competitive position of the
entire textile sector. We have also witnessed a massive increase in price of cotton yarn and fabric by
35% YoY and 30% YoY resulting in higher gross margins. However, prices of ready-made garments
have so far remained depressed.
Increasing exports of value added products: Despite significant rupee devaluation, textile exports
exhibited weak performance during 4MFY19 (growth of 0.41% YoY). The decline in exports could be
attributable to lack of demand for yarn from China. Market sources suggest that diversion of textile
orders from China to Cambodia, Bangladesh, and Vietnam resulted in lower demand for Pakistani
yarn.
Incentives for exporters: The government is focused on pursuing a strategy to enhance exports by
providing maximum benefits to exporters. To encourage exports, the government extended export
rebate package for the next three years, reduced the cost of doing business by slashing custom /
regulatory duties and sales tax on imported input materials (cotton, polyester, fibers) as well as
promised concessionary gas prices for the 5 export oriented sectors. On the other hand, these sectors
have an advantage to avail borrowing on fixed interest rates like export refinance scheme at 3% and
long term finance facility at 6.0% which is lower than current discount rate of 10.5%.
Pakistan largest ever private sector IPO in the offing: Interloop (largest socks manufacturer
outside China with 90% exports) intends to issue 109mn shares at a floor price of PKR 45/share to
generate PKR 4.9bn in order to establish a hosiery division and set up a new denim plant. This
signals the importance of the stock exchange as a preferred choice for raising capital in the country.
Key Risks: Volatility in Cotton and Polyester prices.
Delay in refund payments.
Discontinuation of GSP+ Status.
Appreciation of PKR against USD can lead to exchange losses and margin attrition.
Textile CompositeRupee Devaluation To Make Exports Competitive
Exhibit: Primary Margins
Source: Company Financials, AHL Research
76
-
0.10
0.20
0.30
0.40
0.50
0.60
0.70
0.80
0.90
1.00
-
0.50
1.00
1.50
2.00
2.50
3.00
Jul-1
7
Aug-1
7
Sep-1
7
Oct-
17
No
v-1
7
De
c-1
7
Jan-1
8
Feb
-18
Ma
r-1
8
Apr-
18
Ma
y-1
8
Jun-1
8
Jul-1
8
Aug-1
8
Sep-1
8
Oct-
18
Yarn Price Cotton Price
Primary Margins (RHS)(USD/kg) (USD/kg)
Page 77
Key Investment Theme:
Escalating core income : We expect core earnings of the company to counterbalance decline in
non-core as we have revised down our dividend assumptions from DGKC and NPL. The rise in core
earnings can be attributable to i) higher margins on yarn and fabric, ii) export rebate package for the
next three years, iii) subsidized gas prices, and iv) significant PKR devaluation which will result in
exchange gains as we expect the PKR to close at 147/USD by end of FY19.
Subsidized gas price for exporters: To revive export oriented sectors, the incumbent government
announced a reduction in energy cost by setting uniorm gas price at PKR 600/mmbtu. We believe for
export oriented sector, NML would stand as a major beneficiary in the textile universe and we expect
this to translate into earnings of PKR 2.13/share, assuming change in gas price will be effective from
Dec’18-Jun’19.
Portfolio value : We value NML on SOTP where a major portion of valuation is sourced from portfolio
value. NML has diversified investments (Power, Cements, Banks, Construction, Textile, Insurance,
Dairy, Healthcare) and is now moving into the auto industry. The portfolio contributes 55% towards
the total estimated value of PKR 166/share.
PKR depreciation keeping profitability on track: We expect NML to post earning per share of PKR
17.0 / 20.6 / 22.9 in FY19 / FY20 / FY21 and with that, our SOTP based target price has been revised
upwards to PKR 172/share.
Key Risks: Delay in Refund Payment Orders.
Cessation of Export Incentive Package.
Rise in Cotton Price.
Target Price PKR 166.0
Market Price PKR 136.5
Upside % 21.6
PSX Code NML
Nishat Mills Ltd.Healthy Margins to Lead Core Income
77
Exhibit: Core & Non-Core Earnings
Source: Company Financials, AHL Research
10.7 8.5
3.6 5.0 3.9 3.5
9.7
5.9
7.1
7.5
9.0
8.2 8.2
7.3
-
4.0
8.0
12.0
16.0
20.0
FY13 FY14 FY15 FY16 FY17 FY18 FY19E
Core Earnings Non-Core EarningsPKR/Share
Page 78
PKR mn 2018A 2019E 2020F
Income Statement
Net Sales 53,729 63,672 67,693
Gross Profit 5,550 8,969 9,415
Other Income 4,103 3,269 4,642
Finance Cost 994 893 867
Post Tax Profit 4,097 5,986 7,259
Balance Sheet
Shareholder's Equity 75,713 77,682 82,479
Interest Bearing Liabilities 19,843 16,896 18,415
Total Liabilities 27,023 26,004 27,468
Current Assets 29,043 32,996 39,989
Non-Current Assets 73,693 70,681 69,950
Total Assets 102,736 103,678 109,939
Source: Company Financials, AHL Research
Ratio Analysis Unit 2018A 2019E 2020FEarnings PKR/Share 11.7 17.0 20.6
Dividend PKR/Share 6.0 7.0 7.0
Book Value PKR/Share 215.3 220.9 234.6
Price to Earning x 12.1 8.2 6.8
Price to Book x 0.7 0.6 0.6
Net Margins % 7.6 9.4 10.7
Dividend Yield % 4.3 5.0 5.0
Source: Company Financials, AHL Research
Exhibit: Portfolio Value
Source: Company Financials, AHL Research
78
Nishat Mills Ltd.Healthy Margins to Lead Core Income
Companies Holdings Portfolio Value
Nishat Power 51.0% 5,148
DG Khan Cement 31.4% 14,282
MCB 7.6% 17,383
Pakgen Power 27.6% 1,774
Nishat Chunian 13.6% 1,999
Adamjee Insurance 0.03% 5
Lalpir Power 28.8% 1,778
Others 3,945
Total Value of Investments 46,312
Total Value of Investments - PKR/Share 132
Discount Applied 30%
Contribution towards fair value - PKR/Share 92.2
Page 79
Engineering (Steel)Metal Rock Noise Yet to Die Down
Exhibit: Expected Capacity Additions
Source: Company Financials, AHL Research
79
Key Investment Theme:
Demand may shrivel temporarily: Current scenario hints that the domestic steel industry is set to
undergo a period of consolidation, similar to one the cement sector may experience. Peculiarly,
specifics remain identical as well; economic slowdown restricts demand for steel as buying power of
individuals contracts amid rising interest rates and slowing GDP.
Long term bets on demand translate into capacity expansion: That said, as a growing economy
Pakistan holds tremendous potential and in lieu of that, the domestic steel industry remains on course
to expand as various high level projects (construction of highways, railway tracks, dams, RLNG
pipelines etc.) utilize steel; ASTL, Mughal and ASL are key listed players undertaking expansion.
Pricing power derails: Relentless depreciation in the PKR against USD, re-imposition of US
sanctions on Iran and hence dumping from the latter, riddance of Russian steel at tremendously
competitive prices together with risk of export substitution by China in the midst of potential economic
slowdown going forward, as well as excess capacity within the country will continue to upend the
pricing power of local steel players.
Margins wearing away: Although international steel prices have recently maintained the firm
upsurge, unclear demand outlook in the local market tagged with unfair competition from dumped and
smuggled steel products has waned off margins. Moreover, with the Pak Rupee expected to lose
further ground against the Greenback, imported raw material costs will continue to dilute margins and
hence, profitability would witness retribution.
Materialization of Housing scheme: With initial application process for PM’s Naya Pakistan housing
scheme concluding by 21st Dec’18 and the incumbent government indicating manifestation soon, we
believe this remains a key upside and forecast potential demand for rebars from construction of 100sq
yards single story 250,000 houses per annum at 1.25mn tons.
Key Risks: Steel margins are exposed to international volatility given swings in prices of scrap and other raw
materials, as well as end product prices which dictates competition from imports.
Capacity addition by new players can erode market share and potentially compel price cuts.
-
200,000
400,000
600,000
800,000
1,000,000
1,200,000
1,400,000
1,600,000
2018 2019 2018 2019 2018 2019 2018 2019
CRC Galvanised Billets Rebars
ISL ASL Mughal ASTL
Page 80
Key Investment Theme:
Volumes to remain robust despite lack of clarity on demand growth: ASTL’s primary focal point
has always been the quality assurance of its rebars. Although domestic demand seems to have hit
some roadblocks as several housing schemes have been halted and construction of high rises in
Karachi was banned until a day back, in addition to slowdown in the economy, volumes of the
company are expected to grow as they continue to convince customers to opt for premium quality. We
project volumes to display a 3-Yr CAGR of 42% to 495k tons (FY18: 172k tons).
Expansion to a million ton giant: The company plans to become the first million ton rebar facility of
the country. In order to achieve said status, ASTL has expressed desire to invest another PKR 6.5bn
for a new 500k tons per annum rolling mill, subject to financial closure. Given the plant construction
will take up to 3 years, we have assumed operations to commence in FY23. Albeit, utilization will
remain low in the first year post COD as i) the company will not have enough capacity to manufacture
billets, and ii) it takes time to realize economies of wide scale production.
No longer dictating prices: Unlike last year, ASTL has gradually come under pressure whereby its
margins have been receding sequentially. In particular, persistent depreciation of the Pak Rupee
against the USD has not only augmented imported raw material costs, fierce competition in North and
smuggling from Iran in South has also diluted the company’s mighty pricing power. In consideration of
this, we believe margins may average at 12% between FY19-FY23 vs. 18% in the preceding 5 years.
Albeit, the company continues to enjoy superior margins vis-à-vis competitors.
Valuations open up as stock market took a beating: Having incorporated the above, we have
arrived at a DCF-based Dec’19 target price of PKR 69/share, offering an upside of 31% from current
levels.
Key Risks: Delay in expansion blueprint would alter forward earnings and target price of the company.
Market penetration by new players and capacity expansion by existing players can squeeze market
share and build pressure on margins as pricing power wanes off.
Target Price PKR 68.8
Market Price PKR 52.0
Upside % 32.3
PSX Code ASTL
Exhibit: Bottom-line Growth Robust Inspite of Weaker Margins
Source: Company Financials, AHL Research
80
0%
2%
4%
6%
8%
10%
12%
14%
16%
18%
20%
-
1,000
2,000
3,000
4,000
5,000
6,000
7,000
8,000
FY
18
A
FY
19
E
FY
20
F
FY
21
F
FY
22
F
FY
23F
Gross Profit Net Profit GP Margin (RHS) NP Margin (RHS)
Amreli Steels Ltd.Dreaming of Million Tons
Page 81
Amreli Steels Ltd.Dreaming of Million Tons
PKR mn 2018A 2019E 2020FIncome Statement
Net Sales 15,501 32,789 45,481
Gross Profit 2,758 4,687 5,482
Distribution expenses 378 705 851
Administration expenses 409 550 664
Post Tax Profit 1,585 1,790 1,994
Balance Sheet
Shareholder's Equity 12,880 14,016 14,822
Interest Bearing Liabilities 10,033 8,089 8,074
Total Liabilities 13,763 13,137 13,908
Current Assets 10,935 12,463 13,454
Non-Current Assets 15,707 14,691 15,276
Total Assets 26,643 27,153 28,730
Source: Company Financials, AHL Research
Ratio Analysis Unit 2018A 2019E 2020FEarnings PKR/Share 5.3 6.0 6.7
Dividend PKR/Share 2.2 4.0 4.5
Book Value PKR/Share 43.4 47.2 49.9
Price to Earning x 13.2 8.7 7.8
Price to Book x 1.6 1.1 1.0
Net Margins % 10.2 5.5 4.4
Dividend Yield % 3.1 7.7 8.7
Source: Company Financials, AHL Research
Exhibit: Sales to Grow Despite Economic Slow Down
Source: Company Financials, AHL Research
81
0%
10%
20%
30%
40%
50%
60%
70%
80%
90%
-
200,000
400,000
600,000
800,000
1,000,000
1,200,000
FY
18A
FY
19E
FY
20F
FY
21F
FY
22F
FY
23F
Sales Volume Capacity Capacity Utlization (RHS)
Page 82
Key Investment Theme:
Macro pressure to dent volumes: To take control of the current economic situation, the government
has taken various steps like i) increase in regulatory duty on imported products, ii) increase in interest
rates by 425bps to 10.0% in CY18TD, iii) PKR depreciated by 20% in CYTD to encourage exporters
and discourage importers. Albeit, in the immediate year this will result in GDP slowdown which is
expected amid decline in large scale manufacturing and lower production from important crops.
During 5MFY19, total car sales clocked-in at 100,643 units, down by 4% YoY mainly amid ban on
non-filers to purchase new cars. We expect industry car sales to fall by 10% YoY to 233K units.
PKR depreciation eroding gross margins: Despite increase in car prices by an average of 10-15%,
gross margins of the sector tumbled and as a result, sector profitability plunged by 20%. The pressure
on gross margins stemmed from i) Higher steel prices (+4% YoY to USD 704/ton), ii) Increase in
regulatory duty on raw materials, and iii) PKR depreciation of 20% in CY18TD against USD. We
anticipate companies to take a hit of rupee depreciation as price pass on will not be easy for existing
players in current circumstances.
Better pricing power for new entrants: We expect new players (KIA & Hyundai) to start operations
by early CY20 and we believe new players will grab market share of existing players as they will have
better pricing power given significant duty concession available to new players as per Auto Policy
2016-21.
Profitability faces stiff challenges: Currently, sustainability of margins and profitability remains
challenging, despite existing players gearing up to keep volumetric growth intact by planning to launch
new cars like Suzuki Alto, Toyota Corolla (12th Generation), and Honda Brio. We maintain ‘BUY’
stance on INDU and HCAR whereas we have revised our stance on PSMC to ‘Sell’.
Key Risks: Volatility in USD and JPY.
Delay in introduction of new cars by existing players or new players grabbing market share.
Unexpected movement in steel price.
Automobile AssemblersSpeed Breaker Ahead
Exhibit: Currency Depreciation
Source: Company Financials, AHL Research
82
105 105 105 105 105 107
112
117
124
102
110
114
111 111 113
108 109
112
-20%
-15%
-10%
-5%
0%
5%
10%
15%
20%
95
100
105
110
115
120
125
130
1Q
FY
17
2Q
FY
17
3Q
FY
17
4Q
FY
17
1Q
FY
18
2Q
FY
18
3Q
FY
18
4Q
FY
18
1Q
FY
19
PKR/USD JPY/USD
PKR Depreciation YoY JPY Depreciation YoY
Page 83
Key Investment Theme:
Change in sales mix: During 5MFY19, the company managed to increase its volumetric sales by 7%
YoY to 27,307 units due to fulfilment of previously booked orders of Corolla (up by 10% YoY). We
expect Corolla sales to remain constant while Fortuner and Hilux sales may drop by 30% and 20%
YoY, respectively post election year phenomenon. On the other hand, latter half would be more
crucial for OEM’s given ban on non-filers, depreciation of PKR against USD and impact of interest
rate hikes.
Depreciation risk to overcome: After multiple rounds of devaluation during the year, the company
easily passed on the impact of higher input cost. However, despite the company holding a strong
presence in the market with robust demand of its flagship (Corolla), we believe it will not be able to
completely pass on prices of rise in input cost and would have to bear the brunt of currency
depreciation.
Capacity expansion: The management of the company approved a capital expenditure of PKR 3.3bn
to enhance its production capacity from 65,000 units to 76,000 units on double shift basis which is
expected to yield benefits during FY20-21. During FY19, we expect capacity utilization level of the
company to remain above 90%.
Lower multiple compared to peers: The stock is currently trading at FY19F PE of 7.9x compared
with industry PER of 8.7x along with highest dividend yield of 10.7% in automobile assemblers sector.
Key Risks: Depreciation of PKR / USD and PKR / JPY.
Sharp increase in steel prices will significantly impact the company’s bottom-line.
Arrival of new players might dilute market share.
Target Price PKR 1,364.6
Market Price PKR 1,184.9
Upside % 15.2
PSX Code INDU
Indus Motor Company Ltd.Margins Sustainability; A Key Challenge
Exhibit: Total Car Sales Break-up
Source: Company Financials, AHL Research
83
-
10,000
20,000
30,000
40,000
50,000
60,000
70,000
FY15 FY16 FY17 FY18 FY19E
Corolla Fortuner Hilux(Units)
Page 84
Indus Motor Company Ltd.Margins Sustainability; A Key Challenge
PKR mn 2018A 2019E 2020F
Income Statement
Net Sales 140,208 144,182 149,581
Gross Profit 24,377 17,524 17,704
Other Income 3,901 4,081 4,620
Finance Cost 572 696 607
Post Tax Profit 15,772 11,638 12,266
Balance Sheet
Shareholder's Equity 36,744 40,119 43,740
Advances from customers 27,491 19,789 19,709
Total Liabilities 45,183 39,657 40,710
Current Assets 74,543 71,707 76,263
Non-Current Assets 7,384 8,069 8,187
Total Assets 81,927 79,776 84,450
Source: Company Financials, AHL Research
Ratio Analysis Unit 2018A 2019E 2020FEarnings PKR/Share 200.7 148.1 156.1
Dividend PKR/Share 140.0 105.0 110.0
Book Value PKR/Share 467.5 510.4 556.5
Price to Earning x 7.1 8.0 7.6
Price to Book x 3.0 2.3 2.1
Net Margins % 11.2 8.1 8.2
Dividend Yield % 9.8 8.9 9.3
Source: Company Financials, AHL Research
Exhibit: Sales Vs Gross Profit Margins
Source: Company Financials, AHL Research
84
109112
140144
150
10%
12%
14%
16%
18%
20%
80
100
120
140
160
180
FY
16
FY
17
FY
18
FY
19E
FY
20F
Sales Gross Profit(PKR bn)
Page 85
Chemical SectorPKR Depreciation to Bode Well Margins
Exhibit: Gross Margins & Profit after tax
Source: Company Financials,, AHL Research
85
Key Investment Theme:
PKR depreciation to bode well for margins: The pricing of chemicals is denominated in US dollar,
therefore PKR depreciation will be beneficial for the chemical sector.
Economic slowdown; lower impact on local industry: We forecast 4% GDP growth in 2019. The
slowdown in growth will however not have any particularly dampening effects on the local industry’s
production. This is because of the fact that local production is not enough to fulfill the country’s
demand. Pakistan imports approximately ~112tons of PVC (36% of total demand) and ~235tons of
PTA (~32% of total demand).
Better margins are expected in 2019: 2018 told a story of good fortunes for the petrochemical
industry, as despite higher oil prices, margins did not show significant downturn. International PTA
and PSF margins increased by 54% and 0.4% YoY, respectively. However, international margins of
PVC declined by 5.1% YoY. In the upcoming year (2019), we expect better margins due to growing
demand and lower expected oil prices (vis-à-vis current prices). Additionally, further PKR depreciation
will also have a positive bearing on the profitability of the sector.
Key Risks: Lower than expected PKR depreciation.
Lower international Petrochemical margins.
Higher than expected increase in gas prices.
20.0%
22.0%
24.0%
26.0%
28.0%
30.0%
1,500
2,000
2,500
3,000
3,500
4,000
De
c-1
6
Ma
r-1
7
Jun-1
7
Sep-1
7
De
c-1
7
Ma
r-1
8
Jun-1
8
Sep-1
8
Profit after Tax Gross Margins(PKR mn)
Page 86
Key Investment Theme:
Growing demand; capacity addition can not be ruled out: Local demand of PTA has reached
700k tons per annum and is expected to grow to 735k tons in 2019. The improved power availability
and anti-dumping on Polyester Staple Fiber (PSF) has aided the domestic demand. We believe as
demand picks up, capacity addition by LOTCHEM can not be ruled out.
Long-term PTA margin at USD 140/ton: Currently, PTA margins are hovering around USD 180/ton.
We expected the average margins will settle at USD 140/ton going forward. Strong polyester demand
along with short supply in the region will keep the PTA prices stable, we view.
Leverage free company: The company has zero debt and PKR 8,425mnof cash on its balance
sheet (as of Sep’18). Therefore, the rising interest rate environment will be beneficial for the company.
Surplus power sale may potentially add ~PKR 0.20/share: K-Electric has entered in to a Power
Acquisition Contract (PAC) with Lotte Chemical Pakistan Ltd to procure 11MW to 14MW power
(11MW based on natural gas and 3MW if RLNG will be available) on take and pay basis for 5 years. If
this materializes, it will positively impact the company’s bottom line by PKR ~0.20/share. However, we
have not incorporated this in our financial model yet.
Key Risks: Higher than expected increase in gas prices.
Change in duty structure (currently 5% custom duty is charged on import of PTA).
Lower than expected PKR depreciation.
Lower international PTA margins.
Lotte Chemical Pakistan LimitedMargins Galore
86
Target Price PKR 25.3
Market Price PKR 18.4
Upside % 37.6
PSX Code LOTCHEM
Source: AHL Research, * 2019F
EPS* (PKR) TP (Dec-19)
PTA margins @ USD 100/ton 0.76 14.32
PTA margins @ USD 110/ton 1.12 17.19
PTA margins @ USD 120/ton 1.46 19.95
PTA margins @ USD 130/ton 1.79 22.64
PTA margins @ USD 140/ton* 2.13 25.34
PTA margins @ USD 150/ton 2.49 28.29
PTA margins @ USD 160/ton 2.83 30.99
PTA margins @ USD 170/ton 3.19 33.88
PTA margins @ USD 180/ton 3.55 36.77
Exhibit: Sensitivity Analysis
Page 87
PKR mn 2017A 2018E 2019F
Income Statement
Sales 37,034 56,123 53,430
Cost of Sales 35,837 47,572 48,180
Gross Profit 1,198 8,552 5,250
Post Before Profit 895 7,278 4,606
Post Tax Profit 412 4,877 3,224
Balance Sheet
Shareholder's Equity 10,677 13,282 14,841
Current Liabilities 9,766 8,933 8,512
Trade and other payables 9,598 8,764 8,344
Non-Current Liabilities 98 100 99
Current Assets 13,152 15,105 16,419
Non-Current Assets 7,389 7,210 7,033
Source: Company Financials, AHL Research
Ratio Analysis Unit 2017A 2018E 2019FEarnings PKR/Share 0.3 3.2 2.1
Dividend PKR/Share 0.2 1.5 1.0
Book value PKR/Share 7.1 8.8 9.8
Price to Earning x 26.3 5.7 8.7
Price to Book x 1.0 2.1 1.9
Gross Margins % 3.2 15.2 9.8
Dividend Yield % 2.8 8.1 5.4
Source: Company Financials, AHL Research
87
Lotte Chemical Pakistan LimitedMargins Galore
Exhibit: Gross Profit & International PTA Margins
Source: Company Financials, AHL Research
80
105
130
155
180
-
1,500
3,000
4,500
6,000
7,500
9,000
CY16A CY17A CY18F CY19F CY20F
Gross profit
PTA Margins - International (RHS)USD/ton(PKR mn)
Page 88
88
AHL Universe - Recommendation Summary
88
Code CompanyPrice Target Price
(Dec-19)Upside (%) Stance
EPS (PKR) DPS (PKR) P/E (x) Div. Yield (%) P/B (x) ROE (%)
7-Dec-18 2018 2019 2020 2018 2019 2020 2019 2020 2019 2020 2019 2020 2019 2020
Exploration & Production
PPL Pakistan Petroleum Ltd. 162.5 213.6 31.5 Buy 20.1 25.0 27.9 5.50 12.00 14.00 6.5 5.8 7.4 8.6 1.3 1.2 22.1 21.9
OGDC Oil and Gas Dev Co. 140.3 196.8 40.3 Buy 18.3 25.5 27.5 10.00 13.00 13.75 5.5 5.1 9.3 9.8 1.0 0.9 18.9 18.3
POL Pakistan Oilfields Ltd. 463.1 593.0 28.1 Buy 40.1 58.5 65.4 42.50 56.00 64.00 7.9 7.1 12.1 13.8 3.7 3.6 48.7 51.2
MARI Mari Petroleum Ltd 1,325.3 1,983.6 49.7 Buy 126.8 185.7 226.1 6.00 5.75 6.00 7.1 5.9 0.4 0.5 2.6 1.8 44.0 36.3
Commercial Banks
UBL United Bank Ltd.** 140.0 170.8 22.0 Buy 10.7 20.6 28.4 10.00 12.00 16.00 6.8 4.9 8.6 11.4 0.9 0.8 14.0 17.9
BAFL Bank Alfalah Ltd.** 48.6 60.1 23.5 Buy 6.8 9.2 9.9 2.03 3.00 5.00 5.3 4.9 6.2 10.3 0.9 0.9 19.2 18.3
MCB MCB Bank Ltd.** 197.4 230.0 16.5 Buy 15.5 23.1 32.3 16.00 17.00 24.00 8.6 6.1 8.6 12.2 1.5 1.4 17.6 23.5
HBL Habib Bank Ltd.** 132.5 155.2 17.1 Buy 9.5 16.5 20.7 4.00 8.00 12.00 8.0 6.4 6.0 9.1 0.9 0.9 11.9 14.0
ABL Allied Bank Ltd.** 96.0 118.5 23.4 Buy 11.7 14.4 17.9 8.00 8.00 9.00 6.7 5.4 8.3 9.4 0.9 0.9 14.2 16.7
NBP National Bank of Pakistan.** 47.0 54.3 15.6 Buy 9.7 (3.5) 16.2 - - 5.00 (13.4) 2.9 - 10.6 0.5 0.5 (3.9) 17.4
AKBL Askari Bank Ltd.** 24.9 28.4 13.9 Buy 3.9 4.9 6.1 1.00 1.00 2.00 5.1 4.1 4.0 8.0 0.8 0.7 16.0 17.7
BOP The Bank of Punjab** 12.9 18.3 41.6 Buy 2.8 3.9 4.1 - - - 3.4 3.1 - - 0.7 0.6 24.0 20.7
Fertilizer
ENGRO Engro Corporation** 299.5 359.6 20.1 Buy 25.3 37.5 44.1 26.00 24.00 28.00 8.0 6.8 8.0 9.3 0.8 0.8 10.8 11.7
FFBL Fauji Fert. Bin Qasim 37.7 43.5 15.4 Buy 2.0 3.7 4.7 1.00 2.00 3.00 10.2 8.0 5.3 8.0 2.2 2.0 23.1 26.6
EFERT Engro Fertilizer 74.2 91.0 22.6 Buy 11.8 12.1 12.1 11.00 11.50 11.50 6.1 6.1 15.5 15.5 2.2 2.2 36.8 36.1
FFC Fauji Fertilizer Co. 94.3 113.8 20.7 Buy 10.3 12.3 13.9 9.00 11.00 13.00 7.7 6.8 11.7 13.8 3.7 3.5 49.2 53.4
FATIMA Fatima Fertilizer Co.* 34.2 NC na na na na na na na na na na na na na na na na
AHCL Arif Habib Corp. Ltd.* 28.8 NC na na 1.8 na na 2.00 na na na na na na na na na na
Cement
LUCK Lucky Cement Ltd. 469.6 586.5 24.9 Buy 37.7 32.8 30.8 13.00 11.00 11.00 14.3 15.3 2.3 2.3 1.6 1.5 11.8 10.4
FCCL Fauji Cement Company 22.7 25.3 11.7 Buy 2.5 2.5 2.7 2.00 1.00 1.00 9.0 8.3 4.4 4.4 1.4 1.3 16.2 16.1
ACPL Attock Cement Ltd. 119.7 140.6 17.5 Buy 32.0 13.4 16.5 8.00 7.00 8.00 8.9 7.3 5.8 6.7 1.0 1.0 12.0 13.9
DGKC D.G. Khan Cement Co. 89.7 112.7 25.6 Buy 20.2 7.4 9.2 4.25 3.00 3.50 12.1 9.7 3.3 3.9 0.5 0.5 4.2 5.0
KOHC Kohat Cement Company 88.2 111.0 25.9 Buy 14.8 10.4 11.4 5.00 4.00 4.00 8.4 7.7 4.5 4.5 0.9 0.9 11.3 11.4
MLCF Maple Leaf Cement 44.2 55.1 24.5 Buy 7.7 4.4 5.0 2.50 3.00 3.00 10.1 8.9 6.8 6.8 1.0 0.9 9.7 10.6
POWER Power Cement* 7.5 NC na na 0.3 na na - na na na na na na na na na na
Oil & Gas Marketing
PSO Pakistan State Oil 235.2 314.5 33.7 Buy 39.5 31.3 35.7 15.00 20.00 25.00 7.5 6.6 8.5 10.6 0.8 0.8 10.8 11.9
APL Attock Petroleum Ltd. 413.3 509.1 23.2 Buy 56.8 58.8 62.5 33.20 35.00 37.50 7.0 6.6 8.5 9.1 2.0 1.8 29.7 28.0
SNGP Sui Northern Gas Pipeline Ltd. 77.5 96.2 24.1 Buy 12.5 14.9 14.7 6.00 6.00 6.00 5.2 5.3 7.7 7.7 2.4 1.9 49.7 49.7
Automobile Assembler
PSMC Pak Suzuki Motor Co. 206.1 158.8 (23.0) Sell 20.8 14.8 14.8 9.00 6.00 6.00 13.9 13.9 2.9 2.9 0.5 0.5 3.9 3.9
INDU Indus Motor Company 1,184.9 1,364.6 15.2 Buy 200.7 148.1 156.1 140.00 105.00 110.00 8.0 7.6 8.9 9.3 2.3 2.1 30.3 29.3
HCAR Honda Atlas Cars (Pak) Ltd. 192.1 206.8 7.7 Hold 45.5 22.9 20.8 26.93 9.00 8.00 8.4 9.2 4.7 4.2 1.4 1.3 18.1 14.9
MTL Millat Tractors Ltd. 904.9 1,017.0 12.4 Buy 120.4 94.7 112.1 120.00 95.00 110.00 9.6 8.1 10.5 12.2 7.1 7.0 74.3 87.3
Power Generation & Distribution
HUBC Hub Power Company*** 90.2 115.5 35.8 Buy 9.6 12.8 18.0 7.40 6.00 6.75 7.0 5.0 6.7 7.5 2.1 1.6 33.0 35.6
NCPL Nishat Chu. Power Ltd.*** 24.5 27.8 23.6 Buy 9.3 12.7 11.0 1.50 2.50 2.50 1.9 2.2 10.2 10.2 0.6 0.5 33.1 23.0
NPL Nishat Power Limited*** 26.8 32.5 30.6 Buy 9.1 9.9 11.8 1.50 2.25 3.00 2.7 2.3 8.4 11.2 0.5 0.4 19.7 20.2
KAPCO Kot Addu Power Co. *** 50.8 64.0 44.6 Buy 12.1 11.6 18.3 9.15 9.50 9.75 4.4 2.8 18.7 19.2 1.2 1.0 28.4 39.6
Textile Composite
NML Nishat Mills Ltd. 136.5 166.0 21.6 Buy 11.7 17.0 20.6 4.75 7.00 8.50 8.0 6.6 5.1 6.2 0.6 0.6 7.8 9.1
NCL Nishat (Chunian) Ltd. 51.9 67.7 30.4 Buy 9.8 11.4 9.3 4.00 3.00 3.50 4.6 5.6 5.8 6.7 0.8 0.7 18.7 13.8
FML Feroze1888 Mills Ltd. 86.5 90.9 5.1 Hold 7.3 10.0 10.07 3.65 5.00 5.00 8.6 8.6 5.8 5.8 1.8 1.6 22.1 19.9
Chemicals
LOTCHEM Lotte Chemical Pak Ltd. 18.4 25.3 37.6 Buy 3.2 2.1 3.22 1.50 1.00 1.50 8.6 5.7 5.4 8.1 1.9 1.6 22.9 30.3
EPCL Engro Polymer & Chem. 36.8 Coverage Restricted
Engineering
ASTL Amreli Steels Ltd. 52.0 68.8 32.3 Buy 5.34 6.03 6.71 2.20 4.00 4.50 8.6 7.7 7.7 8.7 1.1 1.0 13.3 13.8
Source: Bloomberg, AHL Research, * Group Company: No estimates are given, **Earning Consolidated Basis, *** Upside is Total Return
Page 89
89
List of Abbreviation
89
1H First Half FIPI Foreign Investor Portfolio Investment NIM Net Interest Margins
1Q First Quarter FM Frontier Markets NIR Net International Reserve
9M 9 months FMCGs Fast Moving Consumer Goods NPL Non Performaning Loans
ADB Asian Development Bank FO Furnace Oil NYSDFS New York State Department of Financial Services
ADIP Auto Industry Development Policy FTSE Financial Times Stock Exchange O&M Operations & Maintance
ADR Advances Deposit Ratio FX Foreign Exchange Reserves OMCs Oil Marketing Companies
AHL Arif Habib Limited FYTD Fiscal year to date OMO Open Market Operation
APCMA All Pakistan Cement Manufacturers Association FY Fiscal Year OPEC Oil Producing and Exporting Countries
bn Billion GBP Great Britain Pound p.a. Per annum
bbl Barrel GDPg GDP growth PAT Profit After Tax
BEER Bond Equity Equivalent Ratio GDP Gross Domestic Product PBS Pakistan Bureau of Statistic
BoE Barrels of Oil Equivalent GENCOs Power Generation Companies PBV Price to Book Value
bpd barrels per day GIDC Gas Infrastructure Development Cess PE Price Earning
BOP Balance of Payment Gov't Government PER Price Earning Ratio
CAGR Compounded Annual Growth Rate GoP Government of Pakistan PIB Pakistan Investment Bonds
CAR Capital Adequacy Ratio GSP Generalised Scheme of Preferences PKR Pakistan Rupee
CASA Current Account Saving Account GST General Sales Tax PMLN Pakistan Muslim League Nawaz
CAD Current Account Deficit HSD High Speed Diesel PMLQ Pakistan Muslim League Quaid-e-Azam
CKD Complete Knock Down ICH International Clearing House POL Petroleum Products Prices
CNG Compressed Natural Gas ICT Information & Communications Technology PP Petroleum Policy
CNY Chinese Yuan IDR Investment Deposit Ratio PPP Pakistan Peoples Party
COD Commercial Operations Date IFC International Finance Corporation PPA Power Purchase Agreement
CPEC China Pakistan Economic Corridor IMF International Monetary Fund PR Policy Rate
CPI Consumer Price Index IPPs Independent Power Producers PSDP Public Sector Development Program
CSF Coalition Support Fund JPY Japanese Yen PSX Pakistan Stock Exchange
CYTD Calendar year to date KSE Karachi Stock Exchange PTI Pakistan Tahreek-e-Insaf
CY Calendar Year LHS Left hand side RDs Regulatory Duties
DAP Di-ammonium Phosphate LNG Liquified Natural Gas REER Real Effective Exchange Rate
DCF Discounted Cash Flow LPS Loss Per Share RGDP Real Gross Domestic Product
DPS Dividend Per Share LSM Large Scale Manufacturing RHS Right hand side
DR Discount rate LTFF Long Term Financing Facility RLNG Re-gassified Liquified Natural Gas
DY Dividend Yield mn Million ROA Return on Assets
E&P Exploration & Production mb/d Million barrels per day ROE Return on Equity
EBITDA Earning Before Interest, Taxes & Amortization ME March End SBP State Bank of Pakistan
ECC Economic Coordination Committee mmbtu Metric Million British Thermal Unit SECMC Sindh Engro Coal Mining Company
EFF Extended Fund Facility mmcfd Million Cubic Feet Per Day SME Small Medium Enterprises
EGrow Earning Growth MPC Monetary Policy Committee SoTP Sum of the parts
EM Emerging Markets MQM Mutahida Quomi Movement SPLY Same period last year
EPS Earrings Per Share MS Motor Spirit TD To Date
EU European Union MSCI Morgan Stanley Composite Index T&D Transmission & Distribution
EV Enterprise Value MW Mega Watts TPA Tonnes Per Annum
Ex Excluding NCCPL National Clearing Company of Pakistan Limited USD US Dollar
FATF Financial Action Task Force NEPRA National Electric Power Regulatory Authority WAPDA Water & Power Development Authority
FDI Foreign Direct Investment NII Net Interest Income YTD Year-to-date
Page 90
90
Disclaimer
90
Analyst Certification: The research analyst(s) is (are) principally responsible for preparation of this report. The views expressed in this research report accurately reflect the personal views of the analyst(s) about the subject security (ies) or sector
(or economy), and no part of the compensation of the research analyst(s) was, is, or will be directly or indirectly related to the specific recommendations and views expressed by research analyst(s) in this report. In addition, we currently do not have
any interest (financial or otherwise) in the subject security (ies). Furthermore, compensation of the Analyst(s) is not determined nor based on any other service(s) that AHL is offering. Analyst(s) are not subject to the supervision or control of any
employee of AHL’s non-research departments, and no personal engaged in providing non-research services have any influence or control over the compensatory evaluation of the Analyst(s).
Equity Research Ratings
Arif Habib Limited (AHL) uses three rating categories, depending upon return form current market price, with Target period as Dec’19 for Target Price. In addition, return excludes all type of taxes. For more details kindly refer the following table;
Rating Description
BUY Upside* of subject security(ies) is more than +10% from last closing of market price(s)
HOLD Upside* of subject security(ies) is between -10% and +10% from last closing of market price(s)
SELL Upside* of subject security(ies) is less than -10% from last closing of market price(s)
Equity Valuation Methodology
AHL Research uses the following valuation technique(s) to arrive at the period end target prices;
Discounted Cash Flow (DCF)
Dividend Discounted Model (DDM)
Sum of the Parts (SoTP)
Justified Price to Book (JPTB)
Reserved Base Valuation (RBV)
Risks
The following risks may potentially impact our valuations of subject security (ies);
Market risk
Interest Rate Risk
Exchange Rate (Currency) Risk
Page 91
91
Disclaimer
91
This document has been prepared by Research analysts at Arif Habib Limited (AHL). This document does not constitute an offer or solicitation for the purchase or sale of any security. This publication is intended only for distribution to the clients of the
Company who are assumed to be reasonably sophisticated investors that understand the risks involved in investing in equity securities. The information contained herein is based upon publicly available data and sources believed to be reliable. While
every care was taken to ensure accuracy and objectivity, AHL does not represent that it is accurate or complete and it should not be relied on as such. In particular, the report takes no account of the investment objectives, financial situation and
particular needs of investors. The information given in this document is as of the date of this report and there can be no assurance that future results or events will be consistent with this information. This information is subject to change without any
prior notice. AHL reserves the right to make modifications and alterations to this statement as may be required from time to time. However, AHL is under no obligation to update or keep the information current. AHL is committed to providing
independent and transparent recommendation to its client and would be happy to provide any information in response to specific client queries. Past performance is not necessarily a guide to future performance. This document is provided for
assistance only and is not intended to be and must not alone be taken as the basis for any investment decision. The user assumes the entire risk of any use made of this information. Each recipient of this document should make such investigation as it
deems necessary to arrive at an independent evaluation of an investment in the securities of companies referred to in this document (including the merits and risks involved), and should consult his or her own advisors to determine the merits and risks
of such investment. AHL or any of its affiliates shall not be in any way responsible for any loss or damage that may be arise to any person from any inadvertent error in the information contained in this report.
© 2018 Arif Habib Limited: Corporate Member of the Pakistan Stock Exchanges. No part of this publication may be copied, reproduced, stored or disseminated in any form or by any means without the prior written consent of Arif Habib Limited.
Please remove the below footer.
Disclosure required under Research Analyst Regulations, 2015:
In order to avoid any conflict of interest, we hereby disclose that; Arif Habib Limited (AHL) has shareholding in NBP, NCL, SNGP, BOP.
For U.S. persons only: This research report is a product of Arif Habib Limited (“Arif Habib”), which is the employer of the research analyst(s) who has prepared the research report. The research analyst(s) preparing the research report is/are resident outside the UnitedStates (U.S.) and are not associated persons of any U.S. regulated broker-dealer and therefore the analyst(s) is/are not subject to supervision by a U.S. broker-dealer, and is/are not required to satisfy the regulatory licensing requirements of FINRA or required to otherwisecomply with U.S. rules or regulations regarding, among other things, communications with a subject company, public appearances and trading securities held by a research analyst account.This report is intended for distribution by Arif Habib Limited only to "Major Institutional Investors" as defined by Rule 15a-6(b)(4) of the U.S. Securities and Exchange Act, 1934 (the Exchange Act) and interpretations thereof by U.S. Securities and Exchange Commission (SEC)in reliance on Rule 15a 6(a)(2). If the recipient of this report is not a Major Institutional Investor as specified above, then it should not act upon this report and return the same to the sender. Further, this report may not be copied, duplicated and/or transmitted onward toany U.S. person, which is not the Major Institutional Investor.In reliance on the exemption from registration provided by Rule 15a-6 of the Exchange Act and interpretations thereof by the SEC in order to conduct certain business with Major Institutional Investors, Arif Habib Limited has entered into an agreement with a U.S. registeredbroker-dealer, Marco Polo Securities Inc. ("Marco Polo"). Transactions in securities discussed in this research report should be effected through Marco Polo or another U.S. registered broker dealer.
Page 92
92
Contact Information
92
Shahid Ali Habib Chief Executive Officer [email protected] +92 -21-3240-1930
Research Team
Samiullah Tariq Director Research & Business Development [email protected] +92-21-3246-2742
Tahir Abbas VP- Deputy Head of Research [email protected] +92-21-3246-2589
Rao Aamir Ali AVP- Investment Analyst [email protected] +92-21-3246-2589
Misha Zahid Investment Analyst [email protected] +92-21-3246-1106
Arsalan M. Hanif Investment Analyst [email protected] +92-21-3246-1106
Faizan Kamran Investment Analyst [email protected] +92-21-3246-1106
Muhammad Iqbal Jawaid Investment Analyst [email protected] +92-21-3246-1106
Aziz Jawaid Haidery Manager Database [email protected] +92-21-3246-1106
Muhammad Tabrez Officer Database [email protected] +92-21-3246-1106
Equities Sales Team
Saad Bin Ahmed Head of Sales [email protected] +92-21-3246-0757
Bilal Khan Director – Head of International Sales [email protected] +92-21-3246-5894
Usman Taufiq Ahmed VP- International Sales [email protected] +92-21-3246-8285
M. Yousuf Ahmed SVP- Equity Sales [email protected] +92-21-3242-7050
Syed Farhan Karim VP- Equity Sales [email protected] +92-21-3244-6255
Farhan Mansoori VP- Equity Sales [email protected] +92-21-3242-9644
Afshan Aamir VP- Equity Sales [email protected] +92-21-3244-6256
Furqan Aslam VP- Equity Sales [email protected] +92-21-3240-1932
Adeel Ahmed VP-Head of Online [email protected] +92-21-3246-0045